


- Study on the performance and mechanism of Cu(II) adsorption by porous ceramics prepared from tailings
Tong Zhanga, Shaofeng Zhua,*, Guangsheng Feib and Yuanhang Mab
aDepartment of Materials and Chemical Engineering, Anhui Jianzhu University, 230022, China
bAnhui Herui Safety Technology Consulting Co. LTD, 230031, ChinaThis article is an open access article distributed under the terms of the Creative Commons Attribution Non-Commercial License (http://creativecommons.org/licenses/by-nc/4.0) which permits unrestricted non-commercial use, distribution, and reproduction in any medium, provided the original work is properly cited.
In this study, industrial waste tailings were used as the main raw material to prepare porous ceramic by injection molding. The porous ceramic samples were surface treated by γ-Aminopropyl triethoxysilane solution to be used as adsorbent to remove Cu(II) from solution. The effects of sintering technology on properties of porous ceramic samples were studied. Meanwhile, the effects of test conditions on the adsorption characteristics of samples were also studied. The samples were analyzed by X-ray diffraction, FTIR, and SEM. Atomic absorption spectrophotometer was used to determine the changes of Cu(II) concentration in the aqueous solution before and after adsorption. The results show that the compressive strength of the samples is increased with the increase of sintered temperature and extension of holding time. The average pore diameters of the samples are decreased and concentrated between 0.1 and 0.2mm with the increase of sintered temperature. The removal rates and the adsorption capacities of the samples to Cu(Ⅱ) are increased with the increase of solution temperature, increase of pH value of the solution and the extension of the test time
Keywords: Tailing, Porous ceramic, Surface treatment, Adsorption
Solid waste is produced in the process of industrial production. The accumulation of solid waste occupies land resources and has a potential to cause contamination [1-3]. The preparation of ceramic materials from solid waste has attracted widespread attention. Porous ceramics not only have the characteristics of corrosion resistance, high temperature resistance and good chemical stability, but also have the characteristics of high porosity, small bulk density and selective permeability to liquid or gas media due to their rich porous structure [4-6]. Porous ceramics are often used in the fields of adsorbent carrier, permeation and separation etc. [4, 7-9]. Hui et al. [10] successfully prepared cordierite-based ceramic foams by utilizing asbestos tailings and coal fly ash as main raw materials. When they were sintered at 1250 ℃ for 30 mins. The open porosity and compressive strength of the cordierite-based ceramic foams were 49.26%, and 2.17 MPa, respectively. Ren et al. [11] successfully prepared high-strength ferric-rich ceramics. The performances of the ferric-rich ceramic were 4.65% of breakage ratio under 52 MPa and 2.78 g/cm3 of apparent density when they were sintered at the best temperature of 1130 ℃. Zhu et al. [2] utilized vanadium-titanium magnetite tailings, feldspar tailings, and kaolinite-type pyrite tailings as raw materials, the foam ceramics have been prepared by introducing SiC as foaming agents. The samples possess porosity of 79.48%, bulk density of 0.314 g/cm3, and compressive strength of 3.81 MPa respectively, when they were sintered at 1140 ℃. Huang et al. [12] prepared the eco-friendly permeable ceramic by putting silica sand tailing, steel slag and coal gangue successfully. Wang et al. [13] successfully prepared the foam glass by utilizing red mud, coal gangue and waste glass as raw materials. Chen et al. [14] prepared the high-strength ceramsite by using demagnesium boron mud and oil shale semi-coke as the main raw materials, Na2SiO3 as binder, and Na2CO3 as foaming agent. The porosity, apparent density, and compressive strength of the ceramsite sintered at 1070 ℃ are 22.63%, 1398.33 kg/m3 and 11.50 MPa respectively.
Copper ion is one of the harmful substance in sewage. The removal methods of copper ions mainly include membrane separation, coagulation flocculation, solvent extraction, ion exchange, electrolysis, chemical precipitation and adsorption [15-17]. Adsorption method has the advantages of simple operation, low cost, diversity of adsorbents, selective adsorption and so on [18, 19]. The adsorption method can effectively adsorb heavy metal ions and has been widely used. Zhang et al. [20] prepared the Fe3O4@CFAS composites for the adsorption of Cu(II), by using magnetic Fe3O4 nanoparticles generated in situ on a coal fly ash-based porous ceramic support (CFAS) with high porosity. And the Cu(II) removal rate of Fe3O4@CFAS reached 94.89%. Chen et al. [21] obtained the mesoporous TiO2 by a brief and simple sol–gel processing and applied for the removal of Cu(II) from aqueous solution. The results show that the mesoporous TiO2 adsorbent displayed excellent Cu(II) adsorption efficiency.
In this paper, the technological conditions for preparing porous ceramics from tailings are discussed. Porous ceramics were used as a carrier to realize the adsorption of Cu(Ⅱ) in aqueous solution.
Raw materials
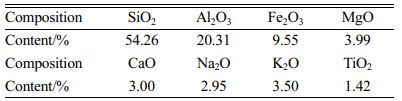
Tailings were provided by a company in Hebei Province, China. The results of X-ray fluorescence spectrum analysis are shown in Table 1. The tailings mainly contain aluminum and silicon.
Experimental methods
Preparation
All the tailings were passed 200 mesh sieve after they were crushed and ball milled. The tailings were mixed with SiO2, Al2O3, CaO and MgO in proportion, and then an appropriate amount of sodium carboxymethylcellulose and deionized water. The mixture was stirred to form slurry. The stirred slurries were poured into the molds and the green bodies were taken out after 24 hours. The green bodies were dried, then sintered at the predetermined temperatures for 2 hours, and cooled with the furnace.
Surface treatment
The samples were immersed in 1.5 M nitric aqueous solution at 80 ℃. After being soaked, the samples were rinsed repeatedly with deionized water, baked for 2 hours in an oven at 120 ℃.
Appropriate γ-Aminopropyl triethoxysilane (KH550, 98%), ethanol and deionized water were mixed in the volume ratio of 20:72:8, and named as a surface treatment solution. The porous ceramic sample was immersed in the surface treatment solution at 70 ℃ for 3.5 hours, then the samples were taken out and washed repeatedly with deionized water.
Static adsorption of Cu(II)
1.0 g sample was put into 100 ml of aqueous solution containing Cu(II). The solution was stirred with a magnetic stirrer. After a period of test, 1 ml of the supernatant fluid was taken out and diluted to 10 ml in the tube. The concentration of Cu(II) in the aqueous solution was determined by atomic absorption spectrophotometer, and the removal rate and adsorption capacity of the samples to Cu(II) were calculated using equation (1) and (2) respectively.
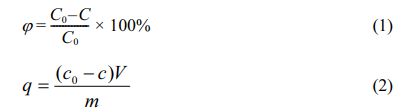
Where φ represents removal rate (%), C0 and C represent the initial and final ions concentrations of the solution, respectively. And q represents the adsorption capacity (mg/g), m represents the mass (g) of adsorbent and V represents the volume (L) of the solution.
Characterization
The compressive strength of the specimen was tested by universal pressure tester (JBC-LY, He xing, Shenyang). The XRD patterns were recorded via X-ray diffractometer D8 ADVANCE (Bruker, Germany) employing Cu Ka radiation at a scan speed of 4°/min in the 2θ range of 10-80°. A surface of the sample was selected for grinding and polishing. Any 10 parts were selected to observe and photograph with a camera with a macro lens. After shooting, the sample was polished to below the surface of 0.1 mm, then polished and photographed. 10 sections were observed for each sample. The Image-pro plus software was utilized to calculate the number and diameter of holes of the samples statistically. The microstructure was observed using a scanning electron microscope (SEM, SU8020, Hitachi, Japan). The structure of the samples was analyzed by using Fourier transform infrared spectroscopy (FT-IR, GD26-FTIR-650). The concentration of copper ion before and after adsorption and desorption were analyzed by an atomic adsorption spectrometer (A3, Pu dan, Beijing).
Composition of the tailings
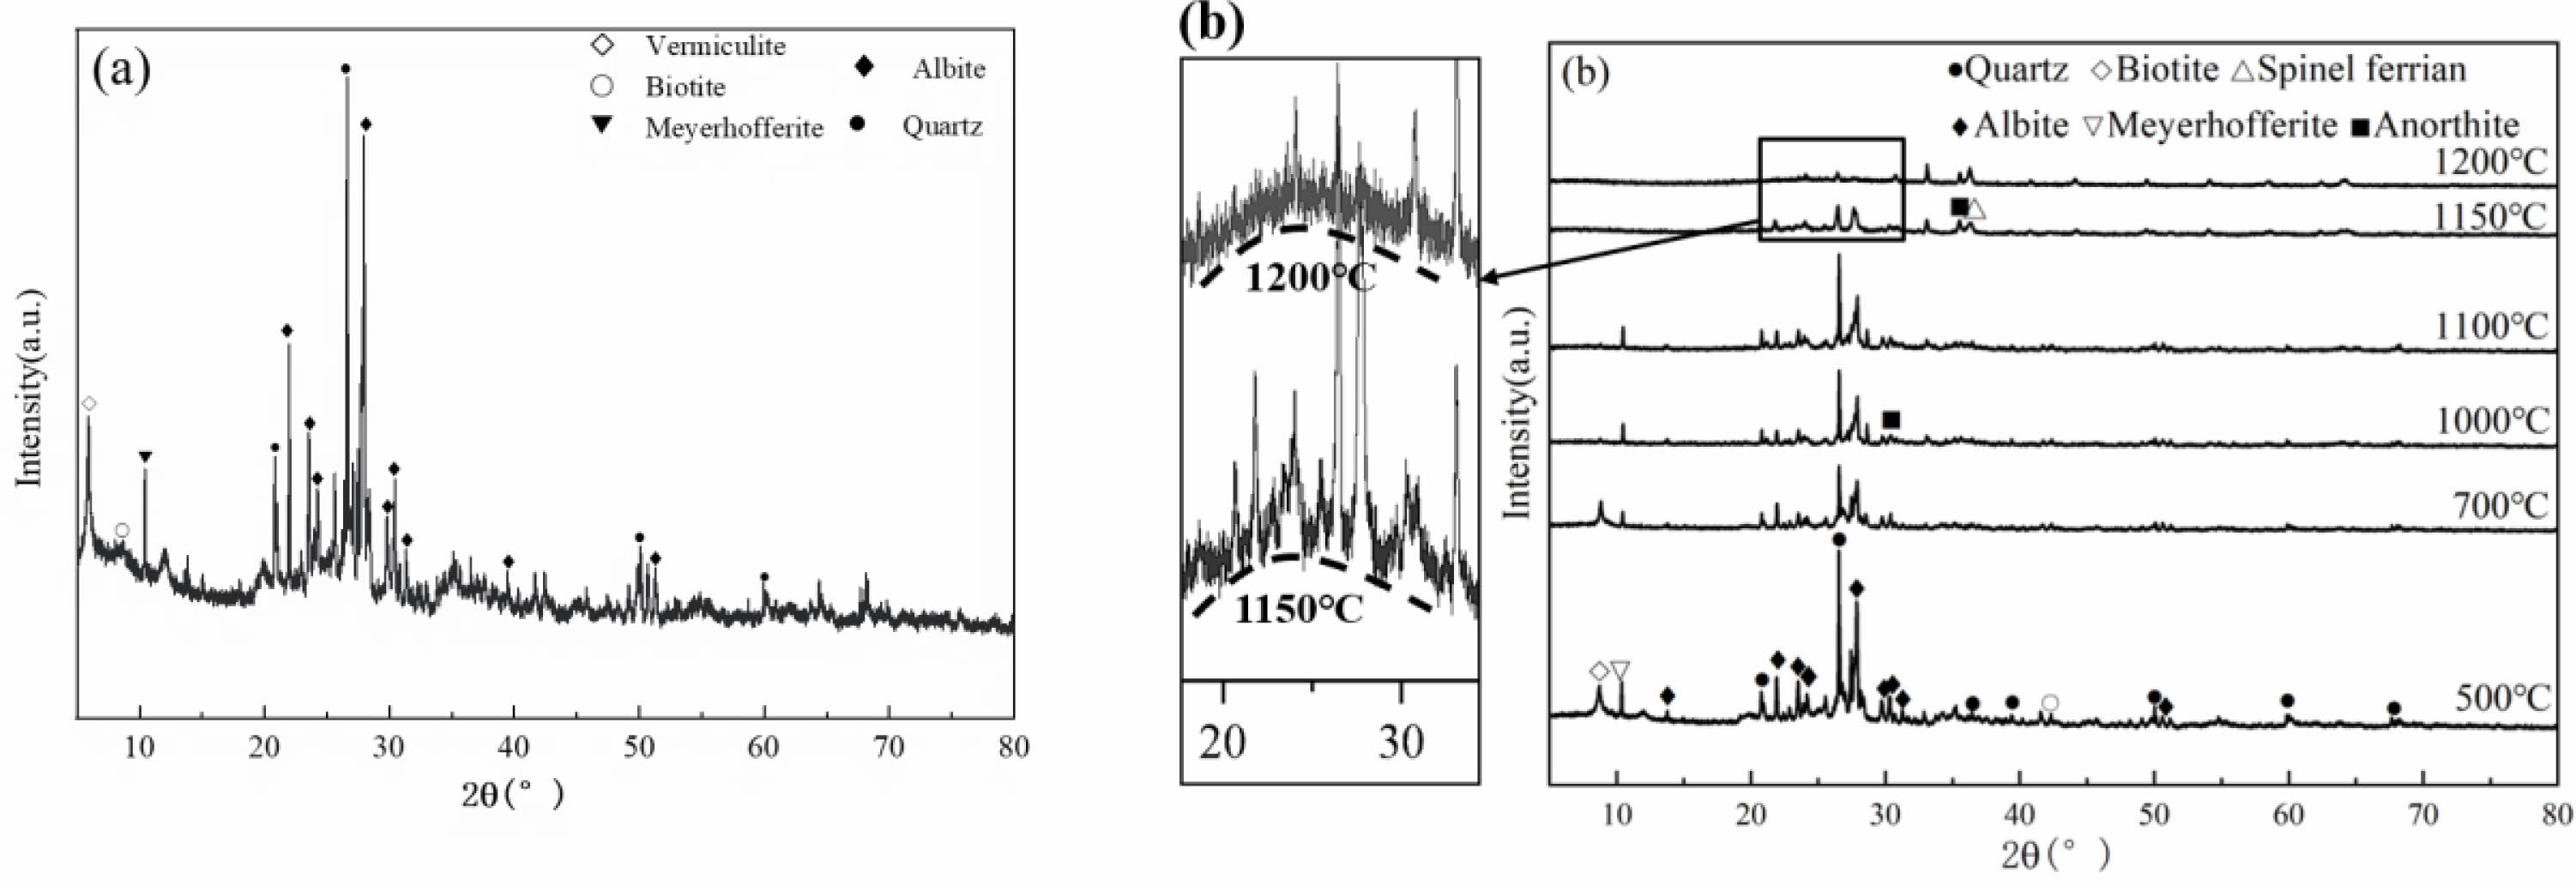
The tailings were wet ground by the ball mill, and then dried. Fig. 1(a) illustrates the X-ray diffraction analysis results. The main mineral phases of the tailings are quartz and albite, and contain a small amount of vermiculite and biotite too. The tailings were pressed into flake samples, and then were heated at different temperatures.
In Fig. 1(b), the X-ray diffraction results show that, after calcination at 500 ℃, the vermiculite phase of the sample was disappeared. With the increase of calcination temperature, the contents of albite and quartz are decreased. After calcination at 1000 ℃, anorthite (Ca [Al2Si2O8]) phase is appeared. According to literature, the formation temperature of anorthite ranges from 1000 ℃ to 1100 ℃ [22]. When the calcination temperature rises to 1150 ℃, the content of anorthite is increased and spinel ferrite (MgFe2O4) phase is appeared. A small amount of glass phase is observed at the scattering diffraction angle of about 25° in the XRD pattern. This is due to the existence of Ca, Mg, Ti and Na in tailings, which breaks the Si-O bond and forms non bridged oxygen. The continuity of silicate structure is destroyed, resulting in the reduction of the temperature of liquid phase formation [23]. In addition, Ca2+, Fe3+ and other divalent metal ions were dissolved in liquid phase and participated in the reaction process to form anorthite and spinel ferrite. A large number of amorphous phases were formed in the samples when the samples were heated at 1200 ℃.
Effects of sintering temperature on porous ceramics
Phase composition of the samples
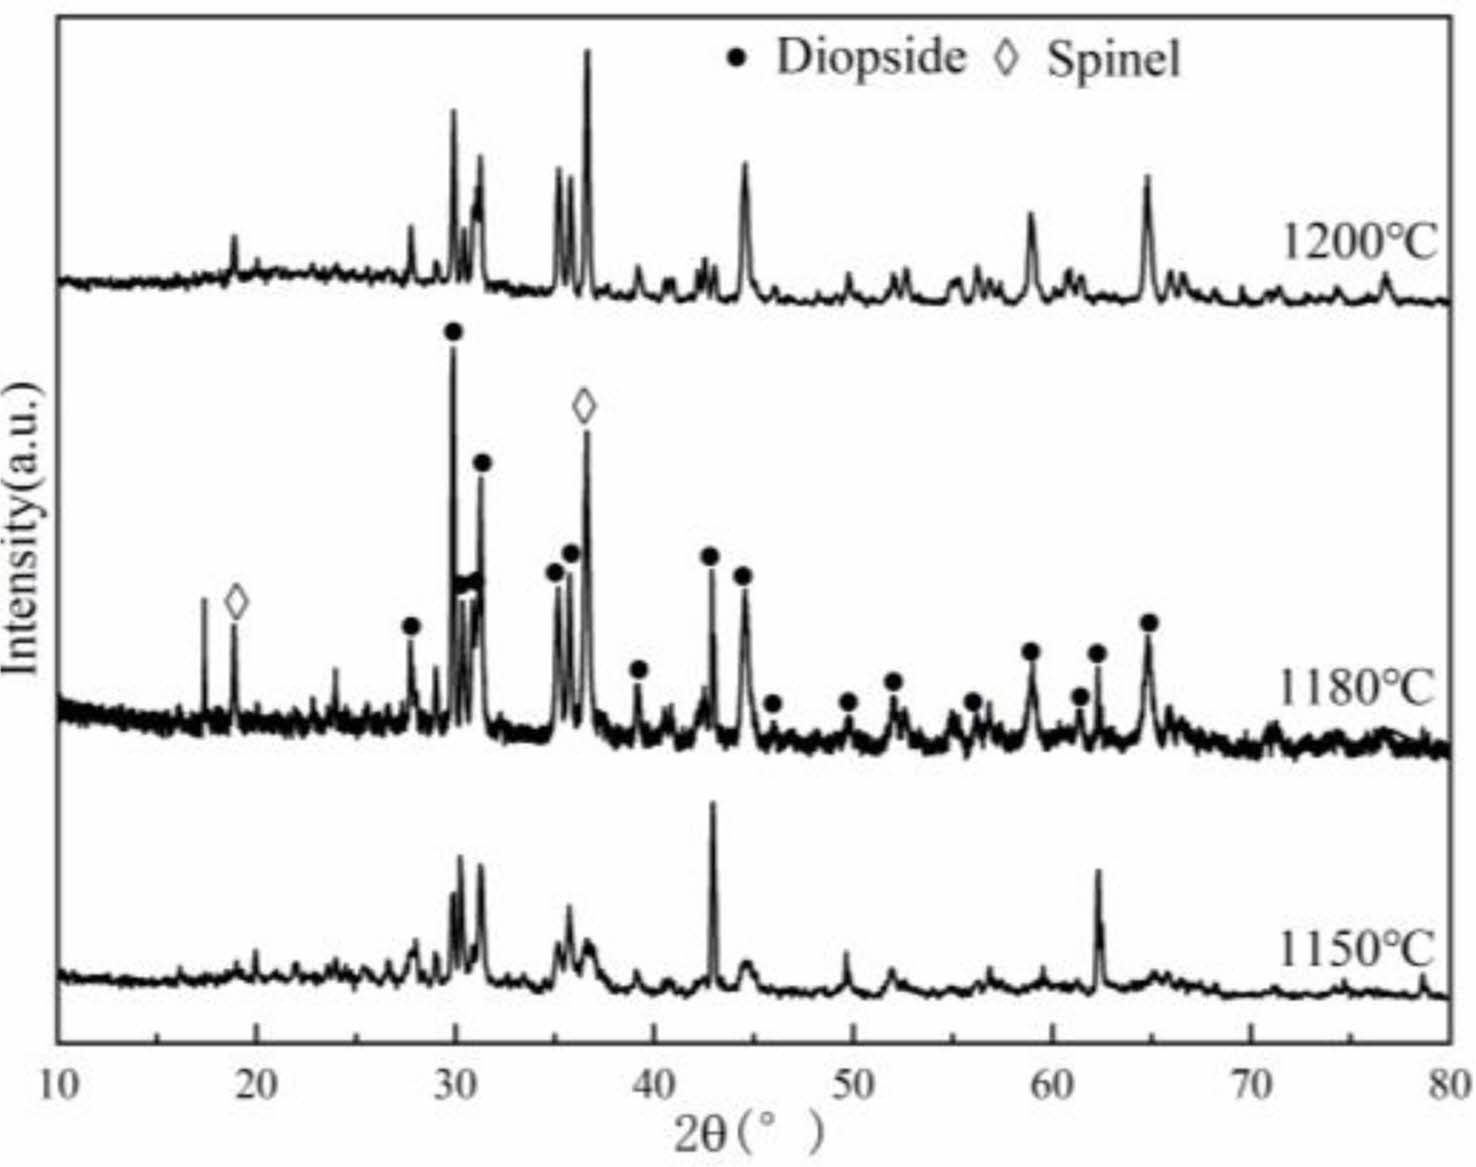
The XRD patterns of porous ceramic samples sintered at different temperatures are shown in Fig. 2. It can be seen that, the phases of the porous ceramic samples are mainly diopside and a small amount of magnesia alumina spinel.
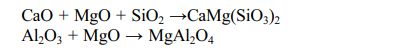
This is because SiO2 combines with CaO and MgO to form diopside. At the same time, the iron in the raw material is dissolved to form diopside. In addition, MgO reacts with Al2O3 to form magnesia alumina spinel.
When the sintered temperature rises to 1180 ℃, the content of diopside phase reaches the maximum. Due to the existence of Mg, Na and Ca in tailings, the temperature of the liquid phase formation is reduced. The existence of liquid phase increases the contact between materials and promotes the sintering reaction. The content of diopside phases of the sample are decreased when the samples are sintered at 1200 ℃.
Distribution of pore sizes and physical properties of the samples
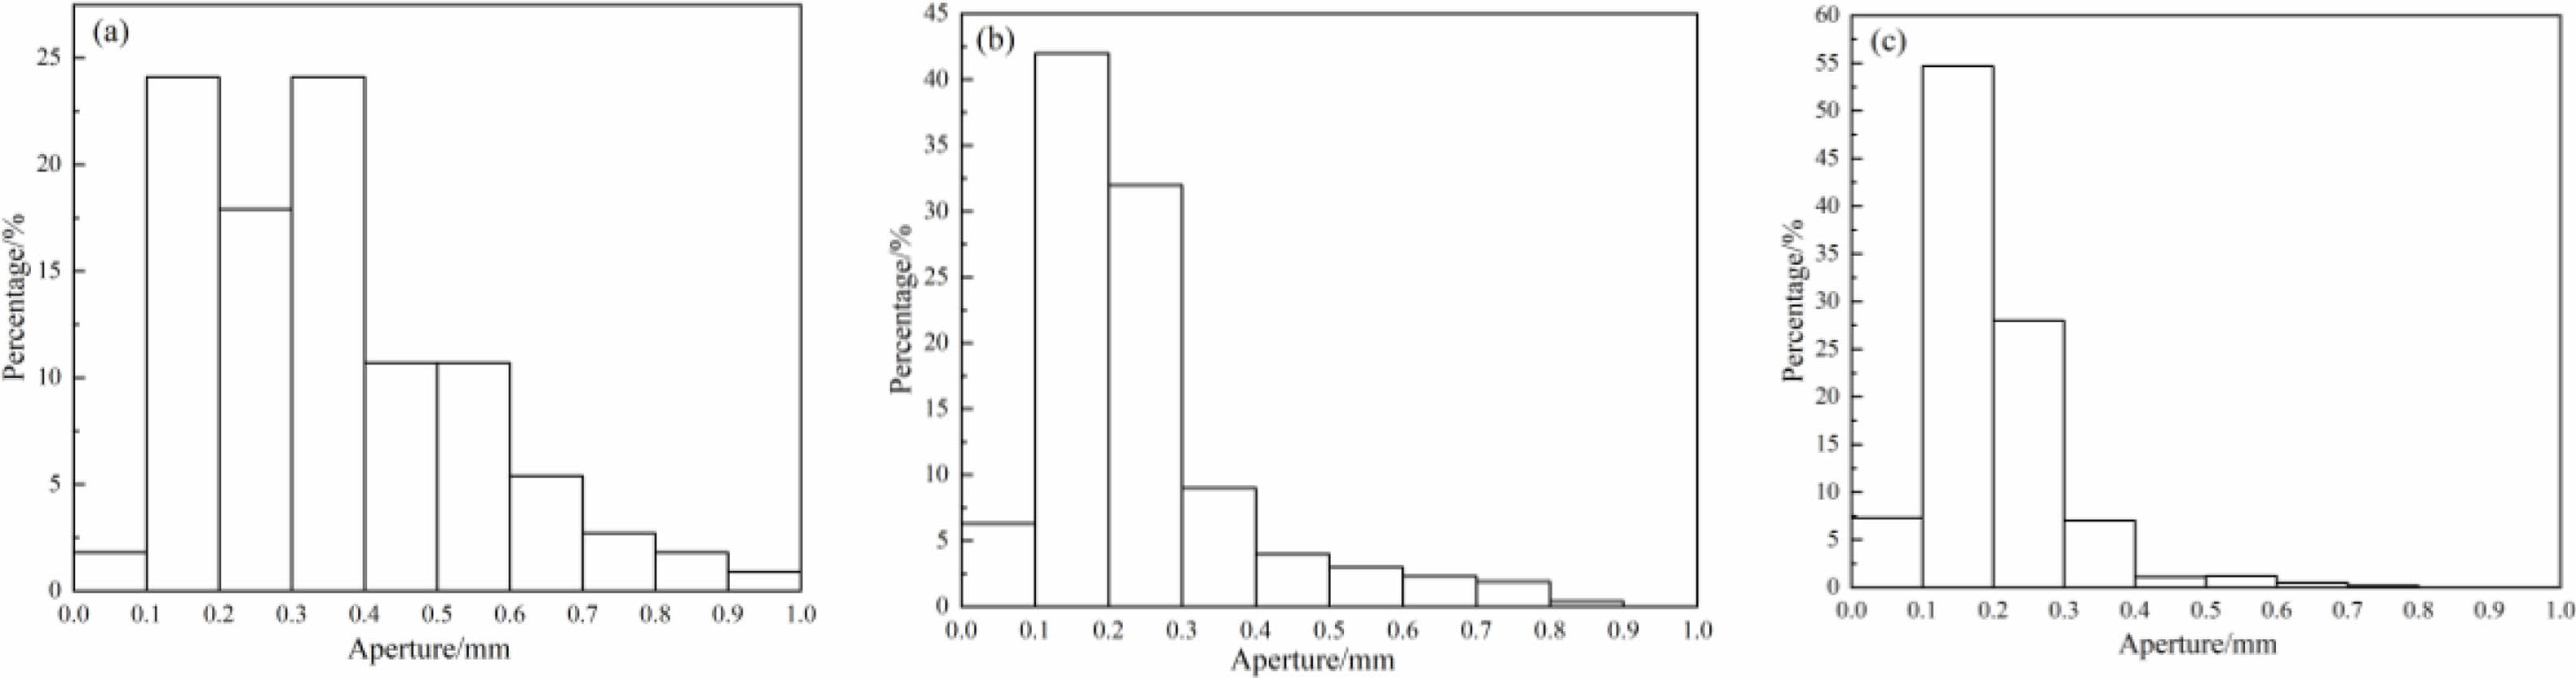
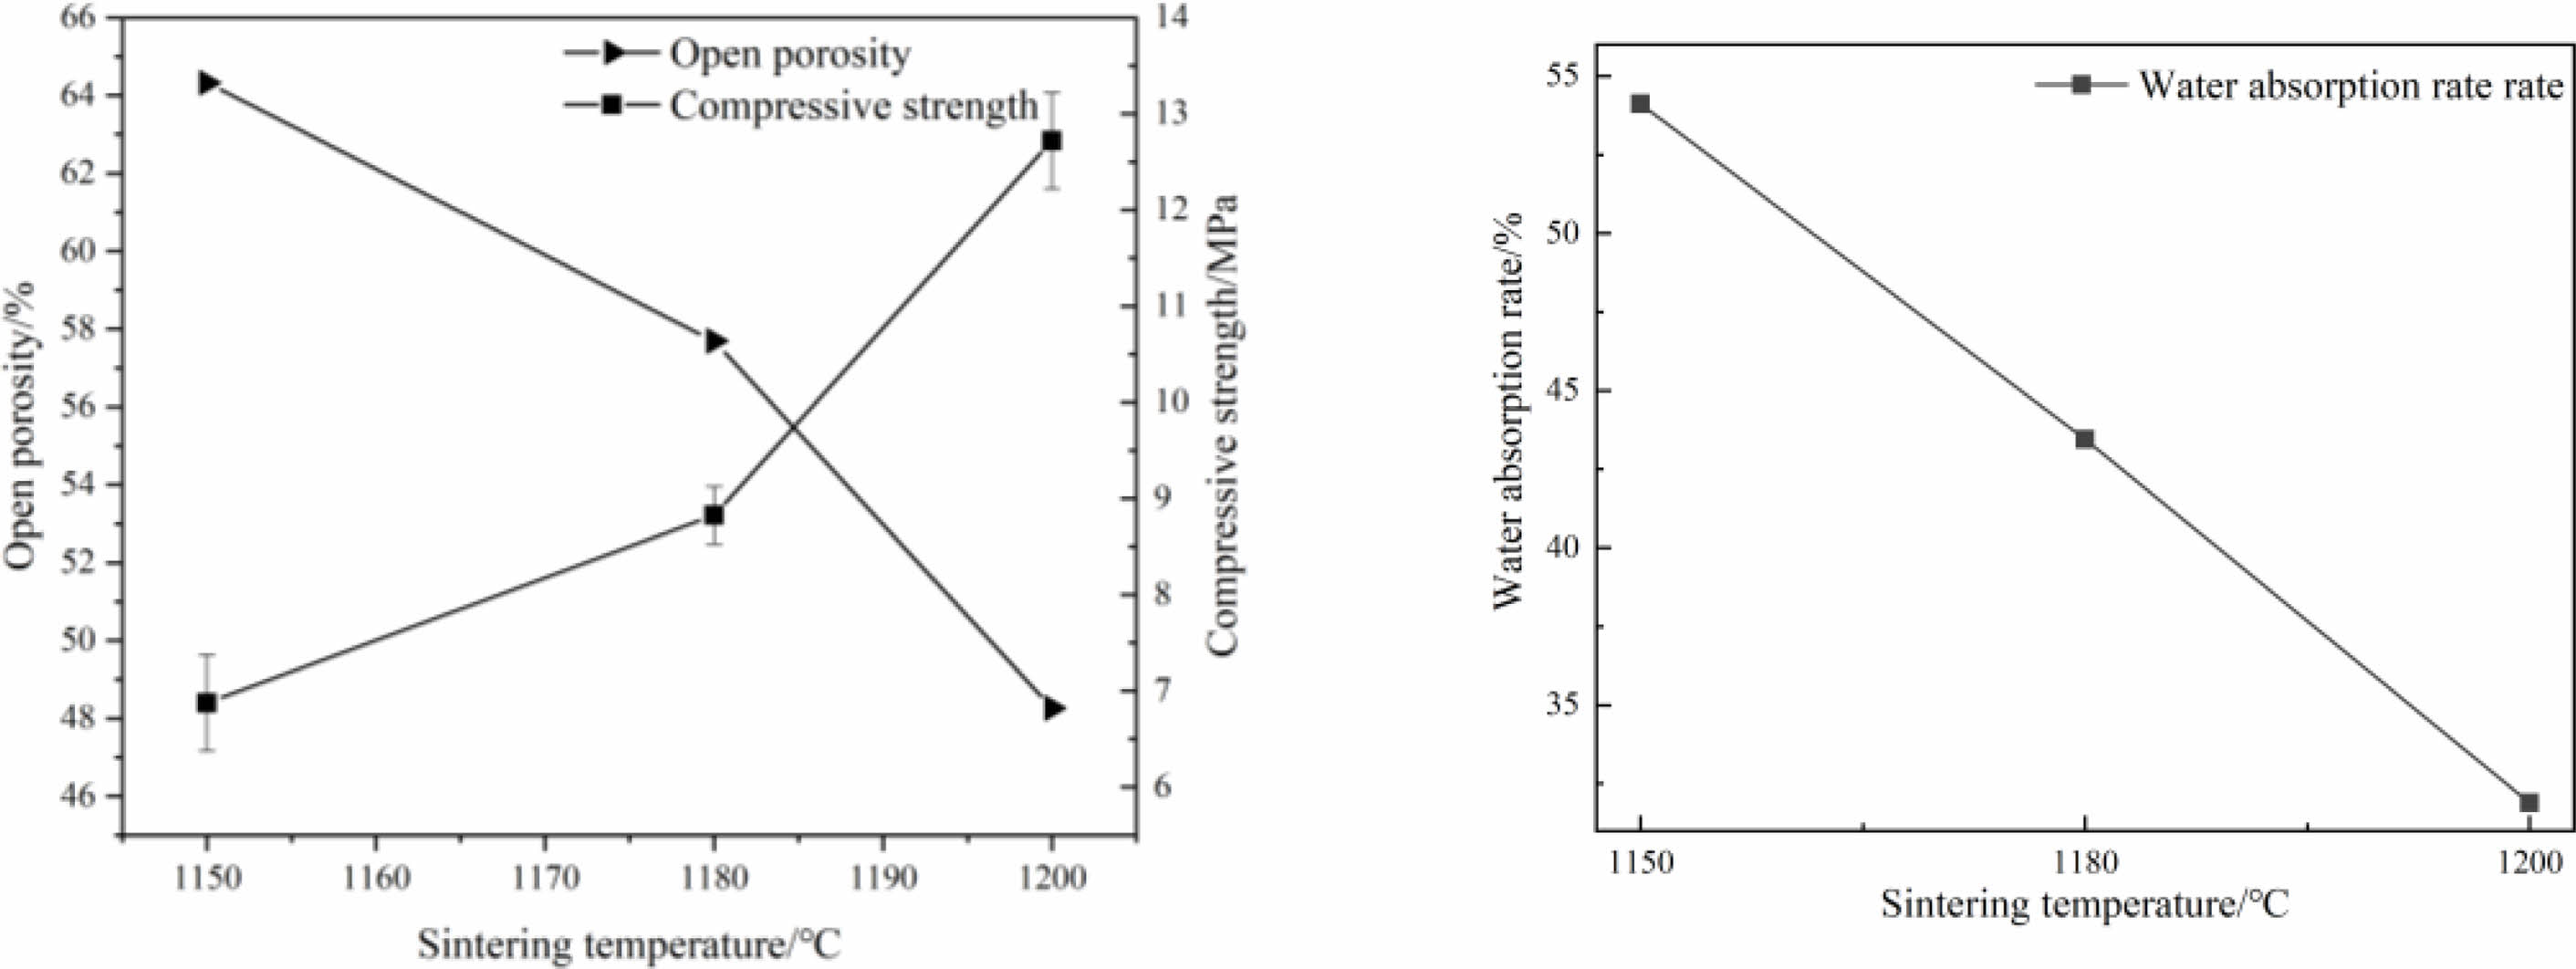
The distribution of pore sizes and physical properties of porous ceramic samples sintered at different temperatures are shown in Fig. 3 and Fig. 4. It can be seen that, with the increase of sintered temperature, the average pore diameters of the samples are decreased and gradually concentrated between 0.1 and 0.2 mm. The open porosity and water absorption rate of the samples are decreased, and the compressive strength of the samples is increased with the increase of sintered temperature. On the one hand, with the increase of sintered temperature, the content and fluidity of liquid phase are increased, so the size and number of pores in the sample are decreased, and the compressive strength is increased [24]. On the other hand, with the increase of sintered temperature, the diffusion ability of atomics is enhanced, the growth rate of particle interfaces is accelerated, the pores are gradually reduced. At the same time, the particle interface moves continuously, the pores migrate to the particle interface and disappear, and the density of pore wall is increased, so the compressive strength of the sample is increased [25].
Effects of holding time on porous ceramic
Phase composition of the samples
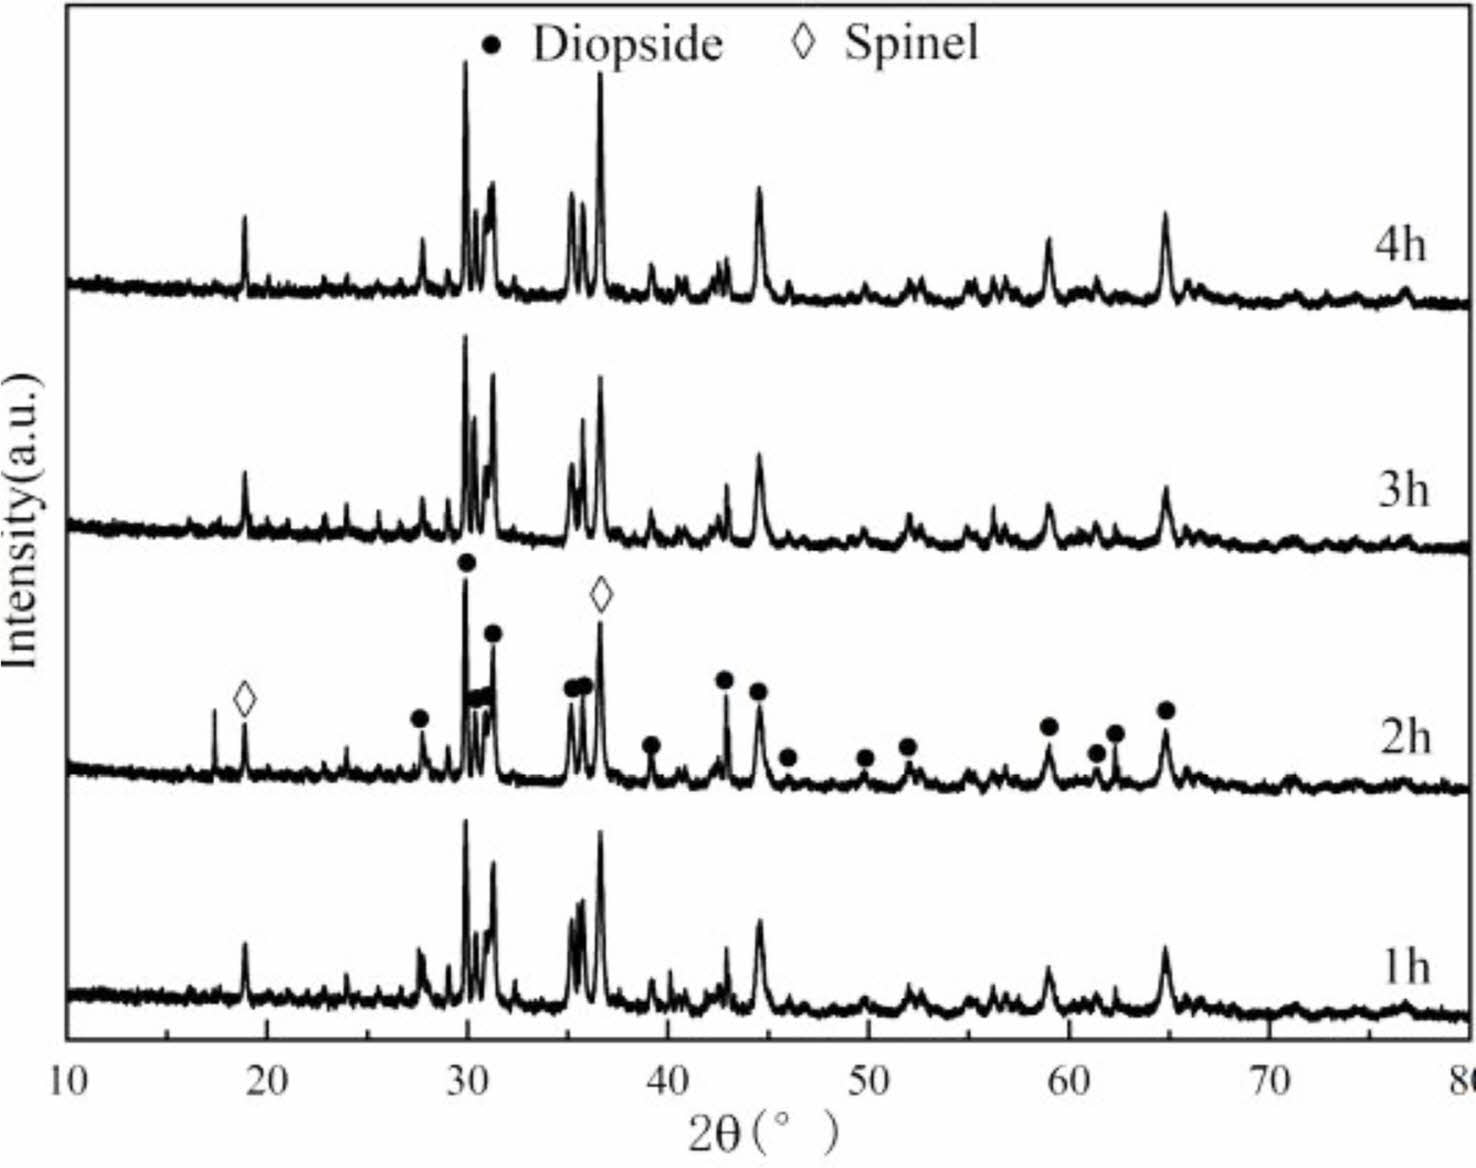
The XRD patterns of porous ceramics samples sintered at 1180 ℃ for different holding times are shown in Fig. 5. It can be observed that, the content of diopside phase is increased with the extension of holding time. This is because with the extension of holding time, the liquid phase diffuses more fully. The contact between liquid phases and solid particles is increased, and the sintering reaction is promoted.
The physical properties of the samples
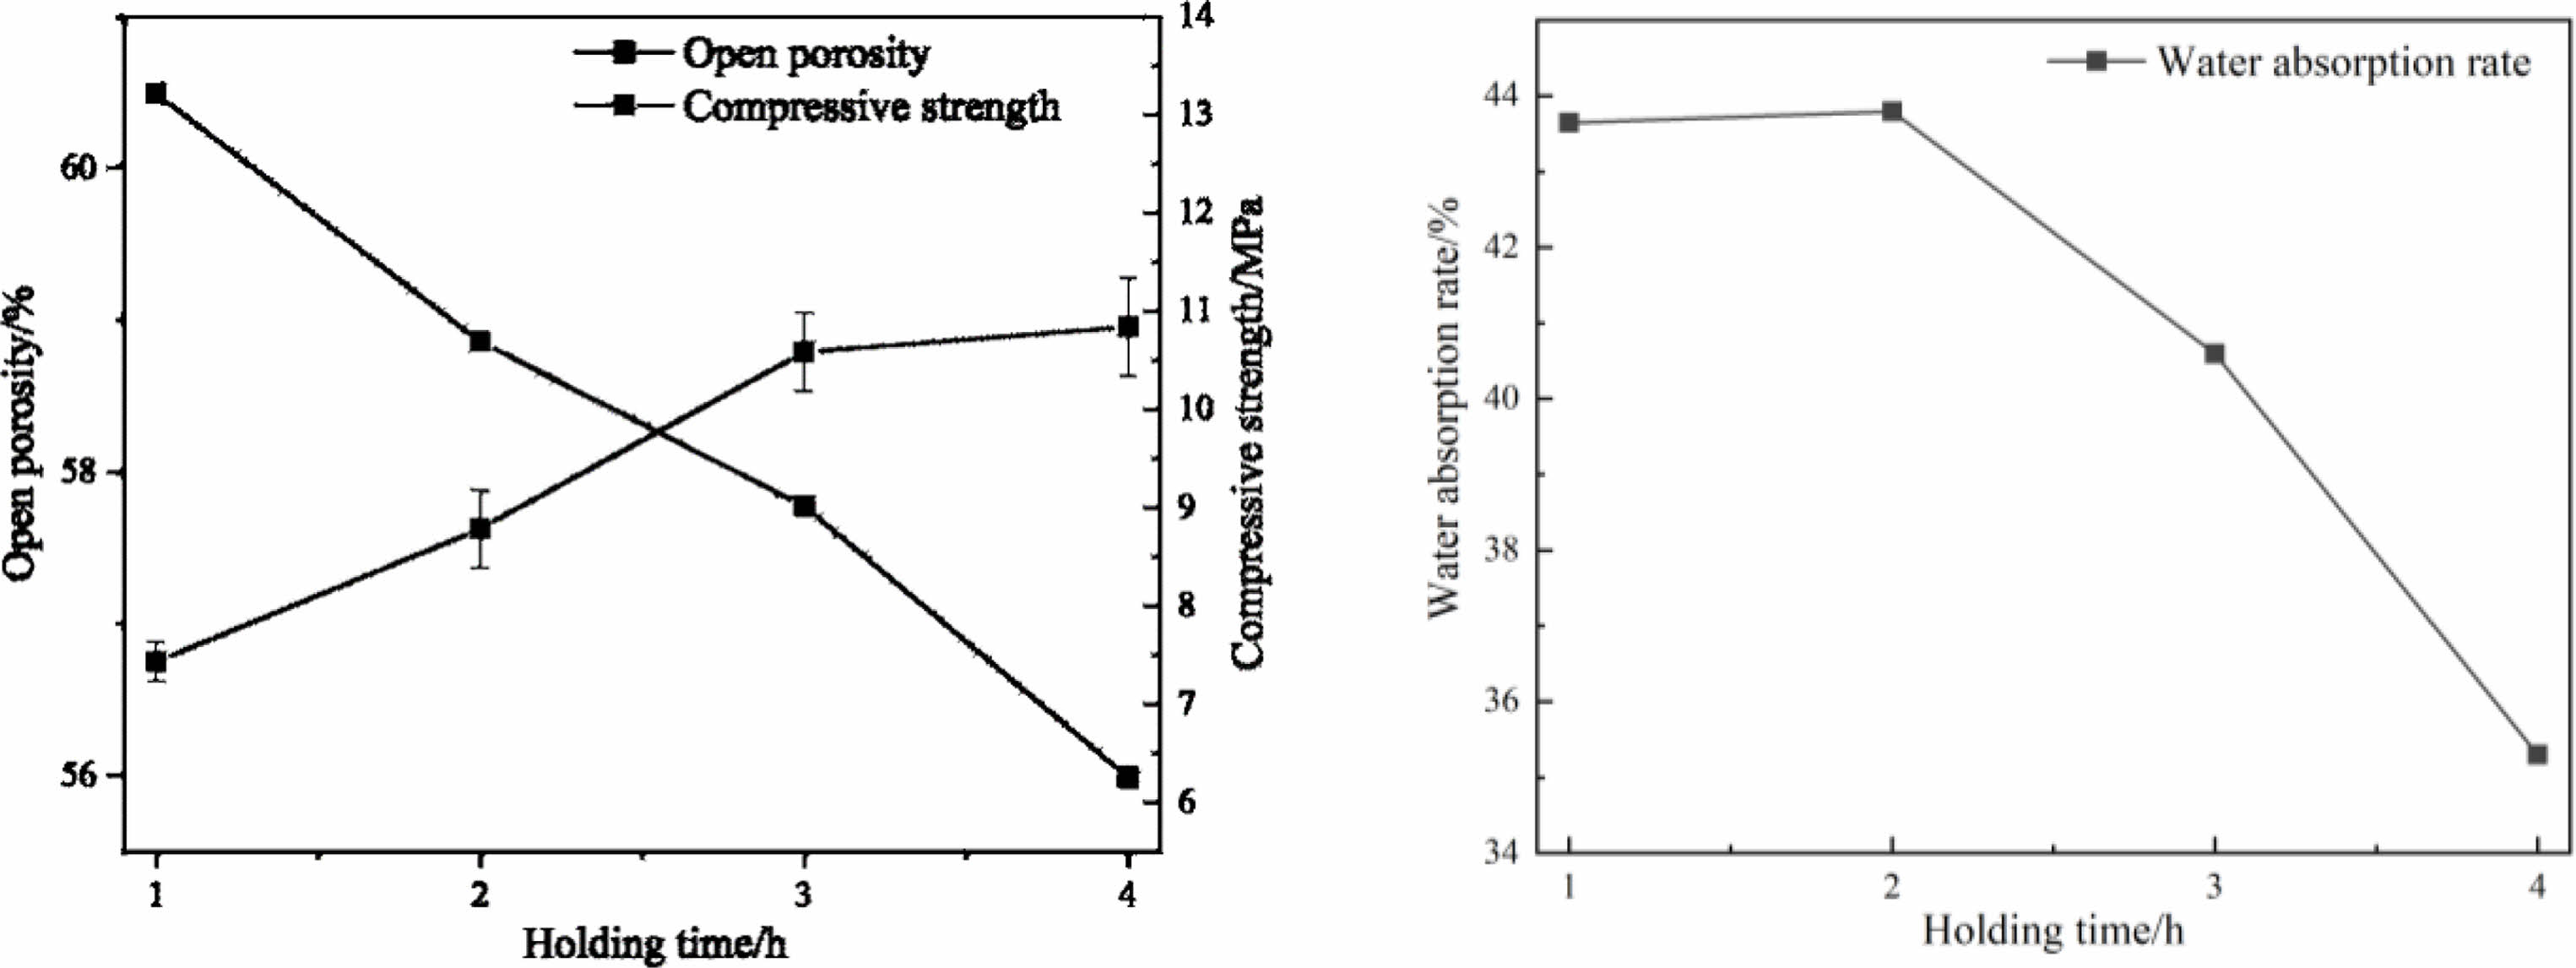
The physical properties of porous ceramics obtained with different holding times are shown in Fig. 6. It can be seen that, with the extension of holding time, the compressive strength of the sample is increased. The open porosity and water absorption of the samples are decreased. This is because with the extension of holding time, the liquid phase promotes the rearrangement of particles, and the gas in the samples move to the interface and disappear, so the compactness is increased [26].
Surface treatment of the ceramic samples
Micromorphology analysis of the samples
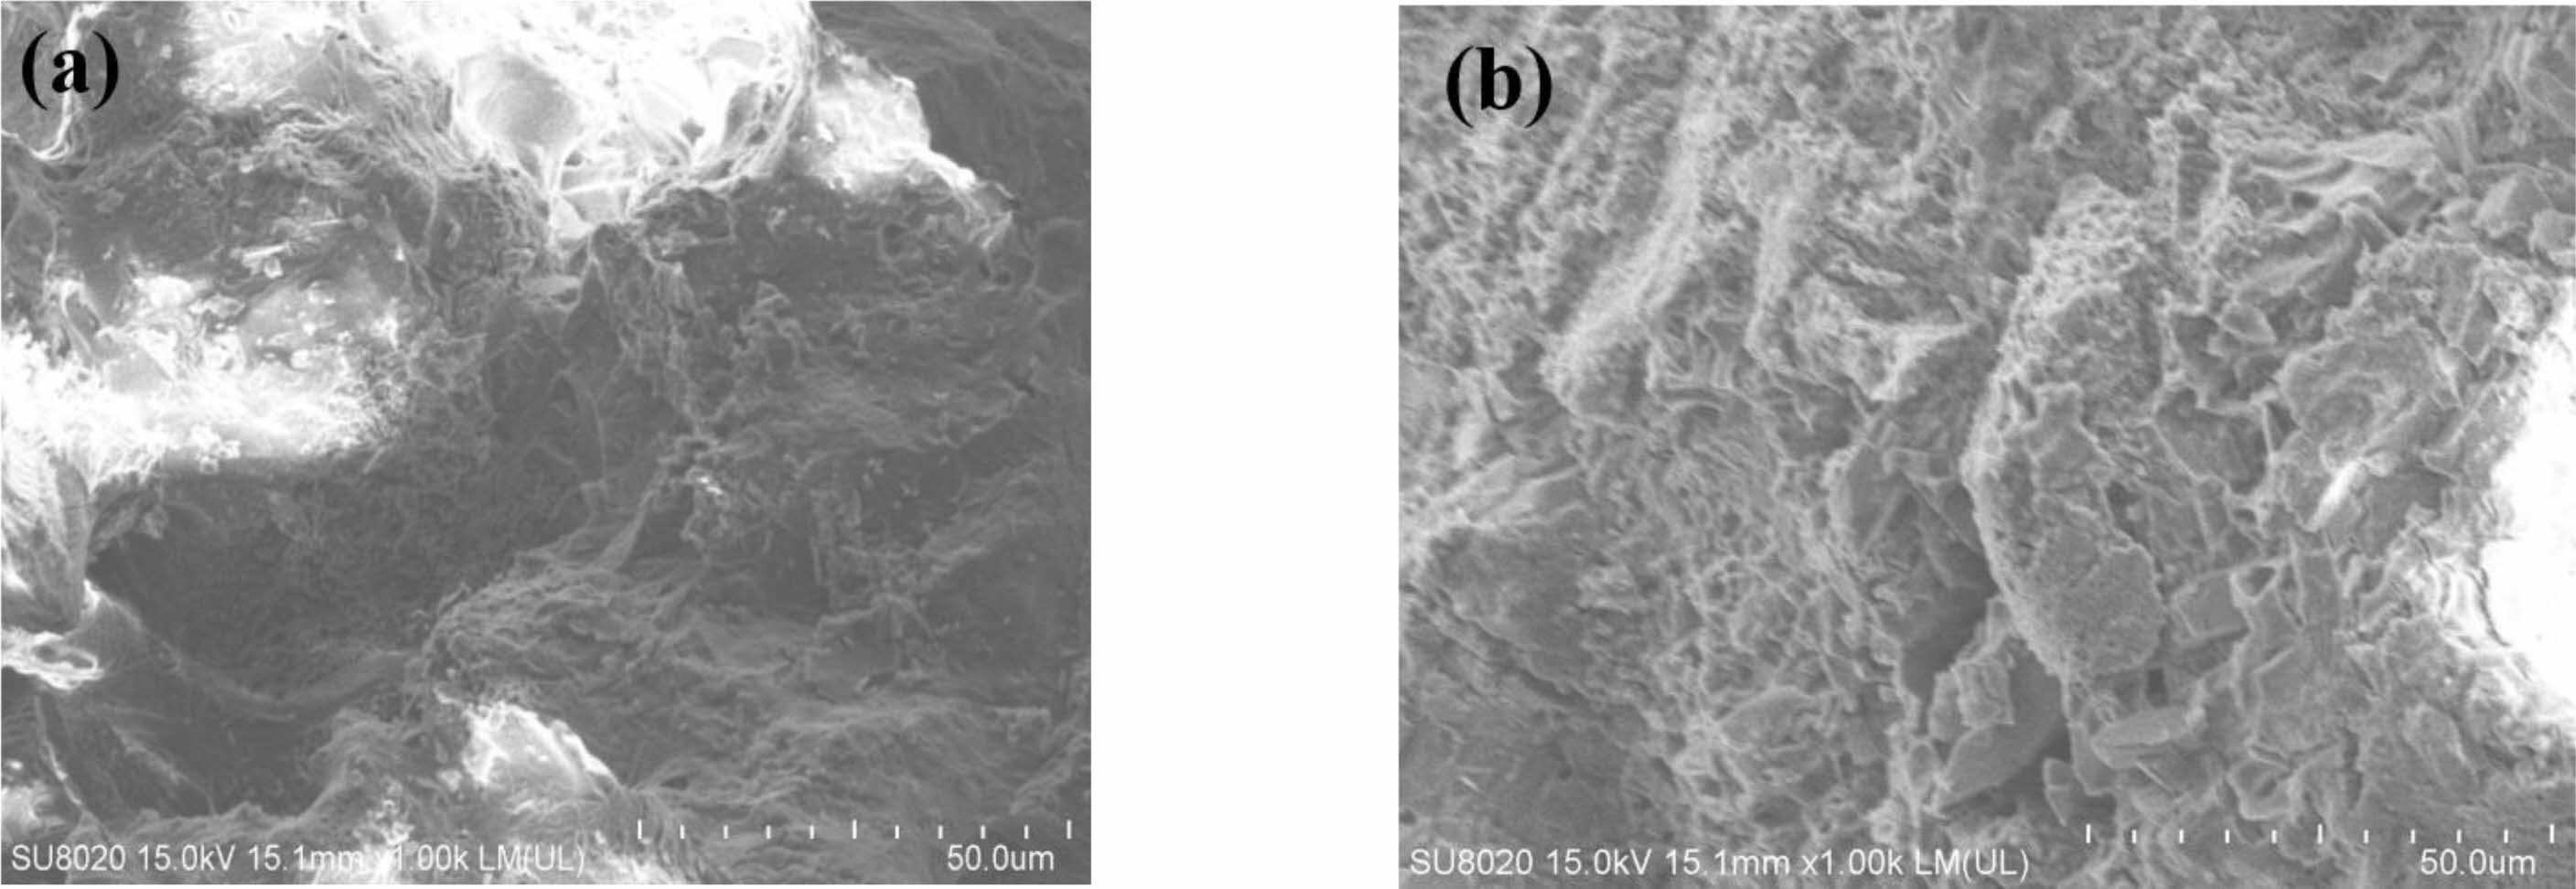
The morphology images of porous ceramic samples are shown in Fig. 7. It can be seen that, the grains of the samples are fine and evenly distributed, and there are a lot of holes in the samples (Fig. 7(a)). After the samples are surface treated, the microstructure of the sample is not changed significantly (Fig. 7(b)). This indicates that the surface treatment will not change the structure of the samples. Fig. 8
FT-IR analysis
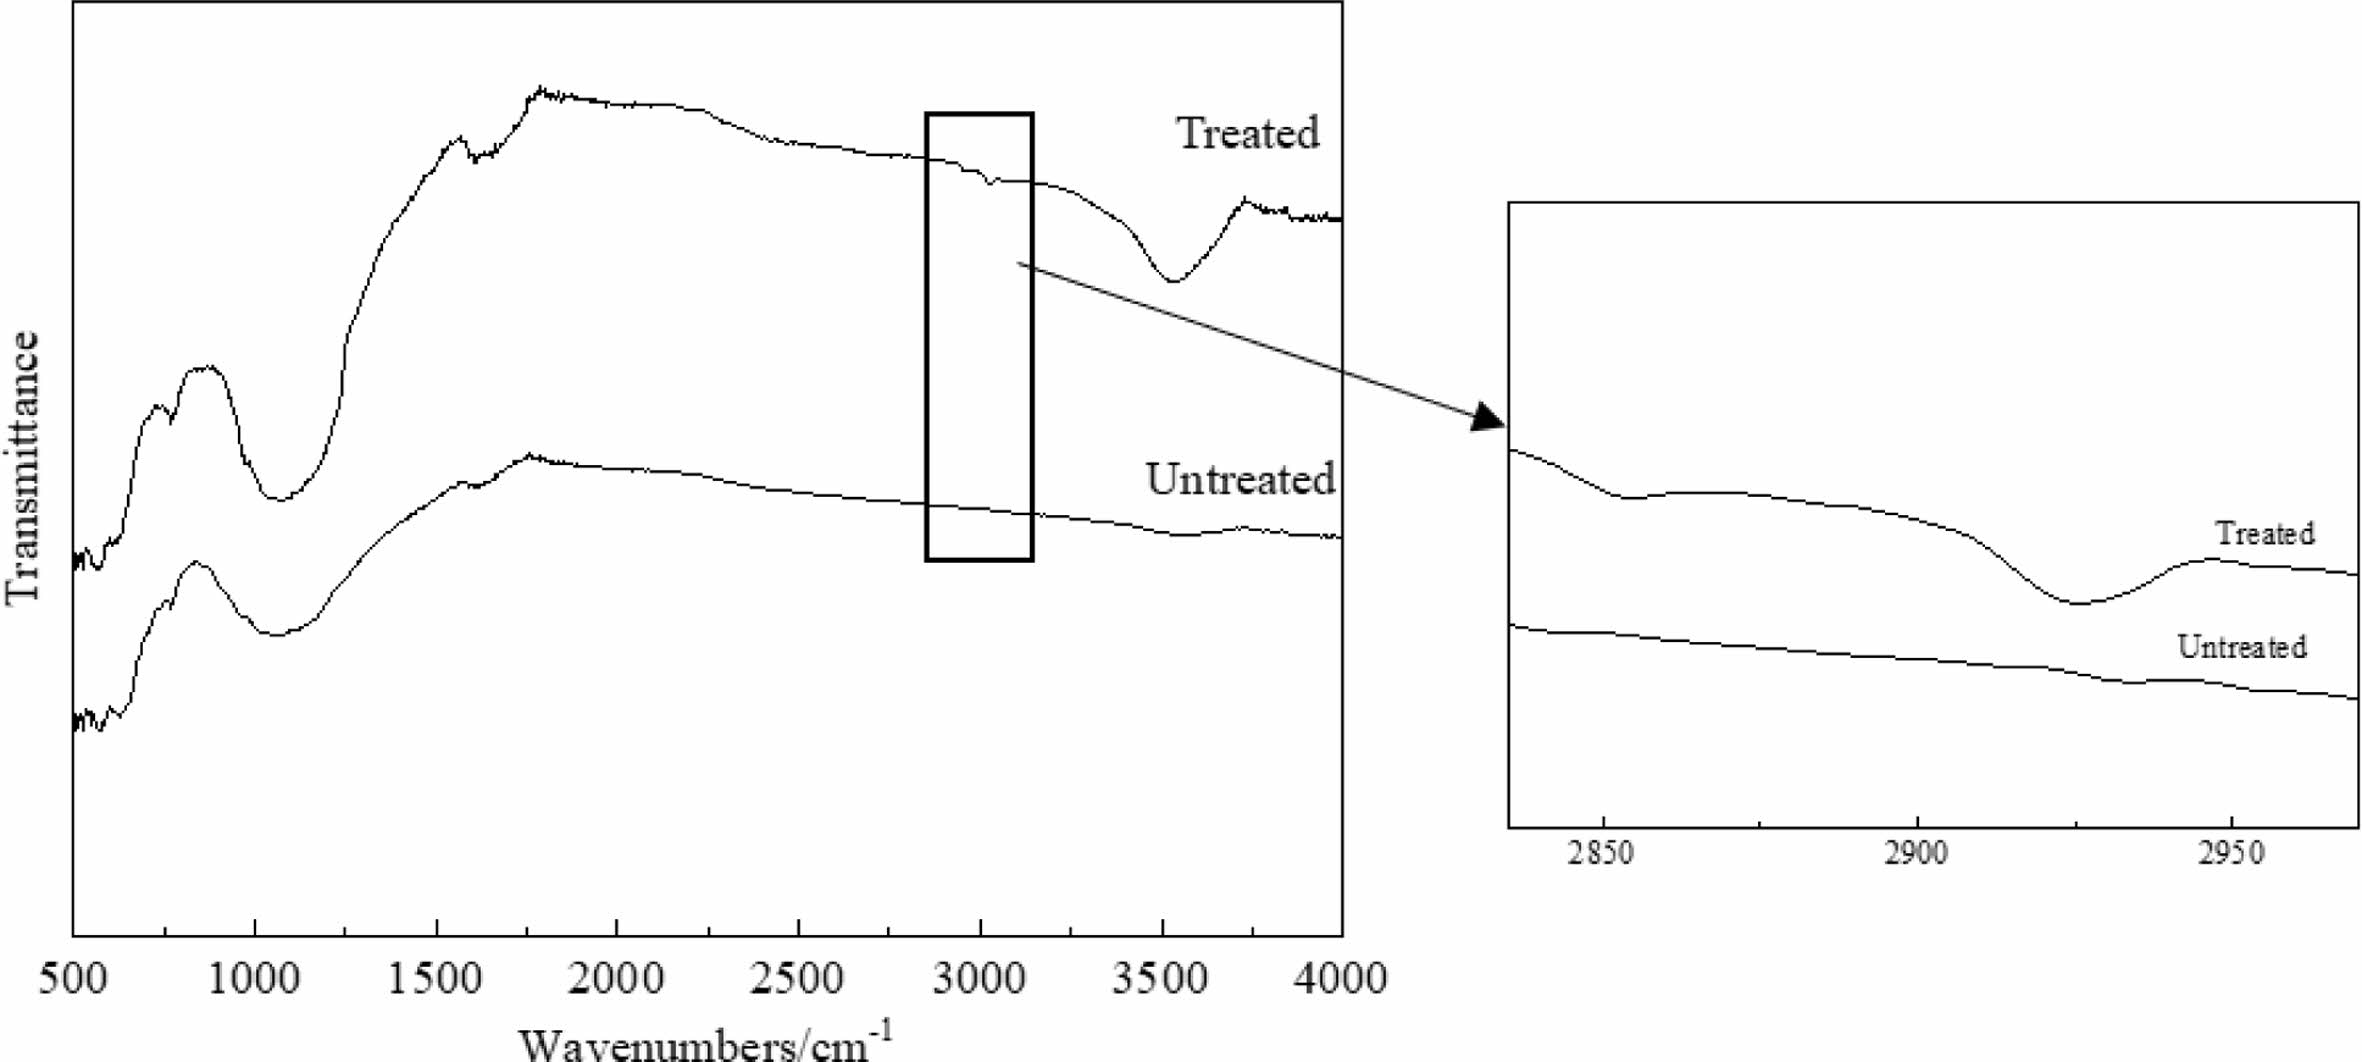
The infrared absorption spectra of porous ceramic samples before and after treatment are shown in Fig. 9. There is a stretching vibration peak of Si-O bond at 1080 cm-1 and an absorption peak generated by adsorbed water at 3455 cm-1. After the samples are treated with surface treatment solution, the methylene (-CH2-) symmetric stretching vibration peak and asymmetric stretching vibration peak appear at 2854 cm-1 and 2923 cm-1 respectively [27]. The intensity of Si-O bond absorption peak is significantly enhanced. Therefore, the enhancement of Si-O bond absorption peak and presence of methylene (-CH2-) indicate that the methylene (-CH2-) is successfully loaded on the sample surfaces.
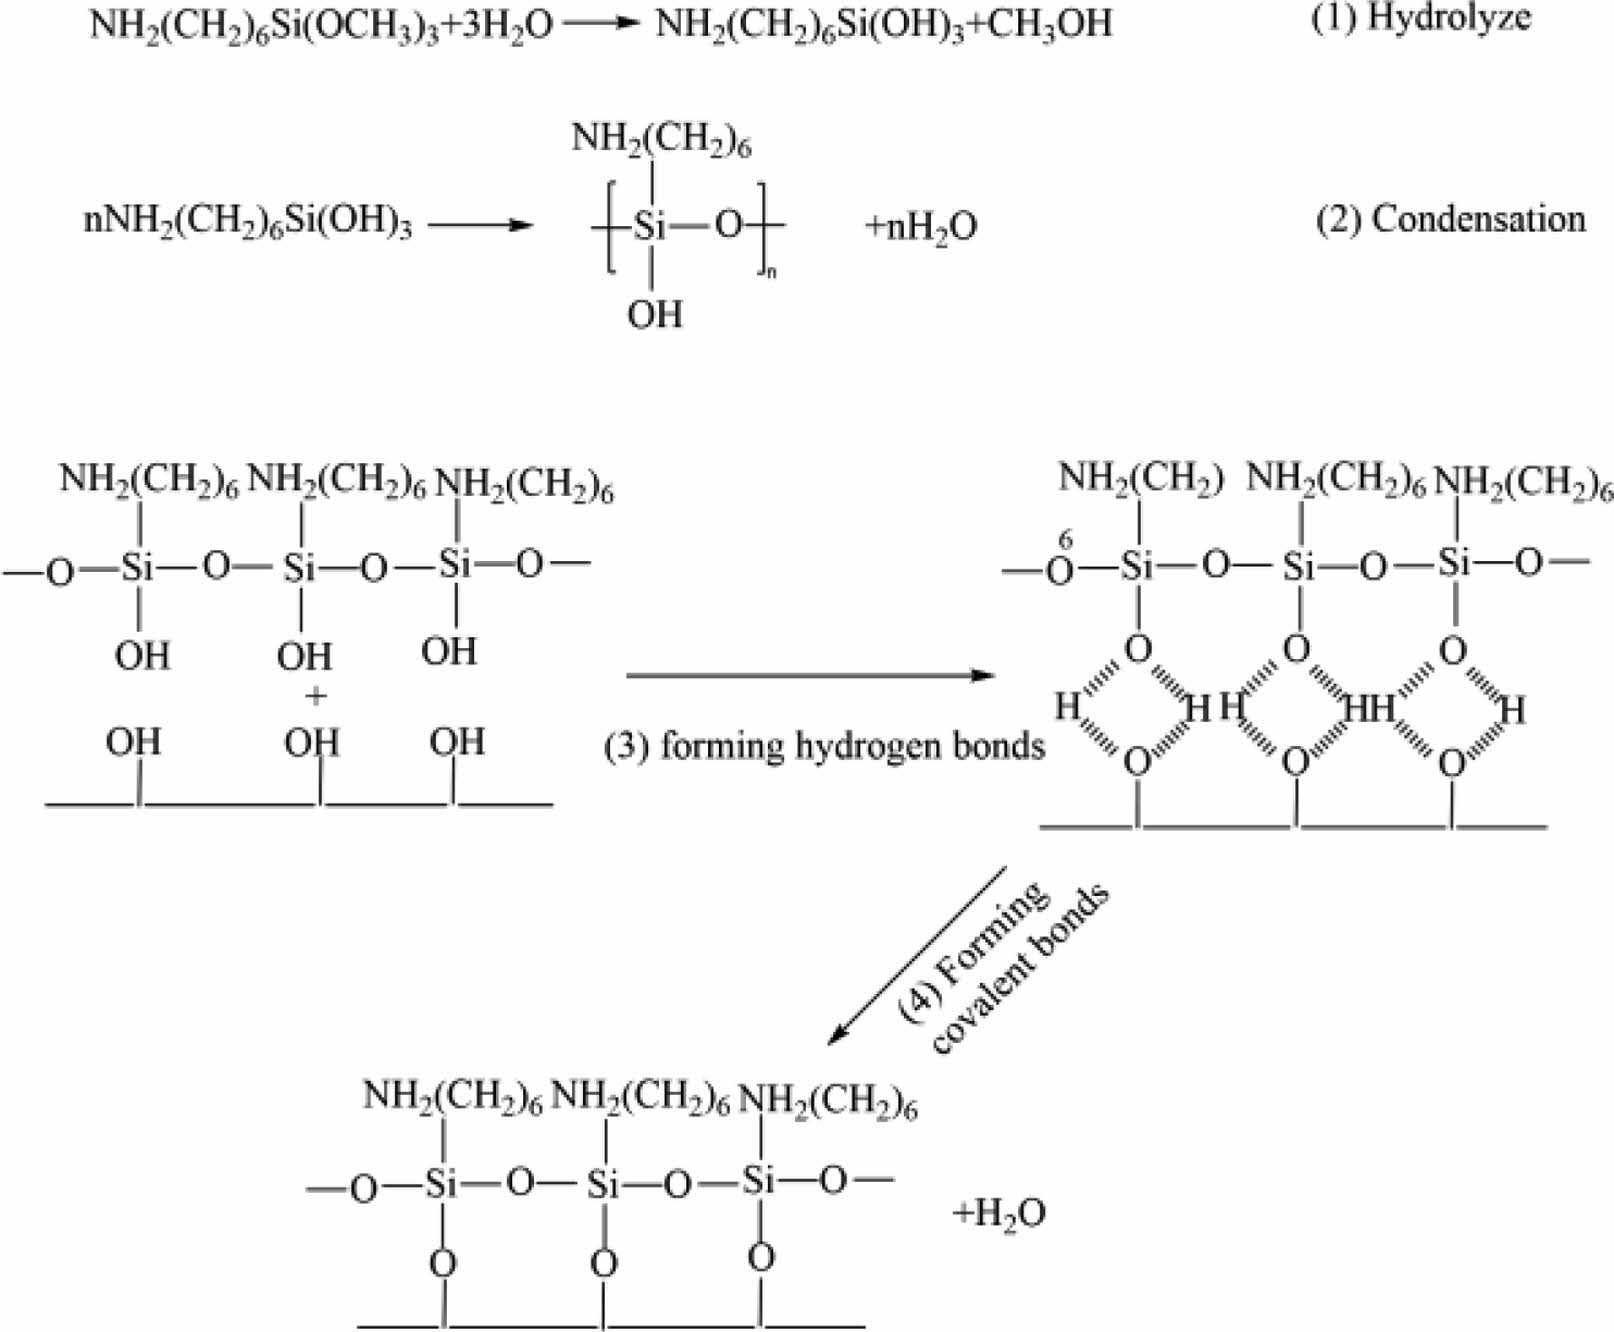
Fig. 9 shows the chemical reaction formula of the hydrolysis and deposition process of silane coupling agent. Alkoxy groups are hydrolyzed to produce silanol groups, which are condensed to produce oligosiloxanes. The silanol group in oligosiloxane is adsorbed to the sample surfaces through hydrogen bond, and combined with hydroxyl group on the sample surfaces during heating to form covalent bond connection [28].
Adsorption experiment of porous ceramics
The effect of solution pH value
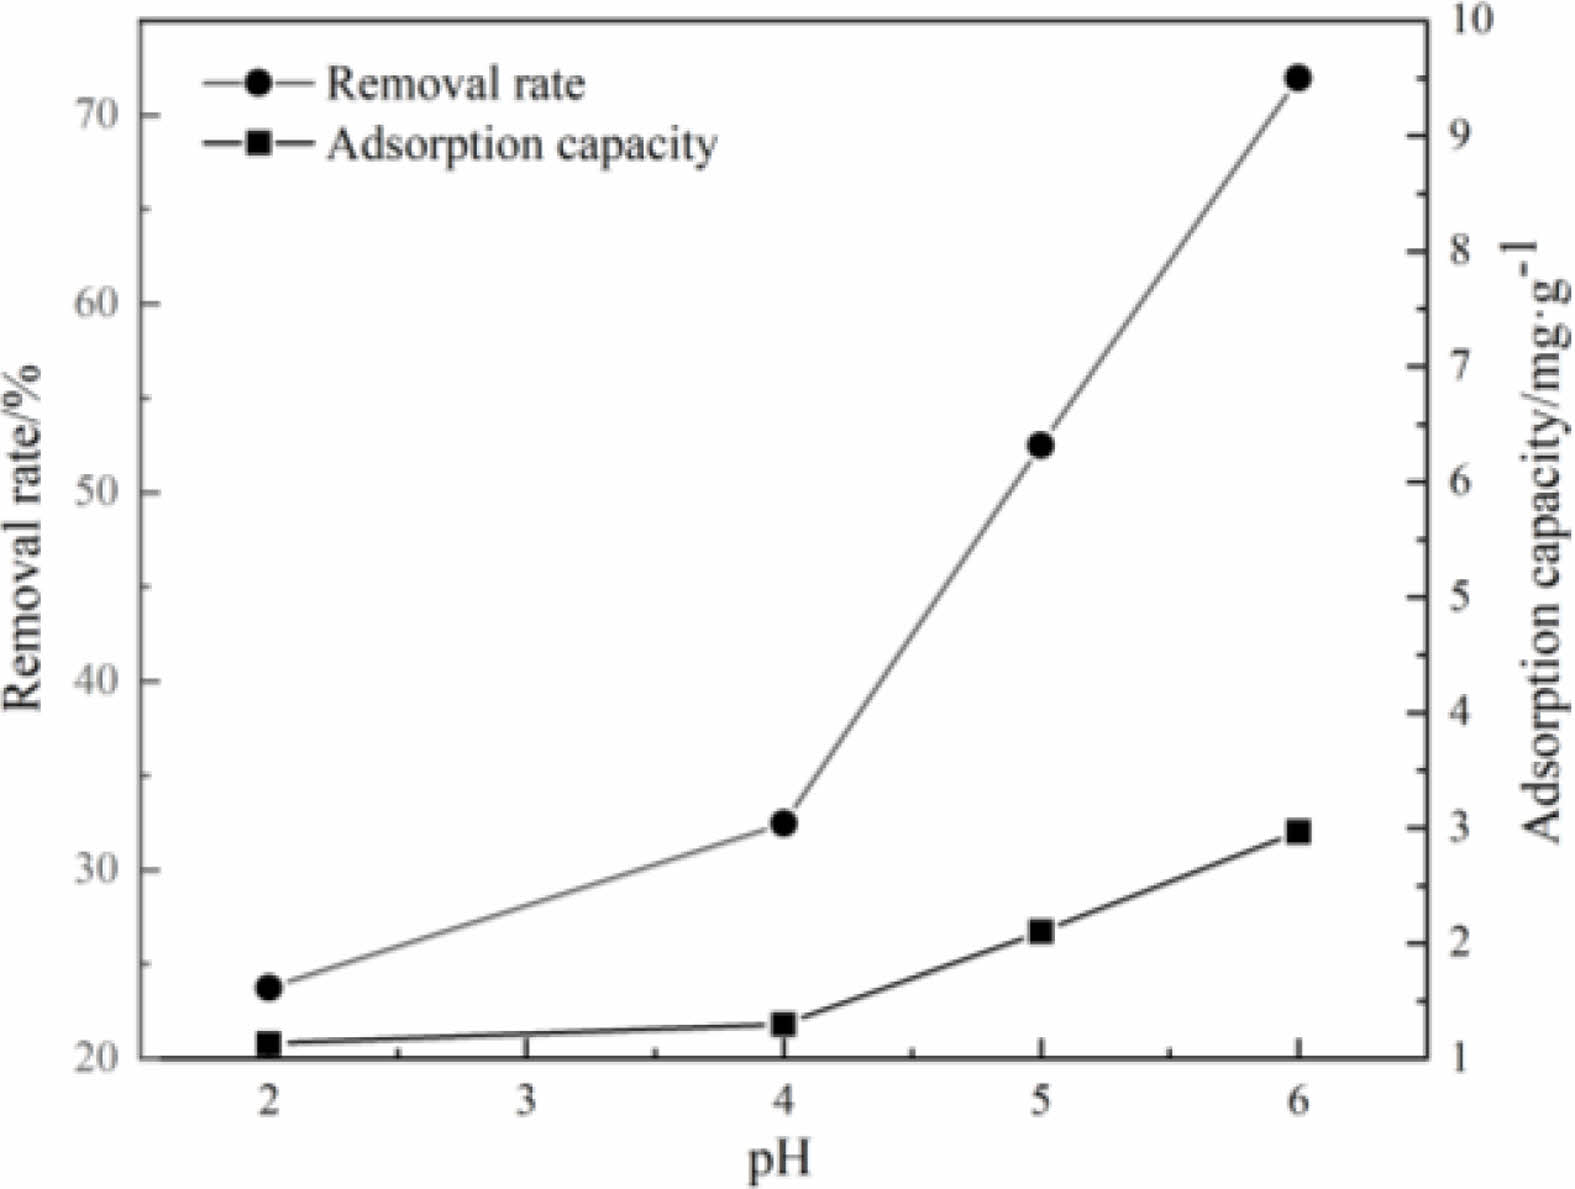
When the temperature of the aqueous solution is 25 ℃, the effect of solution pH values on the removal rate and the adsorption capacity of the samples to Cu(Ⅱ) are shown in Fig. 10. It can be seen that when the pH value of the solution is low, the removal rate of the samples to Cu(Ⅱ) is low too. With the increase of pH value of the solution, the removal rate and the adsorption capacity of the samples are increased gradually. When the pH value of the solution is low, H+ and Cu(Ⅱ) in the solution will compete for the active sites on the surface of the samples [29-33]. With the increase of pH value of the solution, the concentration of H+ in the solution will also decrease, resulting in the enhancement of the interaction between Cu(Ⅱ) and adsorption sites. Therefore, the solution in weak acid state is more suitable for adsorption reaction.
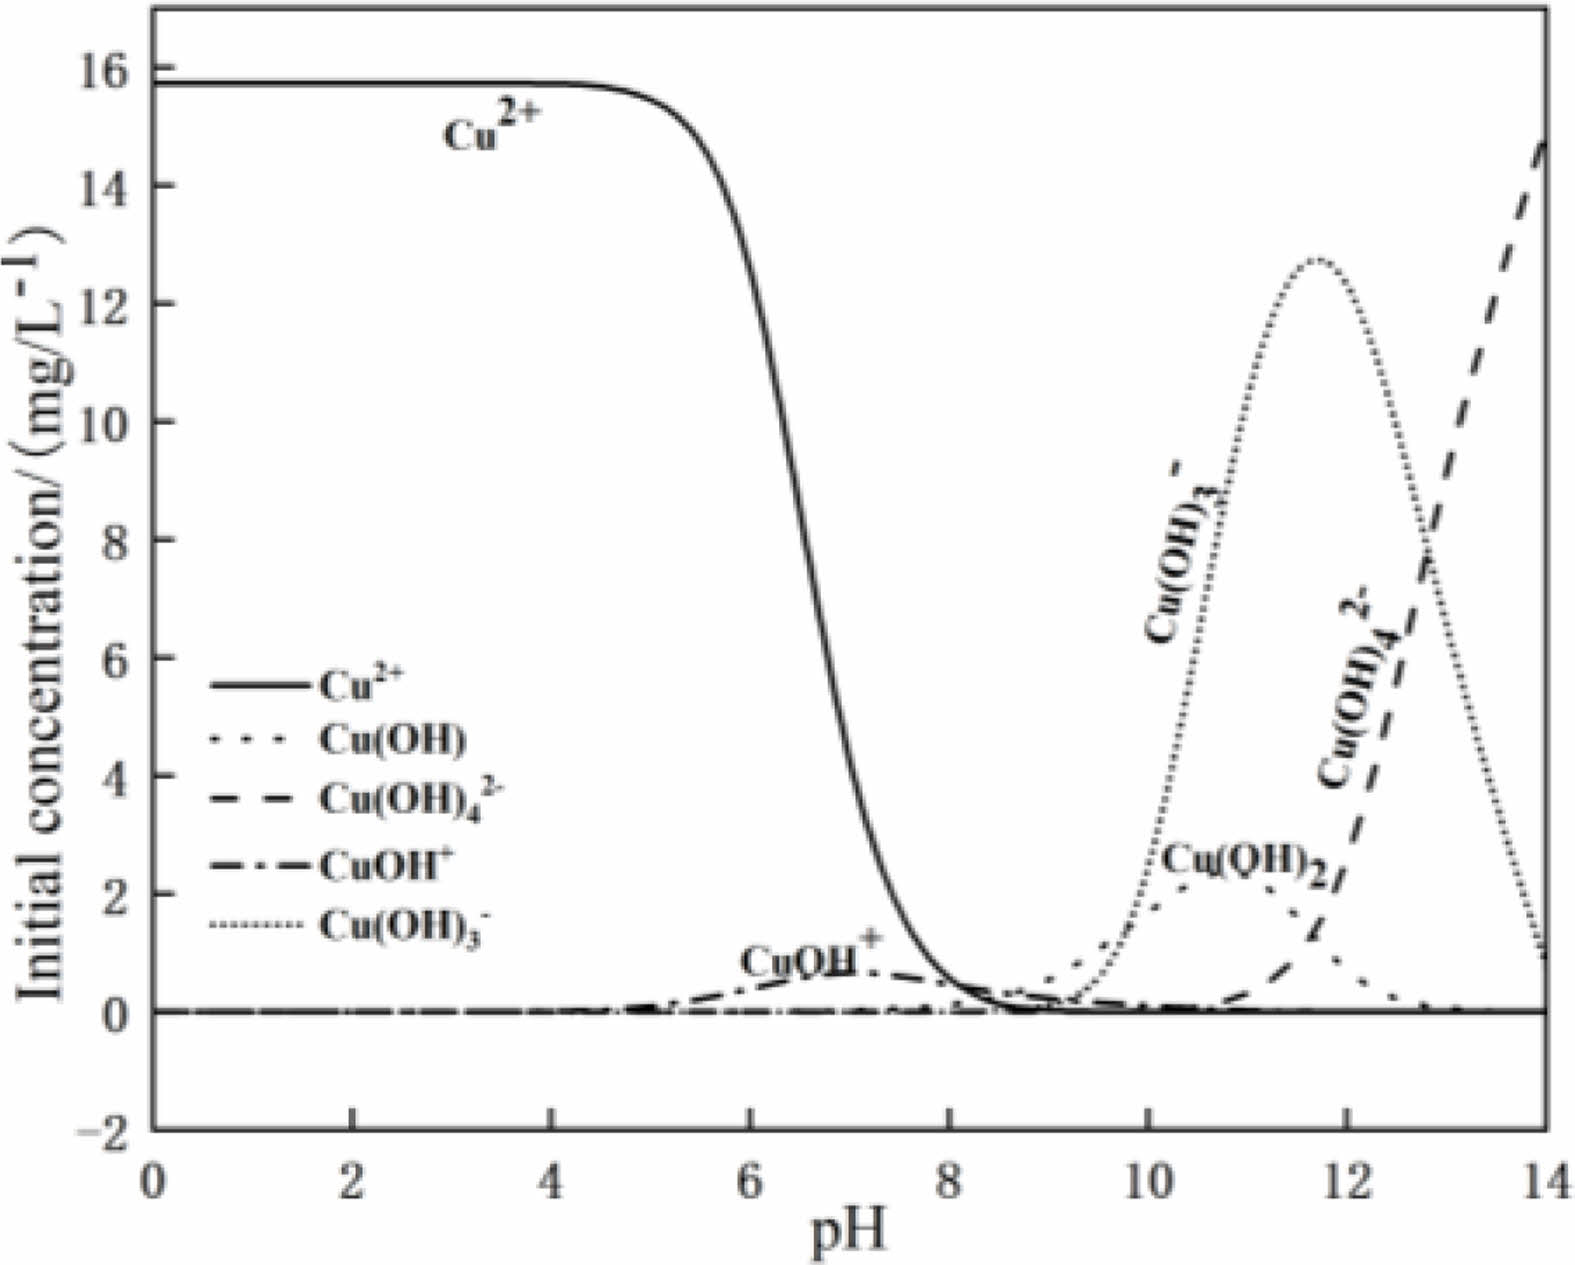
The visual MINTEQ software is used to simulate the morphological distribution of Cu(Ⅱ) in solution with different pH values at 25 ℃. The results are shown in Fig. 11. When the pH value of the solution is less than 7, copper exists in the form of Cu(Ⅱ) and Cu(OH)+. With the increase of the pH value of the solution, hydroxyl groups in the solution combine with Cu(Ⅱ), and the content of Cu(Ⅱ) is decreased. The Cu(Ⅱ) is transformed into Cu(OH)+ [19]. When the pH value of the solution is greater than 7, the copper containing hydroxyl group in the aqueous solution increases, and precipitation of Cu(OH)2 is produced at the same time. In this case, the change of Cu(Ⅱ) concentration in the aqueous solution will no longer affect the adsorption. Therefore, the maximum pH value of the aqueous solution taken in this experiment is 6.
The effect of solution temperature
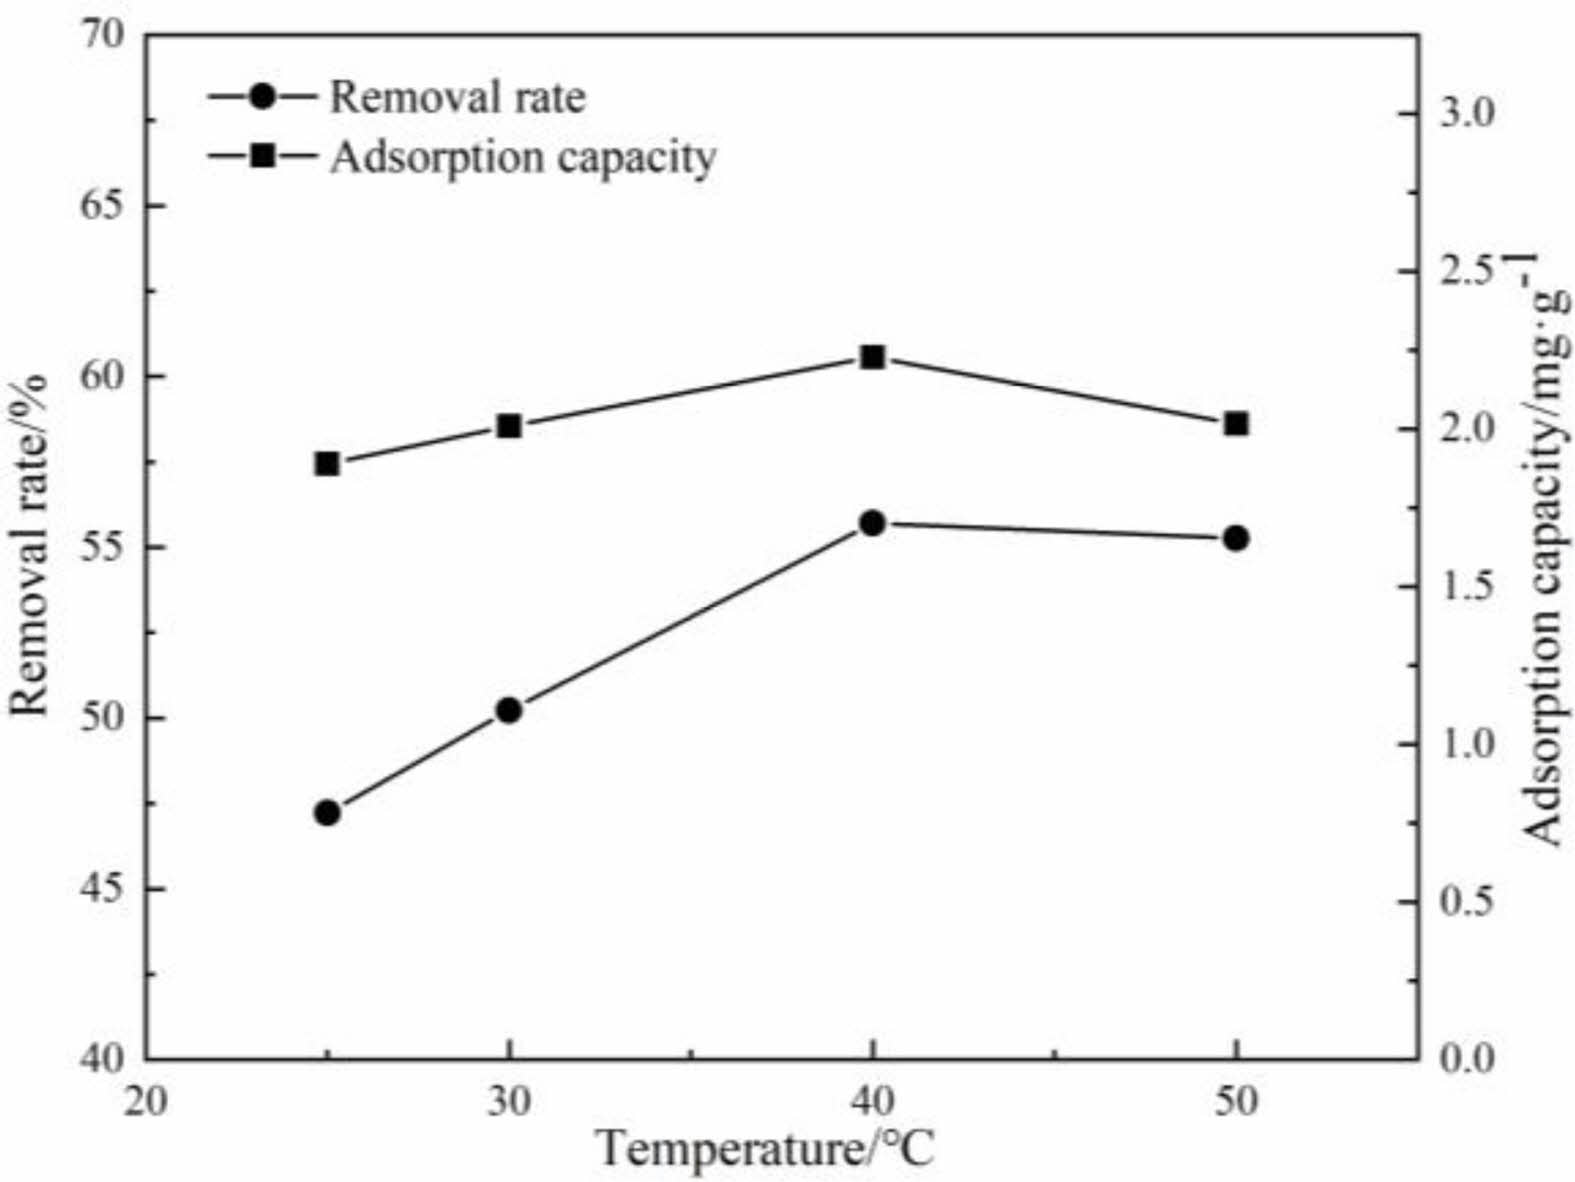
When the pH value of the aqueous solution is 5, the removal rate and the adsorption capacity of the samples to Cu(Ⅱ) by porous ceramics at different test temperatures are shown in Fig. 12. It can be seen that, the removal rate and the adsorption capacity of the samples to Cu(Ⅱ) are increased gradually with the increase of solution temperature, which is due to the increase of the activity of adsorption sites on the sample surfaces. On the other hand, with the increase of test temperature, the molecules move violently, which strengthens the diffusion of Cu(Ⅱ) to the surface or inside of the samples. Therefore, the increase of temperature is conducive to the adsorption process of Cu(Ⅱ).
The effect of initial concentration of the solution
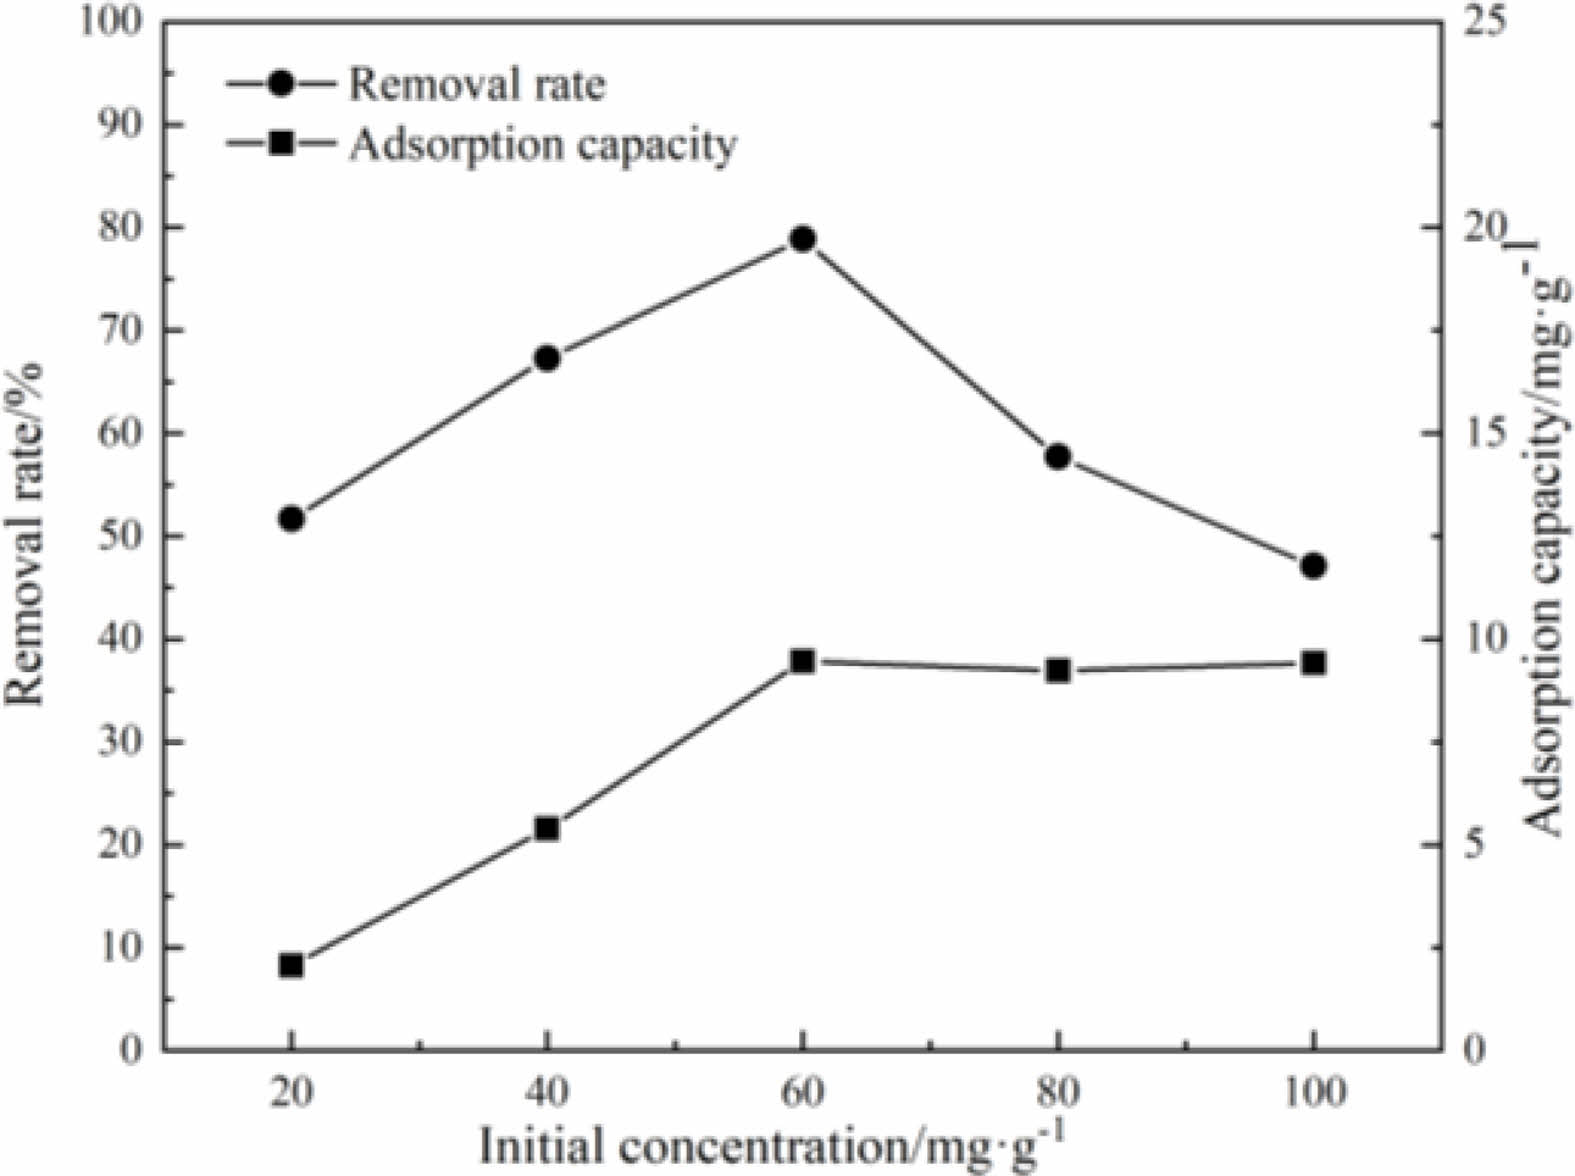
Under the conditions of aqueous solution temperature of 40 ℃, pH value of 5, the different initial concentration of solution effect on the removal rate and the adsorption capacity of the samples to Cu(Ⅱ) are shown in Fig. 13.
It can be seen that when the concentration of Cu(Ⅱ) aqueous solution is in the range of 40 mg/L to 60 mg/L, the removal rate and adsorption capacity of the samples to Cu(Ⅱ) are increased with the increase of the initial concentration of the aqueous solution. When the concentration of Cu(Ⅱ) solution is in the range of 60 mg/L to 100 mg/L, the removal rates are decreased with the increase of initial concentration. This is because the number of adsorption sites on samples is limited. When the initial concentration of the solution is low, the adsorption sites and surface functional groups are surplus. The increase of the initial concentration is conducive to the adsorption of the samples to Cu(Ⅱ) by surfactant sites. With the increase of Cu(Ⅱ) concentration in the aqueous solution, the limited adsorption sites on the surface of samples are completely occupied, and the adsorption is in the saturated state [34, 35].
The effect of test time on adsorption
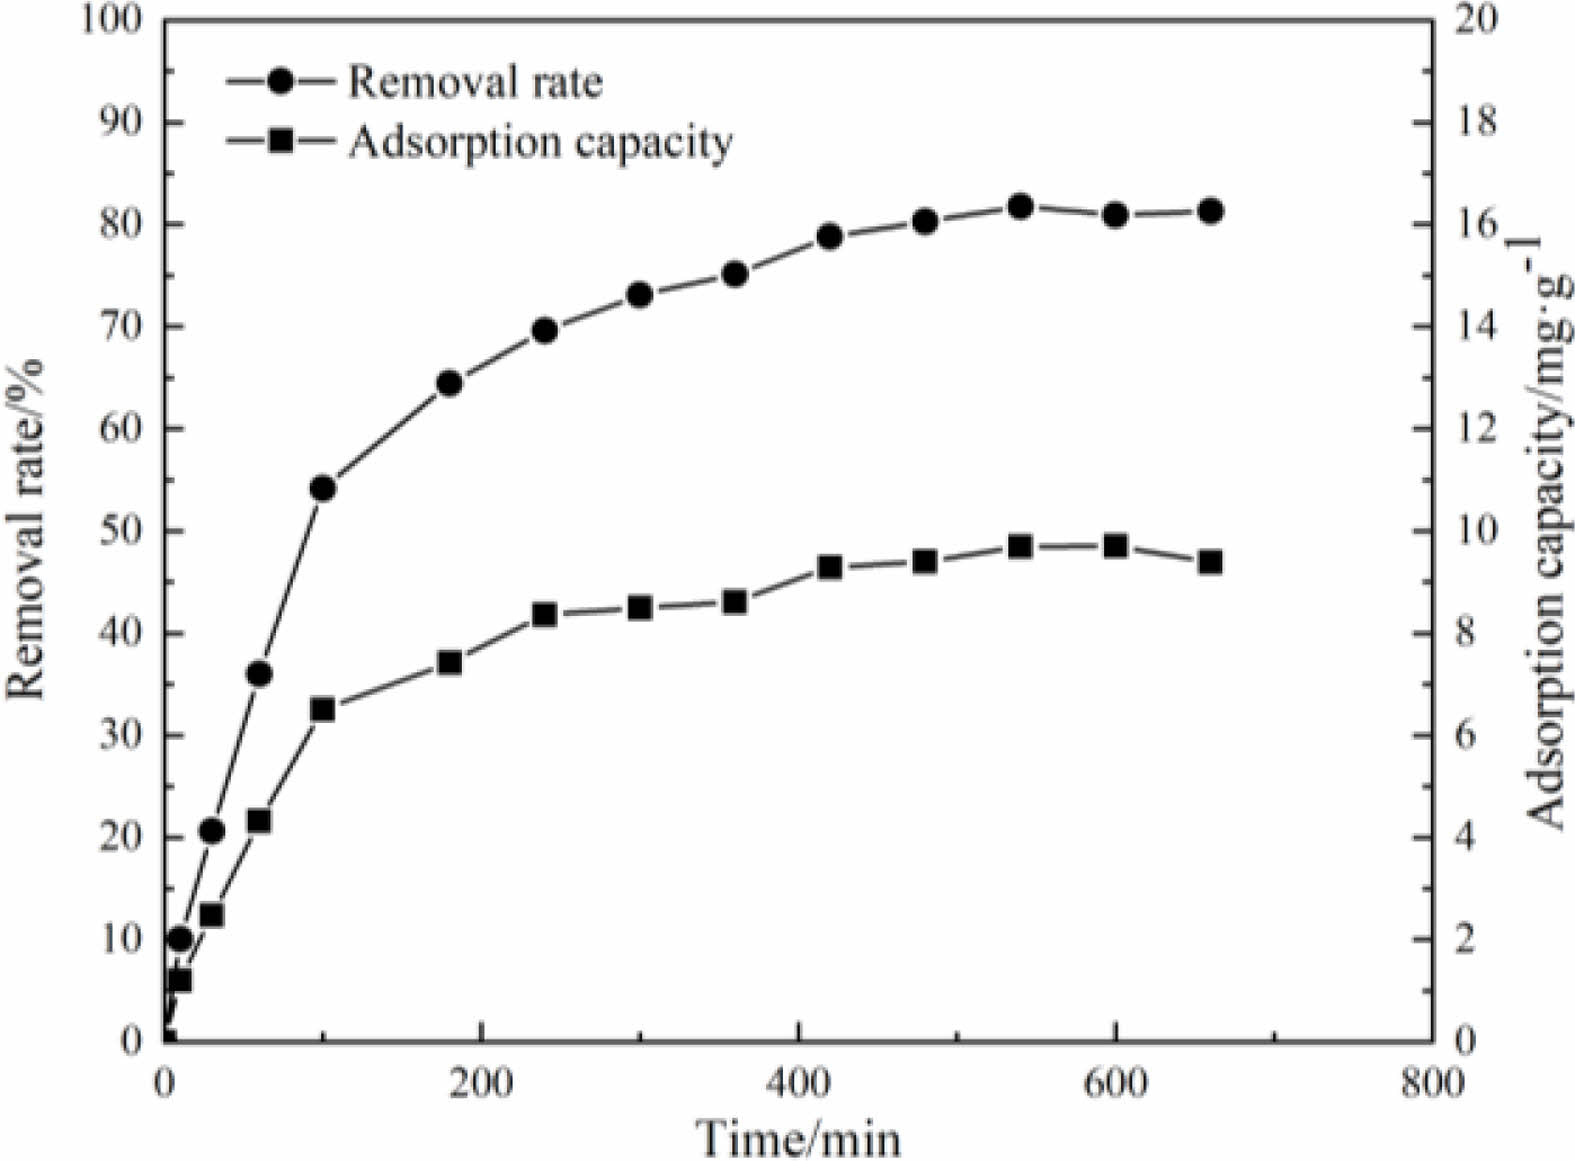
When the temperature of the aqueous solution is 40 ℃, pH value is 5 and the initial concentration of the solution is 60 mg/L, the effect of test time on the removal rate and the adsorption capacity of the samples to Cu(Ⅱ) is studied. The results are shown in Fig. 14. It can be seen that, in the initial stage of the test, the removal rate and the adsorption capacity of the samples are increased with the extension of the test time. After 10 hours of the test, the removal rate and adsorption capacity of the samples are changed little. At the beginning of the test, there are many adsorption sites on the sample surfaces and pores, and the driving force caused by the difference of Cu(II) concentration is strong [36, 37], so Cu(II) can quickly occupy the adsorption sites. Therefore, the removal rate and the adsorption capacity of the samples are increased rapidly in the initial stage [38]. With the progress of the adsorption process, the number of adsorption sites is decreased, and the concentration of Cu(II) in the solution is decreased too, so the adsorption reaches saturation. The removal rate and the adsorption capacity of the samples are not increased. Under the conditions of this test, the adsorption equilibrium is reached after 10 hours. At this time, the removal rate of the samples to Cu(II) is 81.78%, and the adsorption capacity is 9.70 mg/g.
|
Fig. 1 XRD patterns of tailings (a: tailings b: after being calcined) |
|
Fig. 2 Physical phase composition of porous ceramics at different calcination temperatures. |
|
Fig. 3 Closed pore aperture distribution at different sintering temperatures (a: 1150 ℃, b: 1180 ℃, c: 1200 ℃) |
|
Fig. 4 Effects of sintering temperature on physical properties of porous ceramics (4a: open porosity and compressive strength; 4b: water absorption). |
|
Fig. 5 Physical phase composition of porous ceramics at different holding time. |
|
Fig. 6 Effects of holding times on physical properties of porous ceramics (6a: open porosity and compressive strength; 6b: water absorption) |
|
Fig. 7 SEM of porous ceramic samples before and after treatment (a: untreated b: treated) |
|
Fig. 8 FTIR of porous ceramics before and after treatment. |
|
Fig. 9 Hydrolytic deposition process of silane coupling agent |
|
Fig. 10 Effects of pH value on adsorption performance |
|
Fig. 11 Cu(II) speciation distribution at different pH. |
|
Fig. 12 Effects of temperature on adsorption performance |
|
Fig. 13 Effects of initial Cu(II) concentration on adsorption performance. |
|
Fig. 14 Effect of adsorption time on adsorption performance. |
Tailings are used as the main raw material to prepare porous ceramics with diopside phase. The open porosity and compressive strength of the porous ceramic samples are 58.85% and 8.79 MPa respectively. After the samples are surface treated by γ-Aminopropyl triethoxysilane solution, the Cu(Ⅱ) removal rate of the samples reaches 81.78%, and the adsorption capacity is 9.70 mg/g.
(1) In the sintering process, with the increase of sintering temperature and holding time, the content of liquid phase increases. The liquid phase fills the tiny pores between particles, and the pore walls became dens gradually. Therefore, with the increase of sintering temperature and holding time, the open porosity and water absorption of the samples are decreased, and the compressive strength is increased.
(2) After the samples are treated byγ-Aminopropyl triethoxysilane solution. FTIR analysis showed that the symmetrical stretching vibration peak and asymmetric stretching vibration peak of methylene (-CH2-) appeared at 2854 cm-1 and 2923 cm-1 respectively. The absorption peak strength of Si-O bond is increased significantly. This indicates that the methylene(-CH2-) is successfully loaded on the sample surfaces.
(3) After surface treatment, when the temperature of solution is 40 ℃, pH value is 5 and the initial concentration is 60 mg/L, the adsorption reached equilibrium at 10 hours of the experiment. The removal rate of the samples to Cu(Ⅱ) can reach 81.78%, and the adsorption capacity is 9.70 mg/g.
This research was supported by the development and application of hygroscopic materials suitable for hot summer and cold winter areas grant funded by Anhui Jianzhu University (No. JY2021-C-125).
- 1. . Chen, Green Technology. 11[04] (2020) 58.
- 2. X.-Y. Zhu, N. Sun, Y. Huang, Y.-G. Zhu, and W.-Q. Wang, J. Non-Cryst. Solids. 571[1] (2021) 121063.
-

- 3. L. Jie, Z.-J. Gao, J.-S. Liang, H. Zhang, and J.-P. Meng, Ceram. Int. 47[18] (2021) 25214-25220.
-
- 4. 4. L.-Y. Wang, L.-Q. An, J. Zhao, S.-Z. Shimai, X.-J. Mao, J. Zhang, J. Liu, and S.-W. Wang, J. Adv. Ceram. 10[4] (2021) 852-859.
-
- 5. M. Kollep, G. Konstantinou, J. Madrid-Wolff, A. Boniface, L. Hagelüken, P.V.W. Sasikumar, G. Blugan, P. Delrot, D. Loterie, J. Brugger, and C. Moser, Adv. Eng. Mater. 24[7] (2022) 2101345-55.
-
- 6. L. Han, F.-L. Li, X.-Y. Yao, L.-H. Dong, M.-T. Luo, H.-J. Zhang, Q.-L. Jia, and S.-W. Zhang, Ceram. Int. 46[14] (2020) 22819-25.
-
- 7. B. Liang, M.-X. Zhang, H. Li, M. Zhao, P.-F. Xu, and L.-B. Deng, Ceram. Int. 47[16] (2021) 23338-23349.
-
- 8. W. Dang, W.-H. Wang, P.-F. Wu, F.-P. Li, K. Zhao, and Y.-F. Tang, Ceram. Int. 48[7] (2022) 9835-9841.
-
- 9. B. Xia, Z.-P. Wang, L.-Z. Gou, M. Zhang, and M. Guo, Ceram. Int. 48[8] (2022) 10472-10479.
-
- 10. T. Hui, H.-J. Sun, and T.-J. Peng, J. Alloys Compd. 885[2] (2021) 160967.
-
- 11. Y.-H. Ren, Q. Ren, X.-L. Wu, J.-L. Zheng, and O. Hai, Mater. Chem. Phys. 238[8] (2019) 121929.
-
- 12. Q.-X. Huang, T.-Y. Liu, J.-S. Zhang, X. He, J.-L. Liu, Z.-W. Luo, and A.-X. Lu, Constr Build Mater. 253[8] (2020) 118870.
-
- 13. J.-N. Wang, K.-D. Xu, Z.-X. Li, Y.-L. Yang, Q.-X. Li, Y. Bao, H. Yang, L.-L. Ding, R.-X. Zhang, Y.-Y. Wang, and L. Yao, J Ceram Process Res. 23[1] (2022) 79-85.
-
- 14. T. Chen, L. Liang, B. Di, and G. Gian, J Ceram Process Res. 22[6] (2021) 597-604.
-
- 15. Z.-J. Xue, N. Liu, H.-X. Hu, J.-Y. Huang, Y.-K. Kalkhajeh, X.-Y. Wu, N. Xu, X.-F. Fu, and L.-C. Zhan, Roy. Soc. Open. Sci. 6[4] (2019).
-
- 16. N. Chen, Z.-Y. Zhang, C.-p. Feng, N. Sugiura, M. Li, and R.-Z. Chen, J Colloid Interface Sci. 348[2] (2010) 579-584.
-
- 17. J.-H. Chen, P.-S. Liu, and W. Cheng, Multidiscip. Model. Ma. 15[3] (2019) 659-772.
-
- 18. Y.-W. Zheng, J.-D. Wang, D.-H. Li, C. Liu, Y. Lu, X. Lin, and Z.-F. Zheng, J. Anal. Appl. Pyrolysis. 158[1] (2012) 105269.
-
- 19. T.-H. Chen, H.-W. Li, H.-L. Wang, X.-H. Zou, H.-B. Liu, D. Chen, and Y.-F. Zhou, Water, Air, Soil. Poll. 230[12] (2019).
-
- 20. J.-Y. Zhang, M.-W. Yan, G.-C. Sun, and K.-Q. Liu, Ceram. Int. 47[6] (2021) 8256-8264.
-
- 21. D. Chen, N. Tu, C. Si, M. Yin, and X. Wang, Water. Sci. Technol. 80[5] (2019) 884-891.
-
- 22. H.-M. Xv, Z.-H. Huang, Y.-G. Liu, M.-H. Fang, and C. Che, China Non-metallic Mineral Industry Guide. 33[3] (2012) 7.
- 23. Z.-M. Wang, X.-J. Lyu, G. Yao, P. Wu, J.-J. Wang, and J. Wei, J. Clean. Prod. 262[6] (2020) 121345.
-
- 24. J.-G. Song, L. Chen, C.-L. Pang, J. Zhang, W.-G. Shi, S.-L. Guo, X.-Z. Wang, and M.-H. Xu, J Ceram Process Res. 19[1] (2018) 11-14.
- 25. D. Lee, H.-S. Hong, H. Jeong, S.-S. Ryu, J Ceram Process Res. 23[2] (2022) 149-153.
-
- 26. Q.-T. Zhang, in "Fundamentals of inorganic materials science" (Chemical Industry Press, 2006.) p. 377.
- 27. C.-J. Liang, S.-M. Liu, and G.-W. Liu, Chinese Ceram. 57[9] (2021) 52-57.
- 28. X.-M. Zhu and J.-K. Zhang, in "Organic silicon material foundation" (Chemical Industry Press, 2013.) p. 570-577.
- 29. Z.-C. Ma, Q. Zhao, X.-Q. Zhao, J.-C. Wei, and Q. Li, Eng. Constr. 53[11] (2021) 6.
- 30. L.-H. Guo, Q.-Q. Shen, Z.-G. Liu, A.-Q. Zhang, S.-H. Wang, and H.-S. Jia, Environ. Sci. Technol. 34[10] (2011) 171-173.
- 31. C.-L. Zhang, M.-Y. Zhang, Q. Chang, Desalin Water Treat. 53[7] (2013) 1909-16.
-
- 32. M.-R. Awual, N.-H. Alharthi, M.-M. Hasan, M.-R. Karim, A. Islam, H. Znad, M.-A. Hossain, M.-E. Halim, M.-M. Rahman, and M.-A. Khaleque, Chem Eng. J. 324[1] (2017) 130-9.
-
- 33. J. Li, J.-J. Tong, X.-H. Li, Z.-J. Yang, Y.-C. Zhang, G.-W. Diao, J Mater Sci. 51[23] (2016) 10375-85.
-
- 34. M.-L. Ba, Y. Cai, and J.-H. Yu, Water purification technology. 40[11] (2021) 9.
- 35. U. Rentsennorov, B. Davaabal, B. Dovchin, J. Temuujin, J Ceram Process Res. 22[2] (2021) 232-9.
-
- 36. Z. Deng, E.-A. Oraby, and J.-J. Eksteen, Sep. Purif. Technol. 236 (2020) 116280.
-
- 37. Y.-R. Zhu, X.-M. Yue, F.-Z. Xie, Adsorp Sci Technol. 38[7-8] (2020) 254-70.
-
- 38. H.-B. Li, K.-H. Zhang, Q.-D. Chen, W.-W. Dong, G.-L. Li, Y.-T. Yang, and F.-Z. Xie, J. Comp. Mater. 38[04] (2021) 1128-1138.
 This Article
-
2022; 23(6): 845-852
Published on Dec 31, 2022
- 10.36410/jcpr.2022.23.6.845
- Received on May 16, 2022
- Revised on Jul 31, 2022
- Accepted on Sep 3, 2022
Services
- Abstract
introduction
materials and experimental procedure
results and discussion
conclusion
- Acknowledgements
- References
- Full Text PDF
Shared
Correspondence to
- Shaofeng Zhu
-
Department of Materials and Chemical Engineering, Anhui Jianzhu University, 230022, China
Tel : +8613965020668 - E-mail: zhusf@ahjzu.edu.cn
Clean-Energy Research Institute(CRI), Hanyang University, 222, Wangsimni-ro, Seongdong-gu, Seoul, 04763, Korea
E-mail: jcpr@hanyang.ac.kr