


- The effect of molar ratio and annealing on crystal structure of gadolinium-gallium garnet nanopowders synthesized by sol-gel method
Hümeyra Örücü*
Faculty of Science, Department of Physics, Ege University, 35100, Bornova, İzmir, Turkey
This article is an open access article distributed under the terms of the Creative Commons Attribution Non-Commercial License (http://creativecommons.org/licenses/by-nc/4.0) which permits unrestricted non-commercial use, distribution, and reproduction in any medium, provided the original work is properly cited.
Nanocrystalline gadolinium-gallium garnet samples were fabricated via the sol-gel pechini method with citric and nitric acid for chelation and polyethylene-glycol for crosslinked. The influence of molar ratio [Gd]/[Ga] on the formation of the gadolinium-gallium garnet crystalline structure was examined. The development of nanocrystalline structure and phase composition of the powders was studied by X-ray powder diffraction (XRD), scanning electron microscopy (SEM), Thermogravimetric analysis (DTA/TG), and Fourier transform infrared spectroscopy (FT-IR). XRD patterns displayed that nano-sized and well-crystallized gadolinium-gallium garnet powders were fabricated at the annealing temperature as low as 800 °C for two hours. By applying the Scherrer formula and Pielaszek  method, the crystallite sizes of the samples are calculated, and grain size distribution is determined. Nanopowders show spherical bubble forms of thin spherical shells in the range of 400-500 nm, and the calculated size of the particles is about 20-50 nm
Keywords: Gadolinium gallium garnet, GGG, Sol-gel method, Optical materials, Nanopowder
Ceramic-based phosphor materials activated by rare-earth or transition metal ions have received considerable attention in the investigation of possible optical, magnetic, energy, and biotechnological applications such as white light-emitting diodes (WLEDs), displays, biolabels, magnetic resonant imaging (MRI), and magnetic refrigeration materials [1-6]. One of the most popular groups of host materials is garnets, which crystallize in a cubic structure with space group Ia3d. In this study, Gadolinium-gallium garnet (Gd3Ga5O12) is chosen as the host material as a vital complex oxide and an important class of optical and magnetic ceramic material. It is the subject of interest as lanthanide-based luminescence phosphors and paramagnetic material for low-temperature magnetic refrigerators, substrate for magneto-optical epitaxial films, and laser materials [7-9]. Gadolinium-gallium garnet powders with high density and transparency are also used as a substitute material for single crystal growth and transparent ceramic production process [10-12]. The optical characteristics of gadolinium gallium garnet phosphor depend crucially on the method of preparation, nanoparticle size, and doping ions [9, 13-17]. The synthesis technique and the particle size from bulk to nanostructure have also critical effects on the magnetic properties of lanthanide-doped GGG and Gd-based garnet-ferrite with the general structure Gd3Fe5O12 [18-21]. There have been many attempts to produce gadolinium-gallium garnet powder base using different annealing methods and optimized fabrication procedures using other solvents and polymerizing agents to lower the cost, shorten the manufacture period, and annealing temperature, and eliminate the decomposition of digallium trioxide at high temperatures. The most important techniques used for synthesizing gadolinium-gallium garnet powders can be summarized as the co-precipitation method, combustion method, solid-state method, and sol-gel method [8, 17, 22-36]. Among these methods, the sol-gel method has the advantages of being a simple nanocrystalline functional material fabrication process, with a low annealing temperature and short production period compared to conventional methods [37, 38]. The variety of sol-gel process conditions provides the production of ceramic nanophosphor materials which differ in morphology, phase, homogeneity, and size properties [39]. Undoped and rare-earth ion doped GGG nanopowders have been reported to be synthesized by the sol-gel method by changing starting materials, stirring heat and time, chelating agents, complexing agents, pH value, annealing temperature and time [9-11, 40-43]. In this work, the fabrication and characterization results of gadolinium-gallium garnet nanopowders were summarized using the sol-gel pechini method with citric and nitric acid for chelation and polyethylene-glycol (PEG) for crosslinked. The influence of the stoichiometric molar ratio [Gd]/[Ga] on the formation of the gadolinium-gallium garnet nanocrystalline structure was investigated. The crystalline phase evolution was exhibited by an X-ray diffractometer (XRD). Scanning electron microscopy (SEM) photographs, Thermogravimetric analysis (DTA/TG), and Fourier transform infrared (FT-IR) patterns were recorded to characterize the structural and morphological properties of gadolinium-gallium garnet powders. The effects of annealing temperature on phase purity, particle size, and crystallization of gadolinium-gallium garnet were examined and optimum conditions were determined. In our previous studies, these optimum sol-gel pechini conditions allowed us to obtain successfully white light emission from Yb3+/Er3+:GGG and Yb3+/Er3+/Tm3+: GGG nanophosphors based on the upconversion [13, 14].
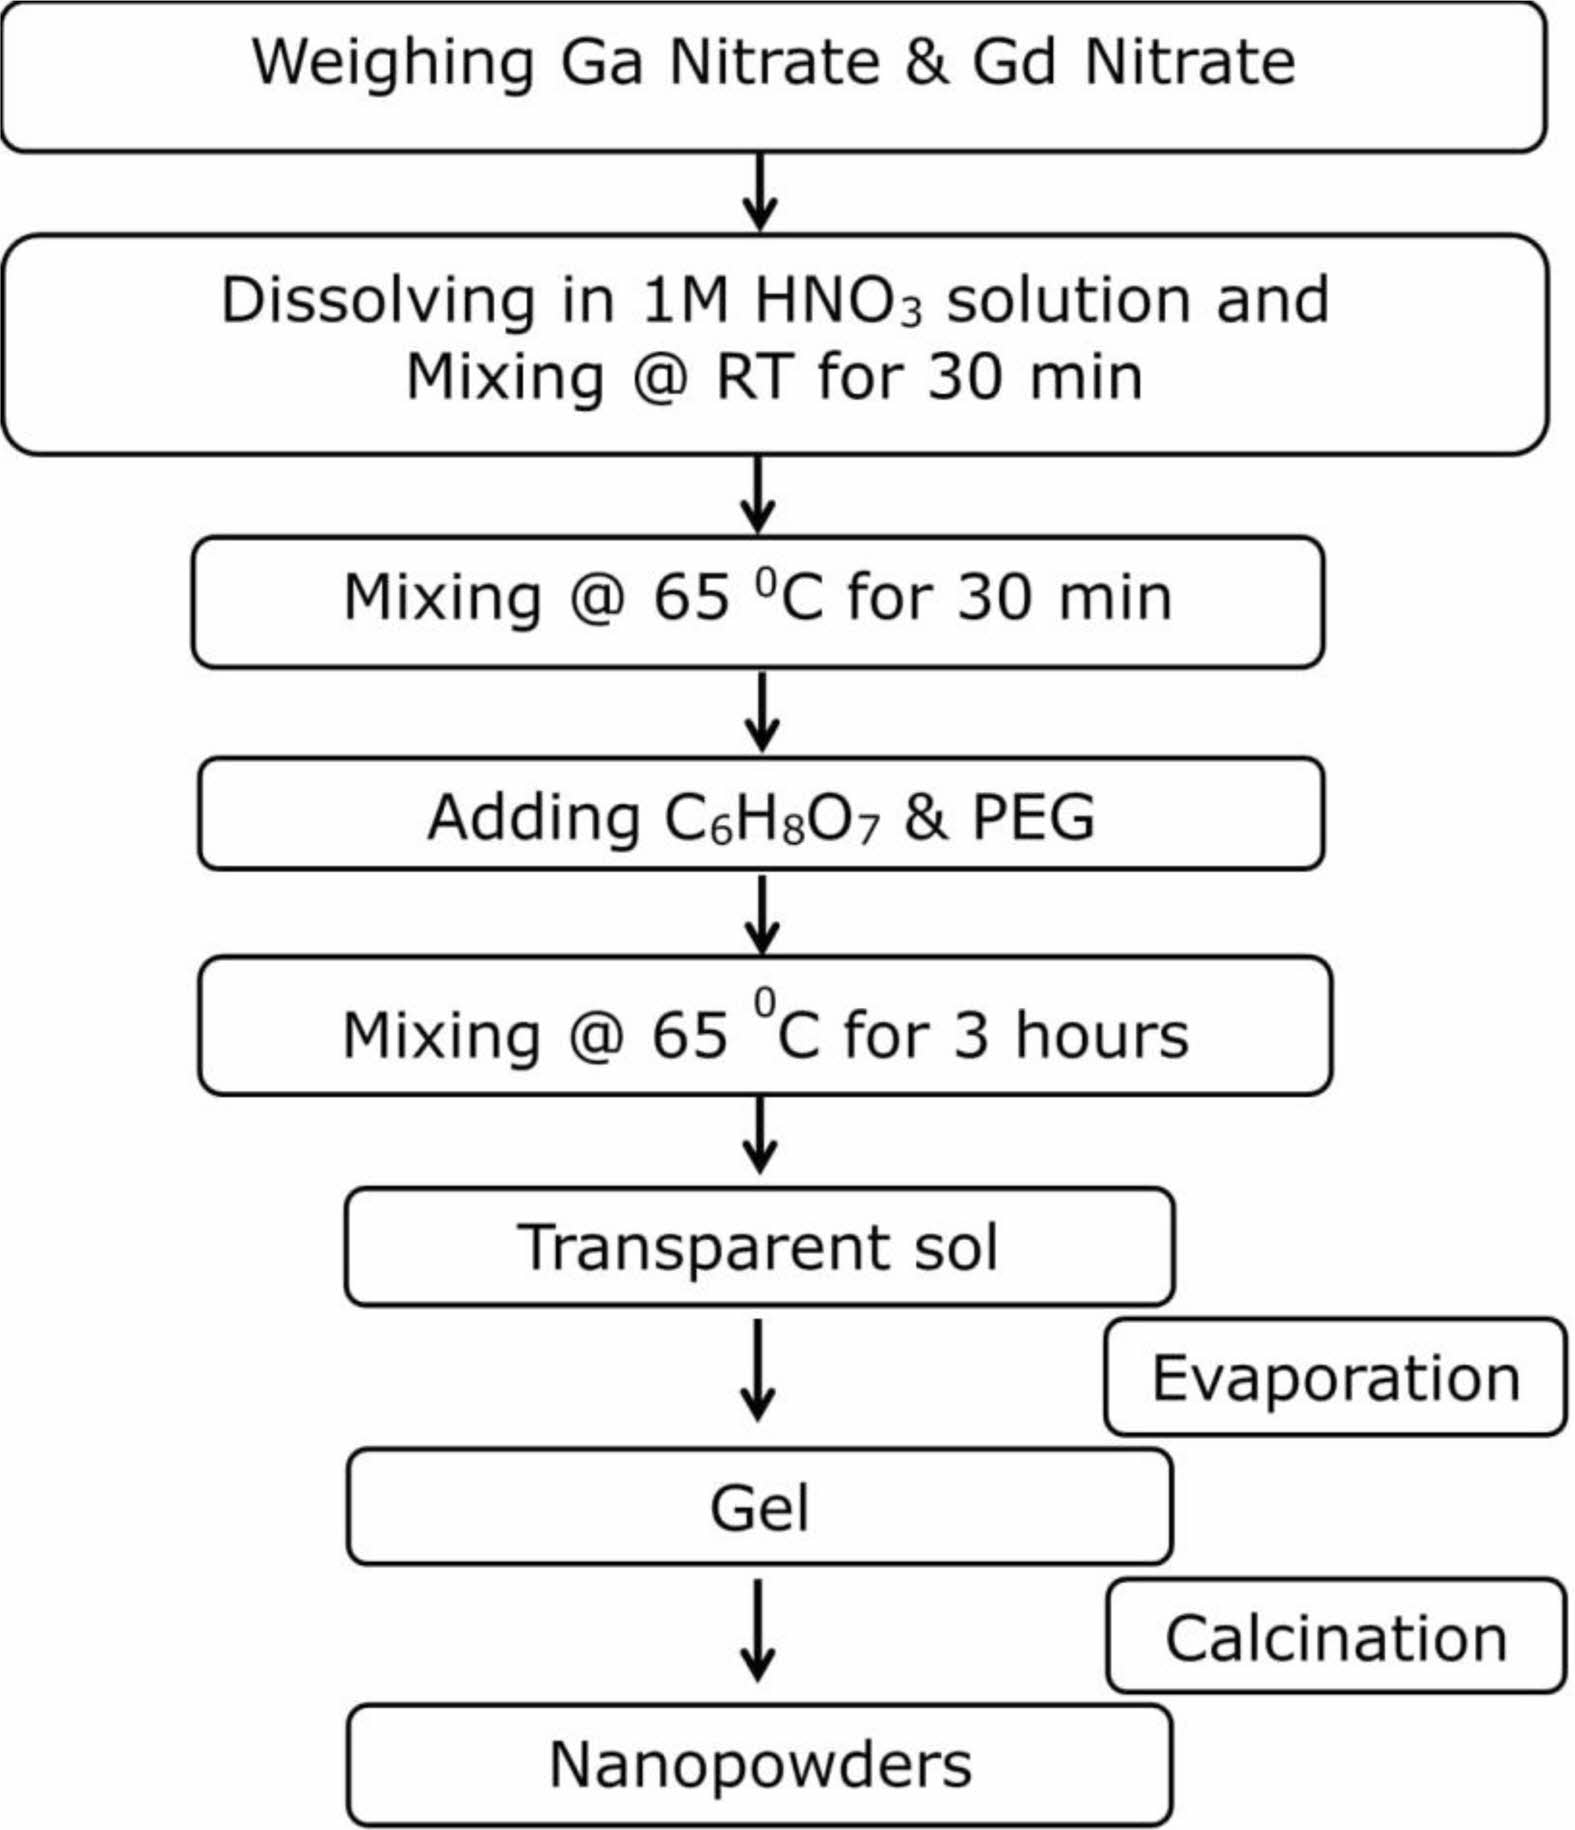
Gadolinium-gallium garnet nanopowders were synthesized using the sol-gel pechini method in an air atmosphere. Chemicals were all analytical grades and purchased from Sigma-Aldrich. Double-distilled water was used to synthesize the solutions. Stoichiometric amounts of high-purity Ga(NO3)3xH2O (Aldrich, 99.99 %) and Gd(NO3)3x6H2O (Aldrich, 99.99%) reagents were dissolved in 25 mL of a 1 M aqueous stirring solution of nitric acid (HNO3). After mixing for 30 minutes adequately, the solution was heated to 65 °C under stirring using a magnetic agitator for another 30 minutes. A suitable amount of citric acid (4.2 g) was mixed as a chelating agent to the above solution. The citric acid ratio of the total mole number of the solution was 0.02 mol% (mol/L). Then, 12.6 g polyethylene-glycol was used as a cross-linking agent, corresponding to three times the mass amount of citric acid. PEG density was dPEG=1.204 g/mL. The obtained solution was continuously stirred at 65 °C for three hours until the highly transparent sol became gel by slow evaporation. After aging for ten days at room temperature, the gel was annealed in a ceramic furnace, altering temperatures from 500 to 1200 °C at 7 °C/min-1 heating rate without an intermediate annealing step and held at each temperature for different hours in the air. The resulting powders were lightly crushed in an agate mortar to the fine powder for two minutes. The detailed process for preparing and annealing gadolinium-gallium garnet nanopowders by the sol-gel method is illustrated in Fig. 1.
The primary molar ratio of [Gd]/[Ga] is determined as 38/62 according to the phase diagram for the Gd2O3-Ga2O3 system [44], and the samples are labeled as GGG. To investigate the influence of stoichiometric molar ratios on crystallinity, two more precursors with different molar ratios [Gd]/[Ga]=36/64 and [Gd]/[Ga]=40/60 were prepared using the same route and labeled as GGG1 and GGG2, respectively.
The crystal structure and phase evolution were revealed by the X-ray diffraction (XRD) (Rigaku-XRD 2200 D/MAX, Japan), working at 40 kV source voltage and 30 mA with Cu-Ka radiation (l = 0.15418 nm). The particle size and the morphology of the powders were observed using a scanning electron microscope (SEM) (FEI Quanta 250 FEG). Fourier transform infrared (FT-IR) spectra were analyzed with a Perkin Elmer Spectrum 100 FT-IR Spectrometer with the KBr pellet technique. Thermogravimetric analysis (DTA/TGA) of the samples was performed with a Perkin Elmer Pyris thermal analyzer by heating 5 mg powder samples in ceramic crucibles from room temperature to 1000 °C at a heating rate of 10 °C/min under nitrogen flow.
|
Fig. 1 The preparation process of Gadolinium-Gallium Garnet nanopowders by sol-gel method. |
Structural analysis
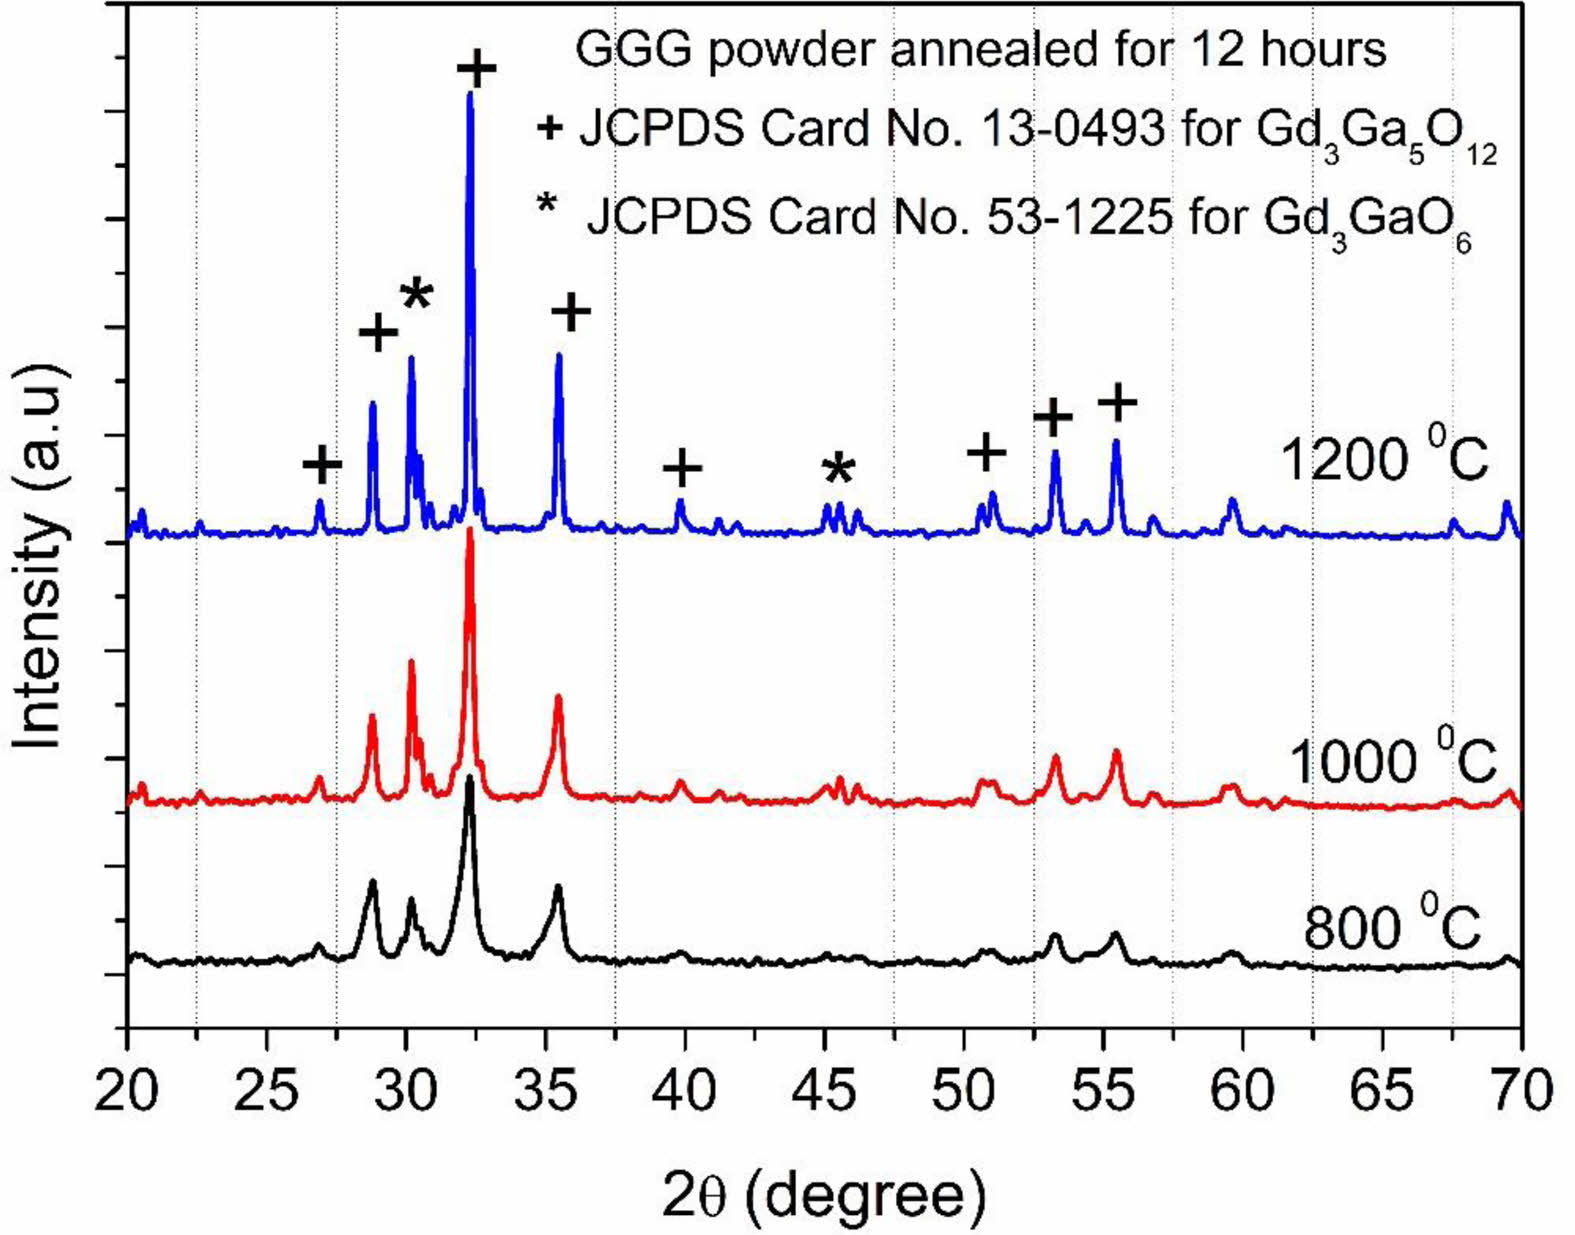
The XRD patterns of GGG samples annealed at different temperatures from 800 to 1200 °C for 12 hours are represented in Fig. 2. The XRD peaks are compatible with that of the gadolinium-gallium garnet crystal structure (JCPDS Card No.13-0493), and the XRD results of the obtained powders confirm the formation of well-crystallized gadolinium-gallium garnet. It is also revealed that gadolinium-gallium garnet was well crystallized even at a relatively low annealing temperature (800 °C). The diffraction peak at 2q=30.2° indicates that another phase, Gd3GaO6 (JCPDS Card No. 53-1225), was also formed (Fig. 2). As the annealing temperature increase, the intensity of the peaks becomes strong, and the shape of the peaks becomes narrow.
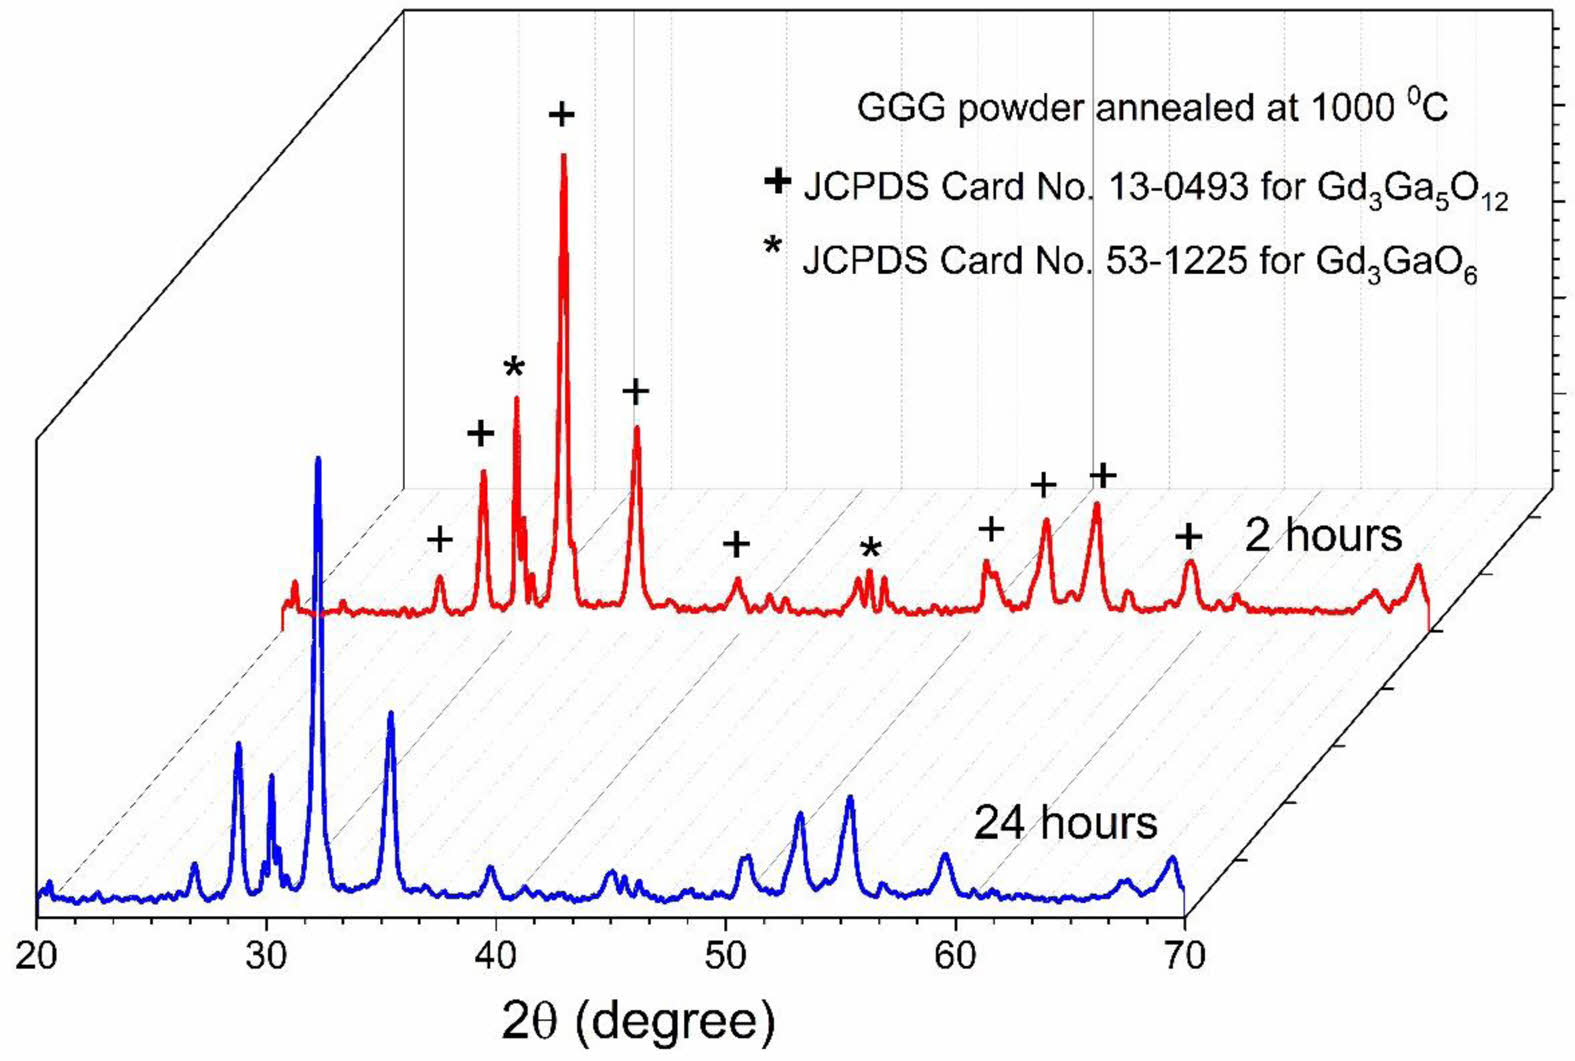
Fig. 3 displays the XRD patterns of GGG samples calcined at 1000 °C for 2 and 24 hours annealing durations. The optimized annealing duration was chosen for 2 hours due to the formation of crystallization.
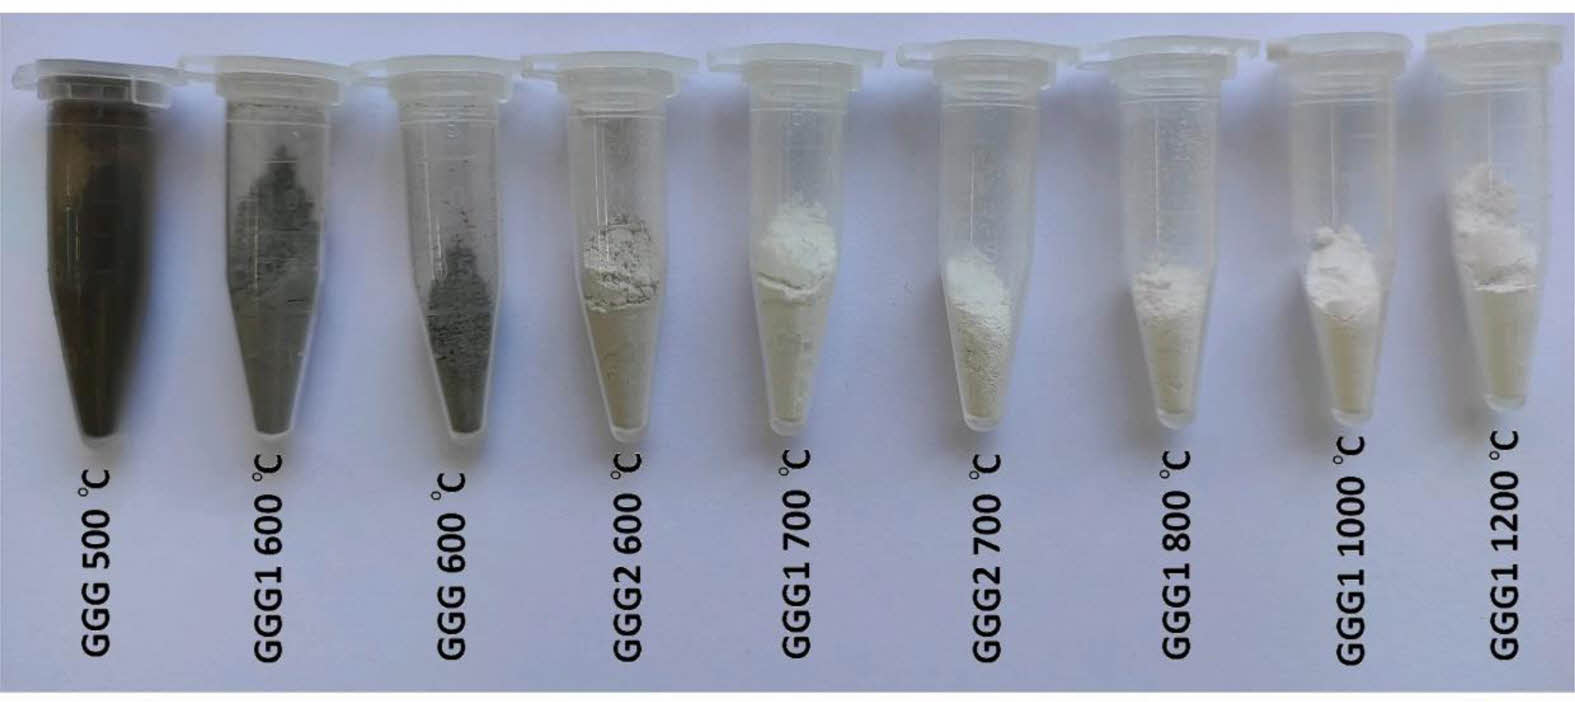
GGG, GGG1, and GGG2 nanopowders were synthesized to investigate the effect of molar ratio on the crystal structure of gadolinium-gallium garnet nanopowders to eliminate the second phase. X-ray diffraction patterns as a function of annealing temperature indicate that all samples are amorphous up to 700 °C. The pictures of GGG, GGG1, and GGG2 powders annealed from 500 to 1200 °C are illustrated in Fig. 4.
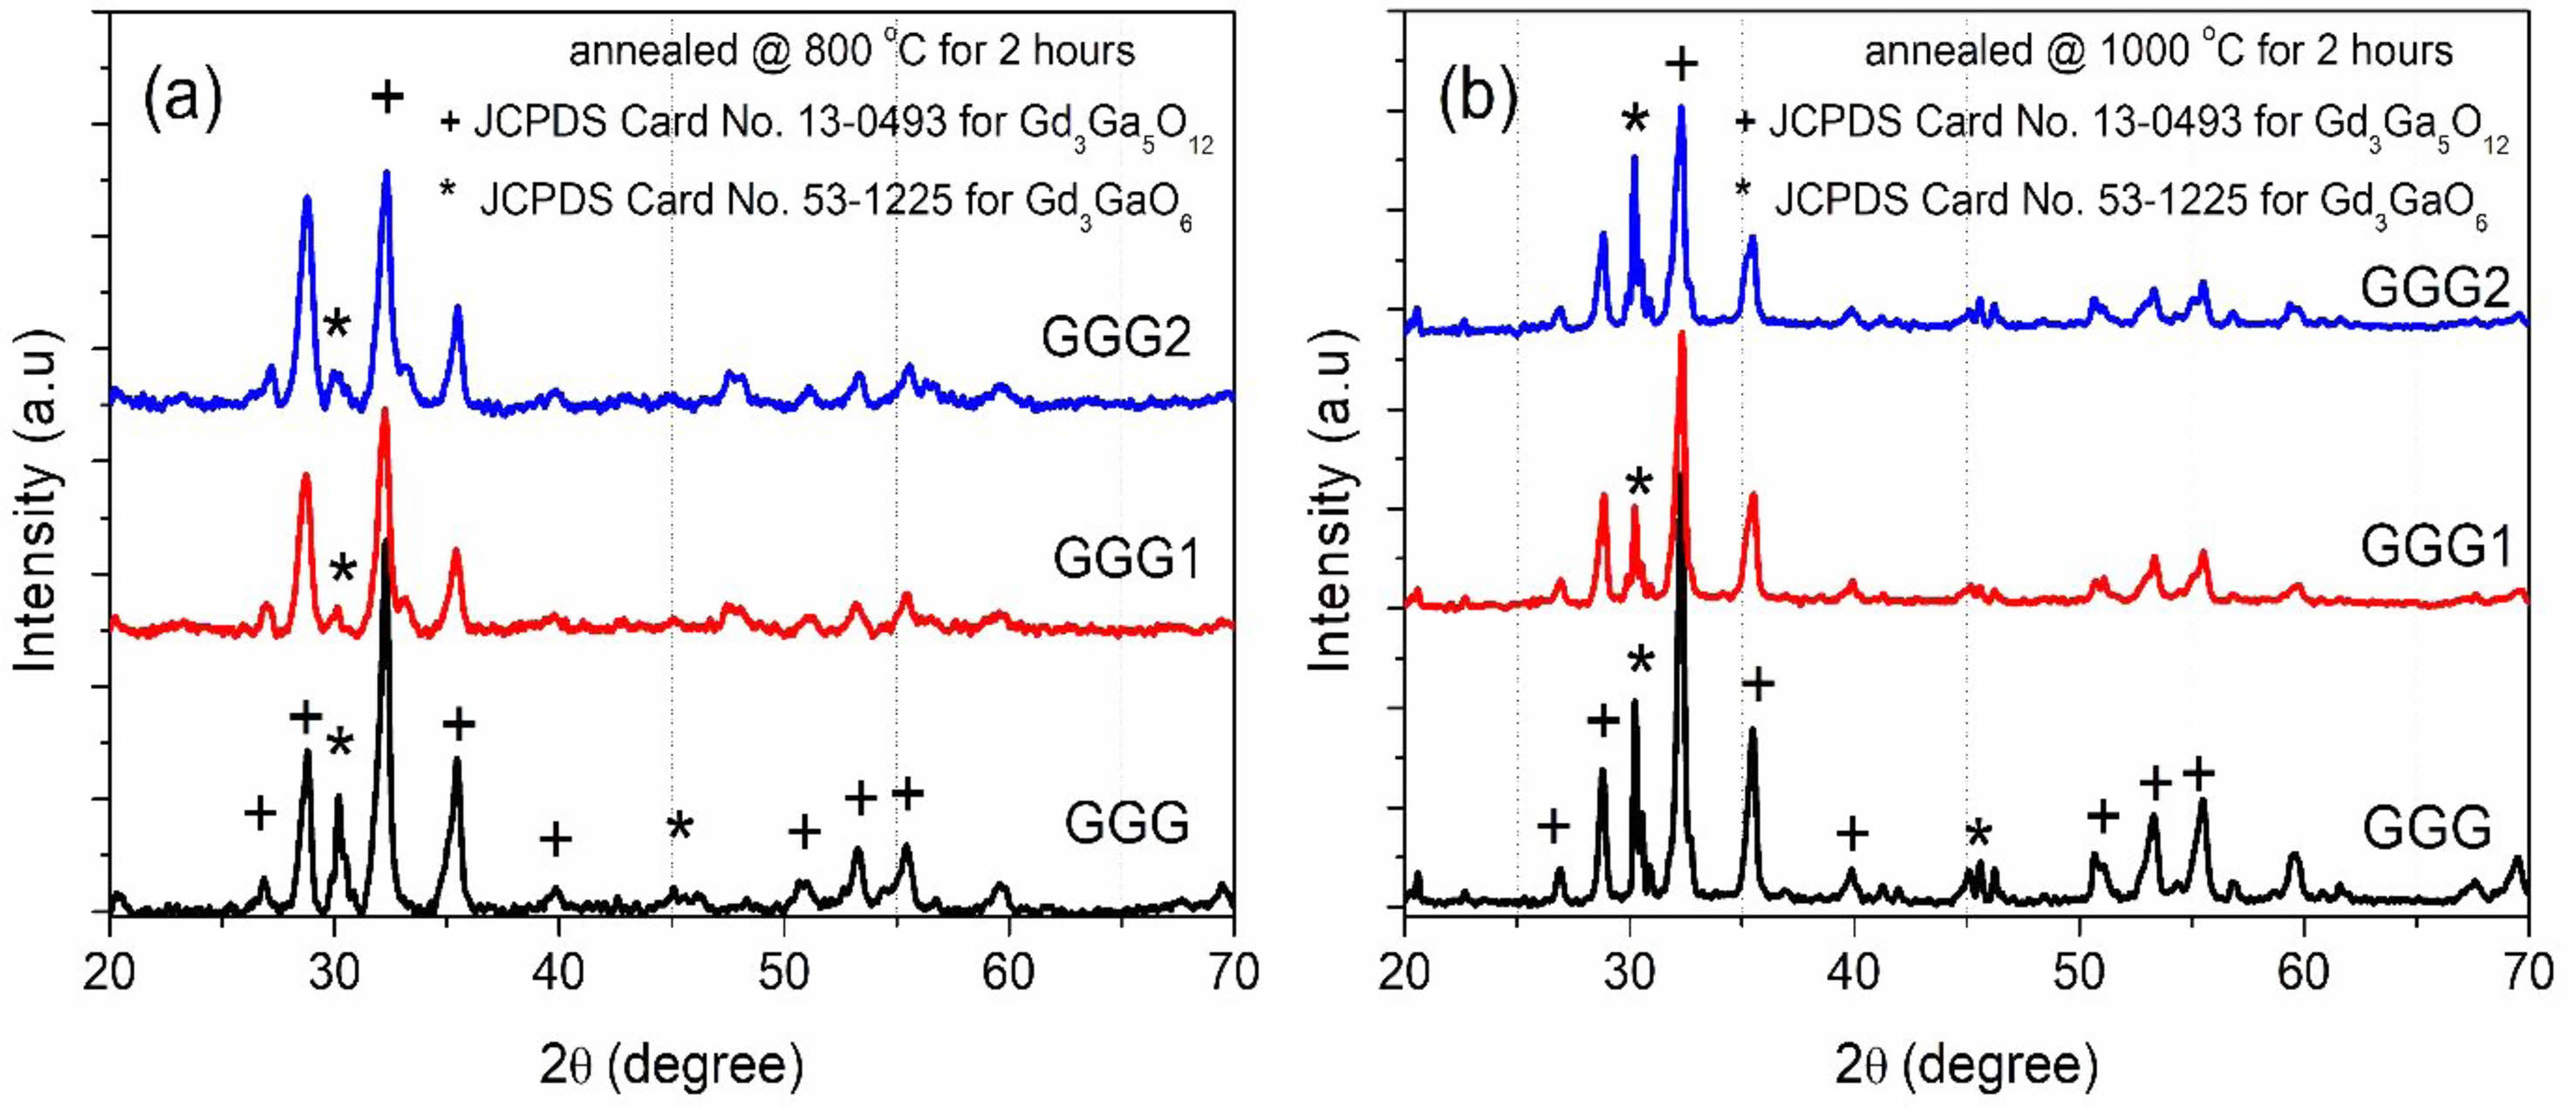
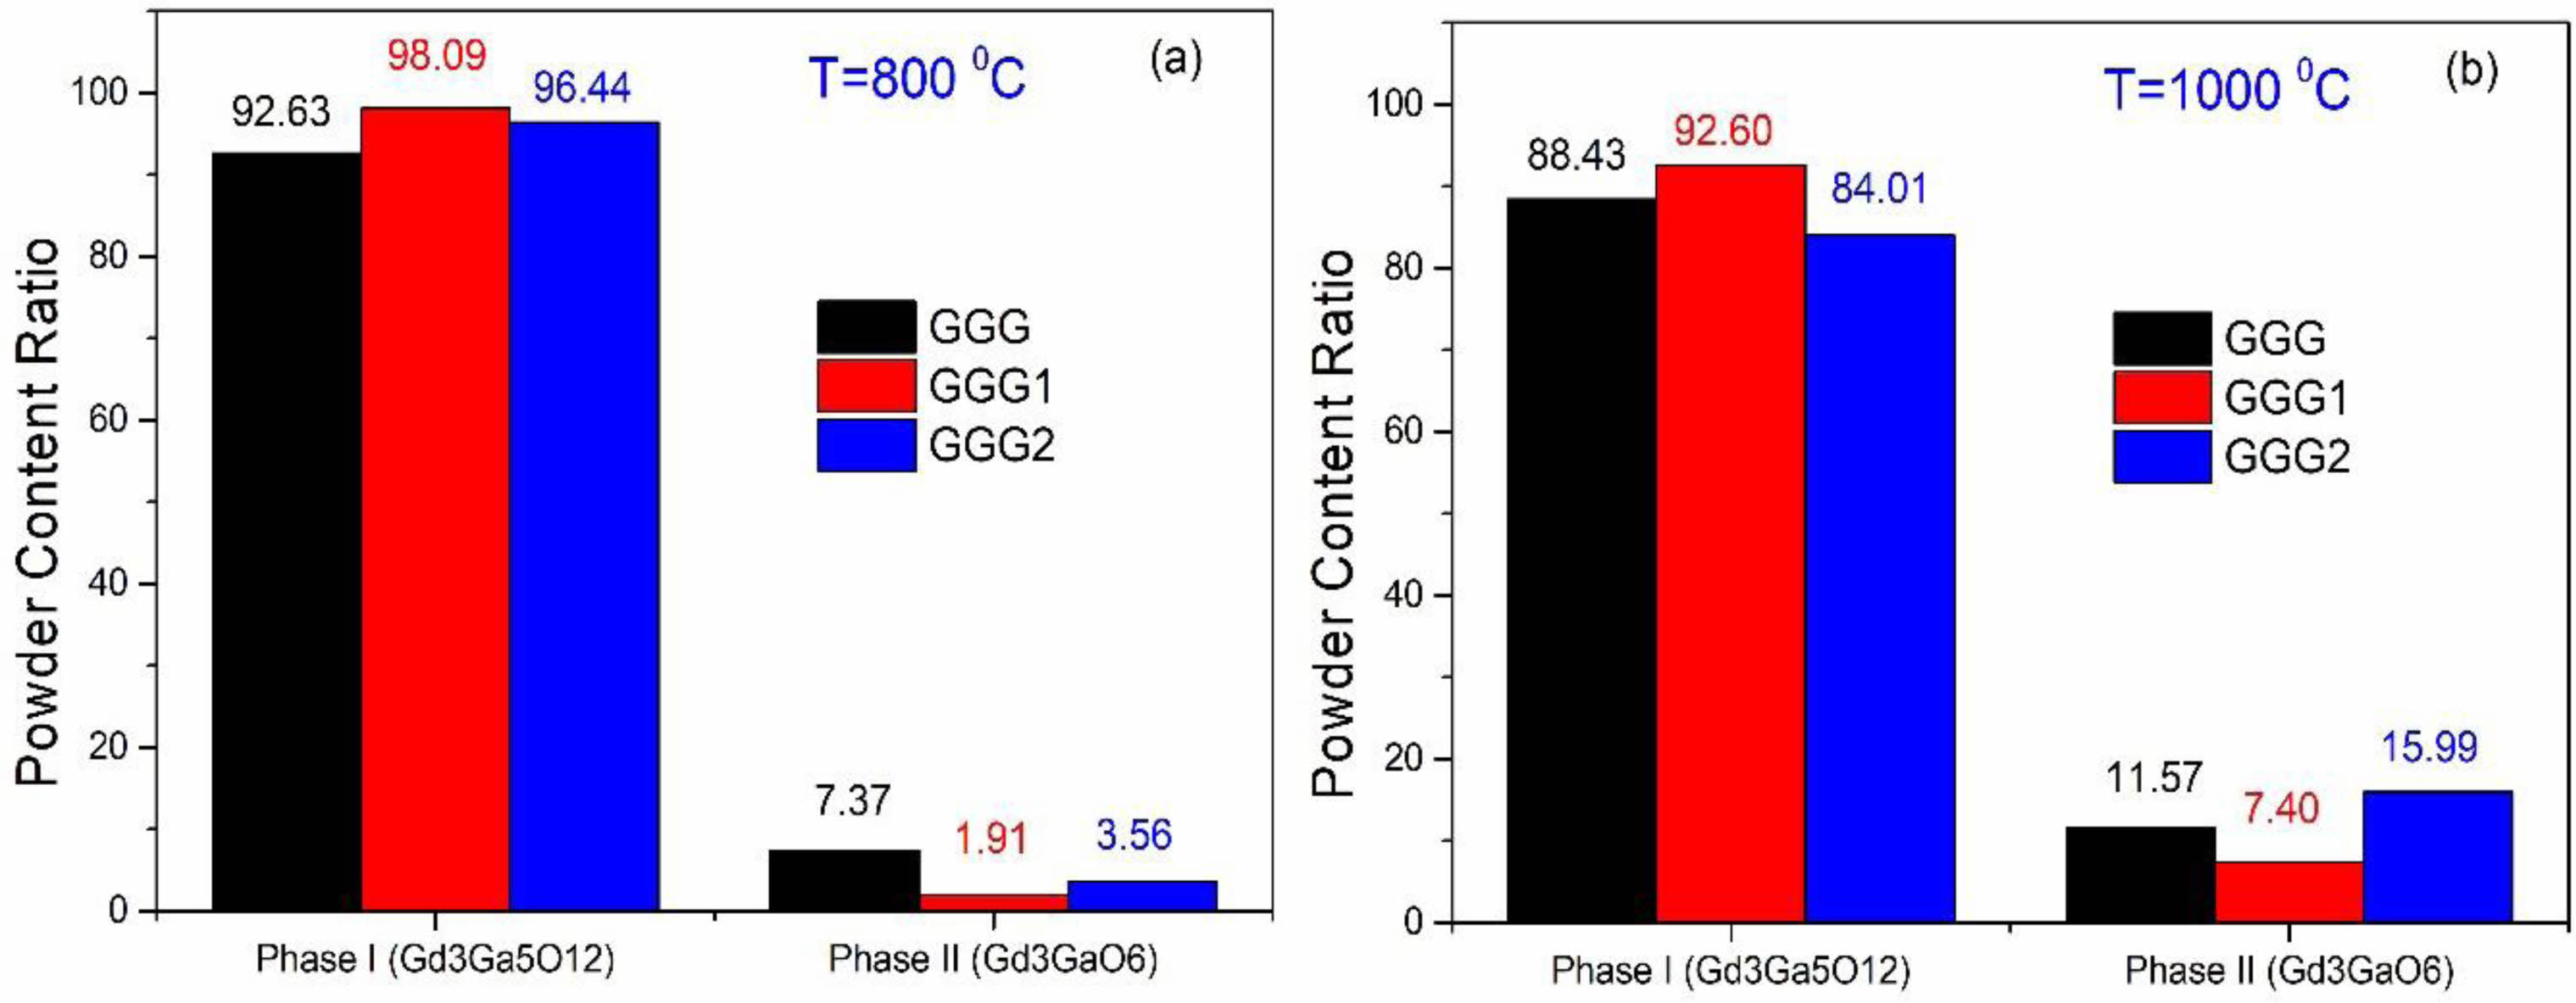
Fig. 5 shows XRD patterns of GGG, GGG1, and GGG2 powders annealed at 800 °C and 1000 °C for 2 hours. It is found that Gd3Ga5O12 becomes almost the pure phase in the XRD graph for the GGG1 powder sample annealed at 800 °C for 2 hours. When the annealing temperature is reached 1000 °C, the second Gd3GaO6 (gallate) phase diffraction peak exists in smaller intensity for the GGG1 powder sample. These two phases can be evaluated as relative, calculate from the ratio of areas under the corresponding phase peaks. For a relative evaluation, the content of the powders mostly consists of the dominant garnet phase for GGG1 powders, as seen in Fig. 6. These results indicate that gadolinium-gallium garnet powders can be synthesized from a molar ratio of [Gd]/[Ga] with 36/64 at 800 °C for 2 hours by the sol-gel pechini method.
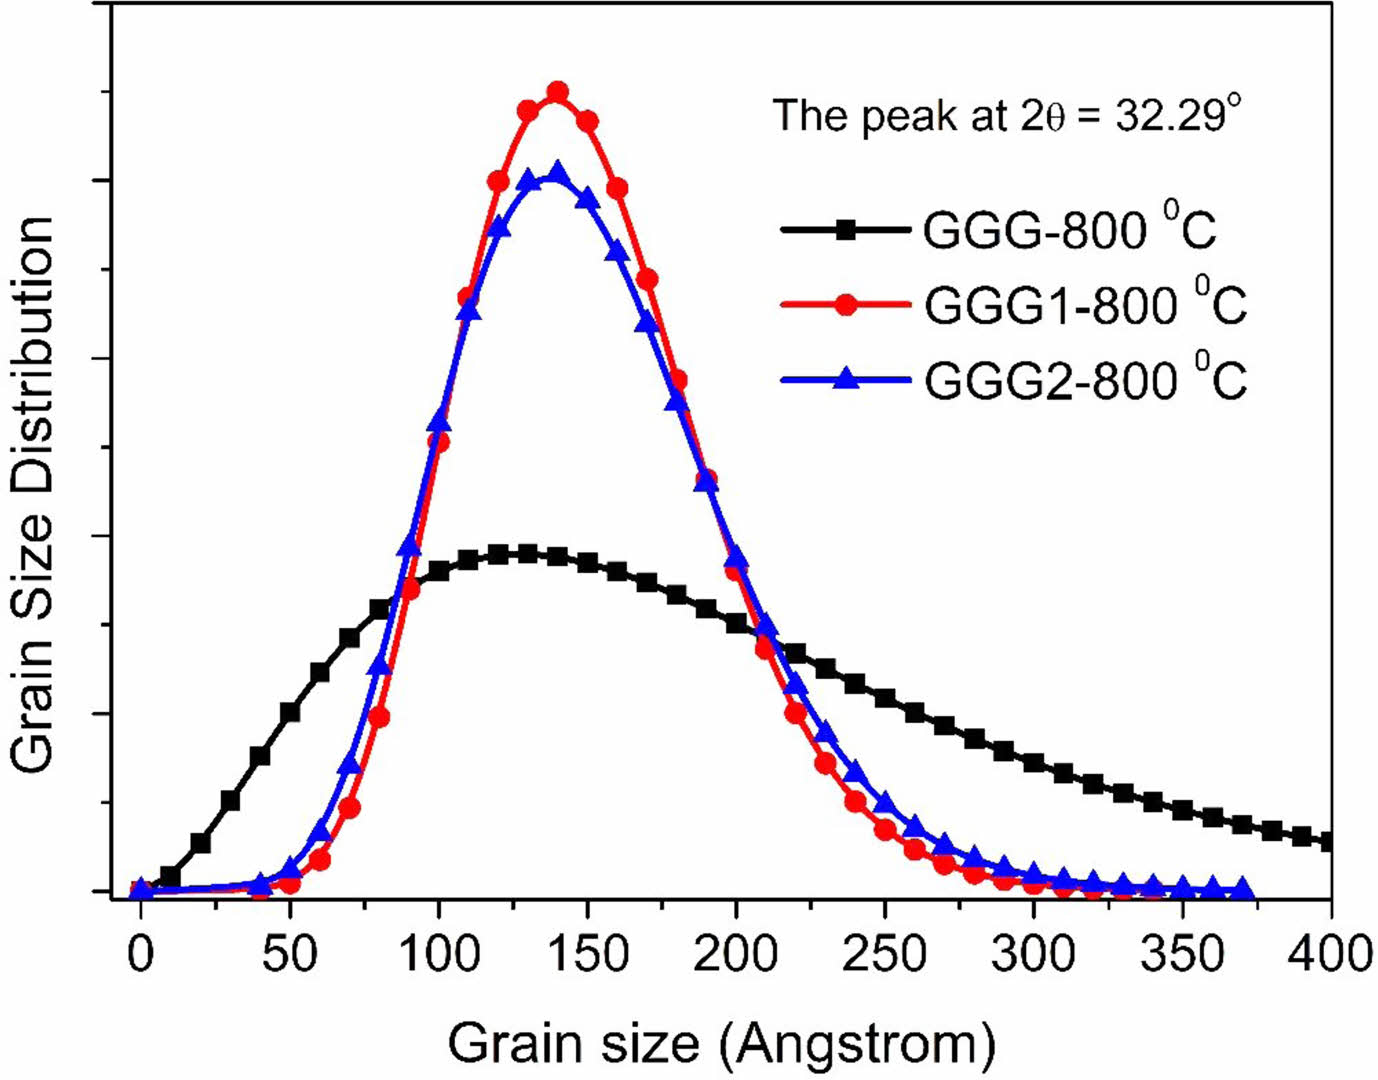
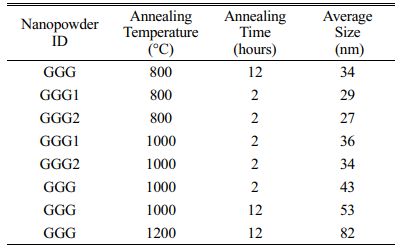
Grain size distribution is an essential parameter for nanomaterials because the materials’ chemical and physical properties depend on the particle size. Two different methods were used to estimate the grain size of the samples from XRD measurements. The mean grain size was first calculated by the Scherrer equation [45], D=Kl/bcosq, where D is the average grain size, K is the dimensionless shape factor, has a typical value of about 0.9, l is the X-ray wavelength (0.15418 nm), q is the diffraction angle, b is the full-width at half-maximum (FWHM) of the peak. The strongest peak at 2q=32.29° was selected to calculate the crystallite sizes of the powder samples. The particle size of the nanopowders is summarized in Table 1. The results show that the particle sizes increase with increasing annealing temperature.
The grain size distribution (GSD) was also analyzed by Pielaszek  method, which can be utilized to the crystalline polydispersive powders [46]. The method accepts that the grain sizes obey the Gamma distribution. The diffraction file data is converted from two-theta to scattering vector units, q=4psinq/l. The full widths measured at 1/5 and 4/5 of the maximum peak from the diffraction line profile can be labeled as
  and
and  , respectively. The mean particle size D and its dispersion s are expressed as
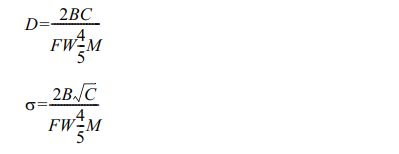
where auxiliary factors A, B,and C are:
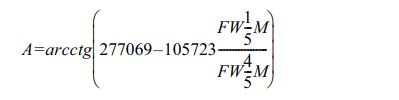
B =0.001555+0.00884×ctg (0.002237-2101×A)
C = -0.6515-463695×A
The grain size distribution of the nanopowder samples annealed at 800 °C versus the grain size is shown in Fig. 7. GGG1 and GGG2 samples have similar particle size distributions. The results are compatible with the mean particle sizes of the nanopowders calculated from the Scherrer equation.
Morphological analysis
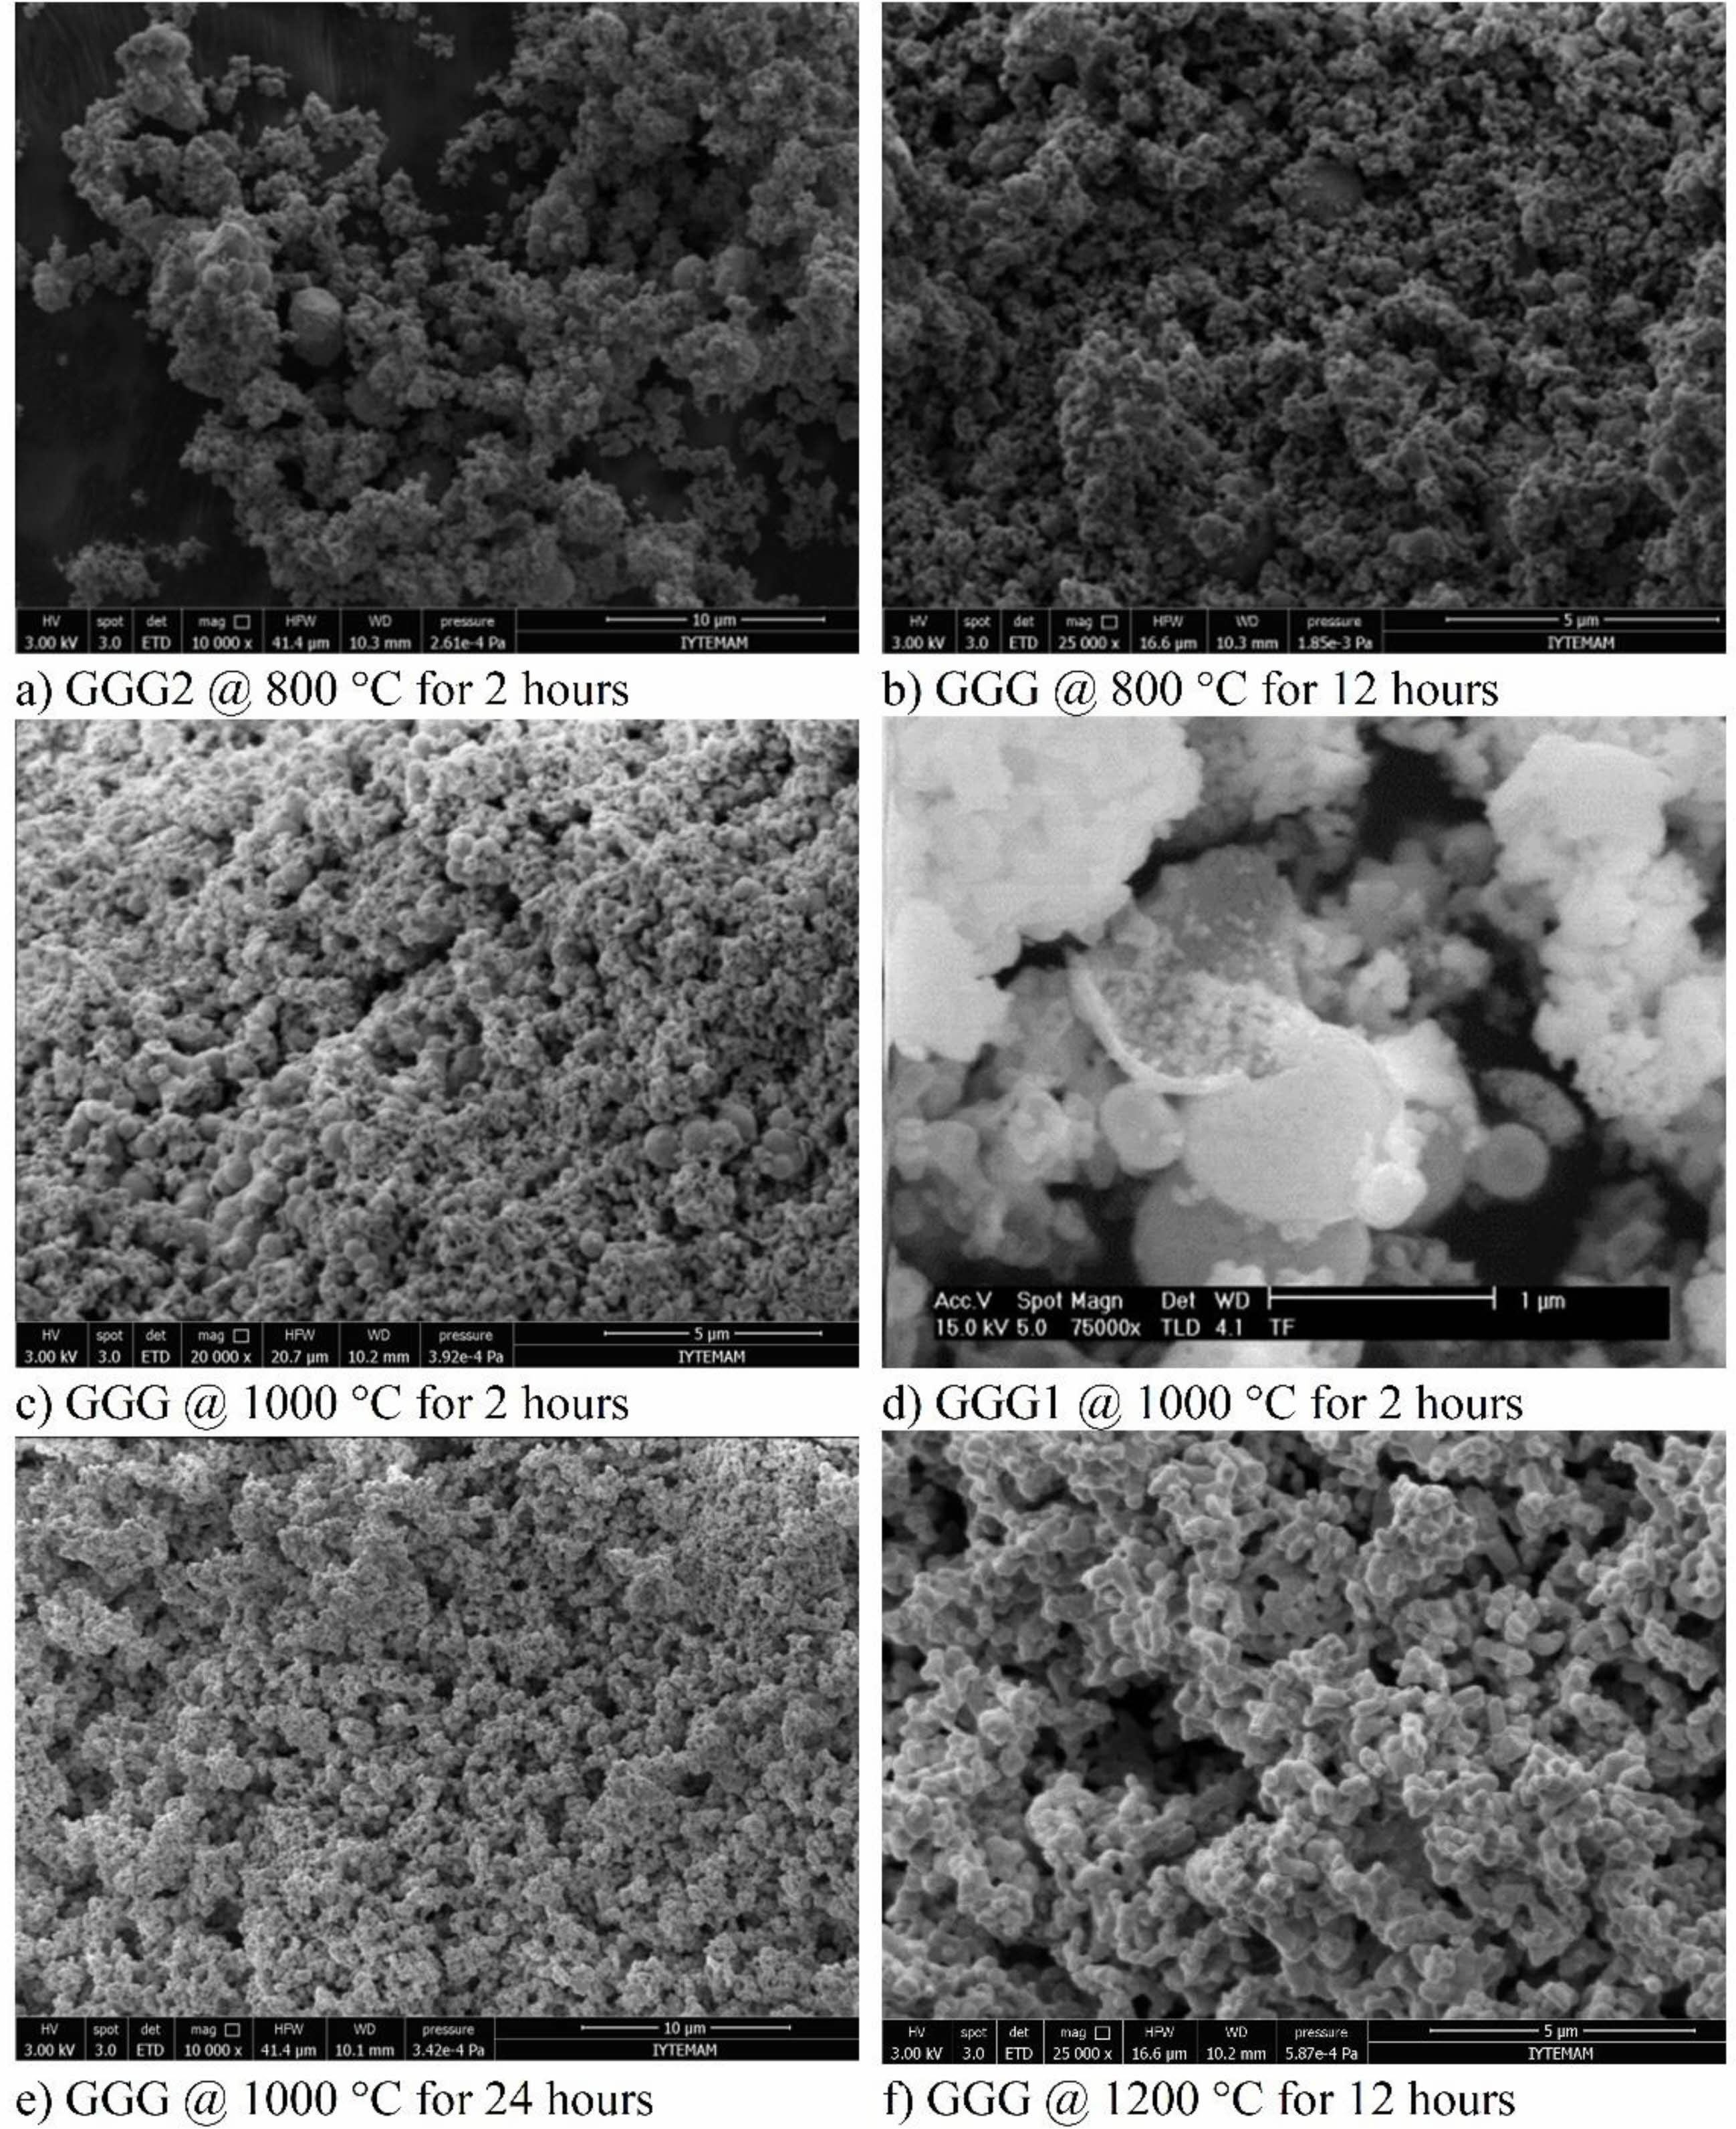
SEM images of the synthesized powders are shown in Fig. 8. It can be observed that all powders are loosely agglomerated, and there are spherical nanoparticles in the structure annealed at 800 °C for two hours with the particle diameter ranging from 400-500 nm (Fig. 8(a)). When the annealing duration time is increased from 2 hours to 12 hours, both the structure and the nanoparticles contain many pores (Fig. 8(b)). Although the nanobubbles maintain good spherical shapes in GGG and GGG1, their diameters decrease slightly at 1000 °C (Fig. 8(c), 8(d)). Fig. 8(d) shows the SEM image of one of the cracked nanobubbles in the structure of GGG1 nanopowders annealed at 1000 oC for 2 hours. It can be seen from the picture that the nanoparticles are made of thin spherical shells with larger particle sizes. The increased annealing duration from 2 hours to 24 hours shows that the structure contains a few nanobubbles and lots of pores. At higher temperatures, the nanoparticles split into smaller particles, and then they start to agglomerate into a network (Fig. 8(f)). SEM images of the GGG powders annealed at 1200 °C for 12 hours present similar ellipsoid shapes with a smaller particle size distribution. It can be summarized that, as the temperature increases, the diameter and number of the nanobubbles decrease, the particle size becomes gradually greater, the morphologies of crystallites convert from sphere to ellipsoid, and neck connections can be observed to form aggregations.
TG-DTA results
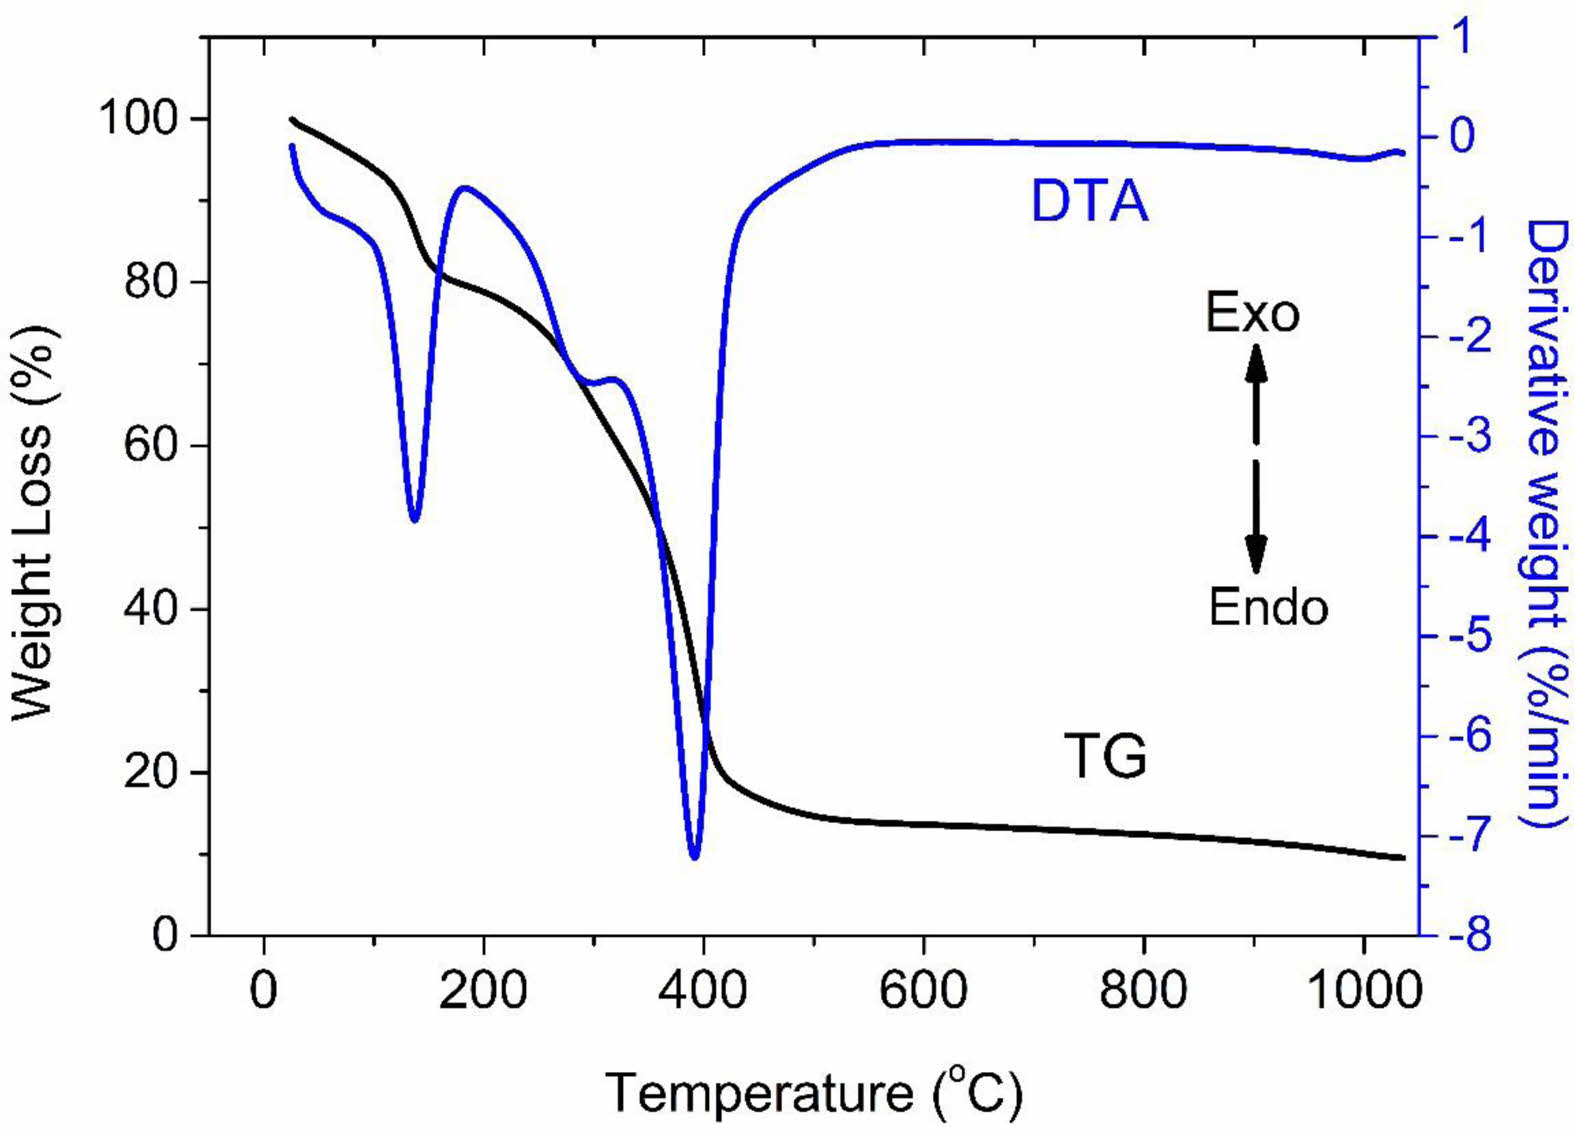
The TG-DTA curve of the GGG1 gel is shown in Fig. 9. There are three major endothermic peaks below 500 °C in the DTA curve. The endothermic peak at 170 °C is ascribed to the desorption of adsorbed water. The second and third peaks correspond to the thermal decomposition of nitrate and carbonate groups. Fig. 9 represents almost all the weight losses complete below 500 °C by two different stages due to the loss of nitrate, hydroxyl, and carbonyl groups in the TG curve.
FT-IR results
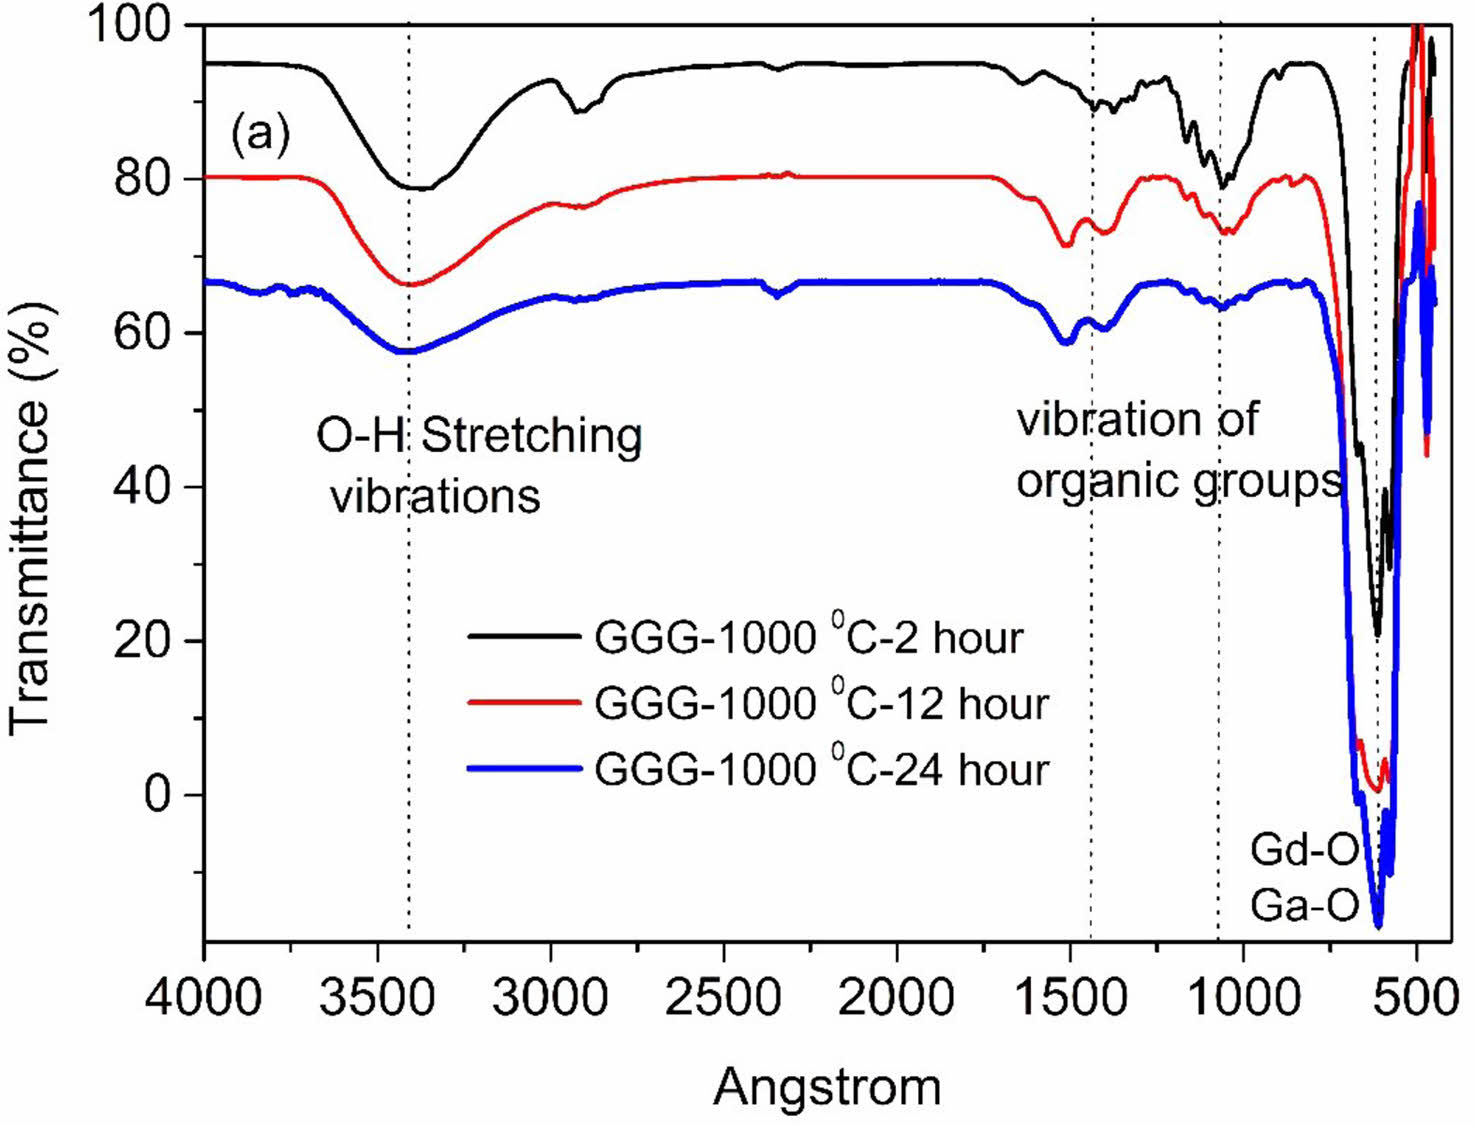
FT-IR spectroscopy was recorded as another method to support the characterization of samples. The FT-IR spectra of GGG annealed at 1000 °C for different hours are illustrated in Fig. 10. The FT-IR spectra present intense broad absorption bands in the ranges of 3600-3000 cm-1 arising from stretching vibrations of the hydroxyl group. The other peaks at around 1507, 1390, and 1074 cm-1 can be ascribed to N-H, N-O, and C-O bond vibrations, respectively [23]. The increasing calcination temperature weakens all these absorption peaks due to the decomposition of starting materials. The characteristic Gd-O and Ga-O metal-oxygen stretching vibration peaks representing gadolinium-gallium garnet formation are observed at 673, 616, and 571 cm-1 after 800 °C annealing temperature and 2 hours of annealing holding time [12]. The absorption intensity of Gd-O and Ga-O bands became stronger with the increasing annealing time and temperature due to the growth of crystallinity. The results are in good agreement with XRD measurements.
|
Fig. 2 XRD patterns of GGG sample annealed at different temperatures from 800 to 1200 °C for 12 hours. |
|
Fig. 3 XRD patterns of GGG sample annealed at 1000 °C for 2 and 24 hours. |
|
Fig. 4 The pictures of GGG, GGG1, and GGG2 nanopowders annealed from 500 to 1200 °C. |
|
Fig. 5 XRD patterns of GGG, GGG1, and GGG2 samples annealed at (a) 800 °C and (b) 1000 ºC for 2 hours |
|
Fig. 6 The content ratio of the two phases for GGG, GGG1, and GGG2 nanopowders at 800 °C (a) 1000 °C (b) for 2 hours. |
|
Fig. 7 Grain size distributions calculated using the Pielaszek method for the annealed nanopowders. |
|
Fig. 8 SEM images of GGG, GGG1, and GGG2 nanopowders annealed at different temperatures in air. |
|
Fig. 9 TG-DTA curve of GGG1 precursor. |
|
Fig. 10 FT-IR spectra of GGG sample annealed at 1000 °C for 2 hours, 12 hours, and 24 hours. |
|
Table 1 Mean particle sizes of the nanopowders calculated from the Scherrer equation. |
Phase-control of the host materials is a critical problem for optical and magnetic materials. In this study, the effect of molar ratio [Gd]/[Ga] on the formation of the gadolinium-gallium garnet crystalline structure was examined. The nanocrystalline gadolinium-gallium garnet powder was fabricated at a lower annealing temperature (800 °C) for a shorter annealing time (2 h) by the sol-gel pechini method. Gadolinium-gallium garnet (Gd3Ga5O12) nanopowders were successfully obtained at [Gd]/[Ga]=0.56 (GGG1 nanopowder sample) molar ratio. The results of FT-IR spectra reveal that well-crystallized Gd3Ga5O12 is formed, which is in agreement with the result from XRD. Nanopowders show spherical bubble forms of thin spherical shells with particle diameters ranging from 400-500 nm. Scanning electron microscopy (SEM) and XRD line broadening show that the crystallite size grows, and the diameter and number of the nanobubbles decrease with increasing annealing temperature. The average particle size of the nanopowder annealed at 800 °C is calculated in the range of 20-30 nm.
This work has been supported by the Scientific Research Projects Directorate of Ege University, under the BAP Project No: 2014 FEN 027.
- 1. O. Kaygili, J. Ceram. Process. Res. 16 (2015) 54-58.
- 2. B.S. Choi, D.H. Lee, J.H. Ryu and H. Cho, J. Ceram. Process. Res. 20 (2019) 80-83.
- 3. J. Il Lee, H. Cho and J.H. Ryu, J. Ceram. Process. Res. 17 (2016) 1006-1010.
- 4. J.W. Chung, H.K. Yang, B.K. Moon, B.C. Choi, J.H. Jeong and K.H. Kim, J. Ceram. Process. Res. 13 (2012) 6-9.
- 5. D. Neupane, L. Hulsebosch, K.S.S. Ali, R. Bhattarai, X. Shen, A.K. Pathak and S.R. Mishra, Materialia. 21 (2022) 101301.
-

- 6. M. Raukas, J. Kelso, Y. Zheng, K. Bergenek, D. Eisert, A. Linkov and F. Jermann, ECS J. Solid State Sci. Technol. 2 (2013) R3168-R3176.
-
- 7. R.D. Shull, J. Iron Steel Res. Int. 14 (2007) 69-74.
-
- 8. M. Daldosso, D. Falcomer, A. Speghini, P. Ghigna and M. Bettinelli, Opt. Mater. 30 (2008) 1162-1167.
-
- 9. L. Lipińska, W. Ryba-Romanowski, A. Rzepka, S. Ganschow, R. Lisiecki, R. Diduszko and A. Paja̧czkowska, Cryst. Res. Technol. 44 (2009) 477-483.
-
- 10. F.P. Yu, D.R. Yuan, X.L. Duan, S.Y. Guo, X.Q. Wang, X.F. Cheng and L.M. Kong, J. Alloys Compd. 465 (2008) 567-570.
-
- 11. T. Xueyan, Z. Xiyan, L. Yinzhu and Y. Peizhi, J. Rare Earths. 24 (2006) 443-446.
-
- 12. G. Wang, X. Li and Y. Geng, J. Alloys Compd. 505 (2010) 213-216.
-
- 13. H. Örücü, S. Tabanli, M. Erdem, Y. Öztürk and G.Eryürek, Opt. Mater. 131 (2022) 112613.
-
- 14. M. Erdem, H. Örücü, S.B. Cantürk and G. Eryürek, ACS Appl. Nano Mater. 4 (2021) 7162-7171.
-
- 15. C. Sun, W. Lü, X. Ma, T. Cao, J. Li, Z. Zhu, Z. You, Y. Wang and C. Tu, J. Nanosci. Nanotechnol. 10 (2010) 6527-6533.
-
- 16. K. Zhang, L. Tong, Y. Ma, J. Wang, Z. Xia and Y. Han, J. Alloys Compd. 781 (2019) 467-472.
-
- 17. M. Daldosso, D. Falcomer, A. Speghini, M. Bettinelli, S. Enzo, B. Lasio and S. Polizzi, J. Alloys Compd. 451 (2008) 553-556.
-
- 18. C.P. Reshmi, S. Savitha Pillai, K.G. Suresh and M.R. Varma, J. Magn. Magn. Mater. 324 (2012) 1962-1966.
-
- 19. M.H. Phan, M.B. Morales, C.N. Chinnasamy, B. Latha, V.G. Harris and H. Srikanth, J. Phys. D. Appl. Phys. 42 (2009) 115007.
-
- 20. F.N. Shafiee, M.S. Mustaffa, N.H. Abdullah, M.N. Hamidon, I. Ismail, R. Nazlan, I.R. Ibrahim, F.M. Idris and M.S.E. Shafie, J. Mater. Sci. Mater. Electron. 32 (2021) 10160-10179.
-
- 21. O. Opuchovic, A. Kareiva, K. Mazeika and D. Baltrunas, J. Magn. Magn. Mater. 422 (2017) 425-433.
-
- 22. D. Huang, X. Zhang, J. Liu and D. Zhang, J. Wuhan Univ. Technol. Mater. Sci. Ed. 25 (2010) 123-126.
-
- 23. Y. Dong, J. Sun, W. Yu, W. Li and F. Teng, J. Adv. Ceram. 1 (2012) 296-300.
-
- 24. E.E. Hellstrom, R.D. Ray and C. Zhang, J. Am. Ceram. Soc. 72 (1989) 1376-1381.
-
- 25. L. Kostyk, A. Luchechko, Y. Zakharko, O. Tsvetkova and B. Kukliński, J. Lumin. 129 (2009) 312-316.
-
- 26. S.K. Singh, D.G. Lee, S.S. Yi, K. Jang, D.S. Shin and J.H. Jeong, J. Appl. Phys. 113 (2013) 173504.
-
- 27. V. Tsiumra, A. Krasnikov, S. Zazubovich, Y. Zhydachevskyy, L. Vasylechko, M. Baran, L. Wachnicki, L. Lipińska, M. Nikl and A. Suchocki, J. Lumin. 213 (2019) 278-289.
-
- 28. S. Yan, Q. Gao, X. Zhao, A. Wang, Y. Liu, J. Zhang, X. jun Wang and F. Liu, J. Lumin. 226 (2020) 117427.
-
- 29. G. Zhao, T. Li, X. He and J. Xu, Mater. Lett. 56 (2002) 1098-1102.
-
- 30. M. Bazzoni, M. Bettinelli, M. Daldosso, S. Enzo, F. Serra and A. Speghini, J. Solid State Chem. 178 (2005) 2301-2305.
-
- 31. D. Sun, Q. Zhang, Z. Wang, J. Su, C. Gu, A. Wang and S. Yin, Mater. Sci. Eng. A. 392 (2005) 278-281.
-
- 32. Z. Luo, M. Lu, J. Bao, W. Liu and C. Gao, Mater. Lett. 59 (2005) 1188-1191.
-
- 33. X. Li, Z.G. Hu and J. Li, Opt. Mater. 29 (2007) 854-857.
-
- 34. R. Krsmanović, V.A. Morozov, O.I. Lebedev, S. Polizzi, A. Speghini, M. Bettinelli and G. Van Tendeloo, Nanotechnology. 18 (2007) 325604.
-
- 35. A. Luchechko, L. Kostyk, S. Varvarenko, O. Tsvetkova and O. Kravets, Nanoscale Res. Lett. 12 (2017) 4-9.
-
- 36. L. Kostyk, A. Luchechko, S. Varvarenko, B. Pavlyk and O. Tsvetkova, Chem Met Alloys. 4 (2011) 77-80.
-
- 37. L. Gao, Y. Zhang, X. Yang, Y. He and L. Song, J. Ceram. Process. Res. 21 (2020) 615-621.
-
- 38. M.S. Kwon, J.W. Kim, J.S. Park and S.G. Lee, J. Ceram. Process. Res. 21 (2020) 725-730.
-
- 39. F.K. Konan, B. Hartiti and B. Aka, J. Ceram. Process. Res. 20 (2019) 372-373.
- 40. M. Pang and J. Lin, J. Cryst. Growth. 284 (2005) 262-269.
-
- 41. R. Martin-Rodriguez, R. Valiente, S. Polizzi, M. Bettinelli, A. Speghini and F. Piccinelli, J. Phys. Chem. C 2009,113, 12195-12200.
-
- 42. S. Butkute, A. Zabiliute, R. Skaudzius, P. Vitta, A. Beganskiene, A. Zukauskas and A. Kareiva, J. Sol-Gel Sci. Technol. 76 (2015) 210-219.
-
- 43. Y.A. Mohamad, Y. Atassi and Z. Moussa, J. Rare Earths. 34 (2016) 1077-1082.
-
- 44. J. Nicolas, J. Coutures, J.P. Coutures and B. Boudot, J. Solid State Chem. 52 (1984) 101-113.
-
- 45. P. Scherrer, Nachrichten von Der Gesellschaft Der Wissenschaften Zu Göttingen, Math. Klasse. (1918) 98-100.
- 46. R. Pielaszek, J. Alloys Compd. 382 (2004) 128-132.
-
 This Article
-
2022; 23(6): 799-805
Published on Dec 31, 2022
- 10.36410/jcpr.2022.23.6.799
- Received on Mar 22, 2022
- Revised on Jun 27, 2022
- Accepted on Jul 21, 2022
Services
- Abstract
introduction
experimental and characterization
result and discussion
conclusions
- Acknowledgements
- References
- Full Text PDF
Shared
Correspondence to
- Hümeyra Örücü
-
Faculty of Science, Department of Physics, Ege University, 35100, Bornova, İzmir, Turkey
Tel : +90 232 3112381 Fax: +90 232 311 2833 - E-mail: humeyra.orucu@ege.edu.tr
Clean-Energy Research Institute(CRI), Hanyang University, 222, Wangsimni-ro, Seongdong-gu, Seoul, 04763, Korea
E-mail: jcpr@hanyang.ac.kr