


- The behavior of pile foundations in liquefiable sand using a force-based approach for circular piles
Premalatha K and Muthulakshmi K*
Department of Civil Engineering, College of Engineering, Anna University, Chennai 600025, Tamilnadu, India
This article is an open access article distributed under the terms of the Creative Commons Attribution Non-Commercial License (http://creativecommons.org/licenses/by-nc/4.0) which permits unrestricted non-commercial use, distribution, and reproduction in any medium, provided the original work is properly cited.
Employing a bending analysis for the piles subjected to lateral loading, examine the behavior of concrete pile foundations in liquefiable sand. The shear force, bending moment, and deflection along the length of the pile were calculated using a finite element model and analysis of the pile. The force-based technique is used to compute the lateral loading. The study also focuses on impacting factors like liquefaction depth, end circumstances, and loading type. The aforementioned parametric investigation for the piles in liquefiable soil and non-liquefiable soil yielded a thorough failure pattern. Using the data, design charts for the pile's ideal diameter under situations of liquefiable soil were created
Keywords: Bending analysis, Optimum diameter, Lateral loading, Pile head fixity, liquefaction depth, Force-based approach
The most popular choice for deep foundations is pile foundations. Failures in pile foundations occurred during recent earthquakes in seismically active locations vulnerable to liquefaction and liquefaction-induced ground movement, even after taking into account the important safety element [1]. The pile foundation failure was attributed to liquefaction and lateral spreading, which caused the bending failure. Over the past few decades, numerous inquiries and analyses have been made possible by recorded case studies like Showa-bridge [2]. The developed a new theory of buckling instability by arguing that the pile served as a thin column that carried the axial load. Dynamic centrifuge testing and back-calculation using numerical simulations by the author served to validate the theory [3]. The lateral loads on the piles are caused by kinematic forces from ground movement and inertial effects from the superstructure [4]. A thorough literature analysis covering the period from 1994 to 2006 was used to establish the failure mechanism and review plausible theories of bending and buckling failure [5]. On the basis of the idea of bending and buckling analysis in interaction, the case studies are reviewed [6].
The inadequacies in Indian regulations regarding the design of pile foundations in liquefiable soils are studied, and it was recommended to consider the forces due to liquefaction and lateral spreading. The geotechnical earthquake engineers faced two issues: pile design criteria in liquefiable and non-liquefiable soil and the performance criteria. Different guidelines for lateral load were quantified for piles due to the flow of liquefied soil [7]. Further, the researcher has formulated a simplified p-y curve for liquefiable soil-pile interaction analysis [8]. Many researchers focus on interaction studies through the development of the various combination of lateral and axial loading and derived numerical solutions for the same [9].
The influence of liquefaction depth, pile head fixity, and type of load was studied for the performance of the pile, and the optimum diameter of the pile was recommended [10]. With the help of the finite element computer program SAP2000 V15, the bending behavior of a single pile in liquefiable soil is investigated in the current study to better understand the impact of various lateral loads along the length of the pile. The current study does not take into account the axial load on the pile [11].
Modelling Of The Pile And Soil
The modeling of the pile and soil is described in this section.
Pile Modelling
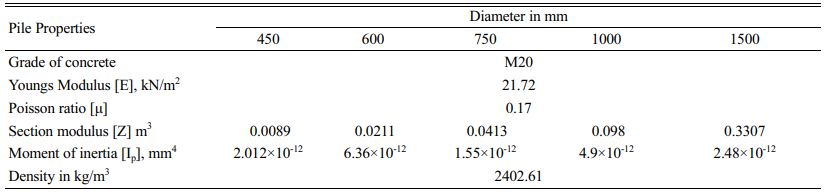
The piles are modeled as beam elements. Different diameters of piles are considered in this study. The grade of concrete used is M20. Section modulus and moment of inertia are calculated for various diameters. The different details of the pile used for the analysis are presented in Table 1.
Soil Modelling
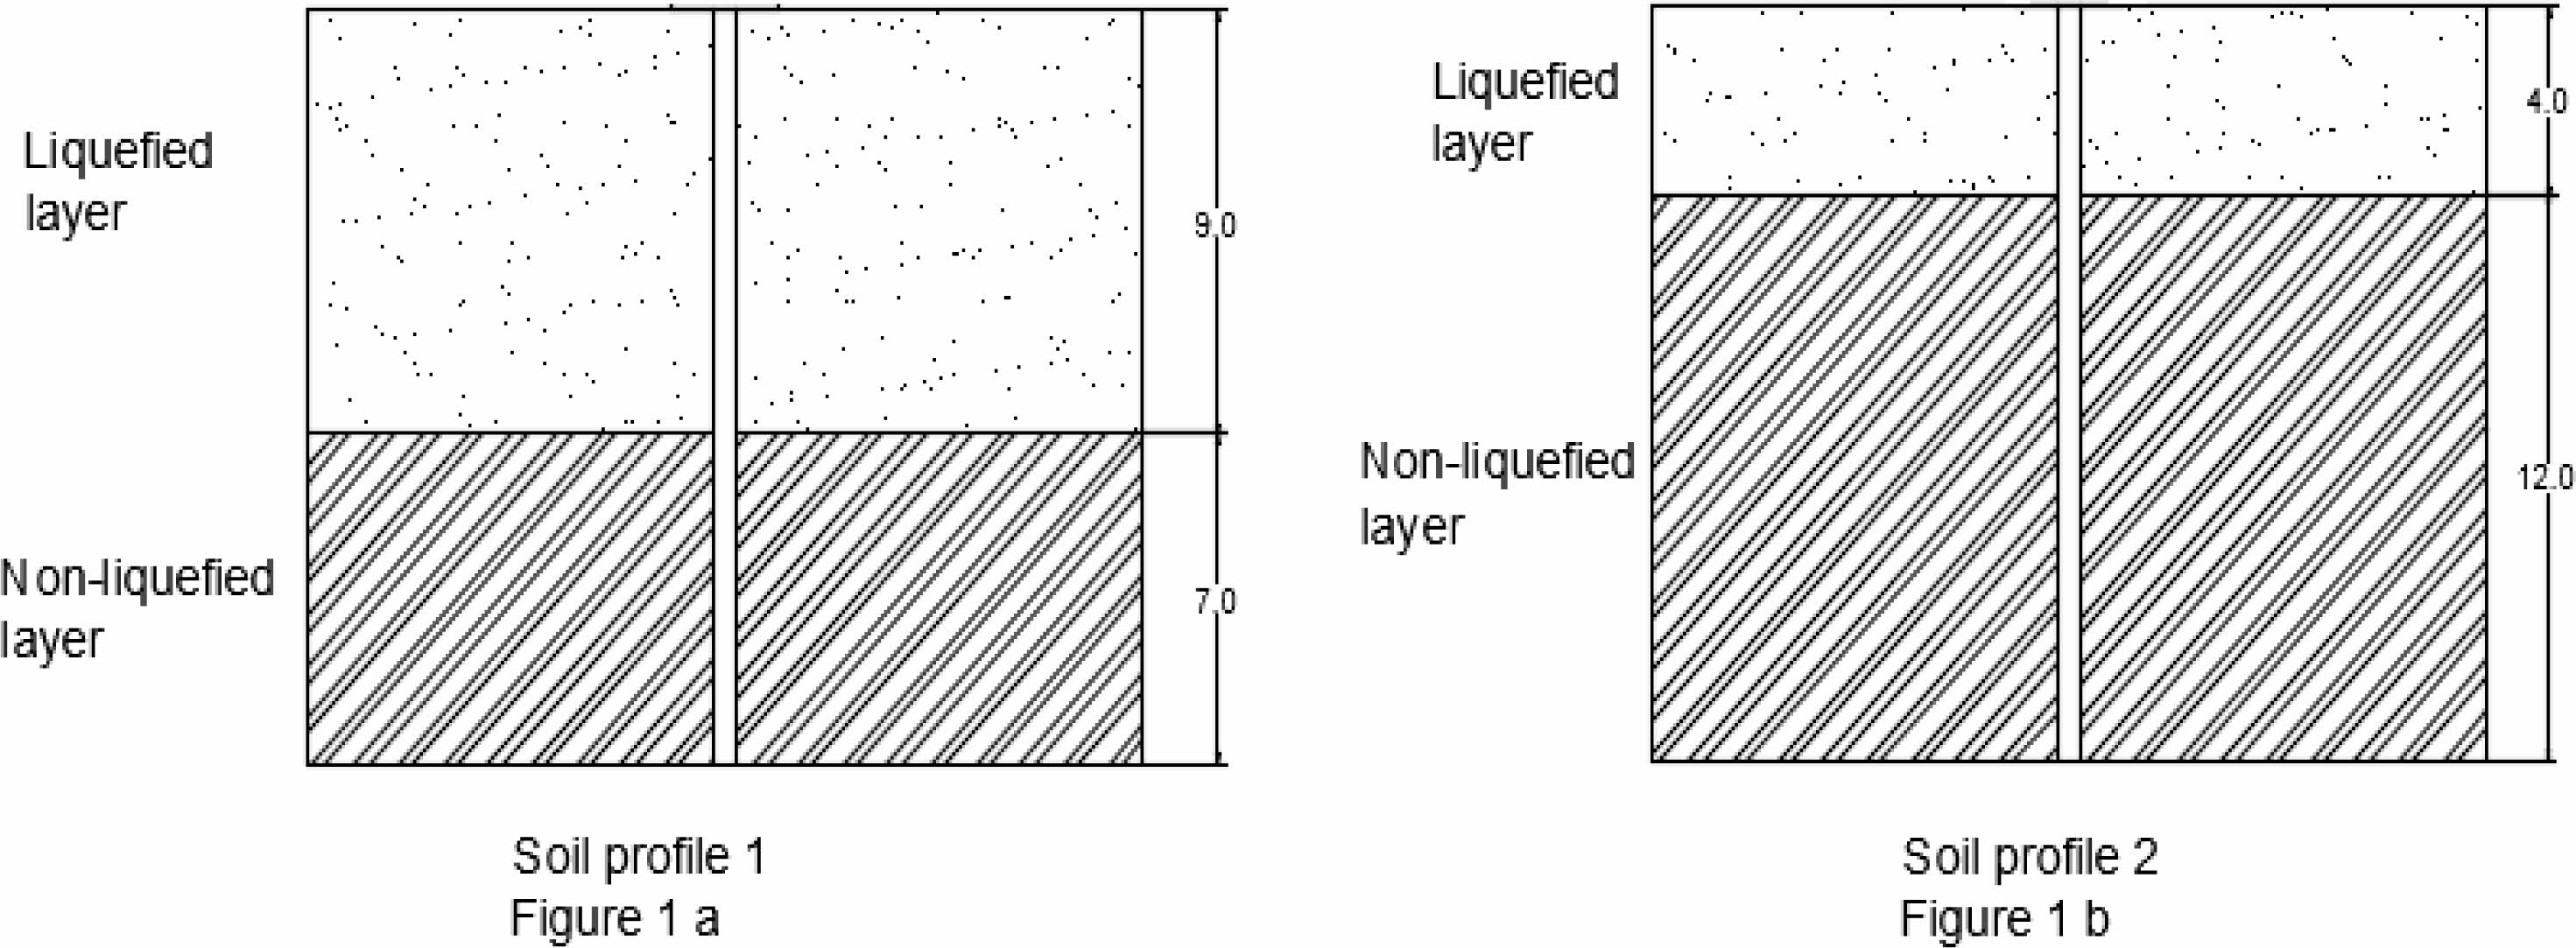
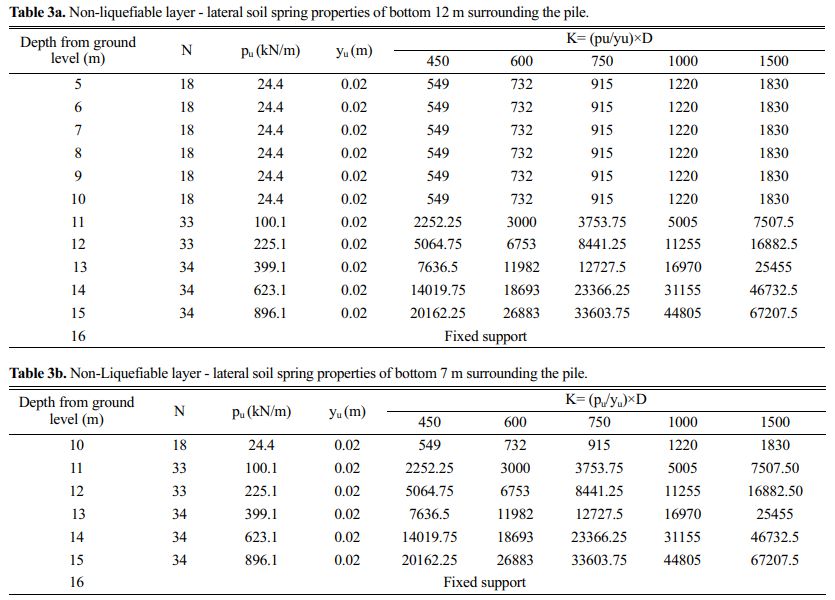
A typical soil profile model is shown in Figures 1a, and 1b is considered for the present analysis. Two soil profile layers consist of the top liquefied layer and the bottom non-liquefied layer. The length of the pile considered for the analysis is 16 m. The liquefaction depth assumed for this analysis is 4 m and 9 m. The Liquefiable soil layer of 4 m and 9 m is analyzed using a force-based approach. The underlying denser non-liquefied sand layer of 12 m and 7 m is modeled as a spring element as per API guidelines [12] for sandy soil, and the values are listed in Tables 3a and 3b
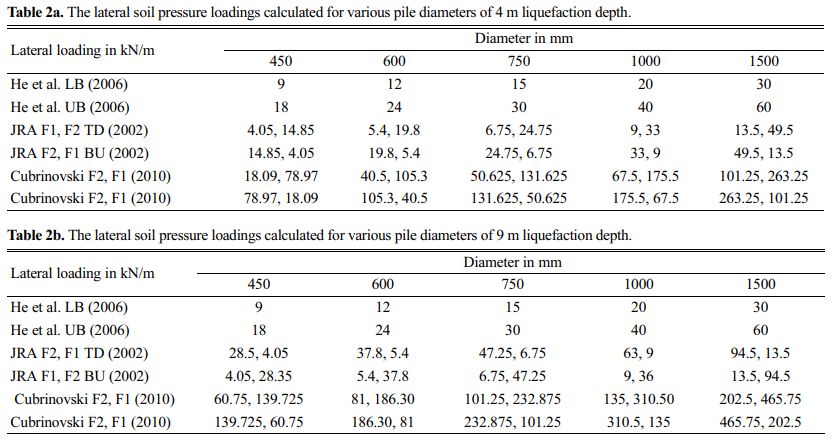
The limiting pressure on the pile due to the flow of liquefied soil is calculated based on both upper bound and [13] lower bound. The calculated limiting pressure is presented in Tables 2a and 2b.
Suggested the upper bound and lower bound lateral [14] pressure as 40 kPa and 20 kPa from shake table experimental results. The Japanese Road Association, specifies the limiting lateral pressure [15] F1 and F2 to be 30% of the total overburden pressure and is considered in this analysis. Cubrinovski recommended that the ultimate soil pressure on the pile for liquefaction-prone areas is 4.5 times [16] the Rankine's Passive Earth pressure. The underlying denser non-liquefied sand layer, 12 m, and 7 m thick are assumed to provide restraint during lateral spreading [17].
End conditions
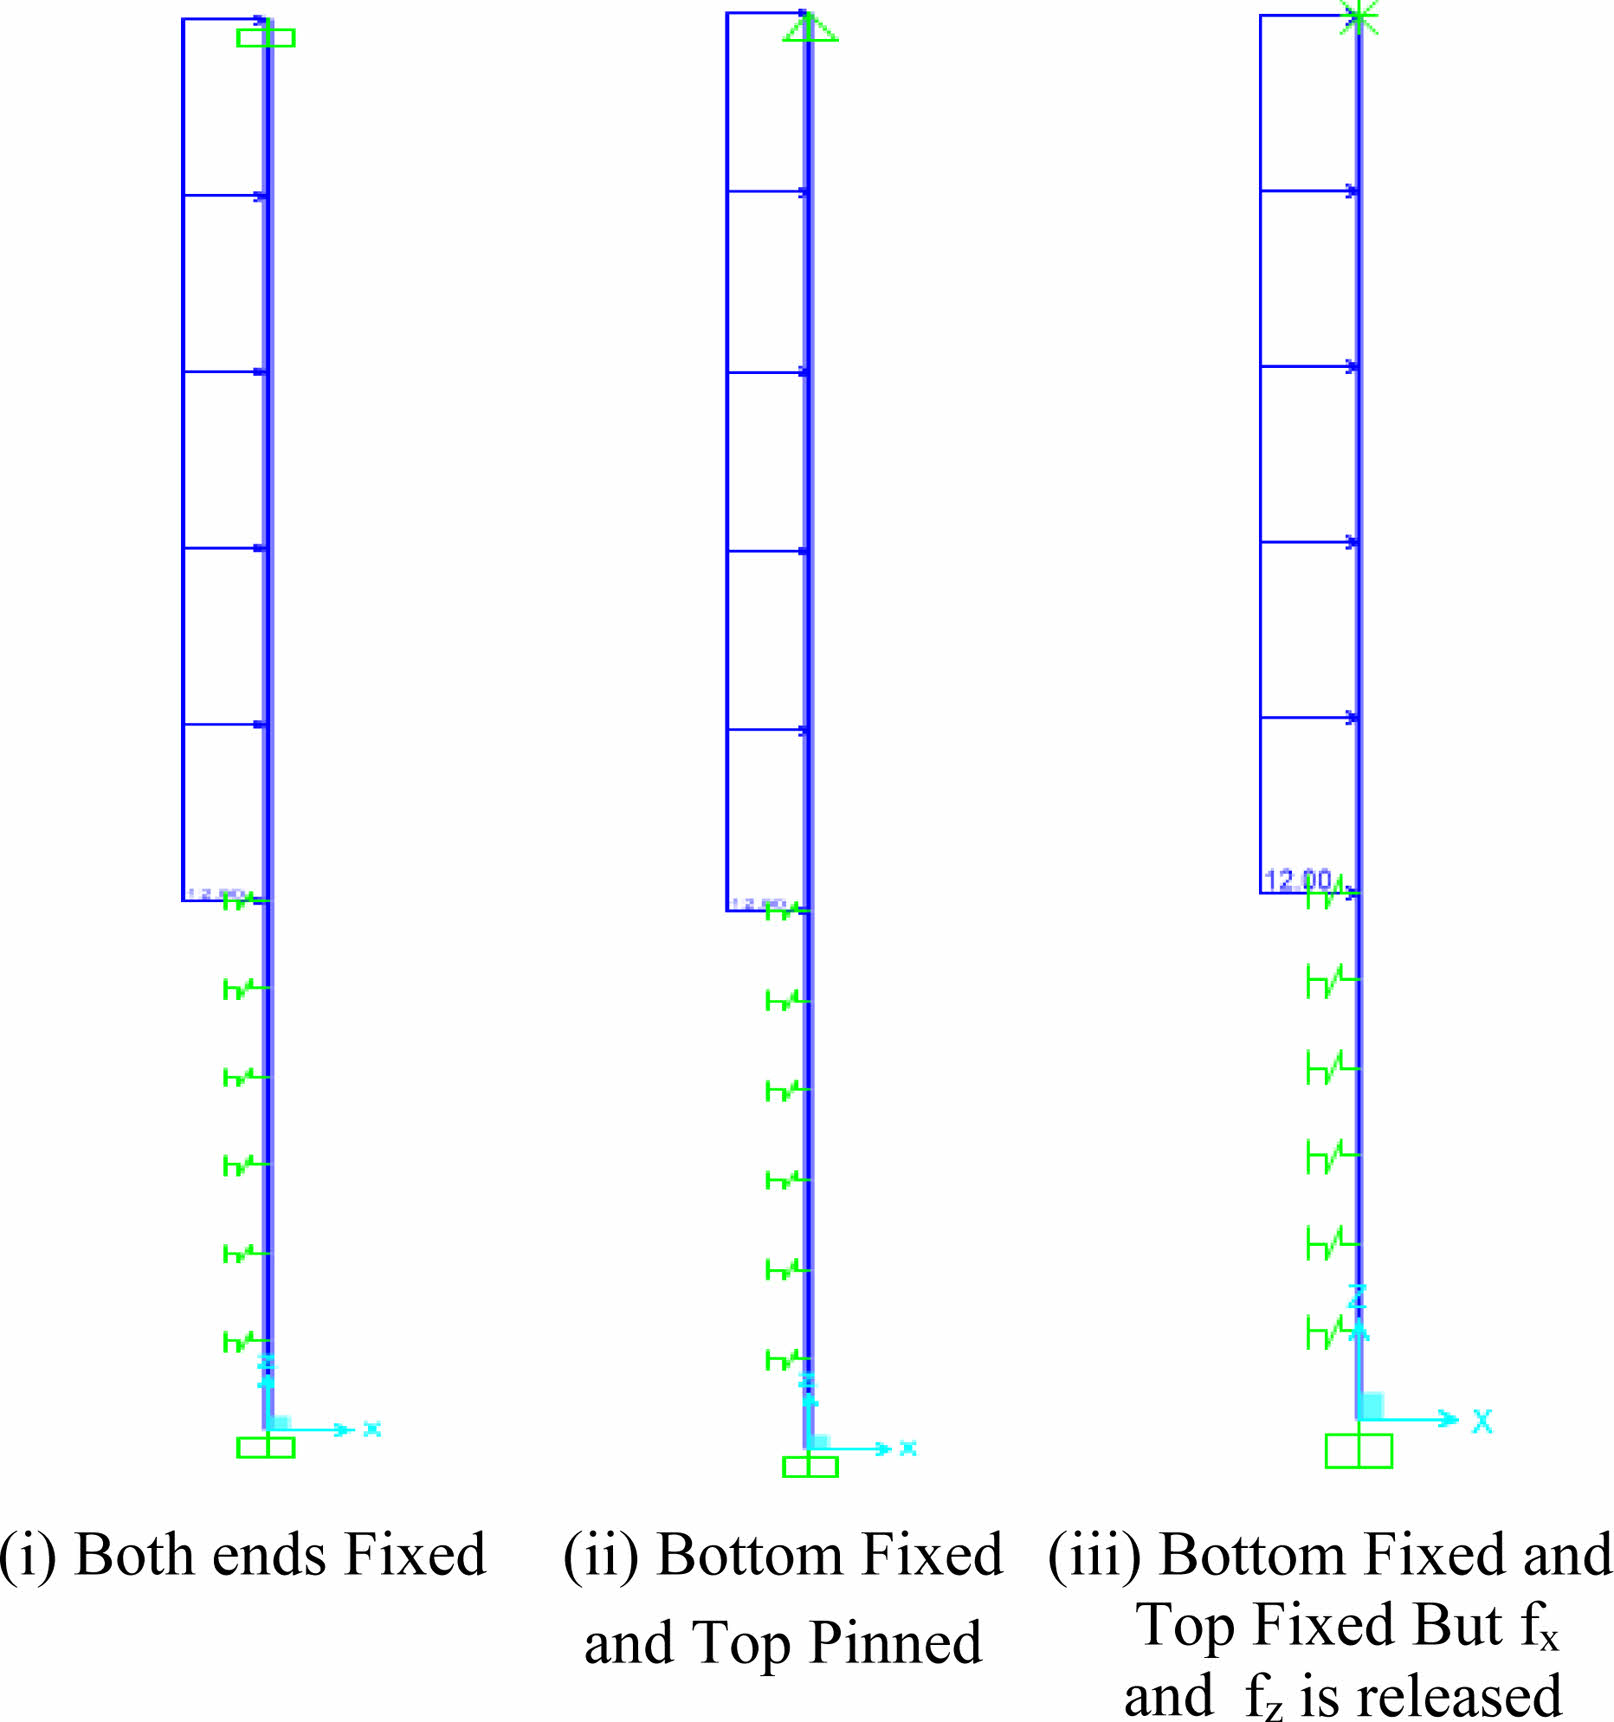
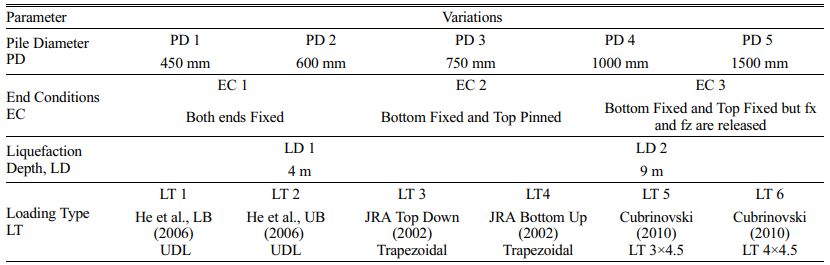
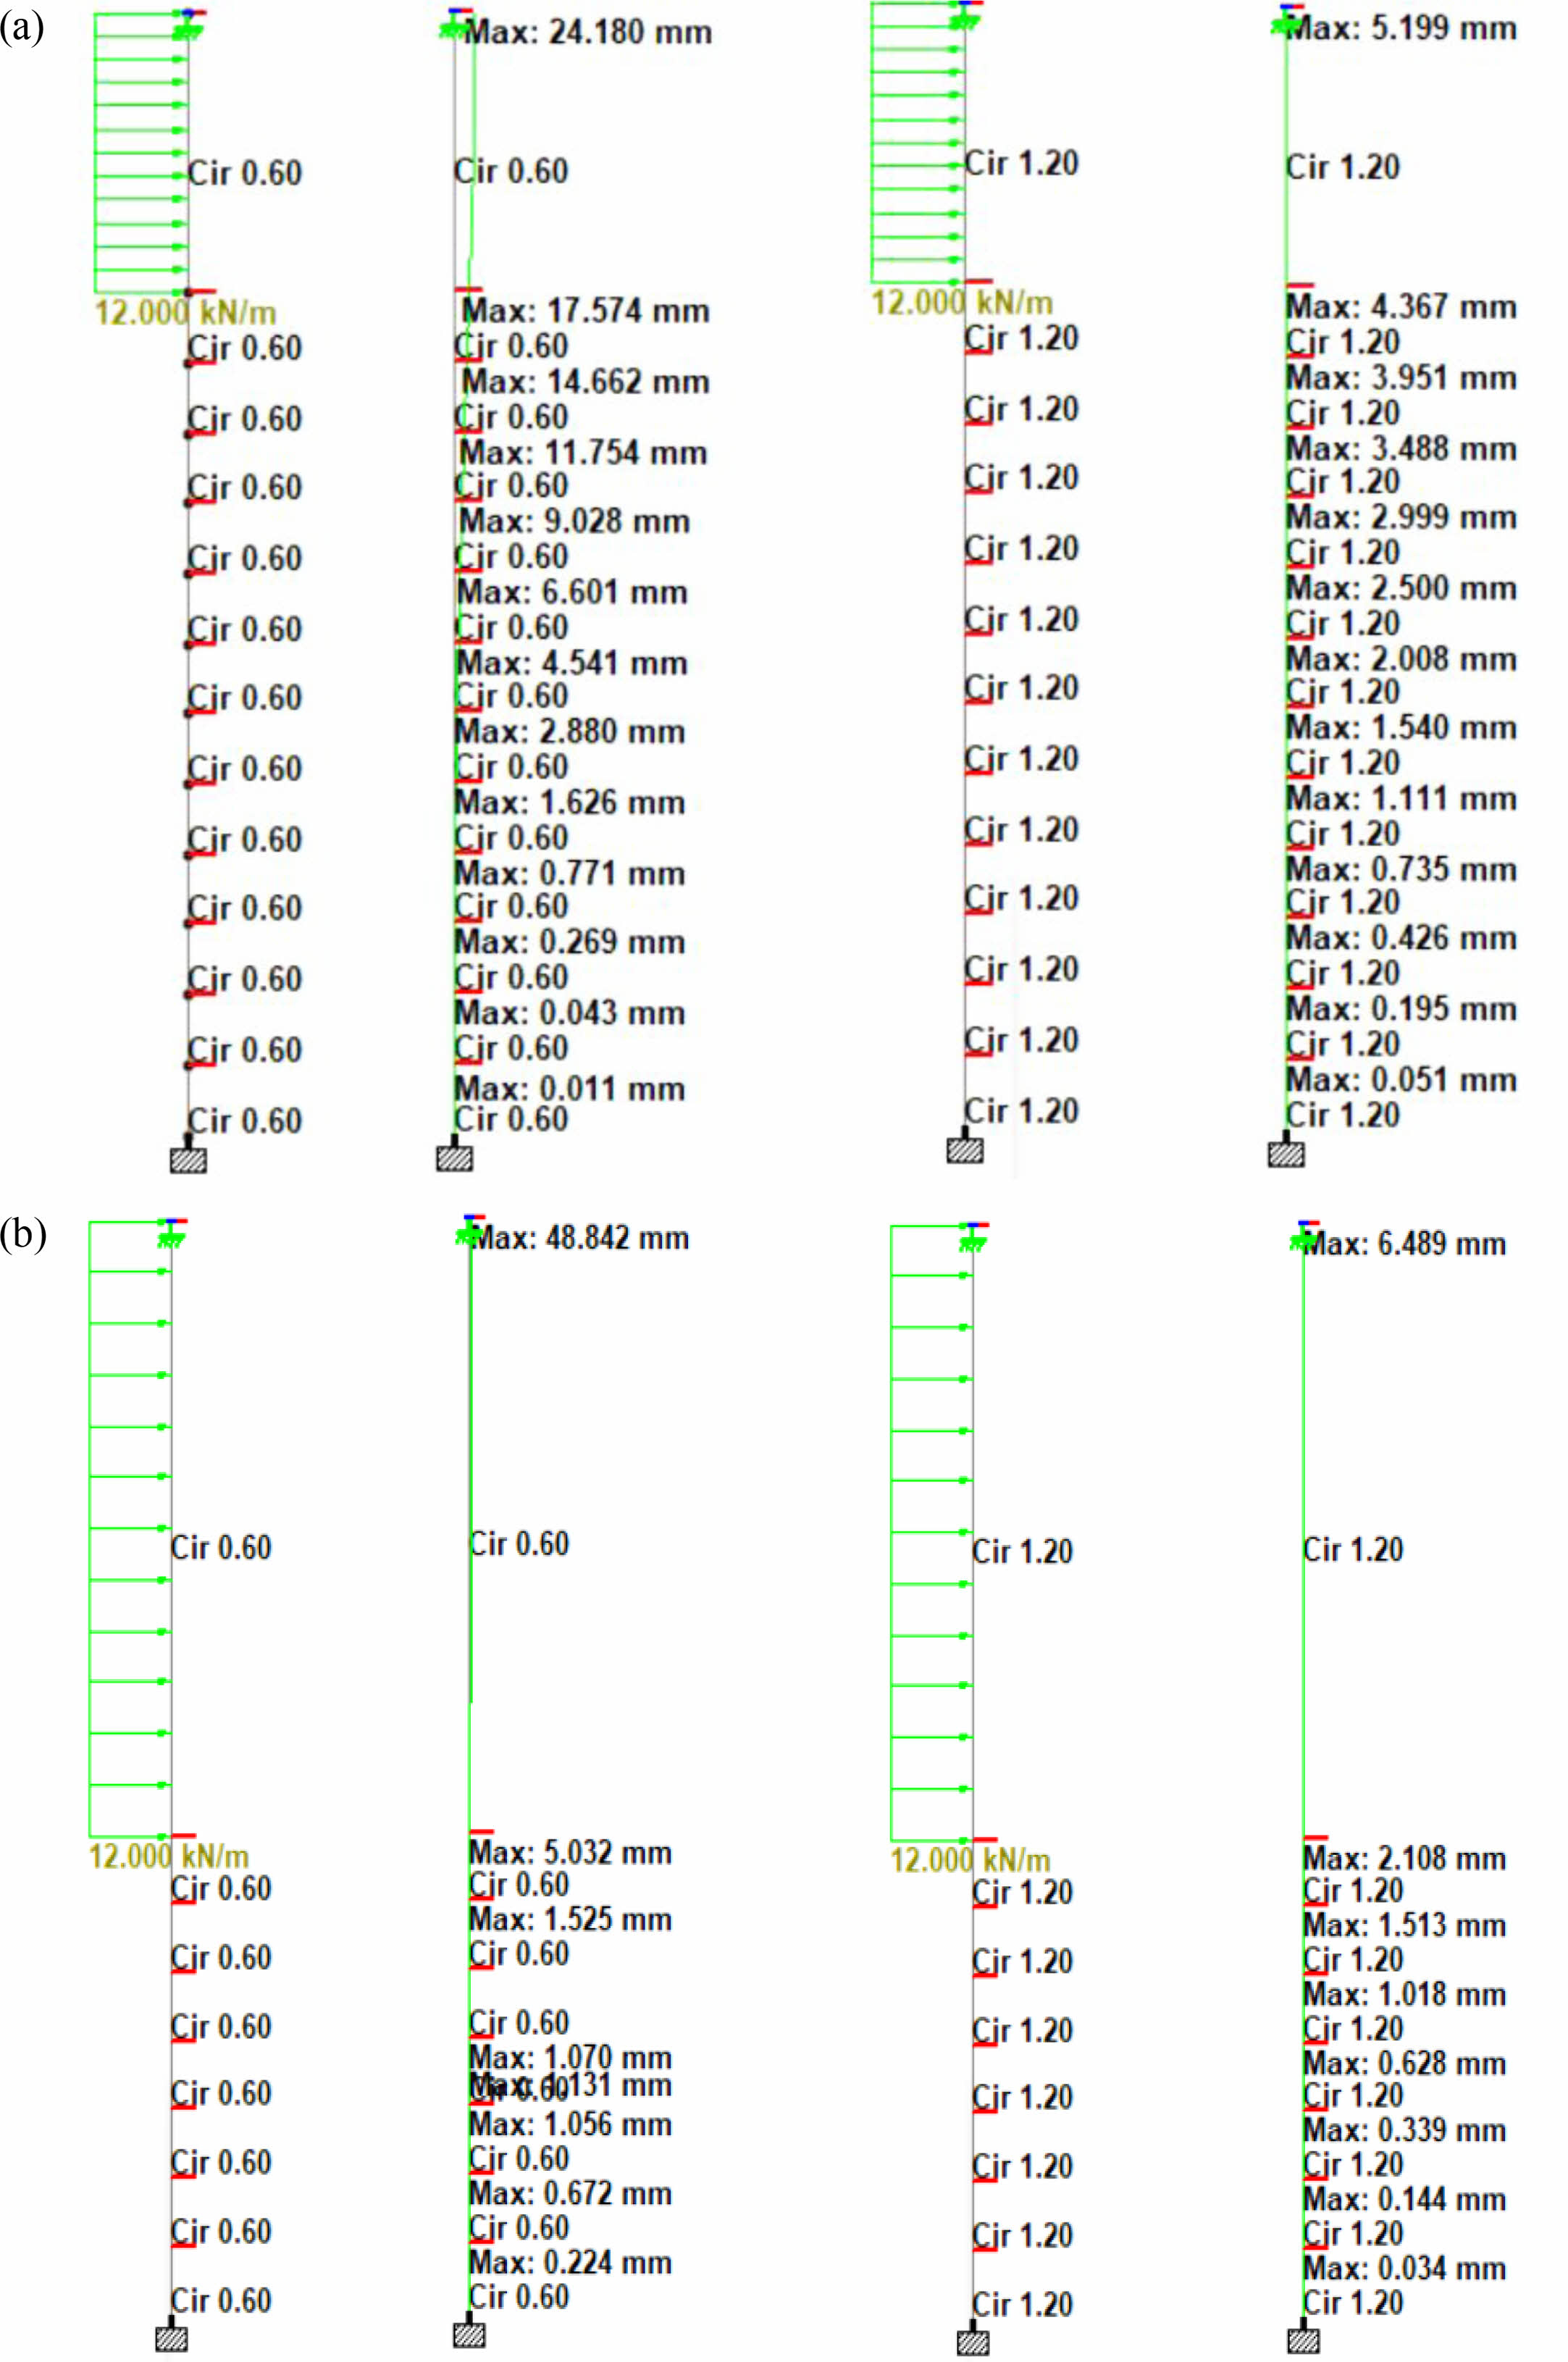
To understand the influence of the presence of bridge structure on the top of the pile, the end conditions of the pile head are varied. The bottom end of the pile is assumed as permanently fixed. The different end conditions considered are 1. Both ends are Fixed 2. Bottom Fixed and Top Pinned, and 3. Bottom Fixed and Top Fixed but fx and fz are released. The schematic diagram of the entire pile model for a 9 m depth of liquefaction for loading is shown in Figure 2.
Force Based Analysis
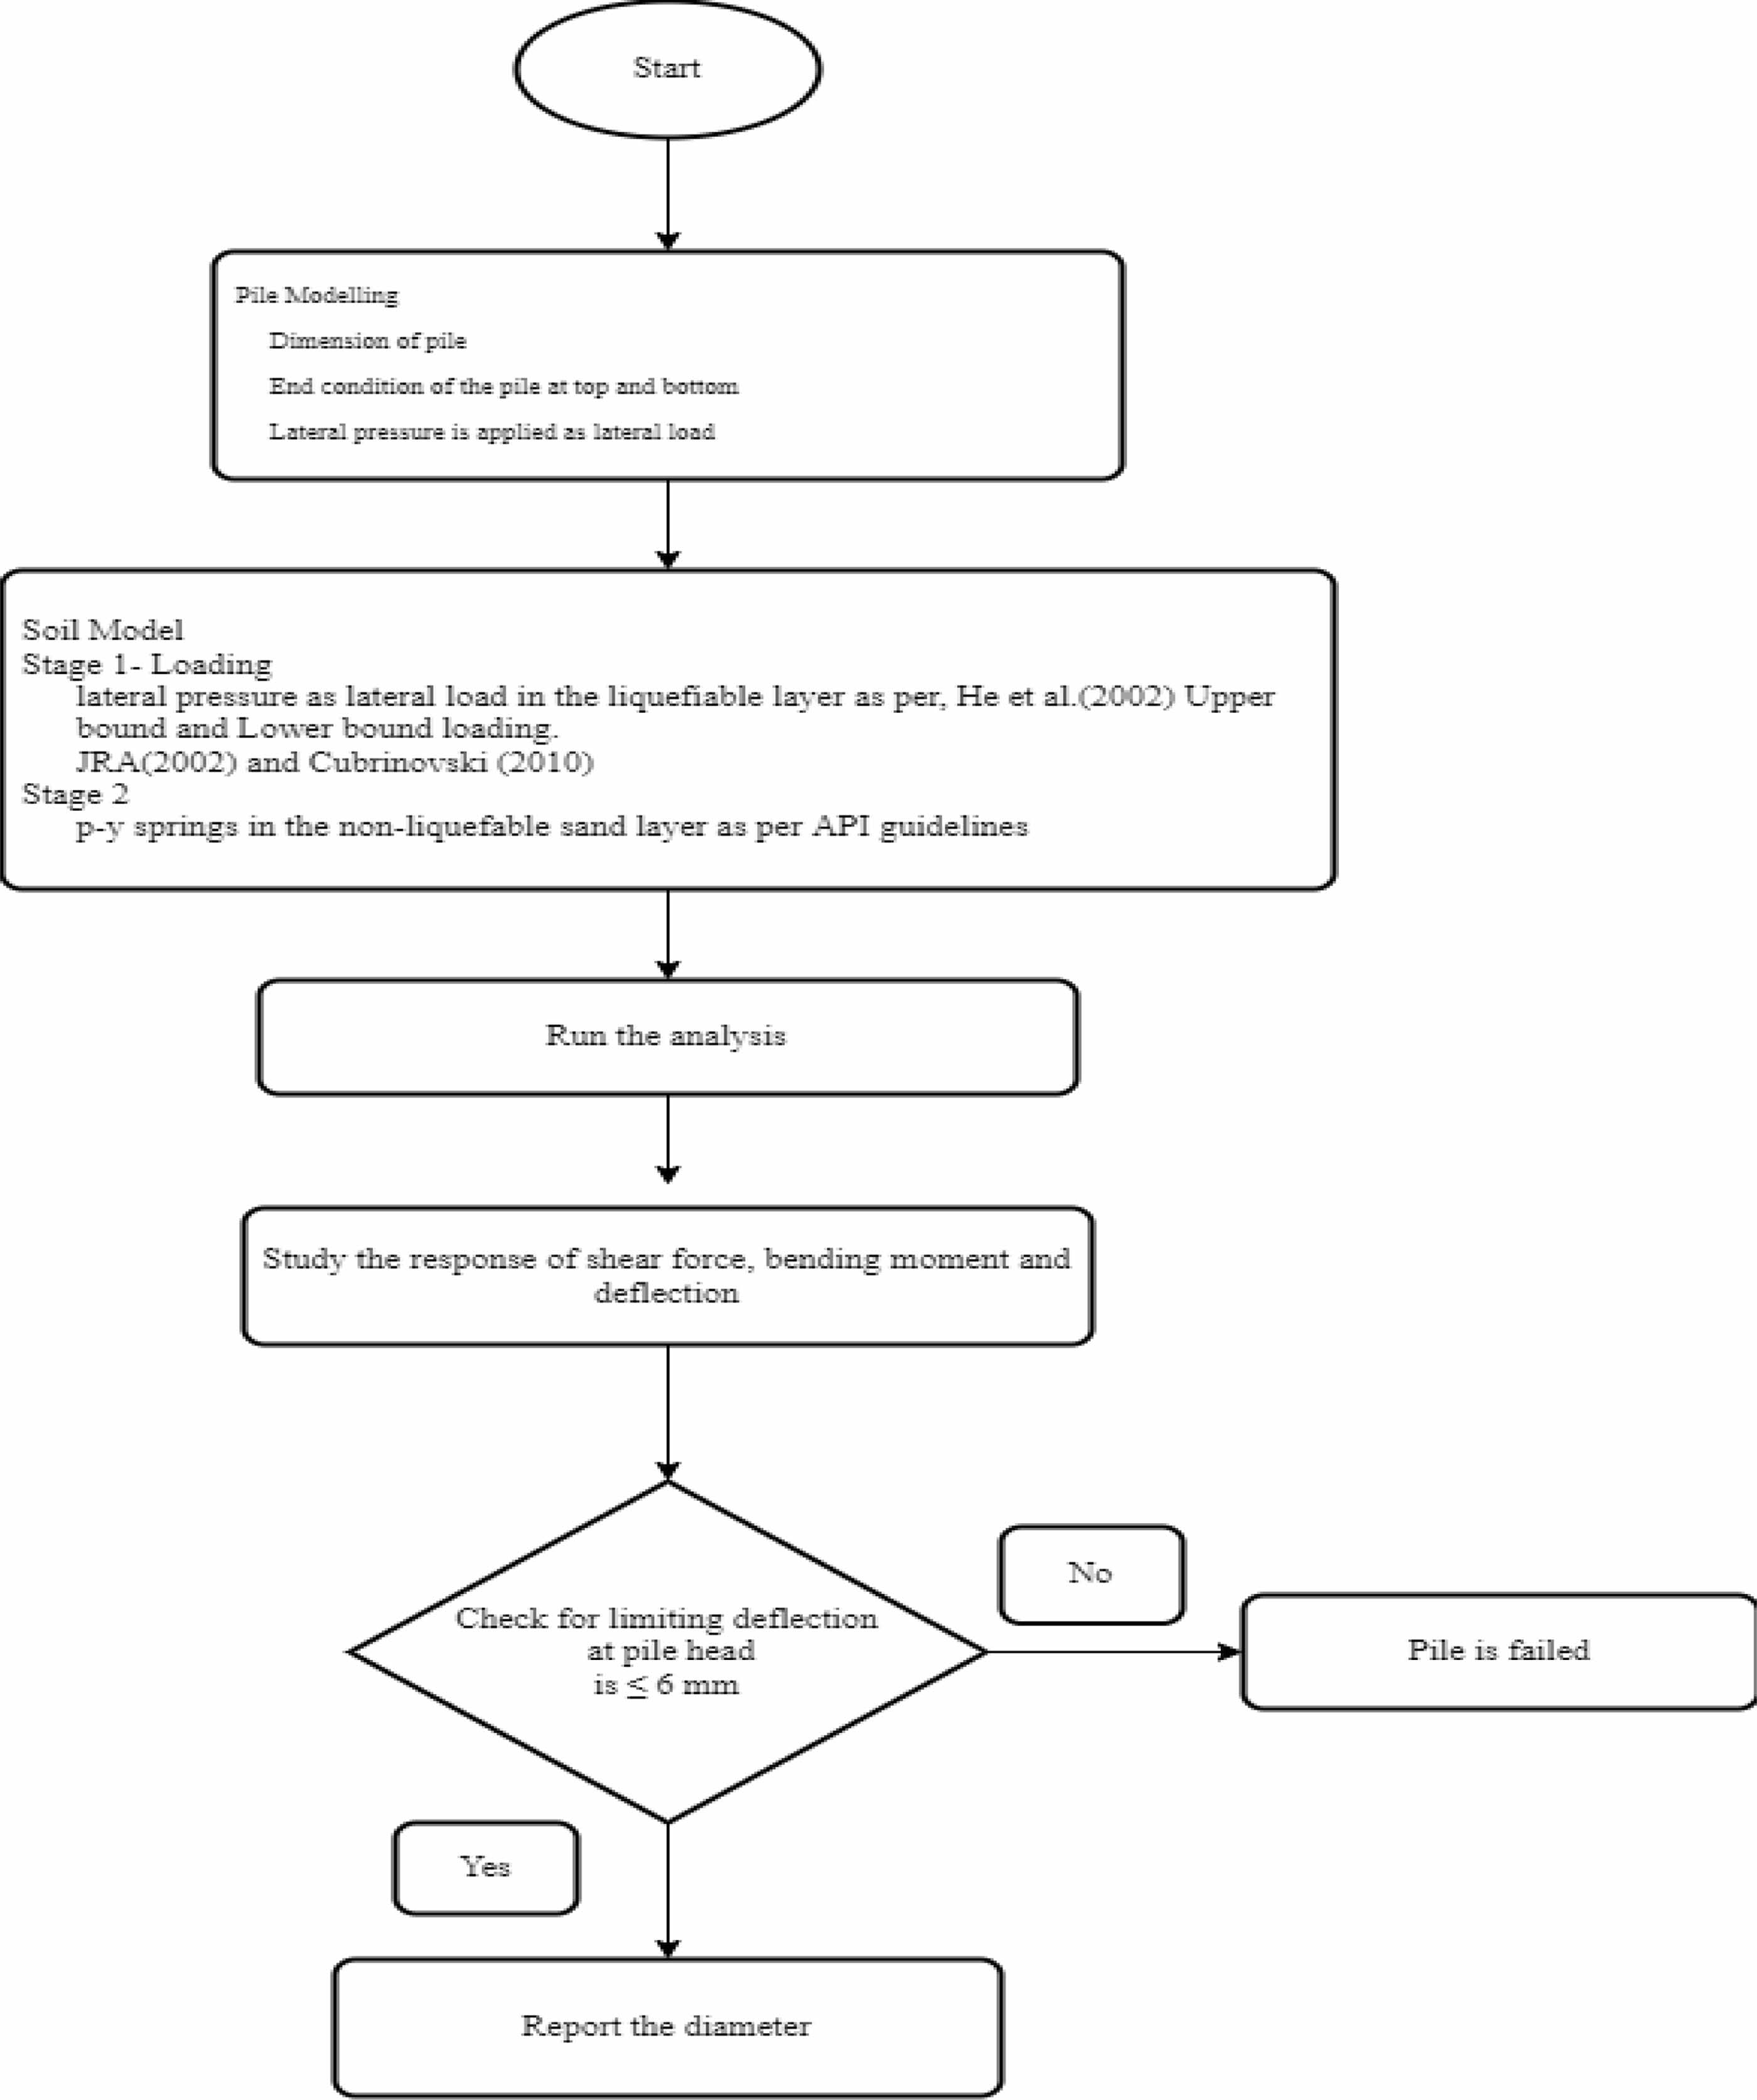
The lateral pressure exerted on the pile is determined directly using the force-based methodology. The estimated pile reaction is next tested against pile yielding and the permitted deflection. SAP2000 V15 was used to do the bending study after modeling the pile, the soil, and estimating the lateral loads using a force-based methodology. This analysis makes use of the soil pressure profiles. As a consequence of the analysis, structural parameters for various end conditions and lateral loading, including shear force, bending moment, and deflection profile, have been determined. It was also done to check for the limiting deflection. Figure 3 displays the flowchart for the approach used in this analysis [18-20]. Table 4
Validation of Analysis Using Sap2000 V15
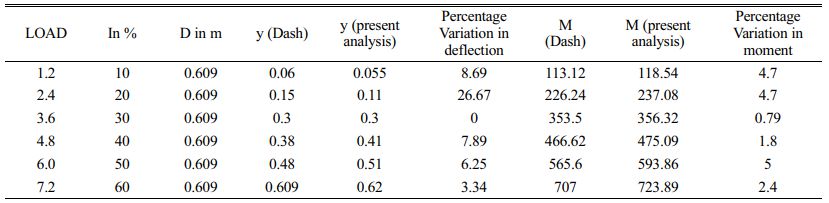
A case study discussed by was chosen to validate the analysis with the SAP2000 V15 soft tool. Analysis of a 25 m long steel tubular pile was selected. The material and section properties are the same as those adopted by 2010. The lateral load due to liquefied layer is modeled as a force-based approach, and the non-liquefied layer was modeled using API guidelines as a p-y spring. Hence, a similar loading is adopted and used to validate the result without considering the axial load. Table 5 lists the validation results of bending analysis, which is reanalyzed using the procedure. The pile and the soil modeling procedure are the same as. The results obtained are comparable with the literature. Hence the same analyzing procedure and the soft tool is used for the current work.
|
Fig. 1 Soil profiles used in the analysis. |
|
Fig. 2 Schematic diagram of the entire model of the pile for 9 m depth of liquefaction. |
|
Fig. 3 Flowchart for Force-Based Lateral Load Analysis Procedure. |
|
Table 2 The lateral soil pressure loadings calculated for various pile diameters of 9 m liquefaction depth |
|
Table 3 Non-Liquefiable layer - lateral soil spring properties of bottom 7 m surrounding the pile. Depth from ground level (m) N pu (kN/m) yu (m) K= (pu/ |
The influence of various lateral loadings along the length of the pile with varying end conditions and liquefaction depth on the pile behavior are represented graphically for a 600 mm pile. The summary of the overall shear force values, bending moment values, and deflection are shown in Tables 6, 7, and 8.
Influence of lateral loading in the shear force, bending moment, and deflection along the length of the pile for varying liquefaction depth and end condition.
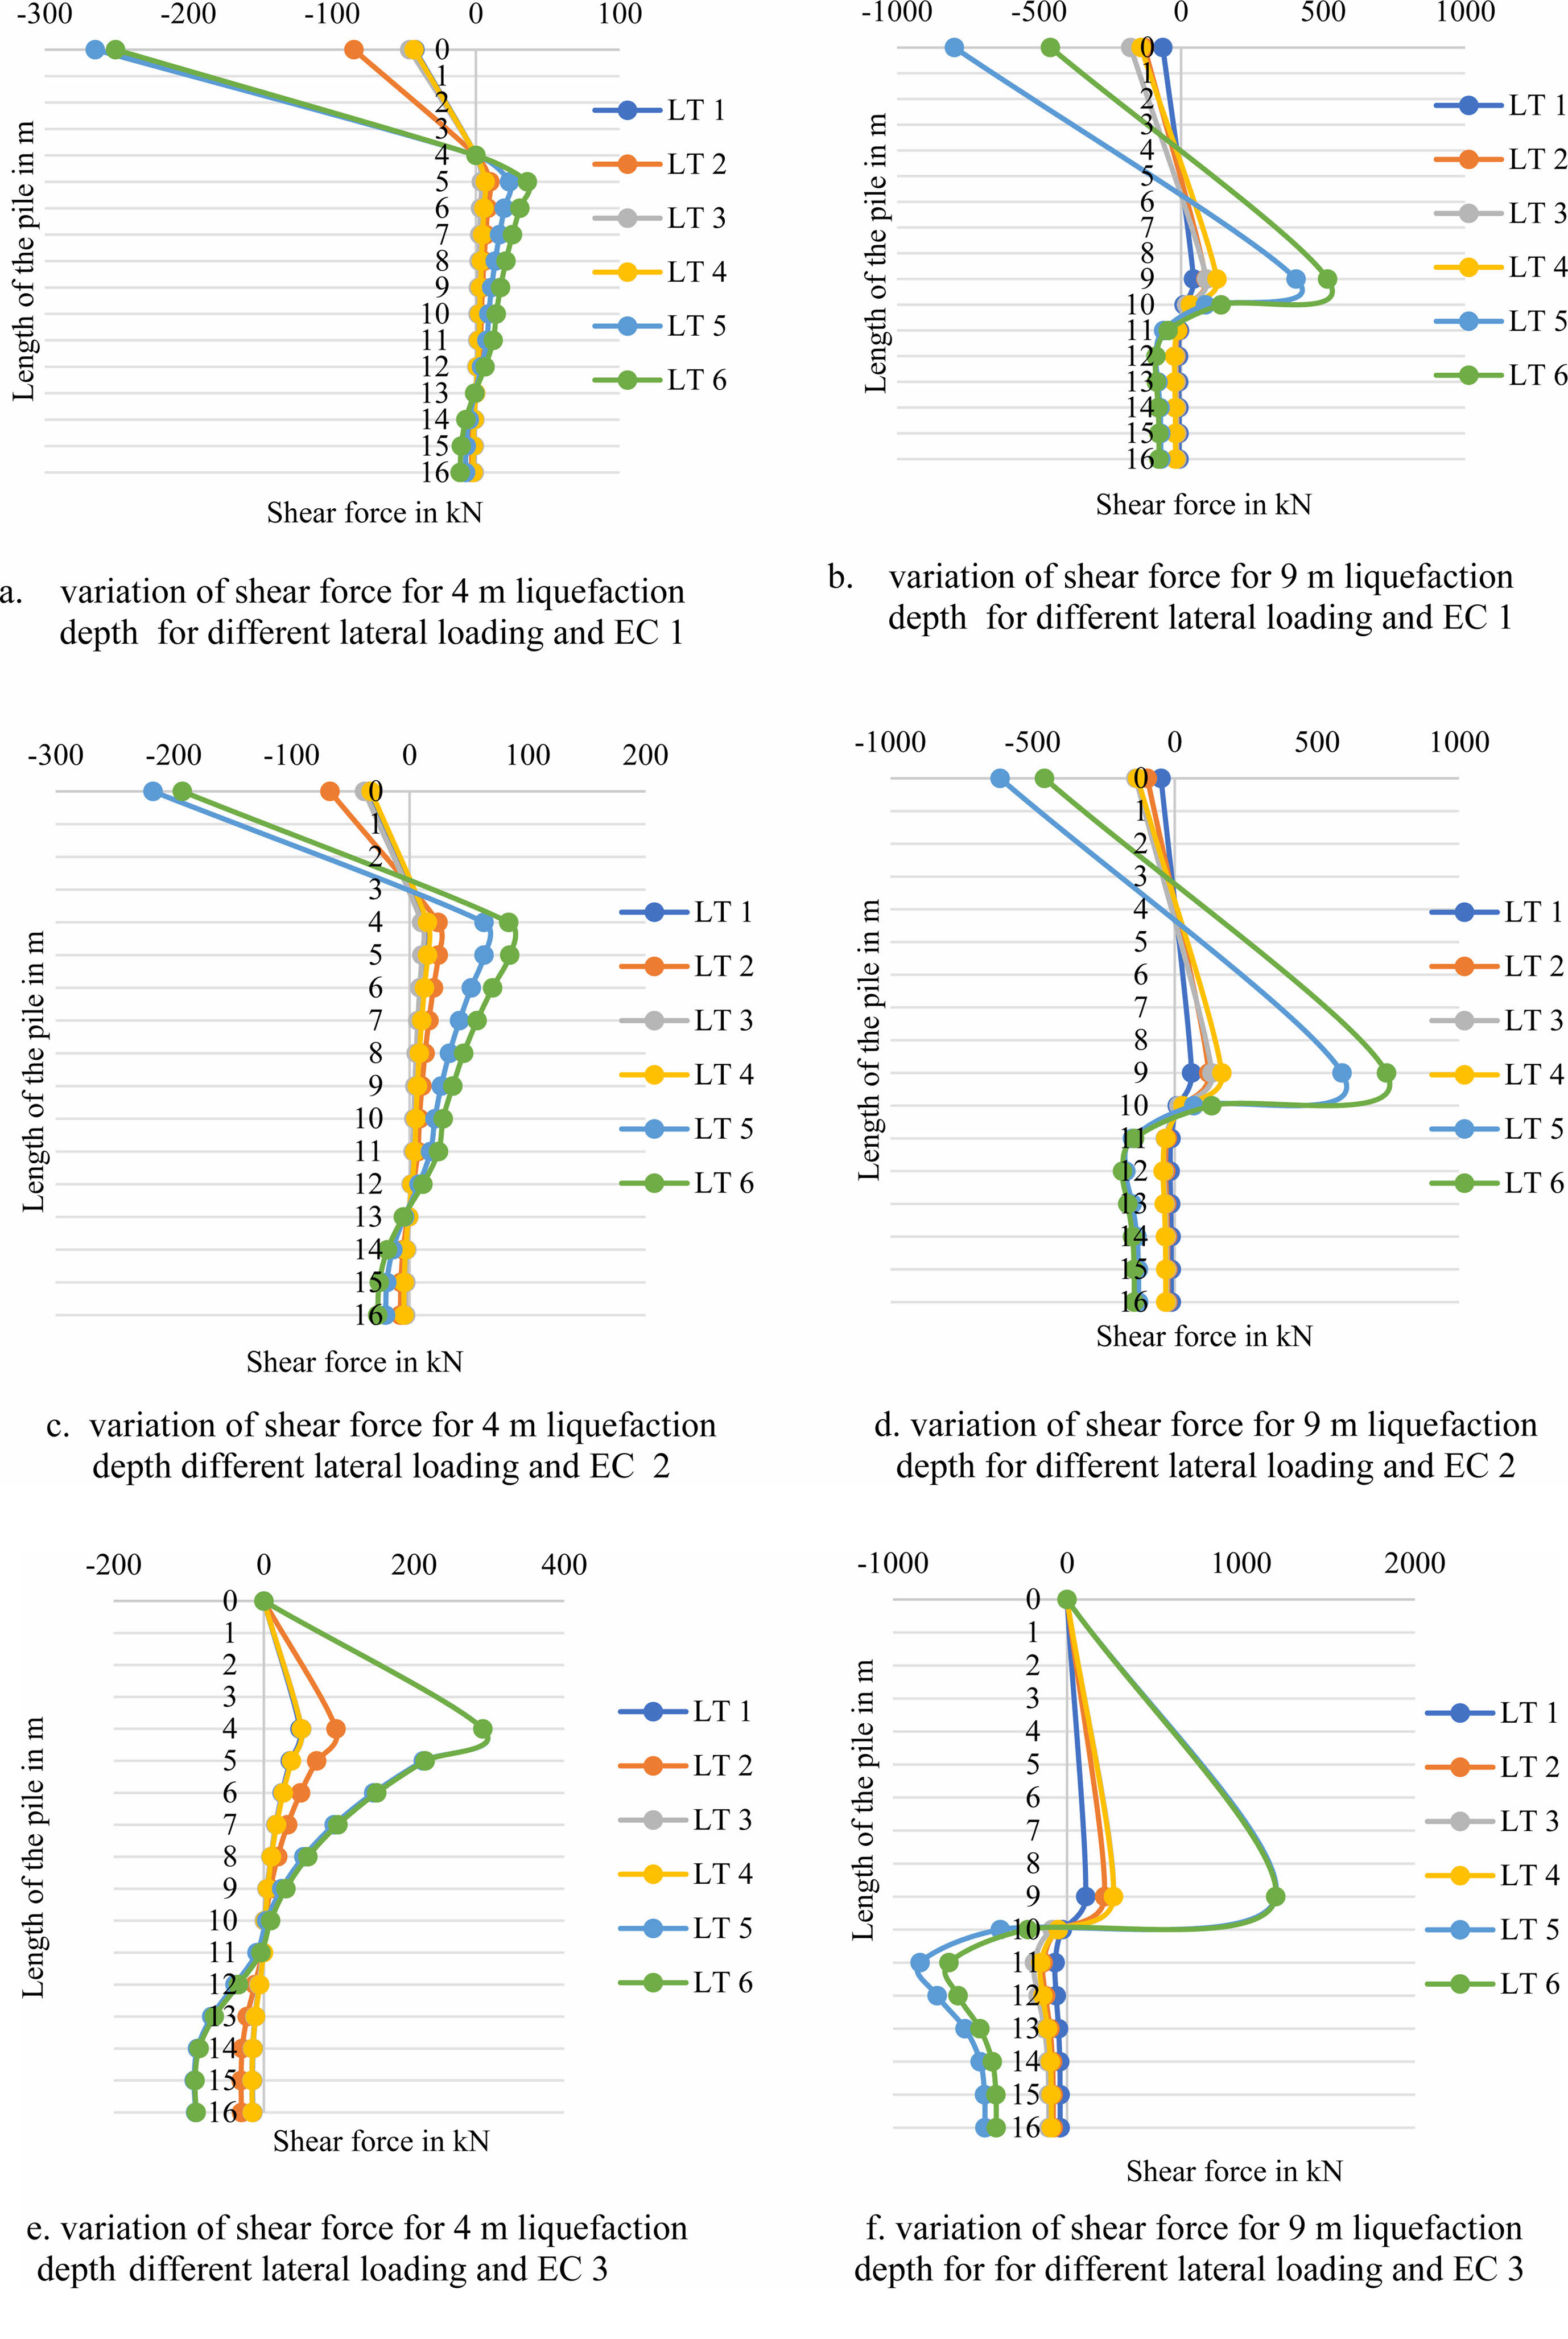
Figure 4 shows shear force for various end conditions for 4 m and 9 m liquefaction depth with varying lateral load.
The general trend of variation of shear force for different lateral loadings and end conditions is almost similar.
For EC 1, the maximum shear force is at the pile head position for all loading types of 4 m and 9 m liquefaction depth. The first change of negative to a positive is at the pile length of 4 m from the pile head for 4 m liquefaction depth. The next change from positive to negative is observed at a pile length of 13 m from the pile head for a 4 m liquefaction depth. For 9 m liquefaction depth, the first change of negative to positive is at a pile length of 6 m from the pile head. The next change from negative to positive is observed at a pile length of 10 m from the pile head.
For EC 2, the maximum shear force is at the pile head position for all loading types for 4 m and 9 m liquefaction depth. The first change of negative to positive is at a pile length of 2 m to 3 m from the pile head for a 4 m liquefaction depth. However, for 9 m liquefaction depth the first change of negative to positive is at a pile length of 3 m to 4 m. The next change from positive to negative is observed at a pile length of 13 m from the pile head for a 4 m liquefaction depth. But for 9 m liquefaction depth, the above change from positive to negative is at a pile length of 10 m from the pile head.
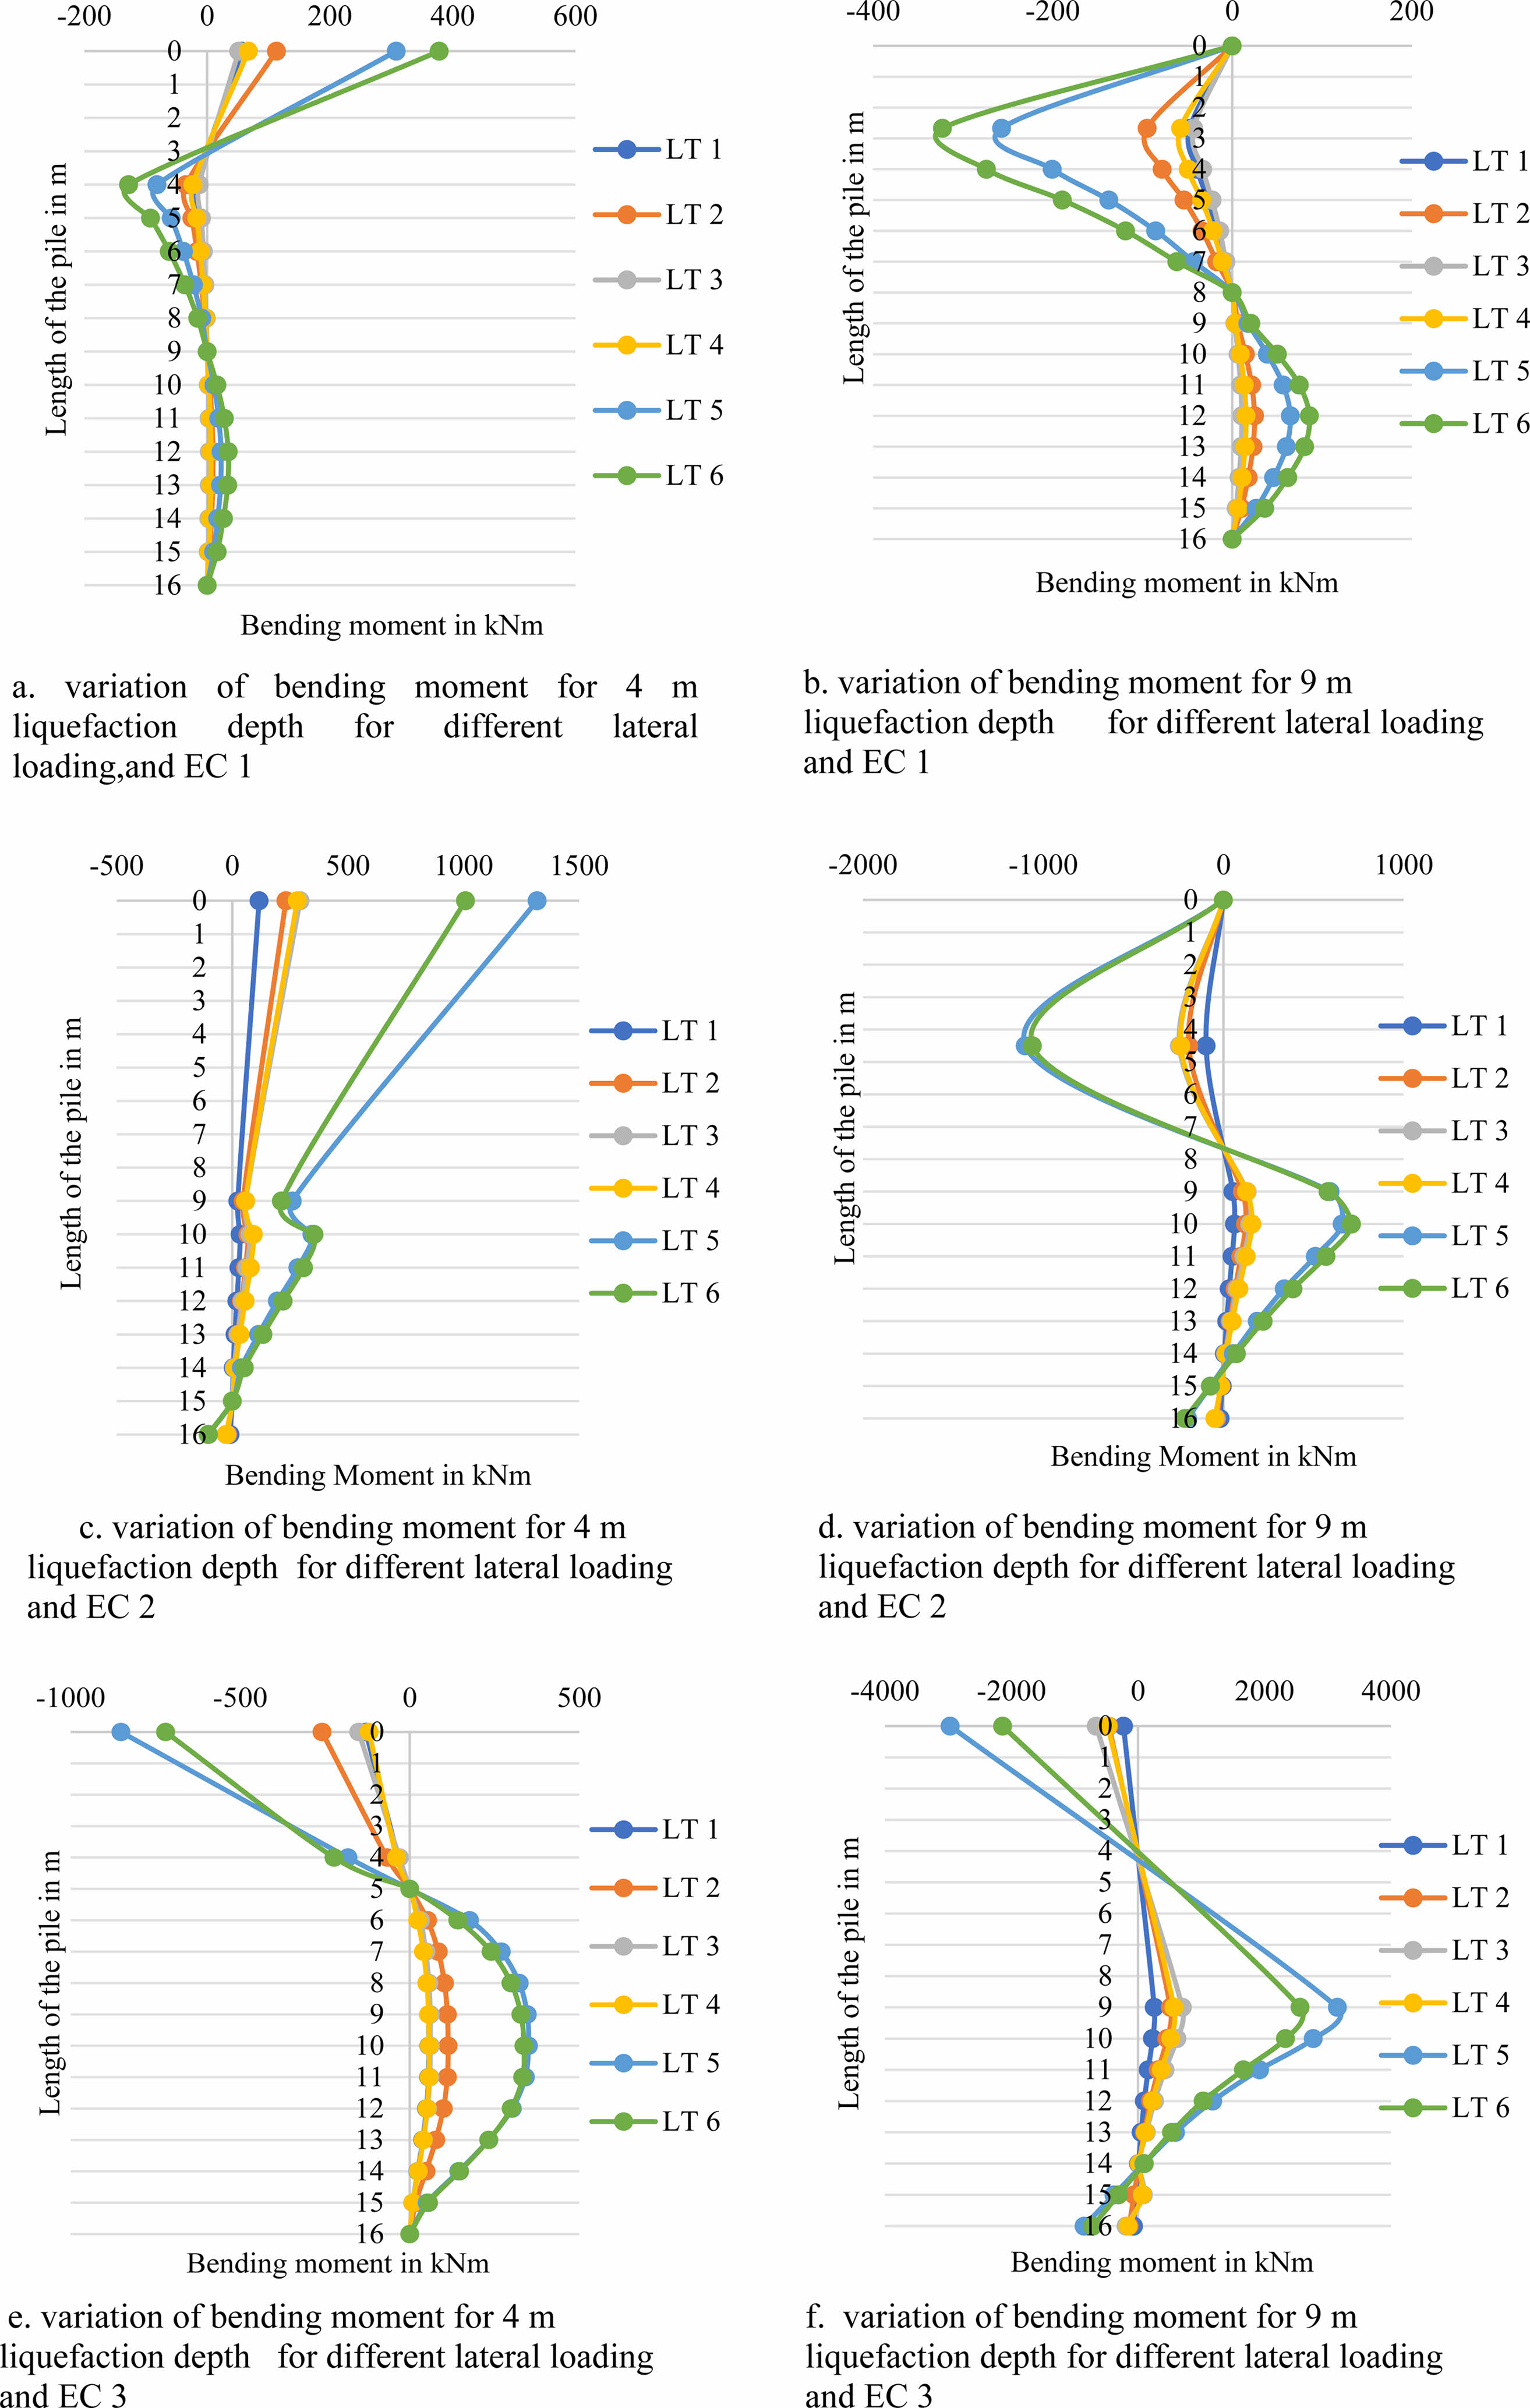
For EC 3, the maximum shear force is 4 m from the pile head for a 4 m liquefaction depth. The first change from positive to negative is at the pile length of 10 m from the pile head for a 4 m liquefaction depth. For a 9 m liquefaction depth, the maximum shear force is 9 m from the pile head. The first change of positive to negative is at the pile length of 10 m from the pile head. Figure 5 shows the bending moment for various end conditions for 4 m and 9 m liquefaction depth for different lateral loading.
The general trend of variation of bending moment for different lateral loadings and end conditions is almost similar.
For EC 1, the maximum bending moment is at the pile head for 4 m and 9 m liquefaction depth. The first change of positive bending moment to negative bending moment, point of contra flexure, is at the pile length of 3 m for 4 m liquefaction depth. The second contra-flexure point is at a pile length of 8 m for a 4 m liquefaction depth. For 9 m liquefaction depth, there is a change in the sign of bending moment at 15 m and changes to the negative direction at the pile tip.
For EC 2, the maximum bending moment for a 4 m liquefaction depth is 2.67 m from the pile head and 4.5 m for a 9 m liquefaction depth. The first change of negative bending moment to positive bending moment, point of contra flexure, is at a pile length of 8 m for 4 m liquefaction depth. For 9 m liquefaction depth, there is a change in the sign of bending moment and there are two points of contra flexure. The two points of contra-flexures are at pile lengths of 7 m to 8 m and 14 m to 15 m respectively.
For EC 3, the maximum bending moment is at the pile head for a depth of 4 m and 9 m liquefaction depth. The first change of positive bending moment to negative bending moment, the point of contra-flexure, is at the pile length of 5 m. For 9 m liquefaction depth, there is a change of the positive bending moment to the negative bending moment. Two points of contra-flexures are at the pile length of 4 m and 14 m. There is a reduction in bending moment values and gradually reaches zero at the pile tip.
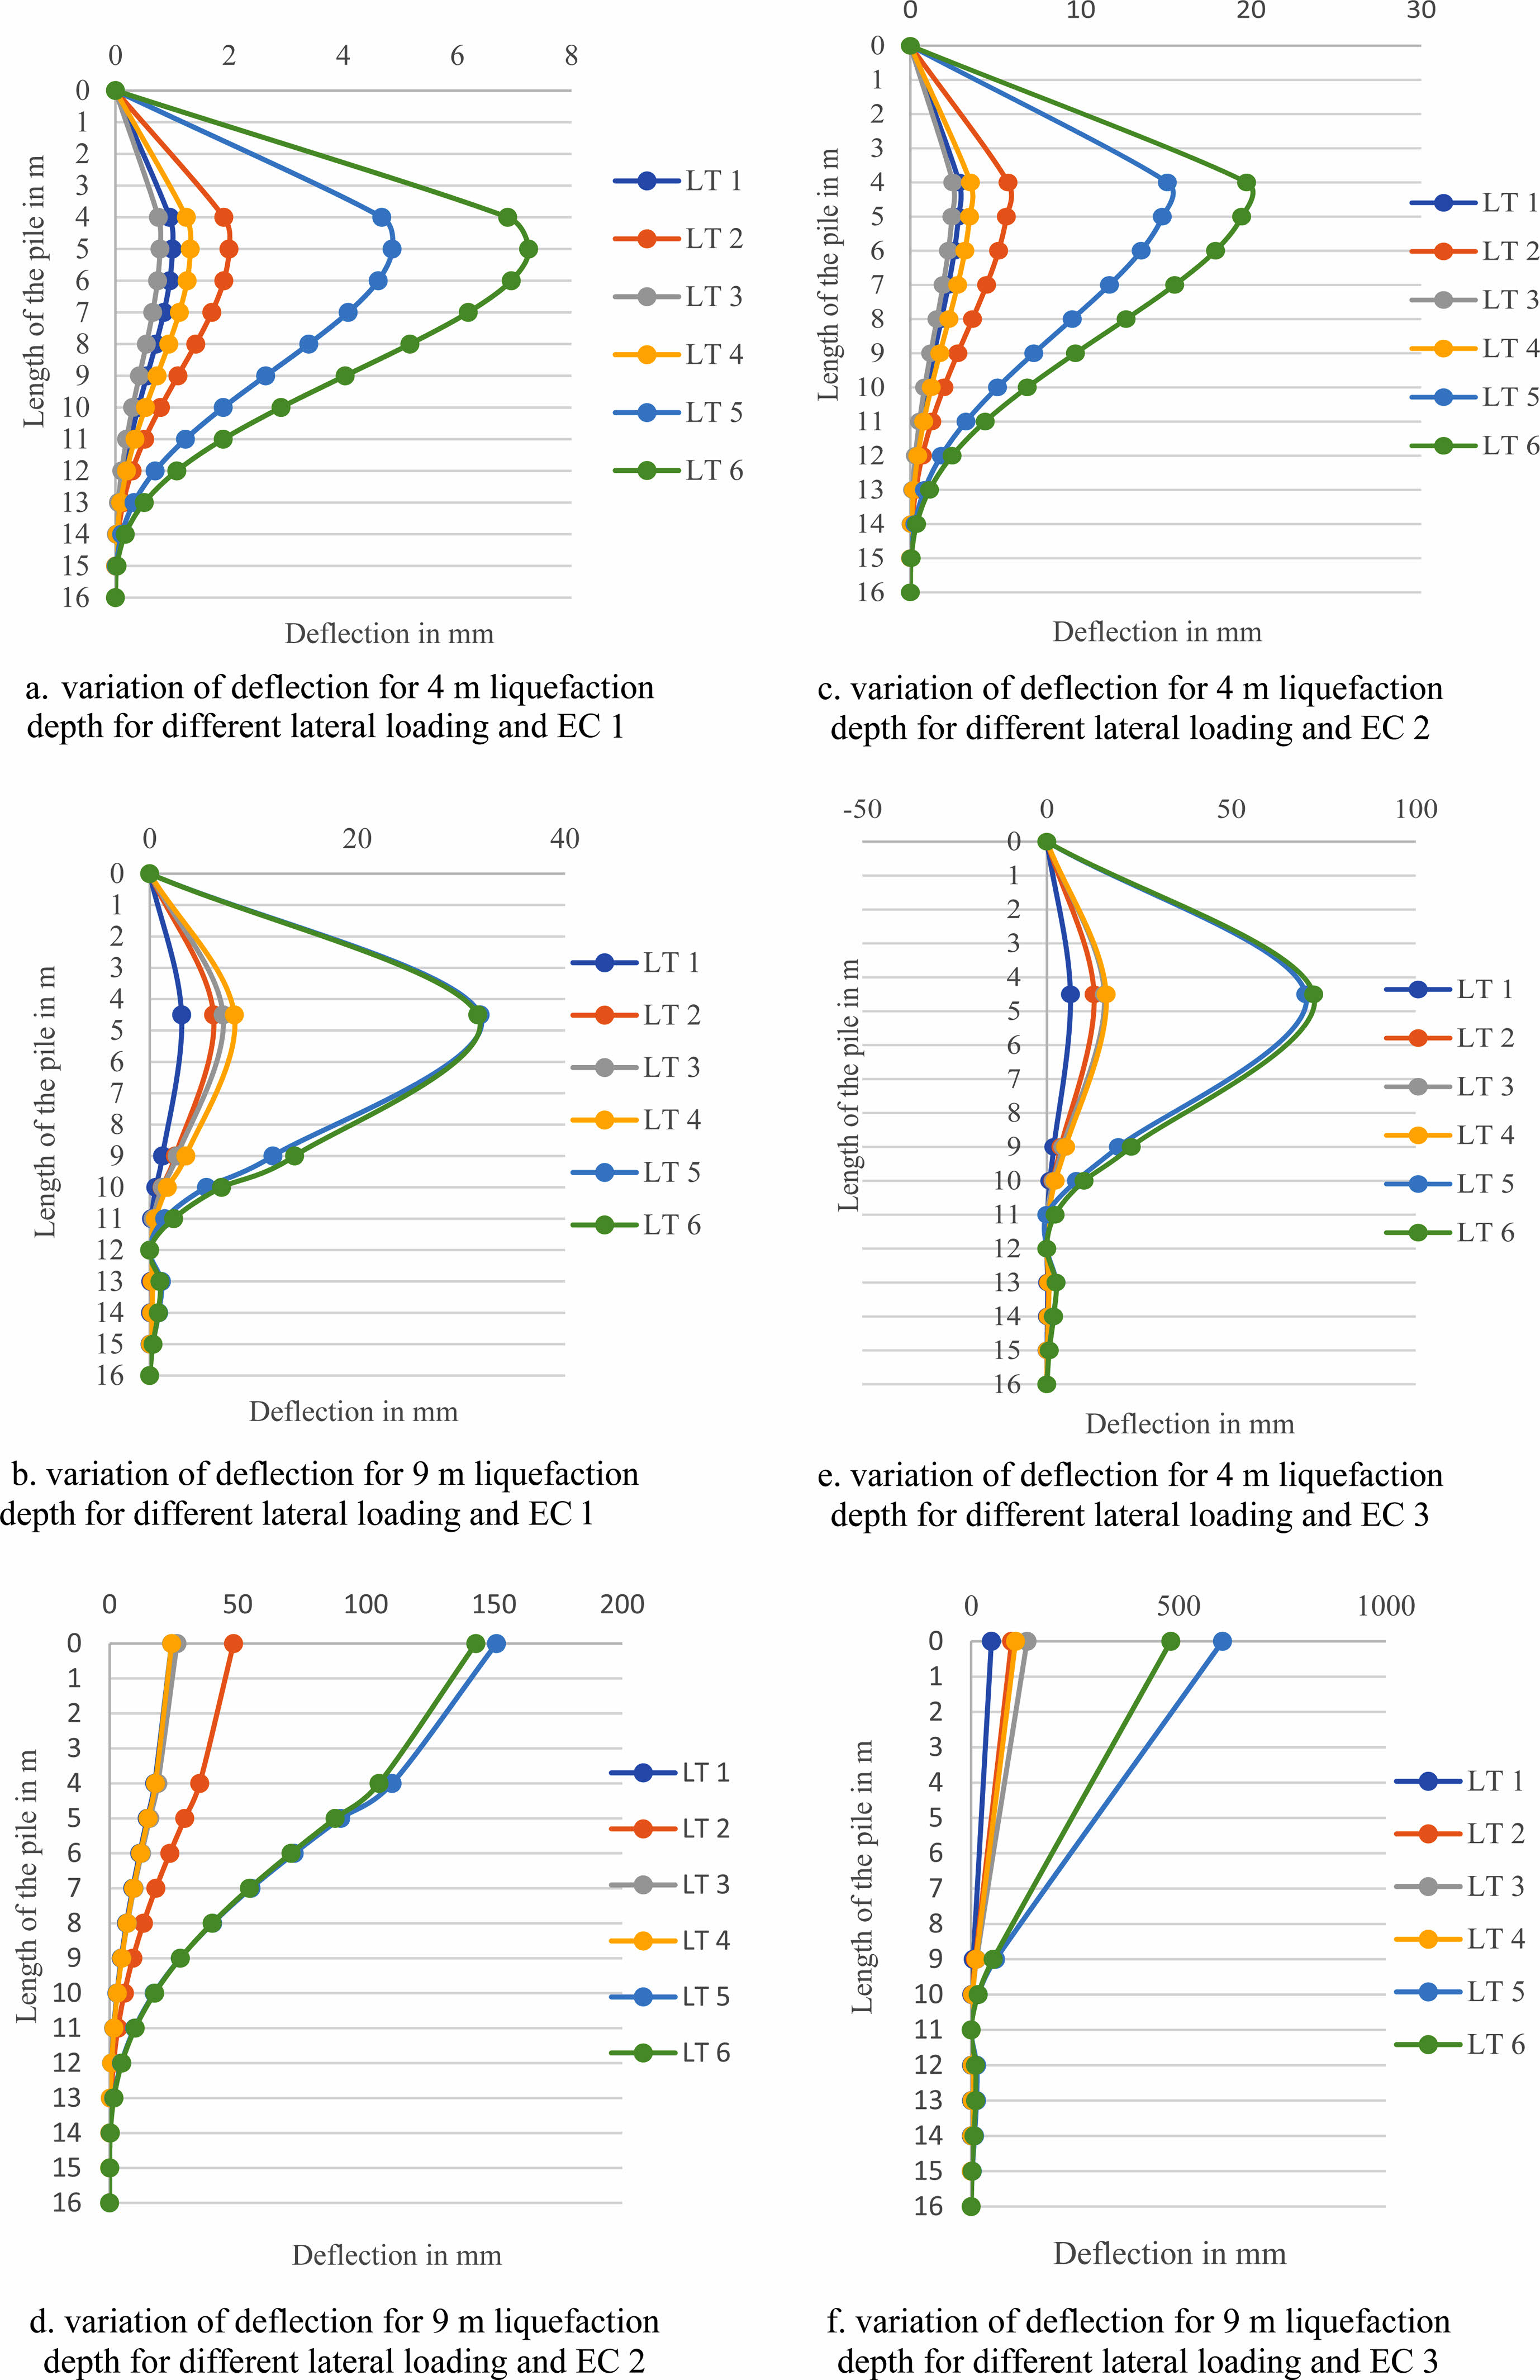
Figure 6 shows a deflection diagram for various end conditions for 4 m and 9 m liquefaction depth and lateral loading.
The general trend of deflection variation for different lateral loading is represented in the graph for different end conditions for 4 m and 9 m liquefaction depth.
For EC 1 and EC 2, the maximum deflection is at a depth of 4 m from the pile head for a 4 m liquefaction depth and 4.5 m from the pile head for a 9 m liquefaction depth. For EC 3, the maximum deflection is at the pile head and zero at the bottom fixed for both 4 m and 9 m liquefaction depth.
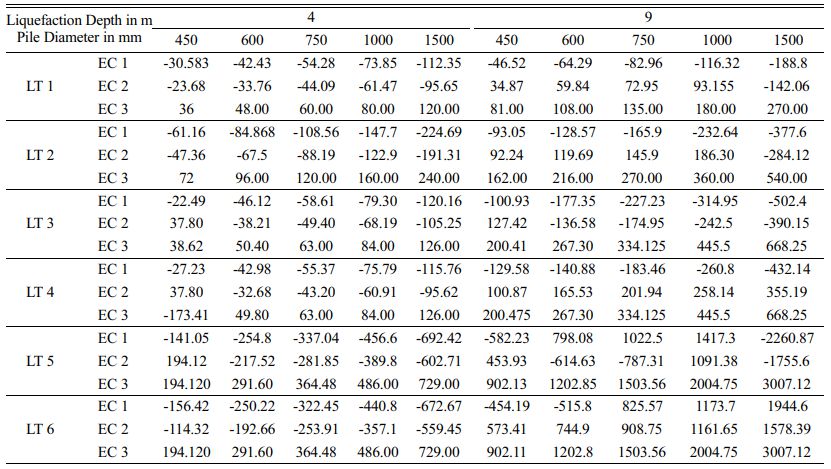
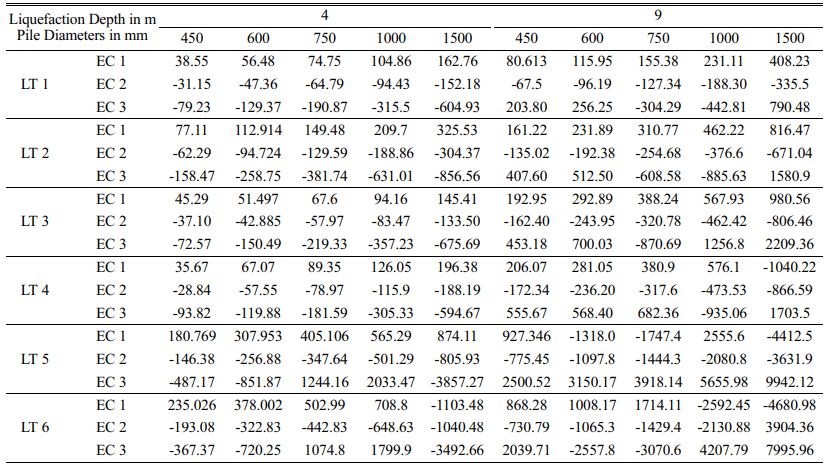
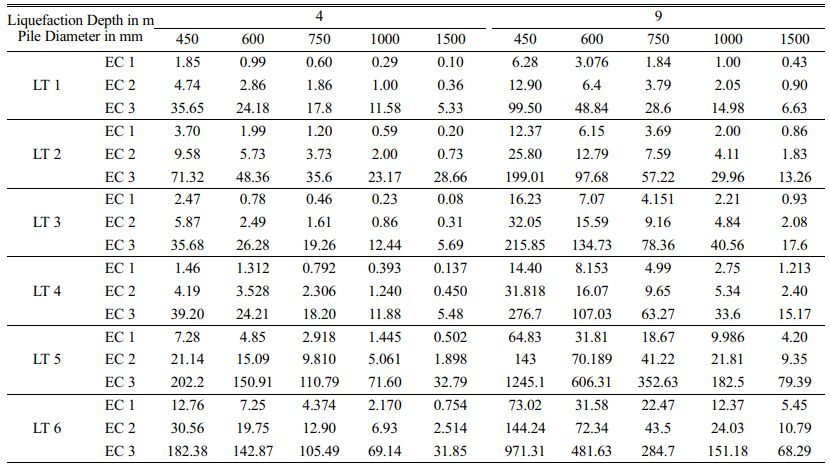
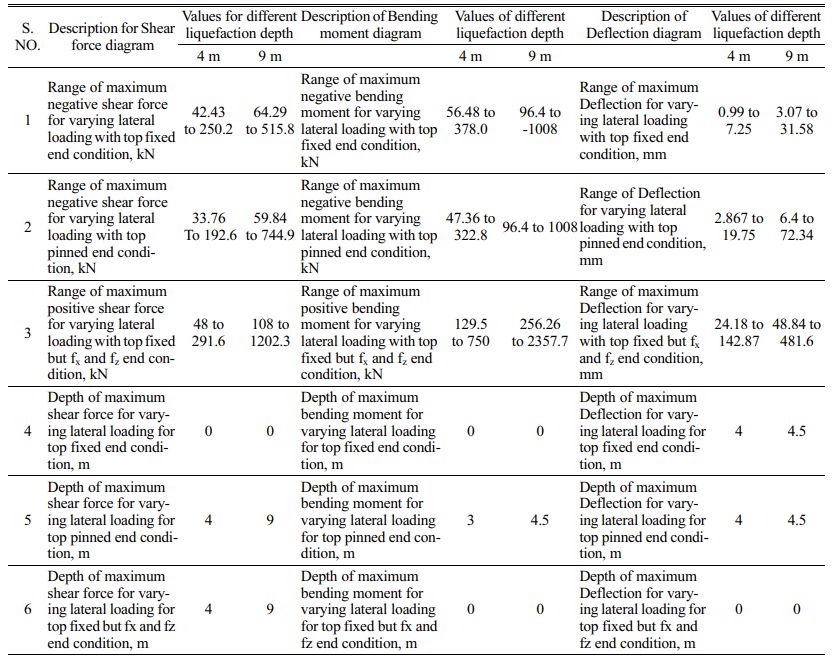
The ranges of maximum and minimum values for shear force, bending moment, and deflection for different liquefaction depths and different end conditions are summarized in Table 9.
Influence of loading type along the length of the pile
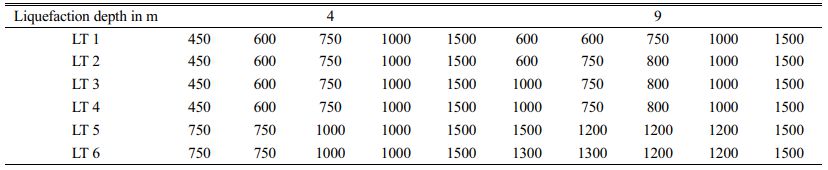
For LT 1 and LT 2 loading types, the variation of shear force value, bending moment value, and deflection value irrespective of the pile diameter is 100%. For LT 3 and LT 4 loading types, there is no variation in shear force value for pile diameter 1500 mm for 4 m LD. Similarly for 9 m LD also there is no variation. For LT 3 and LT 4 loading types, the maximum variation of bending moment value for pile diameter 1500 mm is 29.9 % for 4 m LD. For 9 m LD, this maximum variation of bending moment value for pile diameter 1500 mm is 6.8%. For LT 3 and LT 4 loading types, the maximum variation of deflection for 450 mm pile diameter is 9.4% for 4 m LD. For 9 m LD, the maximum variation of deflection value for pile diameter 450 mm is 25.09%. For LT 5 and LT 6 loading types, there is no variation in shear force value for pile diameter 1500 mm. Similarly for 9 m LD also there is no variation in shear force value for pile diameter 450 mm. For LT 5 and LT 6 loading types, the maximum variation for bending moment value for pile diameter 1500 mm is 22.8% for 4 m LD. For 9 m LD, the maximum variation for bending moment value for pile diameter 1500 mm is 21.69%. For LT 5 and LT 6 loading types, the maximum variation for deflection value for pile diameter 450 mm is 10.20% for 4 m LD. For 9 m LD, the maximum variation for deflection value for pile diameter 450 mm is 24.69%.
Check for Deflection
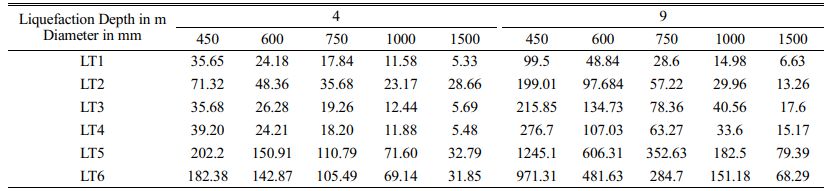
For EC 1 and EC 2, the deflection value at the pile head is zero. For end condition 3, the maximum deflection value is maximum at the pile head. Table 10 provides the deflection values for various loading types of EC 3 at the pile head.
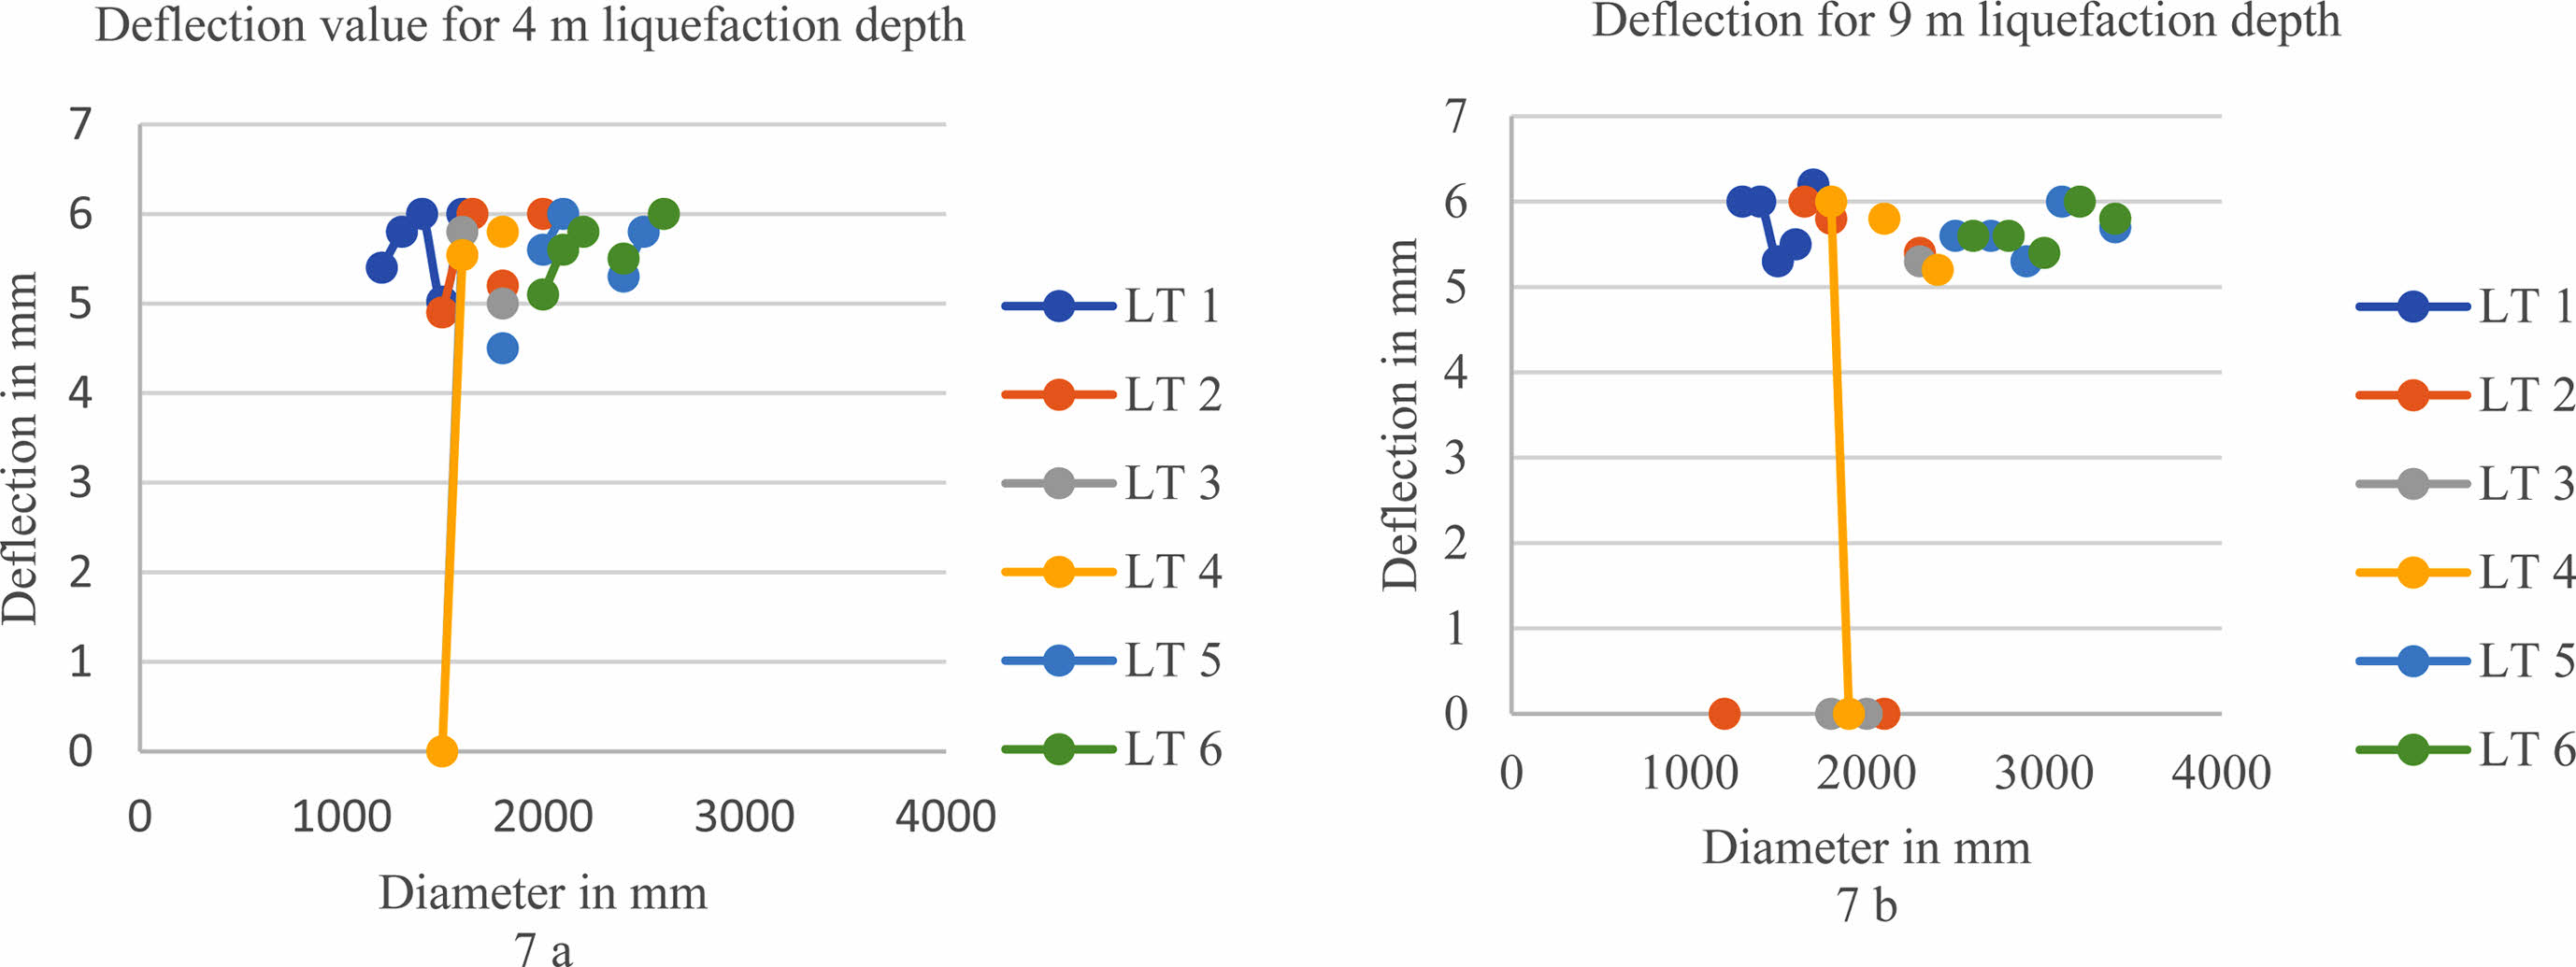
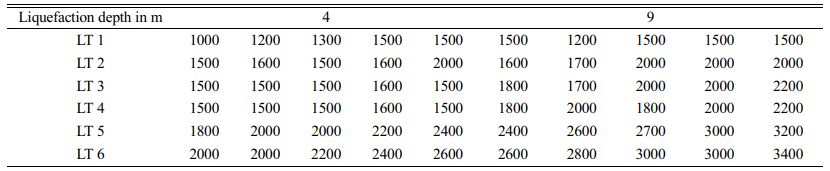
The optimum diameter to meet the limiting deflection of ≤ 6 mm as per IS 2911: 2010 (Part 1/Section 1). EC 3 is listed in the table. 11. the deflection value at the pile head is greater than the limiting deflection value. Hence, the analysis is redone for the EC 3 by increasing the pile diameter by trial and error. The pile diameter is increased in the range of 1200 mm to 2400 mm to reduce the deflection value for EC 3 with LT 1 to LT 4. For LT 5 and LT 6, the pile diameter was increased from 2100 mm to 3400 mm. From Table 11, it is observed that the pile diameter for different loading types for limiting deflection of 6 mm. Since the loading magnitude depends on pile diameter, the pile diameter for limiting deflection also increases for different diameters of the pile. Figure 7a and 7b show the optimum diameter to meet the limiting deflection and 8 a and 8 b show the change of pile diameter from 600 mm to 1200 mm for 4 m and 9 m liquefaction depth to achieve the limiting deflection for the EC 3.
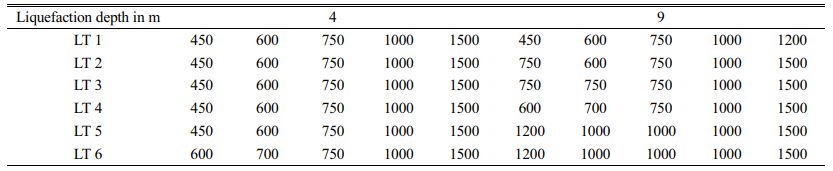
For EC 1, the deflection at the pile head is zero. But along the pile length, there is an increase in deflection greater than the limiting deflection for varying lateral loading. Table 12, lists the optimum pile diameter for EC 1 with varying loading types. The optimum diameter of the pile is arrived at by trial and error. For EC 1 and 4m liquefaction depth, the pile diameter 450 mm is increased to 600 mm, for 600 mm diameter pile is increased to 700 mm, for pile diameters 750 mm, 1000 mm, and 1500 mm there is no change in pile diameter. In the case of 9 m liquefaction depth, the pile diameter increased from 450 mm to 600 mm, 1000 mm, and, 1500 mm for different loading types. Similarly, the pile diameter of 600 mm has increased to 750 mm and 1000 mm, 750 mm pile diameter, the diameter increased to 800 mm and 1000 mm for different loading types. For pile diameters 1000 mm and 1500 mm, there is no increase in pile diameter. Fig. 8
For EC 2, the deflection at the pile head is zero, but along the pile length, there is an increase in deflection which is greater than the limiting deflection for varying lateral loading. Table 13, lists the optimum diameter of the pile for EC 2 irrespective of loading type. The optimum diameter is arrived at by trial and error. For EC 2, the pile diameter increased from 450 mm to 600 mm, and 750 mm, for pile diameter increased from 600 mm to 750 mm, for pile diameter 750 mm it increased to 1000 mm, for 1000 mm and 1500 mm pile diameter, there is no increase in pile diameter for 4 m liquefaction depth. For 9 m liquefaction depth, the 450 mm pile diameter increases to 600 mm, 1000 mm, and 1500 mm for different loading types. The 600 mm pile diameter increases to 750 mm, and 1200 mm. the 1000 mm pile diameter increases to 1200 mm, and the 1500 mm pile diameter increases to 1600 mm for different loading types.
In this study, the analyses were carried out for three different end conditions and six different types of loading. Since it is not possible to comment on the end conditions of the pile during earthquake loading, it is recommended to adopt the maximum diameter of the pile obtained from the three different end conditions for the design of the pile foundation. From Tables 11, 12, and 13, it is observed that the diameter is maximum for EC 3. Hence it is recommended to design the pile foundation for this end condition for earthquake loading as far as bending criteria are considered. However, this pile diameter should also be checked for buckling criteria and bending-buckling criteria. This will be the future scope of the study.
|
Fig. 4 (a, b, c, d, e, f). Variations of shear force for 4 m and 9 m liquefaction depth for different end conditions for 600 mm pile diameter. |
|
Fig. 5 (a, b, c, d, e, f). Variation of bending moment for 4 m and 9 m liquefaction depth for 600 mm pile diameter with different end conditions. |
|
Fig. 6 (a, b, c, d, e, f). Variation of deflection diagram for 4 m and 9 m liquefaction depth for different end conditions for 600 mm pile diameter. |
|
Fig. 7 Optimum diameter to limit the deflection value to ≤ 6 mm for EC3. |
|
Fig. 8 (a) Optimum diameter from 600 mm to 1200 mm for the limiting deflection for 4 m liquefaction depth. (b) Optimum diameter from 600 mm to 1200 mm for the limiting deflection for 9 m liquefaction depth. |
|
Table 9 Ranges of maximum and minimum values for shear force, bending moment, and deflection for different liquefaction depths and different end conditions. |
The current work uses the finite element computer program SAP2000 V15 to examine the bending behavior of a single pile in liquefiable soil in order to comprehend the impact of various lateral loads along the length of the pile. Following are the conclusions drawn from this analysis: Depending on the end conditions, kind of loading, and depth of the liquefaction, the distribution of the shear force, bending moment, and deflection throughout the length of the pile. For EC 3, LT 5, and LT 6, the maximum shear force, bending moment, and deflection are achieved. Shear force, bending moment, and deflection have distinct and maximum ranges of maximum and minimum values for various liquefaction depths and end conditions. The largest difference between the effects of different loading types on shear force, bending moment, and deflection along the pile length is for EC 3. The greatest diameter for a 6 mm deflection is thought to be the ideal diameter for the two critical loading circumstances since EC 3 is the crucial area. It is advised to use EC 3 and LT 5 and LT 6 for pile foundation designs in liquefiable deposits when taking the bending failure into account. But for buckling and combined bending and buckling analyses of a single pile foundation, the ideal pile diameter must be confirmed.
- 1. S.R. Dash, S. Bhattacharya and A. Blakeborough, Soil Dyn. Earthq. Eng. 30[5] (2010) 32-39.
-

- 2. S. Velusamy, A. Subbaiyan, S.R. Murugesan, M. Shanmugamoorthy, V. Sivakumar, P. Velusamy, S. Veerasamy, K. Mani, P. Sundararaj, and S. Periyasamy, Adv. Mater. Sci. Eng. 2002[3906256] (2002) 1-7.
-
- 3. S.R. Murugesan, V. Sivakumar, S. Velusamy, G. Ravindiran, P. Sundararaj, V. Maruthasala, R. Thangavel, G.S. Ramasamy, M. Panneerselvam, and S. Periyasamy, Adv. Mater. Sci. Eng. 2022[2] (2022) 1-7.
-
- 4. A.R. Krishnaraja, P. Kulanthaivel, P. Ramshankar, V.H. Wilson, P. Palanisamy, S. Vivek, V. Sampathkumar, P. Ganeshan, M.C. Sashikkumar, K. Raja, S.K. Selvaraj, A.J. Rajan, Adv. Mater. Sci. Eng. 2019[9669803] (2019) 1-7.
-
- 5. S. Vivek, C.M. Dharmalingam, S.Srinivasan, S. Swathi, K. Janani, M. Divyadharsini, Int. J. Chemtech Res. 10[8] (2017) 739-749.
- 6. R.S. Prabhu, R. Anuradha, and S. Vivek, Asian J. E. Appl. Technol. 5[2] (2016) 15-21.
- 7. S. Bhattacharya, and P.G. Madabhushi, Bull. Earthq. Eng. 6[2] (2008) 407-446.
-
- 8. A.N. Arasu, S. Vivek, J. Robinson, and T.T. Ranjith,Int. J. Chemtech Res. 10[8] (2017) 605-622.
- 9. K. Chatterjee, D. Choudhury, V.D. Rao, and H.G. Poulos, Bull. Earthq. Eng. 17[3] (2019) 2935-2961.
-
- 10. X. Tang, L. Tang, X. Li, X. Ling, and A. Chan, Eng. Struct. 205 (2020) 110074.
-
- 11. R. Sinha, R. Sarkar, and J.S. Rajeswari, Indian Geotech. J. 50[5] (2020) 880-906.
-
- 12. C.R. Rathish, and A. Rajaram, ARPN J. Eng. Appl. Sci. 3[5] (2018) 1752-1760.
- 13. C.R. Rathish and A. Rajaram, Int. J. Control. Theory Appl. 9[34] (2016) 817-832.
- 14. R.P.P. Anand, A. Rajaram, IOP Conference Series: Mater. Sci. Eng. 994[1] (2022) 012031.
-
- 15. S. Kannan, and A, Rajaram, J. Comput. Theor. Nan. 4[9] (2017) 4545-4552.
-
- 16. M. Cubrinovski, K. Ishihara, and H. Poulos, Bull. N. Z. Soc. Earthq. Eng. 42[1] (2010) 28-38.
-
- 17. M. Dinesh, C. Arvind, S.S.S Mole, C.S.S. Kumar, P.C. Sekar, K. Somasundaram, K. Srihari, S. Chandragandhi, and V.P. Sundramurthy, Sci. Program. 2022[1128717] (2022) 1-7.
-
- 18. A. Rajaram, and K. Sathiyaraj, J. Electr. Eng. Technol. 2022 (2022) 1-13.
-
- 19. P. Ganesh, G.B.S.R. Naidu, K. Swaroopa, R. Rahul, A. Almadhor, C. Senthilkumar, D. Gangodkar, A. Rajaram, and A. Yeshitla, Wirel. Commun. Mob. Comput. 2022[1332373] (2022) 1-9.
-
- 20. D.N.V.S.L.S. Indira, R.K. Ganiya, P.A. Babu, A.J. Xavier, L. Kavisankar, S. Hemalatha, V. Senthilkumar, T. Kavitha, A. Rajaram, K. Annam, and A. Yeshitla, Biomed Res. Int. 16[35480141] (2022) 1-10.
-
- 21. C.R. Rathish, and A. Rajaram, Int. J. Appl. Eng. Res. 10[7] (2015) 16521-16534.
- 22. S.R. Basha, C. Sharma, F. Sayeed, A.N. Arularasan, P.V. Pramila, S.K. Shinde, B. Pant, A. Rajaram, and A. Yeshitla, Wirel. Commun. Mob. Comput. 2022[6489185] (2022) 1-9.
-
 This Article
-
2022; 23(5): 737-750
Published on Oct 31, 2022
- 10.36410/jcpr.2022.23.5.737
- Received on Aug 18, 2022
- Revised on Sep 16, 2022
- Accepted on Sep 26, 2022
Services
Shared
Correspondence to
- Muthulakshmi K
-
Department of Civil Engineering, College of Engineering, Anna University, Chennai 600025, Tamilnadu, India
Tel : +91-9677924725 - E-mail: premalathak974@gmail.com
Clean-Energy Research Institute(CRI), Hanyang University, 222, Wangsimni-ro, Seongdong-gu, Seoul, 04763, Korea
E-mail: jcpr@hanyang.ac.kr