


- Lamellar La2O2SO4:Eu3+ phosphor and its conversion to rice ear-like La2O2S:Eu3+ nanophosphor by a reduction step
Xing Lia,*, Yudi Gaob, Liying Zhangb and Jingbao Lianb
aDepartment of Science, Shenyang Jianzhu University, Shenyang, 110168, P.R. China
bSchool of Mechanical Engineering, Liaoning Petrochemical University, Fushun 113001, P.R. ChinaThis article is an open access article distributed under the terms of the Creative Commons Attribution Non-Commercial License (http://creativecommons.org/licenses/by-nc/4.0) which permits unrestricted non-commercial use, distribution, and reproduction in any medium, provided the original work is properly cited.
In this work, La2O2S:Eu3+ nanophosphor was successfully synthesized through a combination method of co-precipitation and following reduction step, using commercial available lanthanum sulfate octahydrate, europium nitrate hexahydrate and ammonia water as experimental raw materials. Fourier transform infrared spectroscopy (FTIR) results showed that the precursor contains OH- and SO42- groups. X-ray diffraction (XRD) exhibited that the composition of the precursor is La2(OH)4SO4·2H2O. After calcination at 800 oC in muffle furnace for 2 h, the precursor was transformed into the La2O2SO4 phase and then reduced to pure La2O2S phase at 800 oC for 1h under a reducing atmosphere. Differential scanning calorimetry/thermogravimetry (DSC/TG) analysis further confirmed that the removal of crystal water and dehydroxylation process from La2(OH)4SO4·2H2O to La2O2SO4. Field-emission scanning electron microscopy (FESEM) observations displayed that the morphologies of La2(OH)4SO4·2H2O and La2O2SO4 are lamellar structures, while after reduction treatment, the produced La2O2S possesses a rice ear-like shape with particle size of 20-50 nm. Photoluminescence (PL) spectra revealed that the La2O2S:Eu3+ nanophosphor displays excellent photoluminescent properties, with the main emission peak at 624 nm after photoexcitation at 254 nm, a good CIE coordinate of (0.6669, 0.3214), a short lifetime of 1.60 ms and an appropriate CCT value of 3951 K
Keywords: La2O2SO4/La2O2S, Rice ear-like morphology, Co-precipitation method, Reduction treatment, Photoluminescence
Currently, rare earth (RE) luminescent materials, such as oxysulfates [1], oxysulfides [2], oxides [3], sulfides [4], fluorides [5], titanate [6] and aluminate [7], etc, have aroused extensive interests because of their superior photoluminescent properties [8]. For example, RE oxysulfate has been used to prepare oxysulfide ceramic scintillator [9, 10]. Y2O3:Eu phosphor has been practically used as a red-emitting material in plasma panel displays (PDPs) field [11]. Among them, trivalent RE ions doped lanthanium oxysulfide (La2O2S) has attracted more and more attention [12] as the La2O2S has a hexagonal structure with an indirect wide-gap of ~4.6 eV, enabling it as a promising host materials in the fields of catalyst [13], oxygen storage [14], solid state laser [15], thermal sensor [16, 17], and optical sensor [18], and so on. In recent years, La2O2S:Eu3+, Tb3+ has attracted extensive attention due to its special application in remotely measuring human skin temperature within a magnetic resonance imaging (MRI) scanner [19]. Furthermore, La2O2S:Yb3+, Er3+ has also potential application in optical temperature sensor [20].
At present, several different routes have been proposed to synthesize La2O2S powder, including solid state reaction method (SSR) [21], refluxing method [22], ethanol-assistant solution combustion (EASC) method [23], hydrothermal/solvothermal method [24], gelatin-templated synthesis [25] and reduction method [26], furnace combustion technique [27], etc. For example, the commercialized La2O2S powder is usually synthesized by SSR method with an environmentally harmful sulfur-containing substance (sublimed sulfur) as sulfurization reagent. Thus, it is difficult for obtaining the products with good morphology and particle size, and at the same time, it raised high-risk safe concerns during the synthesis process. Moreover, SSR method is based on the high temperature and long time reaction, and is very energy-intensive [28-30]. In addition, other chemical manufacturing routes are normally neither high cost nor complicated, which greatly hinders the practical applications. Furthermore, the low production yield is a common issue. Therefore, it is urgent to develop an environmental friendly and cost-effective synthetic route to prepare La2O2S:RE3+ phosphors with controlled morphology and particle size in a feasible production yield, thus fine-tuning its photoluminescent properties. To our knowledge, there is less work on the preparation of rice ear-shaped La2O2S:Eu3+ nanophosphor reported so far. In this work, a feasible and satisfactory synthetic rout has been successfully developed. A rice-ear like La2O2S:Eu3+ nanophosphor was firstly obtained by a combination method of co-precipitation and reduction step, where commercially available lanthanum sulfate octahydrate, europium nitrate hexahydrate and ammonia water were used as experimental raw materials. It is simple, inexpensive and environment-friendly. In addition, no toxic CS2, H2S sulfur vapor are utilized during the synthesis process. Furthermore, the structural analysis (FTIR and XRD), thermal analysis, morphology and photoluminescence of the obtained products were systematically studied according to the results of FTIR, XRD, DSC-TG-DTG, FESEM and PL spectra.
Synthesis
In this study, La2(SO4)3·8H2O (purity, 99.99%), Eu(NO3)3·6H2O (purity, 99.99%) and NH3·H2O (analytical pure) were used as experimental raw materials. Among them, La2(SO4)3·8H2O and Eu(NO3)3·6H2O were received from Jining Tianyi, China. NH3·H2O was received from Sinopharm, China. First of all, the stoichiometric of La2(SO4)3·8H2O was dissolved in ultrapure water with a resistivity of 18 MΩ·cm, where a 0.05 M La2(SO4)3 solution was obtained. The 0.5 M dilute ammonia was prepared by diluting ammonia into ultrapure water. Secondly, 0.5 M ammonia solution was consistently dropped into a La2(SO4)3 solution under vigorous stirring, the precursor was formed. After titration, the white precipitate was then aged, filtered, washed with ultrapure water and ethanol several times and then dried to obtain the precursor. The precursor was then heated in a muffle furnace at 800 oC for 2 h in air to get the La2O2SO4 intermediate product. Finally, the La2O2SO4 intermediate product was then reduced at 800 oC for 1 h to produce the target La2O2S product under 90%Ar/10% H2 reducing atmosphere. 6 mol%Eu3+ doped La2O2SO4 and La2O2S products were also prepared by using the above similar method.
Characterization
The titration curve was recorded by Shanghai ZDJ-4B automatic potentiometric titrator. FTIR spectra were obtained using an Agilent Cary 660 FTIR spectro- photometer by the KBr method. The phase structures were identified by a D8 Advance X-ray diffractometer operating with Cukα = 0.15406 nm. DSC/TG were performed using simultaneous differential thermal analysis and thermo-gravimetry (SDT 2960). The particle morphologies of the products were observed by a Hitachi SU8000 field emission scanning electron microscopy. PL spectra and decay curve were recorded on a Hitachi F-4600 fluorescence spectrophotometer.
The titration curve of the precipitation reaction
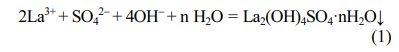
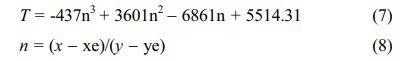
To determine the appropriate ammonia volume, the effect of titrated ammonia volume on the pH value in the La2(SO4)3-NH3·H2O system was investigated, as shown in Fig. 1. From the titration curve, with the amount of ammonia increases, the pH value of reaction system increases slowly due to the buffering effect of the solution. A titration jump occurred when the volume of ammonia reached ~4.49 mL with the pH value of ~5.14, indicating that the titration endpoint (4.49, 5.14) has been reached. As the volume of ammonia was further increased, the white precipitate was observed. The theoretical basis for the formation of white precipitation is based on hard-soft acid-base (HSAB) principle [31]. Here, the La2(SO4)3 solution ionized La3+ ions and SO42- groups through hydrolysis and ammonia provided OH- groups by dissociation. Since SO42- and OH− groups are hard bases and La3+ ions are hard acids, they can easily combine to form La2(OH)4SO4·nH2O. The chemical equation for the formation of the precursor is as follows:
Before the reaction system reaches the titration end point, La3+ ions are in a stable equilibrium state with SO42- and OH- groups, and no precipitation is observed. When the chemical reaction (1) is in equilibrium, the equilibrium constant K is expressed as follows:

At room temperature, K is a constant. Here, [La3+] and [SO42-] were constant values in this experiment, and thus [OH-] is a critical factor for this precipitation reaction. With continuous drops of aqueous ammonia, increase the concentration of OH- groups gradually increases, and finally it breaks the equilibrium between these La3+ ions and groups (SO42- and OH-). Therefore, the precipitation reaction (1) occurs. The pH curve shows an approximate plateau around 8.05~9.35, due to the complete reaction between La3+ ions and anionic groups (OH- and SO42-). After adding 10 mL ammonia into the solution, the pH value of the supernatant reaches 9.35. In this work, 10 mL NH3·H2O is considered the best ammonia volume.
Structural analysis of the precursor
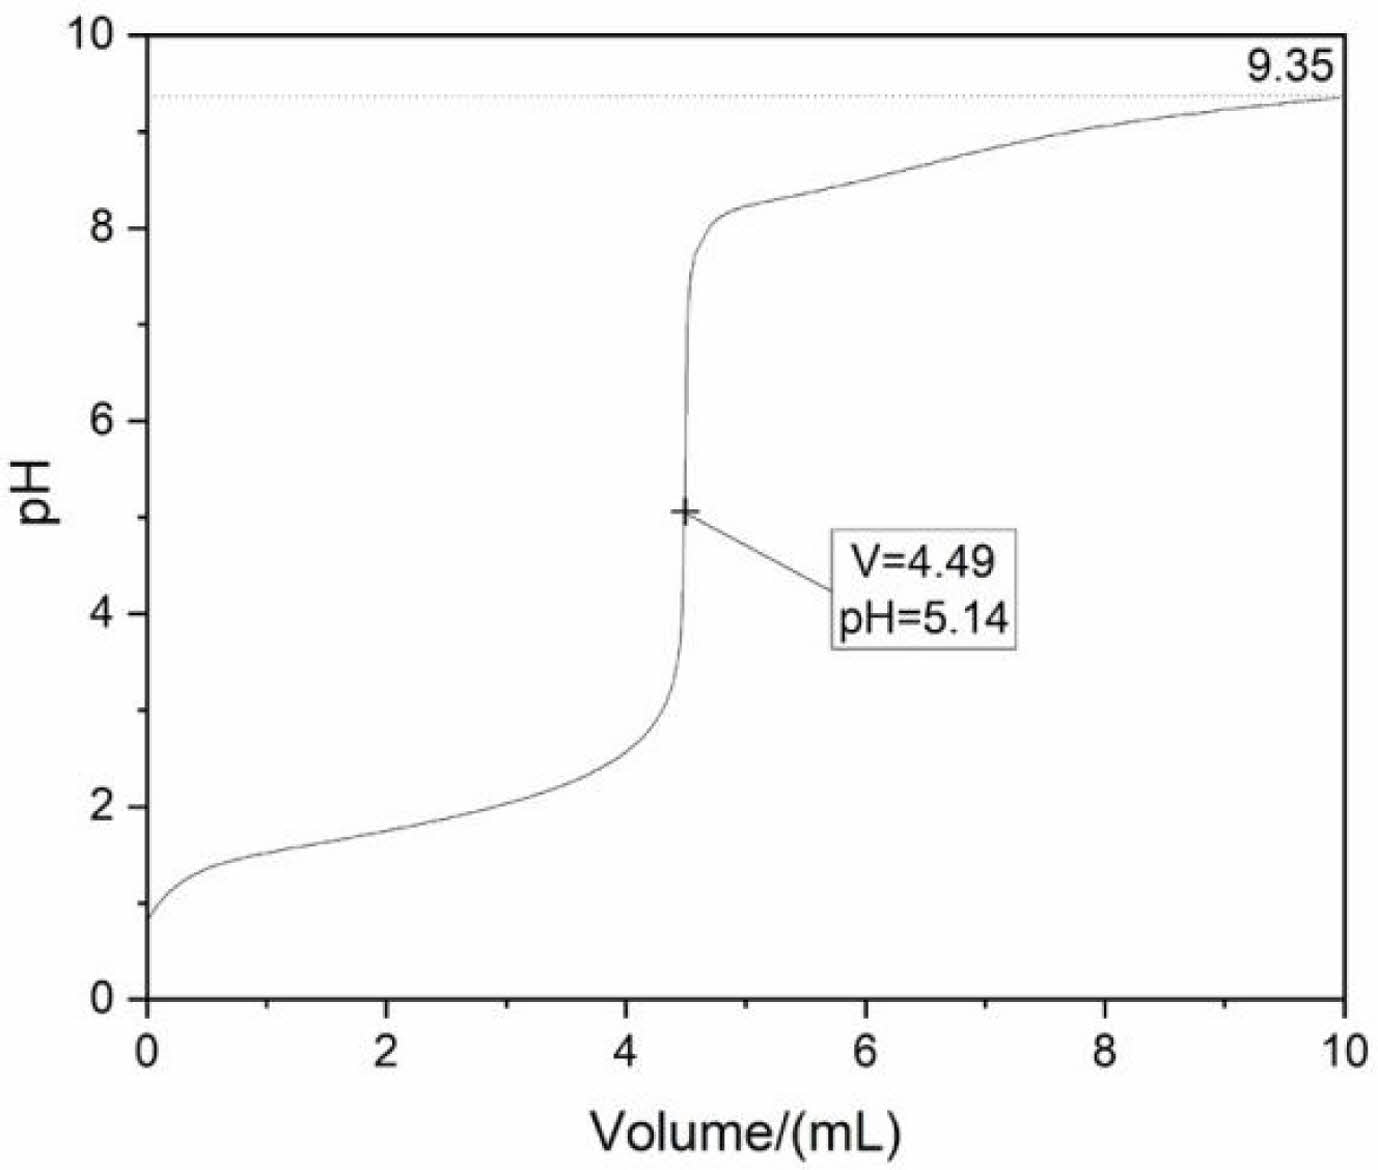
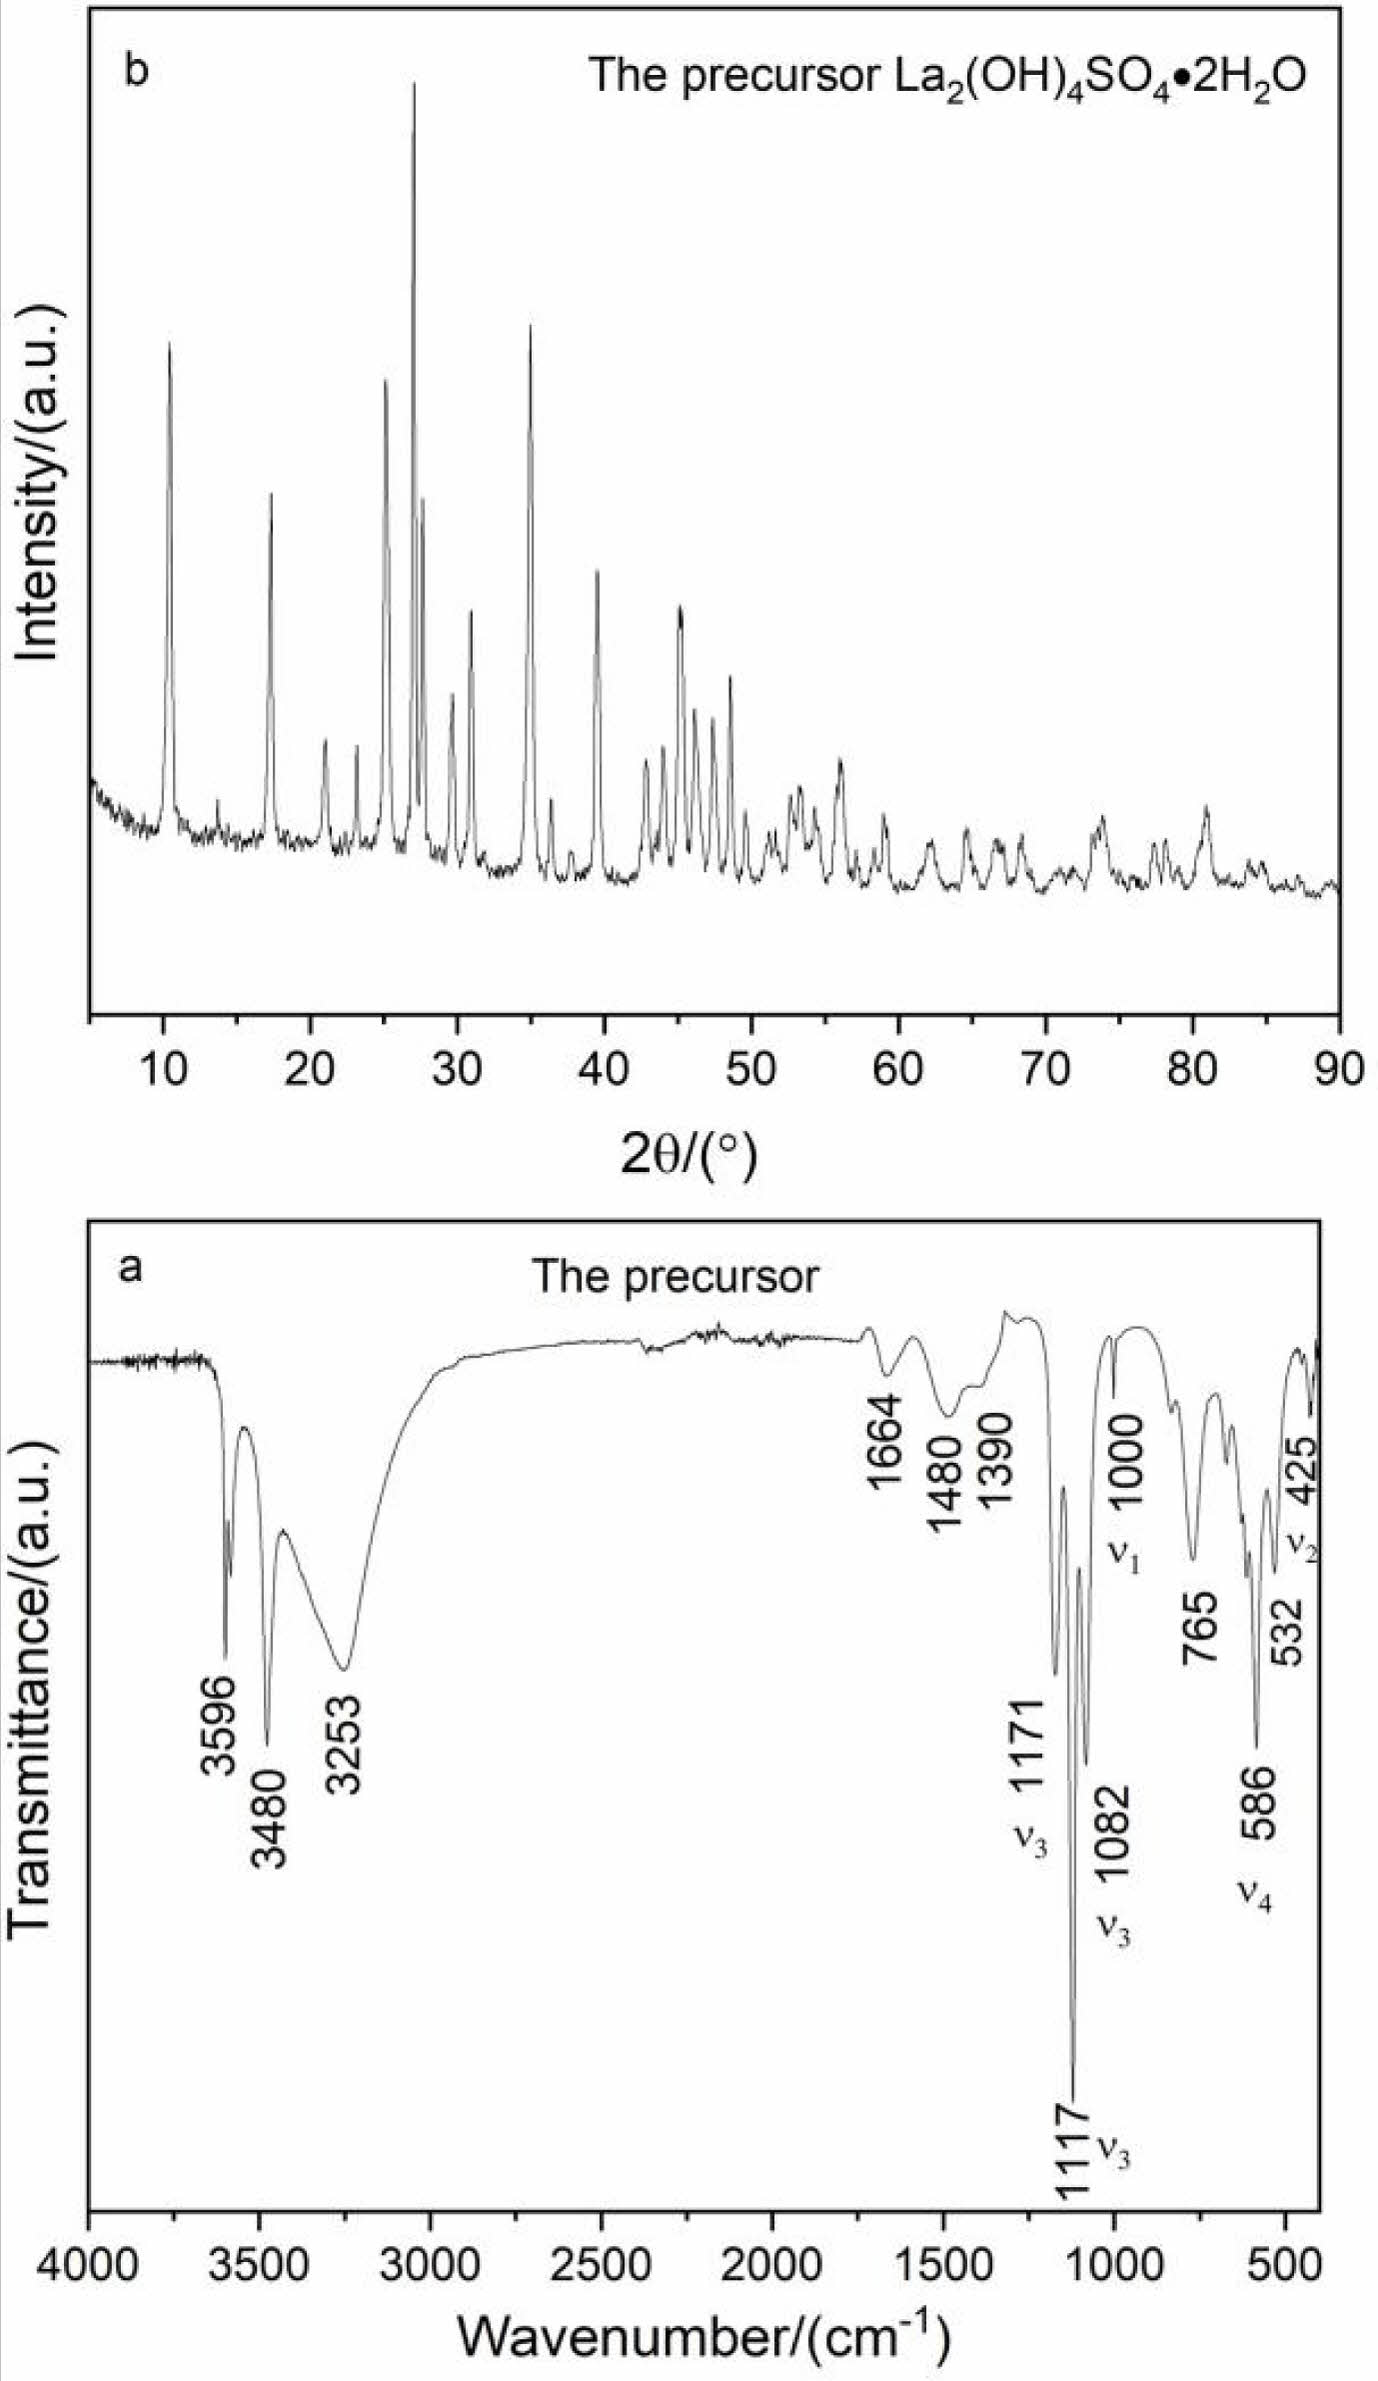
The structure of the precursor was analyzed by FTIR and XRD, as displayed in Fig. 2. FTIR spectroscopy confirms the presence of SO42- and OH- groups (Fig. 2a). The vibration peaks at 3253 and 1664 cm-1 are originated from the O-H stretching vibration and the H-O-H bending vibration of water molecule in the precursor, respectively. Two sharp peaks located at 3596 and 3480 cm-1 are assigned to the stretching vibration modes of hydroxyl (OH group). Moreover, anothertwo weak peaks at 532 and 765 cm-1 can be attributed to the La-O bond absorption [32]. The observed ν1, ν2, ν3, and ν4 fundamental vibrations of SO42- groups are also labeled in Fig. 2a. The fundamental vibrations of sulfate groups are located at 1171(ν3), 1117(ν3), 1082 (ν3), 1000 (ν1), 586 (ν4) and 425 cm-1 (ν2), respectively. The above-mentioned results indicate that the precursor is basic lanthanum sulfate containing crystal water.
The phase structure of the precursor is displayed in Fig. 2b. The sharp diffraction peaks in the XRD pattern suggest the good crystallinity of the precursor. The phase composition is assigned to the La2(OH)4SO4· 2H2O according to reference [33].
Thermal analysis of the precursor
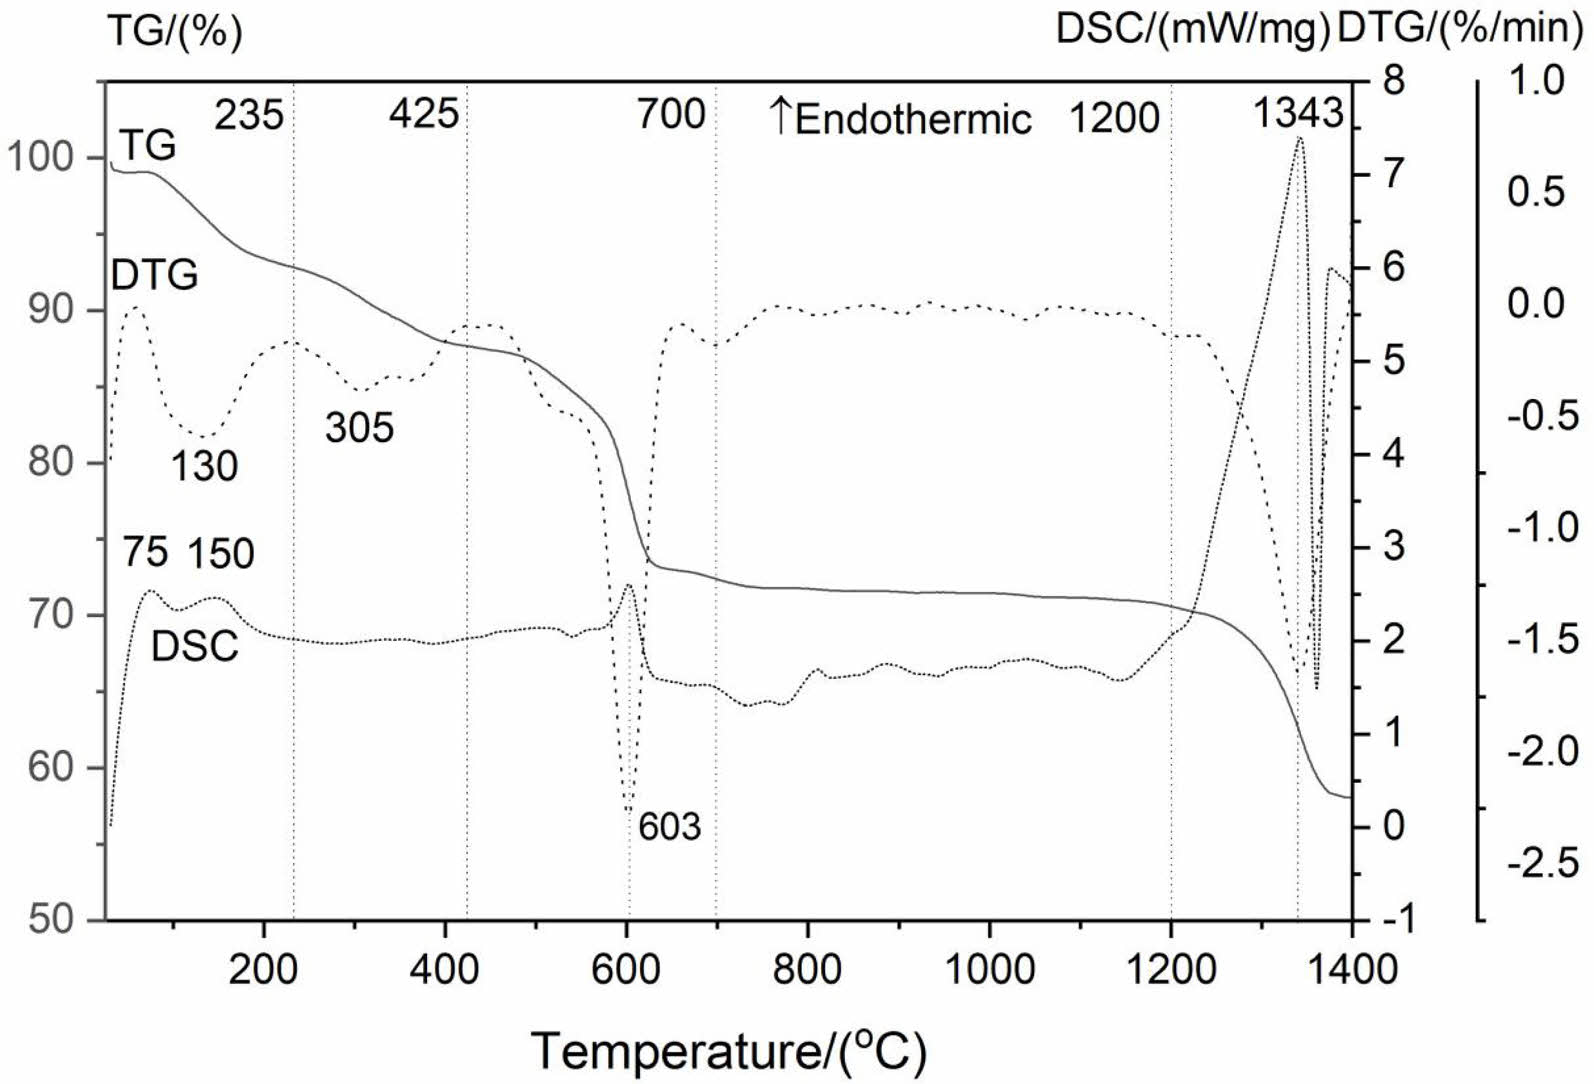
Fig. 3 depicts DSC-TG-DTG curves for the precursor. The TG curve contains four main weight loss steps, and the total weight loss of the precursor is ~41.97 wt%. The first temperature range of weight loss is from 25 °C to ~235 °C and the DTG maximum value is located at ~130 °C with a weight loss of 7.22 wt%, which is caused by the evaporation of adsorbed water molecule in the precursor. Besides, two weak endothermic peaks centered at~75 ℃ and ~150 ℃ appeared on the DSC curve, respectively. The second weight loss of 5.14%, accompanied by a weak peak at 305 ℃ on the DTG curve, is mainly related to the removal of crystal water when the temperature increasing to ~425 ℃, which corresponds to the following chemical equation (3).

The third weight loss is 15.28 wt%, and DTG maximum and endothermic peak values are both located at ~603 °C. The weight loss between ~425 °C and ~700 °C is due to the removal of OH- group of the La2(OH)4SO4, corresponding to the equation (4).

The equation (4) indicates that the La2O2SO4 product is formed in ~425 °C and ~700 °C temperature interval. The fourth weight loss of about 12.55 wt% is caused by the complete desulfurization reaction of the La2O2SO4 phase with an obvious endothermic peak and DTG maximum value at around 1343 °C. The thermal decomposition reaction is as follows:

To obtain a high-purity La2O2SO4 phase, 800 °C is recommended in this study.
Structural analysis of the intermediate product
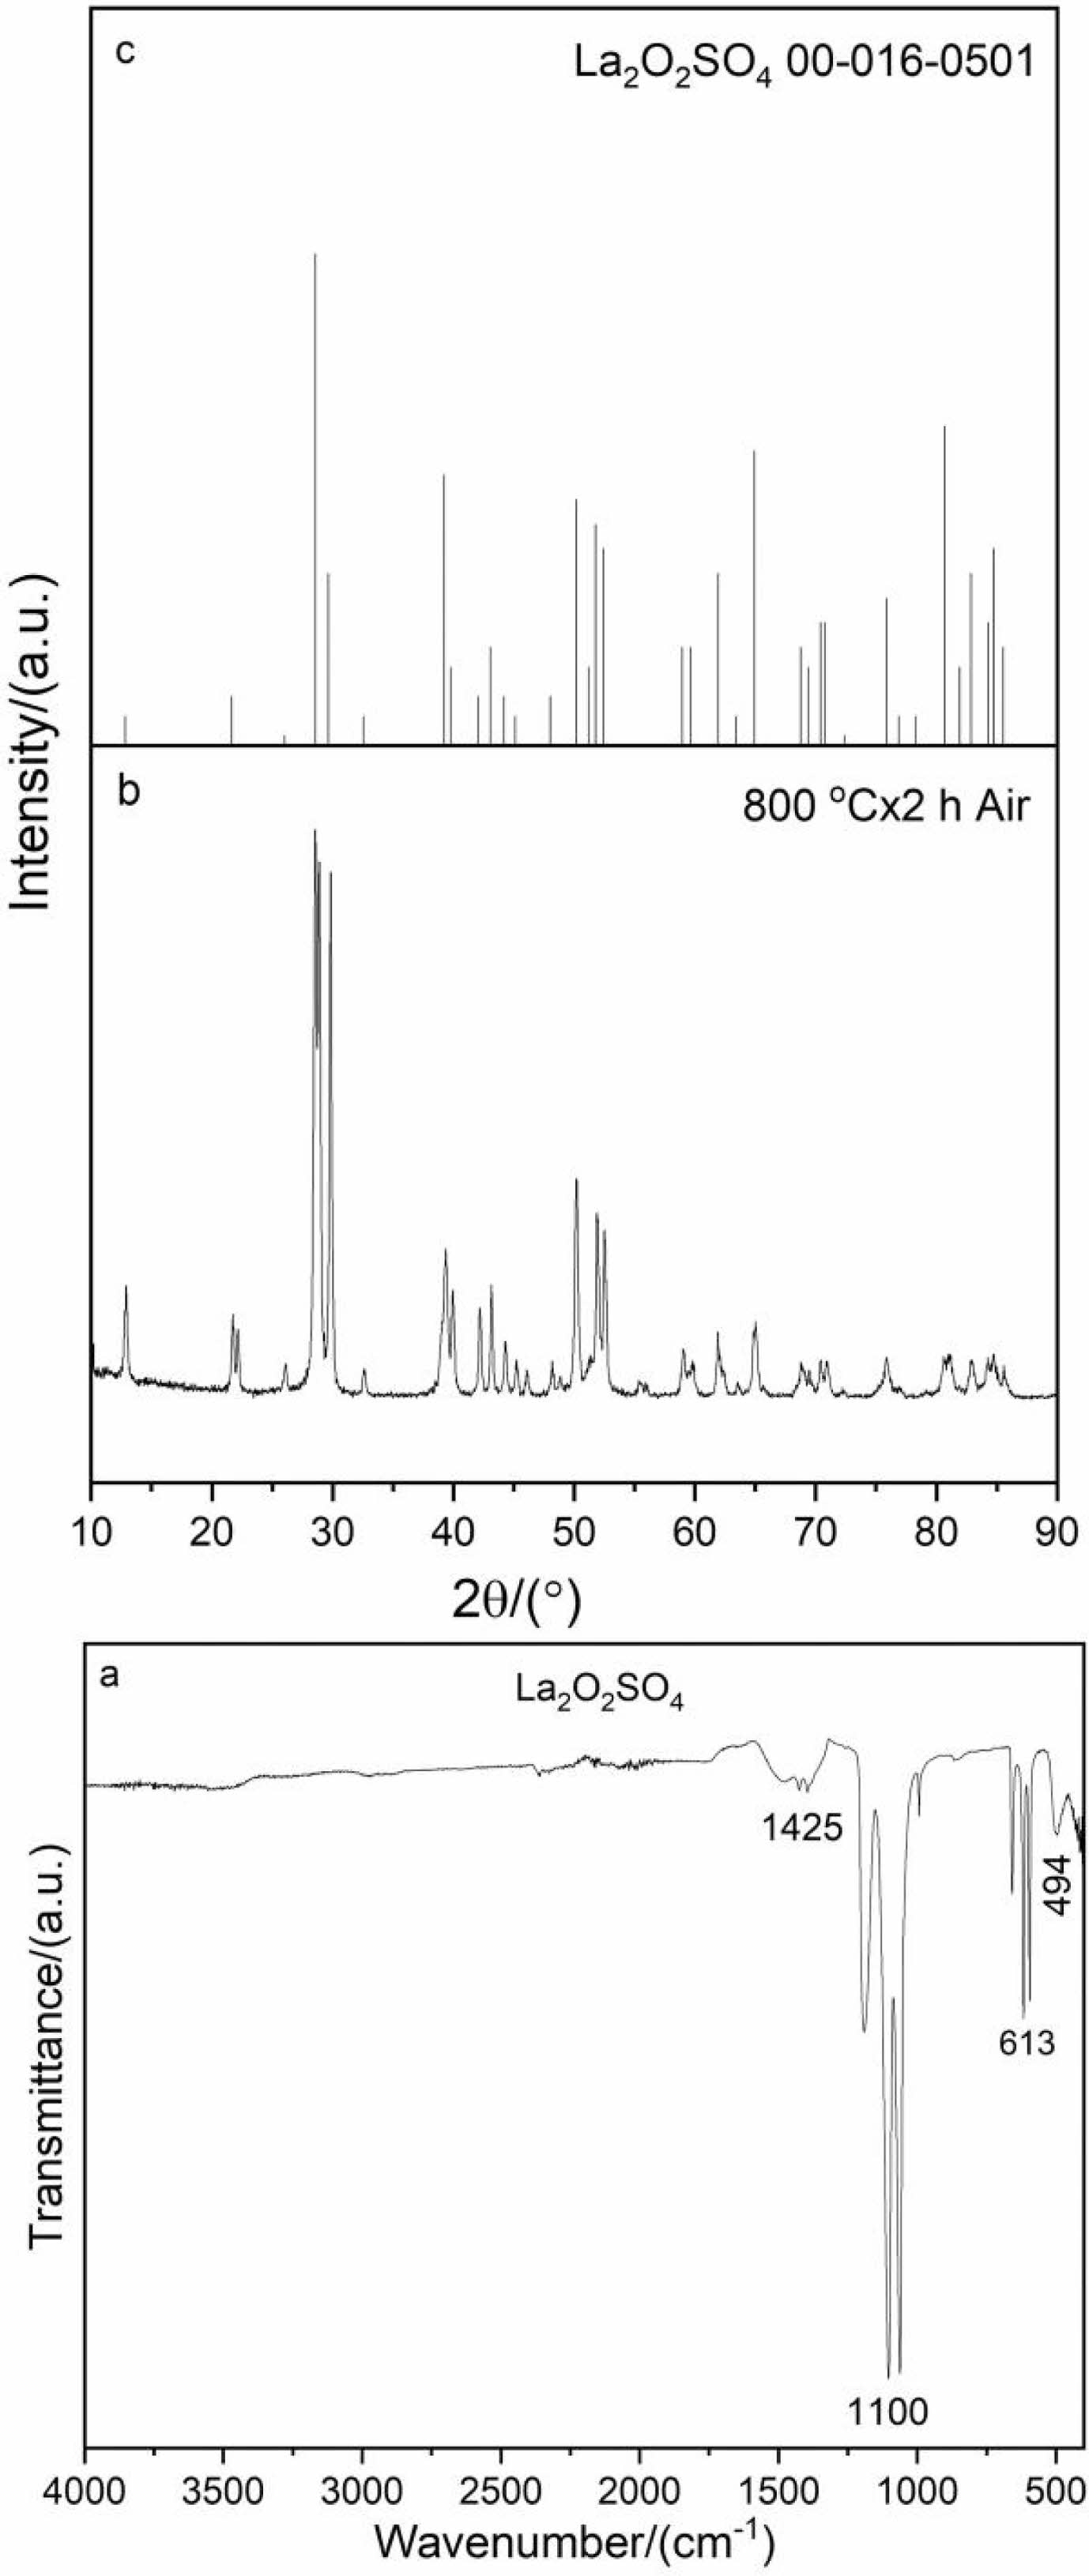
The FTIR spectrum and XRD pattern of the intermediate product (800 oC, 2 h) were shown in Fig. 4. As shown in Fig. 4a, the intermediate product exhibits essential change compared with FTIR spectrum of the precursor (Fig. 2a). The lack of some absorption peaks at 3596, 3480, 3253 and 1664 cm-1 illustrates that hydroxy water, crystal water and adsorbed water molecules have removed from the intermediate product. The characteristic absorption peaks of sulfate, on the other hand, can still be clearly observed, but are significantly different from those of the precursor. Moreover, the vibration peak of La-O bond at ~494 cm-1 appears in the FTIR spectrum. It should be noted that the weak peak of the intermediate product at 1425 cm-1 belonging to the absorption of CO32- group is attributed to the absorption of water (H2O) and carbon dioxide (CO2) on the sample surface from the environment. The FTIR results are in accordance with the DSC-TG-DTG and XRD analysis (Fig. 3 and 4b). Notably, the sharp diffraction peaks in the XRD pattern (Fig. 4b) can be indexed well with the data of the La2O2SO4 standard JCPDS card (No.00-016-0501, Fig. 4c), indicating that pure La2O2SO4 phase is synthesized.
XRD analysis of the reduction product
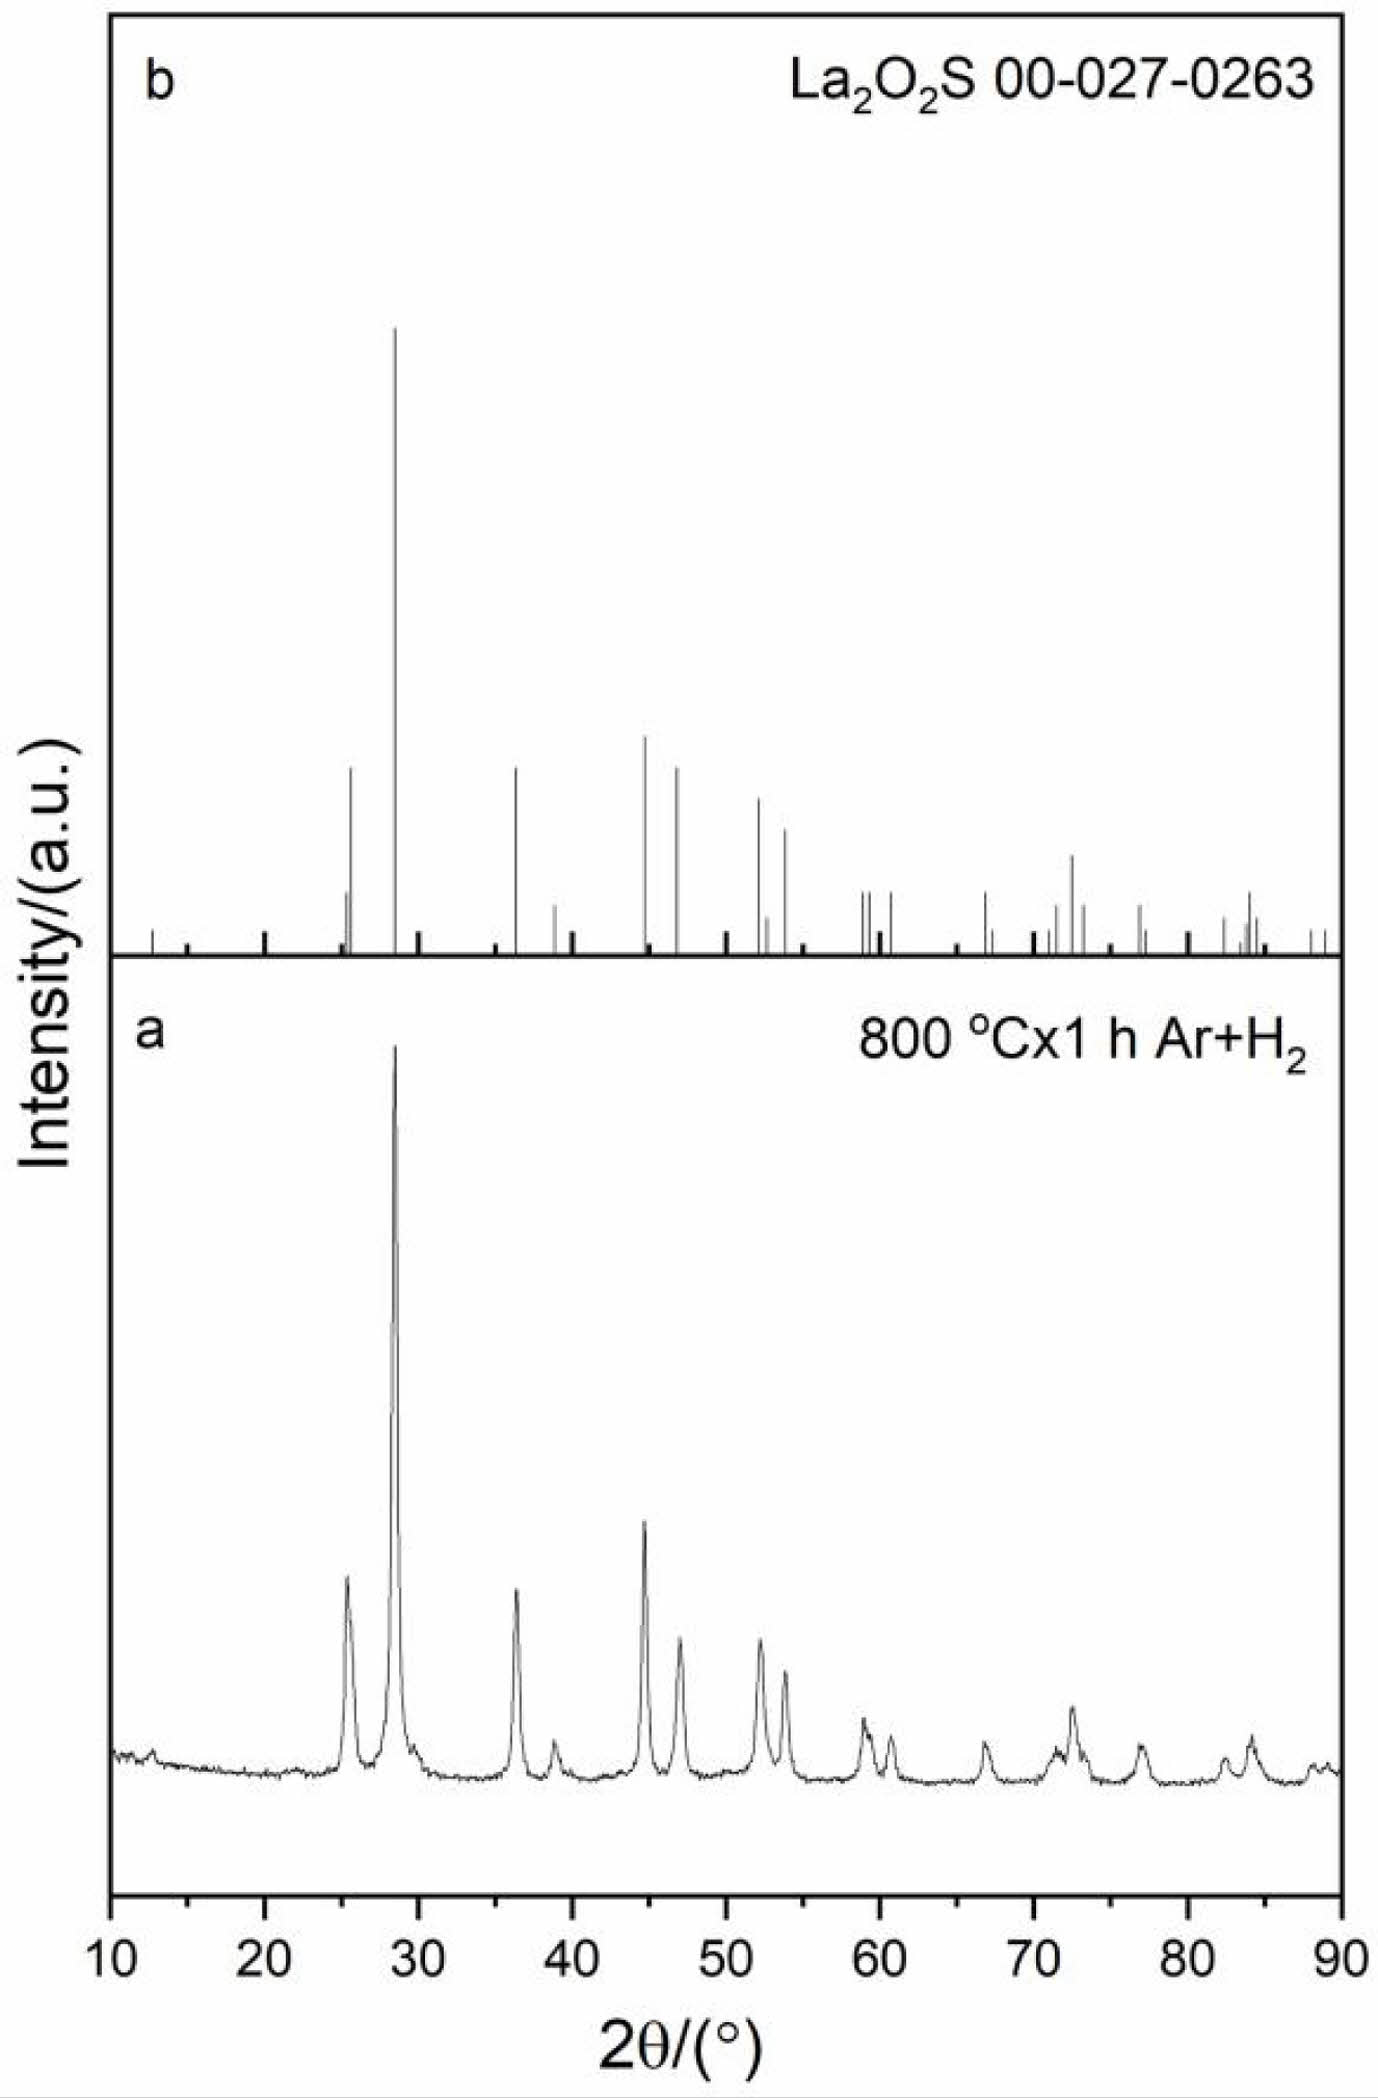
The intermediate La2O2SO4 was used to obtain the target La2O2S product via reduction at 800 oC for 1 h under reducing atmosphere. It is seen from the XRD pattern that all the diffraction peaks of the reduction product can be indexed as pure La2O2S phase (JCPD card No.00-027-0263) (Fig. 5). In 90%Ar/10%H2 reducing atmosphere, oxygen atoms from SO42- group in the La2O2SO4 host lattice can be trapped by hydrogen, while reducing S6+ to S2- at 800 oC to generate La2O2S phase [34]. The reduction reaction of La2O2SO4 by hydrogen at 800 oC is displayed as follows:

FESEM morphological analysis
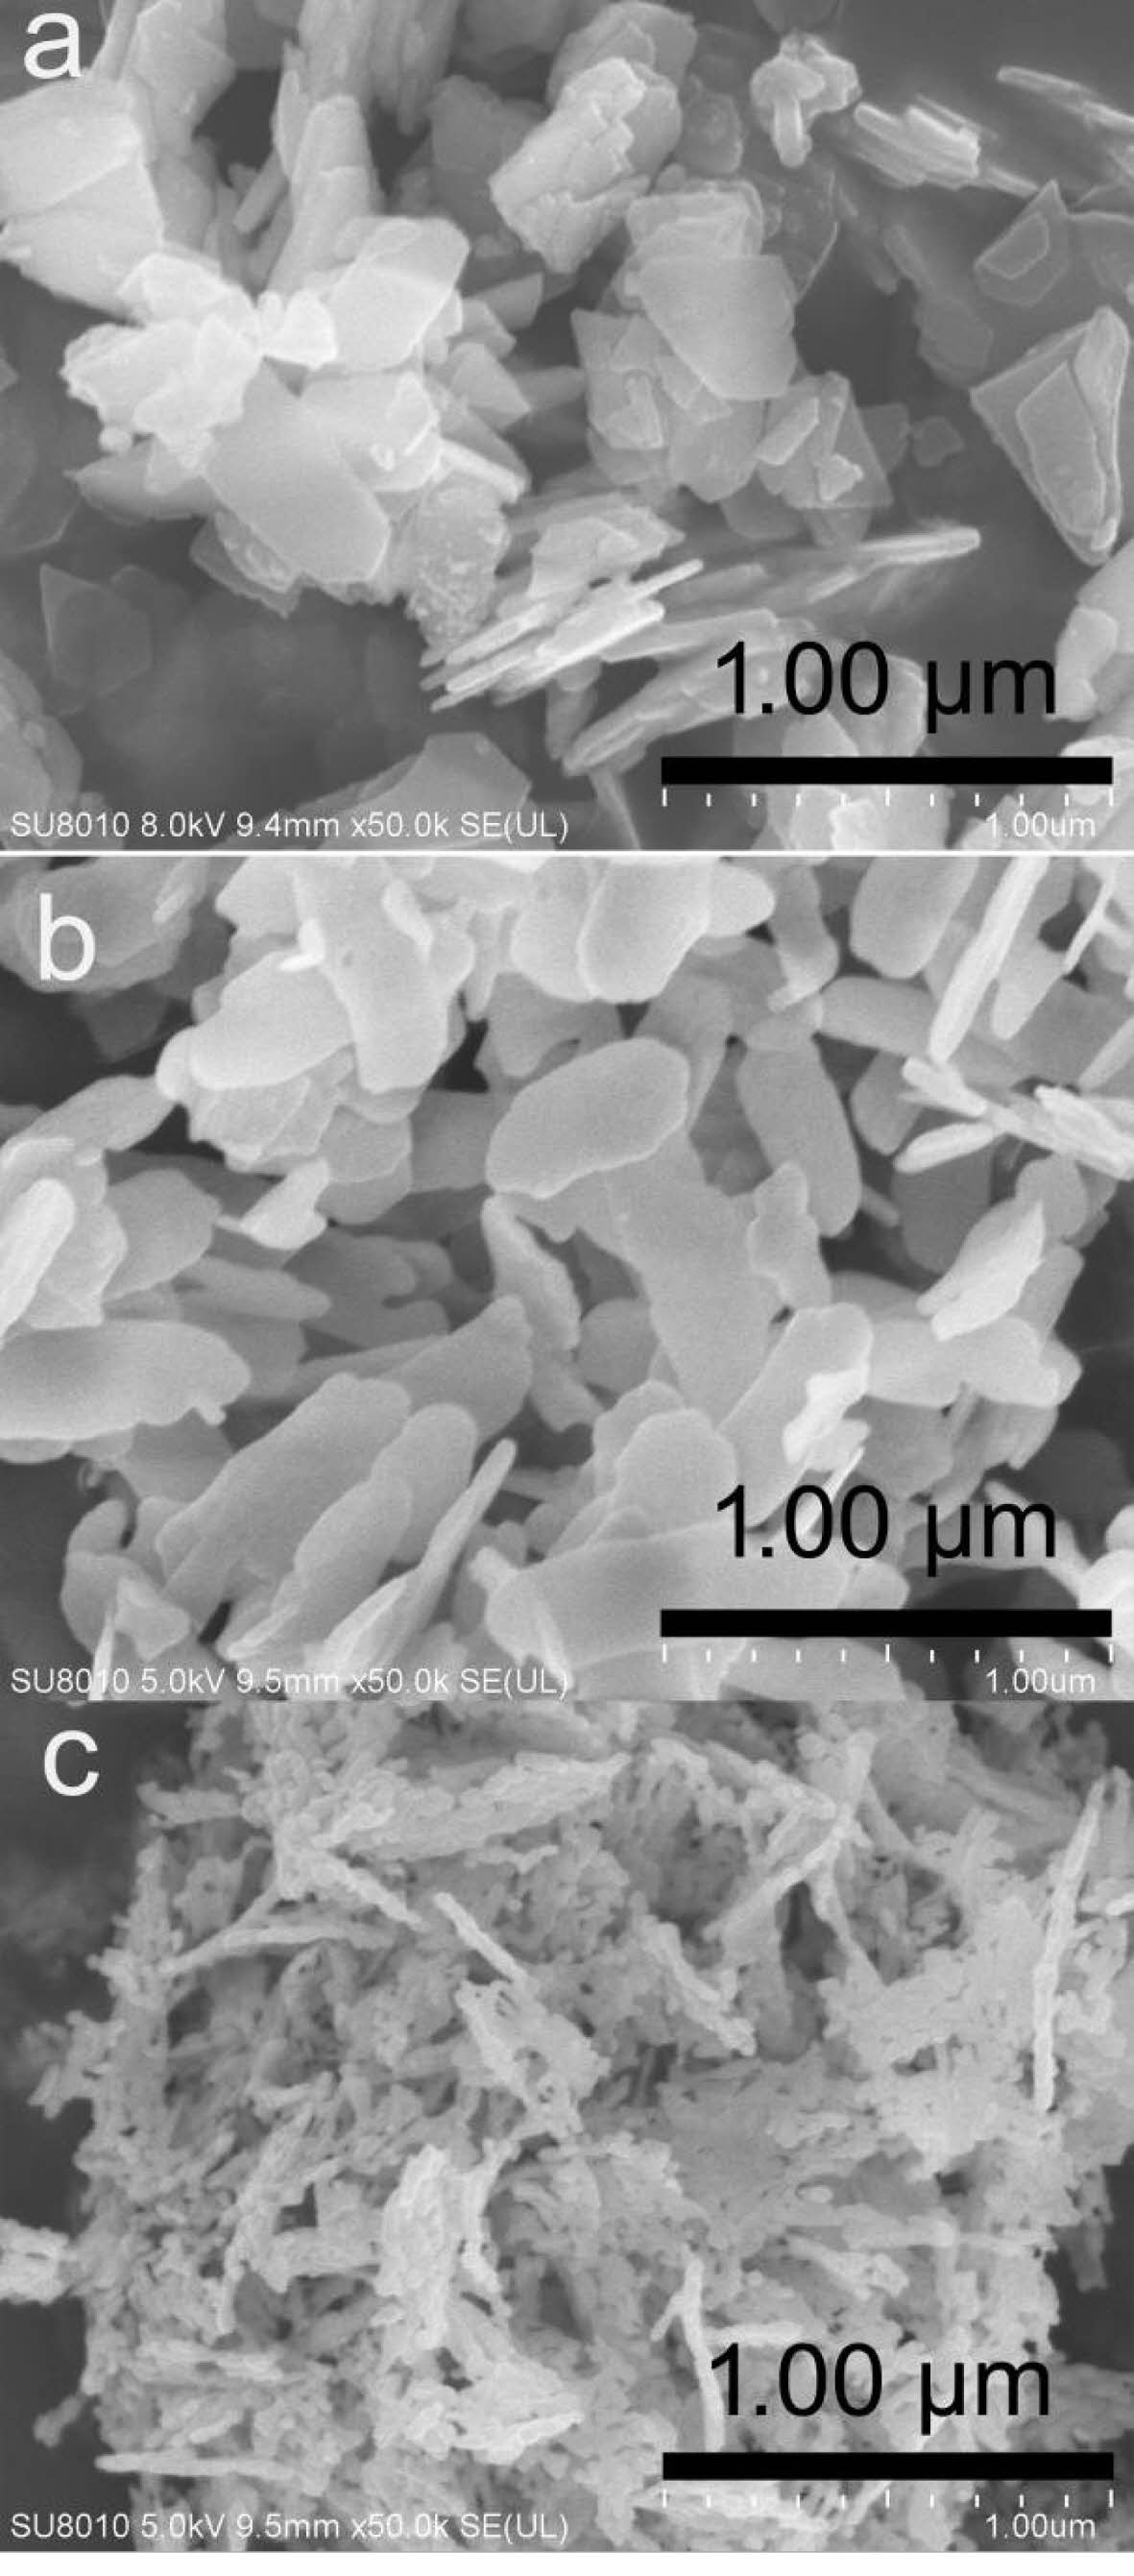
The FESEM morphologies of (a) the precursor, (b) La2O2SO4 and (c) La2O2S were depicted in Fig. 6. As seen from Fig. 6a, the precursor derived from co-precipitation process displays a laminar shape with the side length in sub-micrometer scale (300-500 nm) and thicknesses of nanometer scale (20-50 nm). In this work, the formation of the laminar precursor may be attributed to its crystal growth habit, resulting from its layered crystal structure. Compared with that of the precursor flakes, it is obvious from Fig. 6b that the laminar La2O2SO4 structure could be well maintained by inheriting the precursor’s shape. The size of the flakes does not change significantly, but the edges and corners of La2O2SO4 are more rounded. Moreover, it can be seen from Fig. 6c that the laminar La2O2SO4 flakes are fractured into fine La2O2S nanoparticles with the size of 20-50 nm, which exhibits a nanometer-sized rice ear-like structure (Fig. 6c). This may be due to the fragmentation of laminar La2O2SO4 under the action of high-temperature water vapor, which is produced by La2O2SO4 and hydrogen reduction reaction. The fractured La2O2S nanoparticles have high surface energy and tend to form rice ear-like aggregates in order to achieve a relatively stable structure.
Photoluminescence investigation
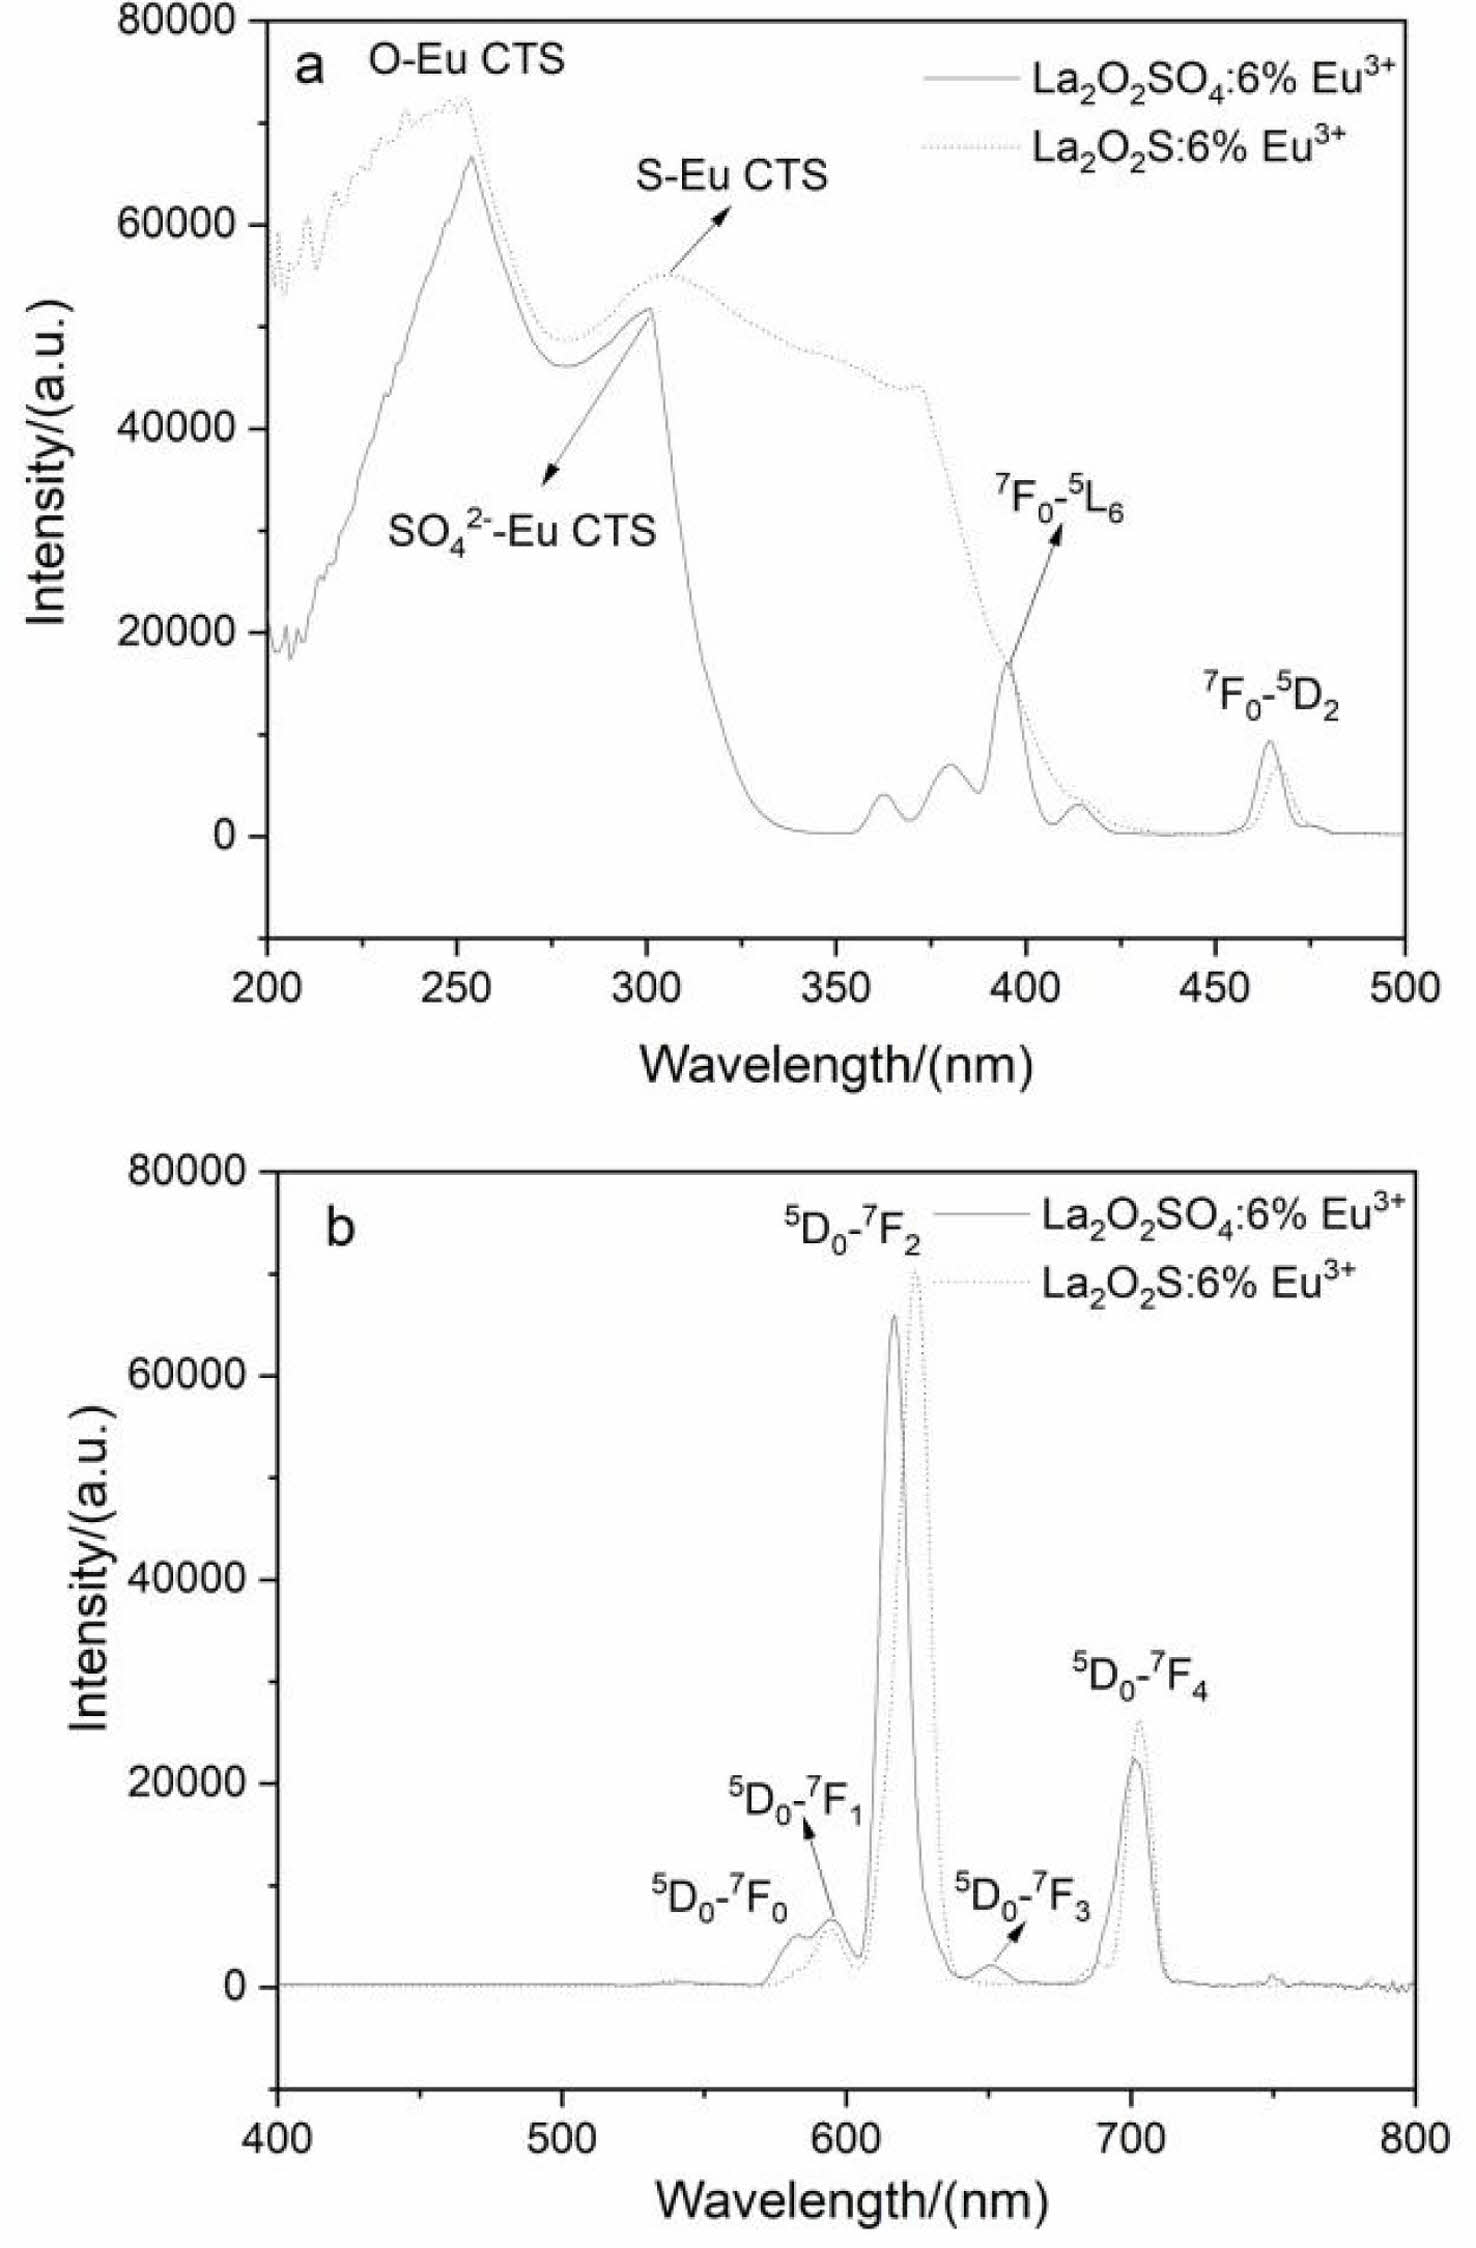
The excitation (a) and emission spectra (b) of La2O2SO4:6%Eu3+ phosphor and La2O2S:6%Eu3+ nanophosphor were displayed in Fig. 7. The broad excitation band is assigned to the charge transfer state (CTS) transition of Eu3+ ions, that is O-Eu CTS (254 nm) and SO42--Eu CTS (301 nm). As labeled in Fig. 7a, other peaks were observed at 397 nm for the 7F0→5L6 and at 465 nm for the 7F0→5D2 intra-4f6 transitions of Eu3+. For La2O2S:6%Eu3+ nanophosphor, a strong excitation band with the maximum at 254 nm and a broad charge transfer state (S-Eu) transition in the range of 300-400 nm were presented in excitation spectra. The broad absorption band can expand the light-absorbing capacity of the phosphor, which is beneficial to improve the emission intensity. Under 254 nm excitation, the prominent peaks of La2O2SO4: 6%Eu3+ phosphor and La2O2S:6%Eu3+ nanophosphor are located at 617 nm and 624 nm, respectively (Fig. 7b), which both correspond to the 5D0→7F2 transition of Eu3+ ions. Additionally, these two peaks confirm the formation of oxysulfate and oxysulfide host. However, compared with La2O2SO4:6%Eu3+ phosphor, La2O2S: 6%Eu3+ nanophosphor exhibits stronger emission intensity, which is related to its strong absorptivity at 254 nm. In addition, the asymmetrically split weak emission peaks in the range of 580-600 nm are assigned to the 5D0→7Fn (n=0,1) transitions of Eu3+ ions in two lanthanium-based hosts lattices. The 5D0→ 7F3 transition of Eu3+ ions was found at 650 nm, and the 5D0→7F4 transition at 703 nm was observed in La2O2SO4:6%Eu3+ phosphor (Fig. 7b). The very shallow shoulder at 580 nm is assigned to the 5D0→7F0 transition of Eu3+ ions. The appearance of 5D0→7F0 transition suggests that the Eu3+ ions occupy lattice sites of low centrosymmetries for La2O2SO4:6%Eu3+ phosphor and partly support Eu3+ ions occupy C3V site for La2O2S:6%Eu3+ nanophosphor [35].
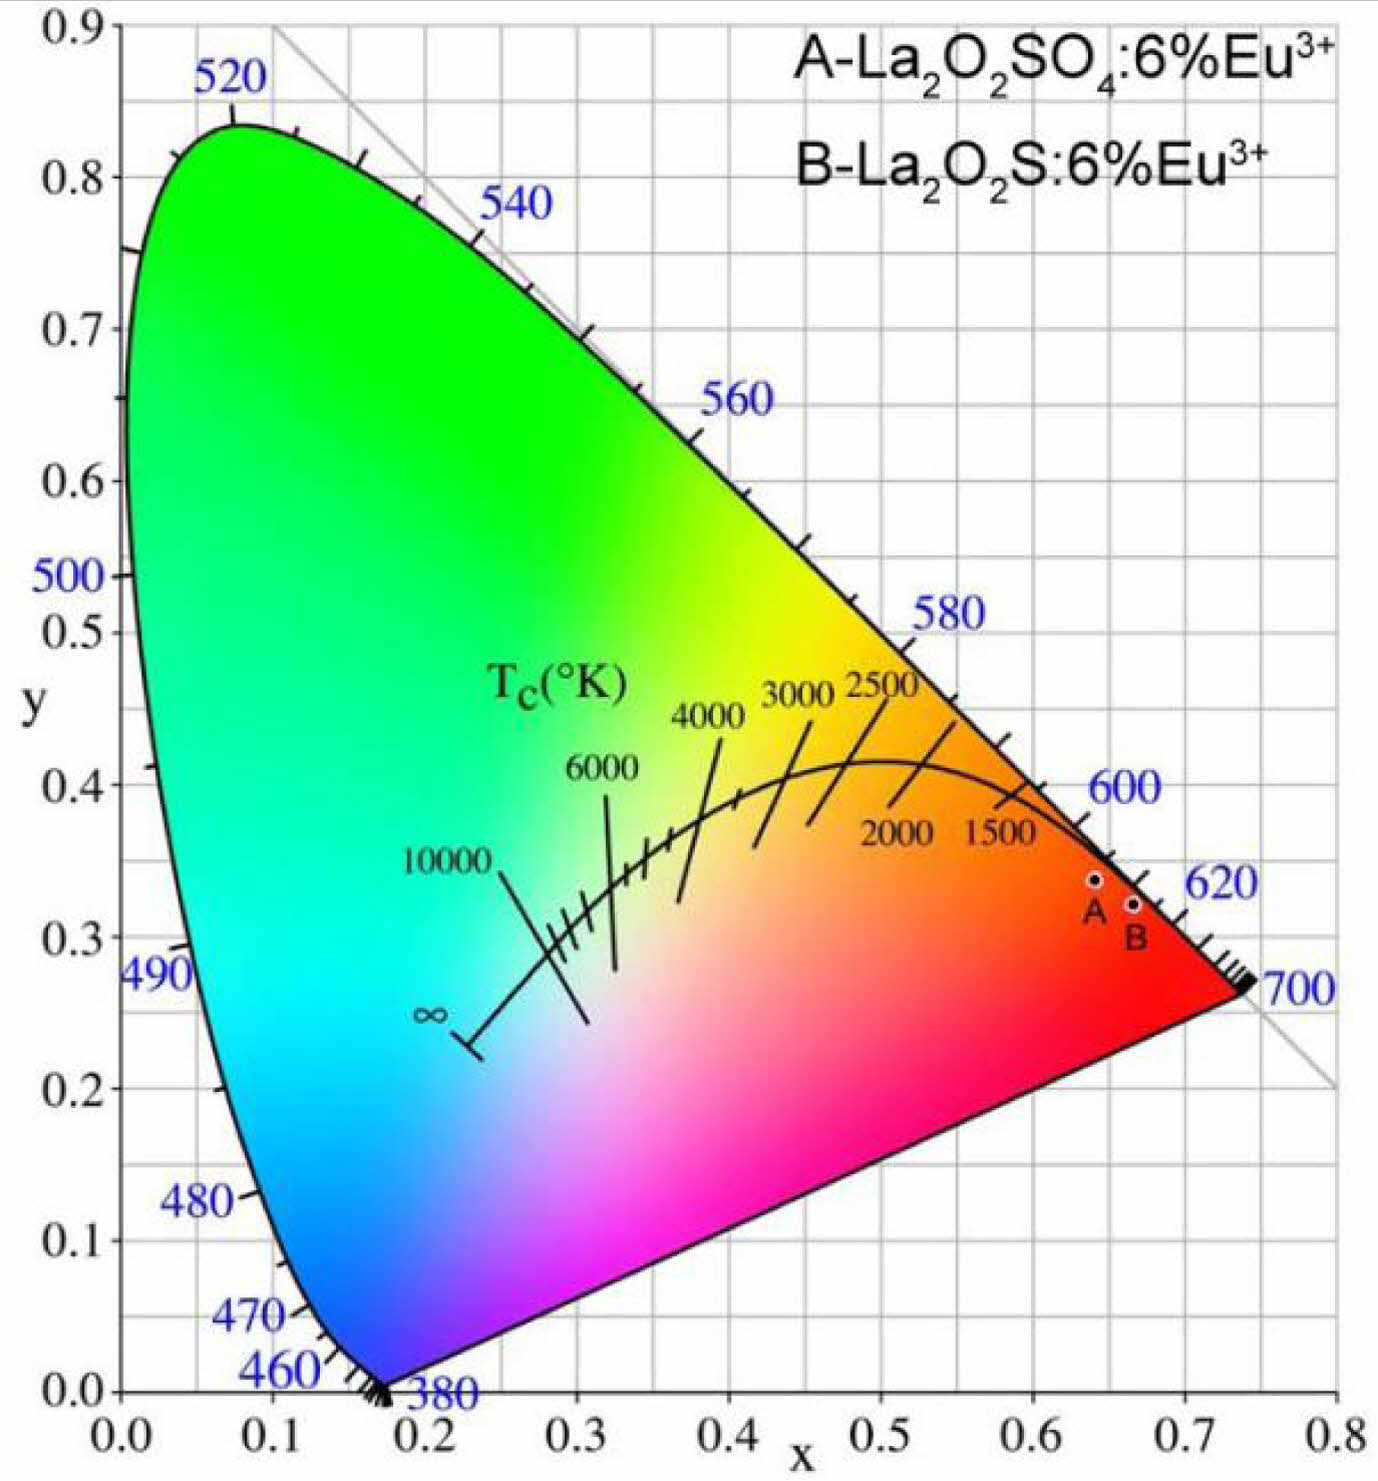
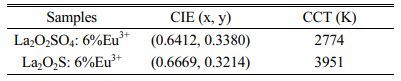
The CIE (x,y) coordinates were calculated by CIE 1931 chromaticity coordinate calculation software according to PL emission data. The CIE coordinates of La2O2SO4:6%Eu3+ phosphor and La2O2S:6%Eu3+ nanophosphor are (0.6412, 0.3380) and (0.6669, 0.3214), respectively, as displayed in Table 1. The CIE chromaticity diagram of La2O2SO4:6%Eu3+ phosphor (A) and La2O2S:6%Eu3+ (B) nanophosphor were presented in Fig. 8. As labeled in Fig. 8, compared with La2O2SO4:6%Eu3+ phosphor, La2O2S:6%Eu3+ nanophosphor has a redder ingredient in its emission, indicating that La2O2S:6%Eu3+ nanophosphor is in the deep red region with good red-light purity and excellent color saturation. Moreover, the correlated color temperature (CCT) is determined by McCamy's approximate equation (7) and (8) [36].
Where (xe, ye) is the chromaticity epicenter coordinates and its value is (0.3320, 0.1858). As shown in Table 1, the CCT values of La2O2SO4:6%Eu3+ phosphor and La2O2S:6%Eu3+ nanophosphor are 2774 K and 3951 K, respectively.
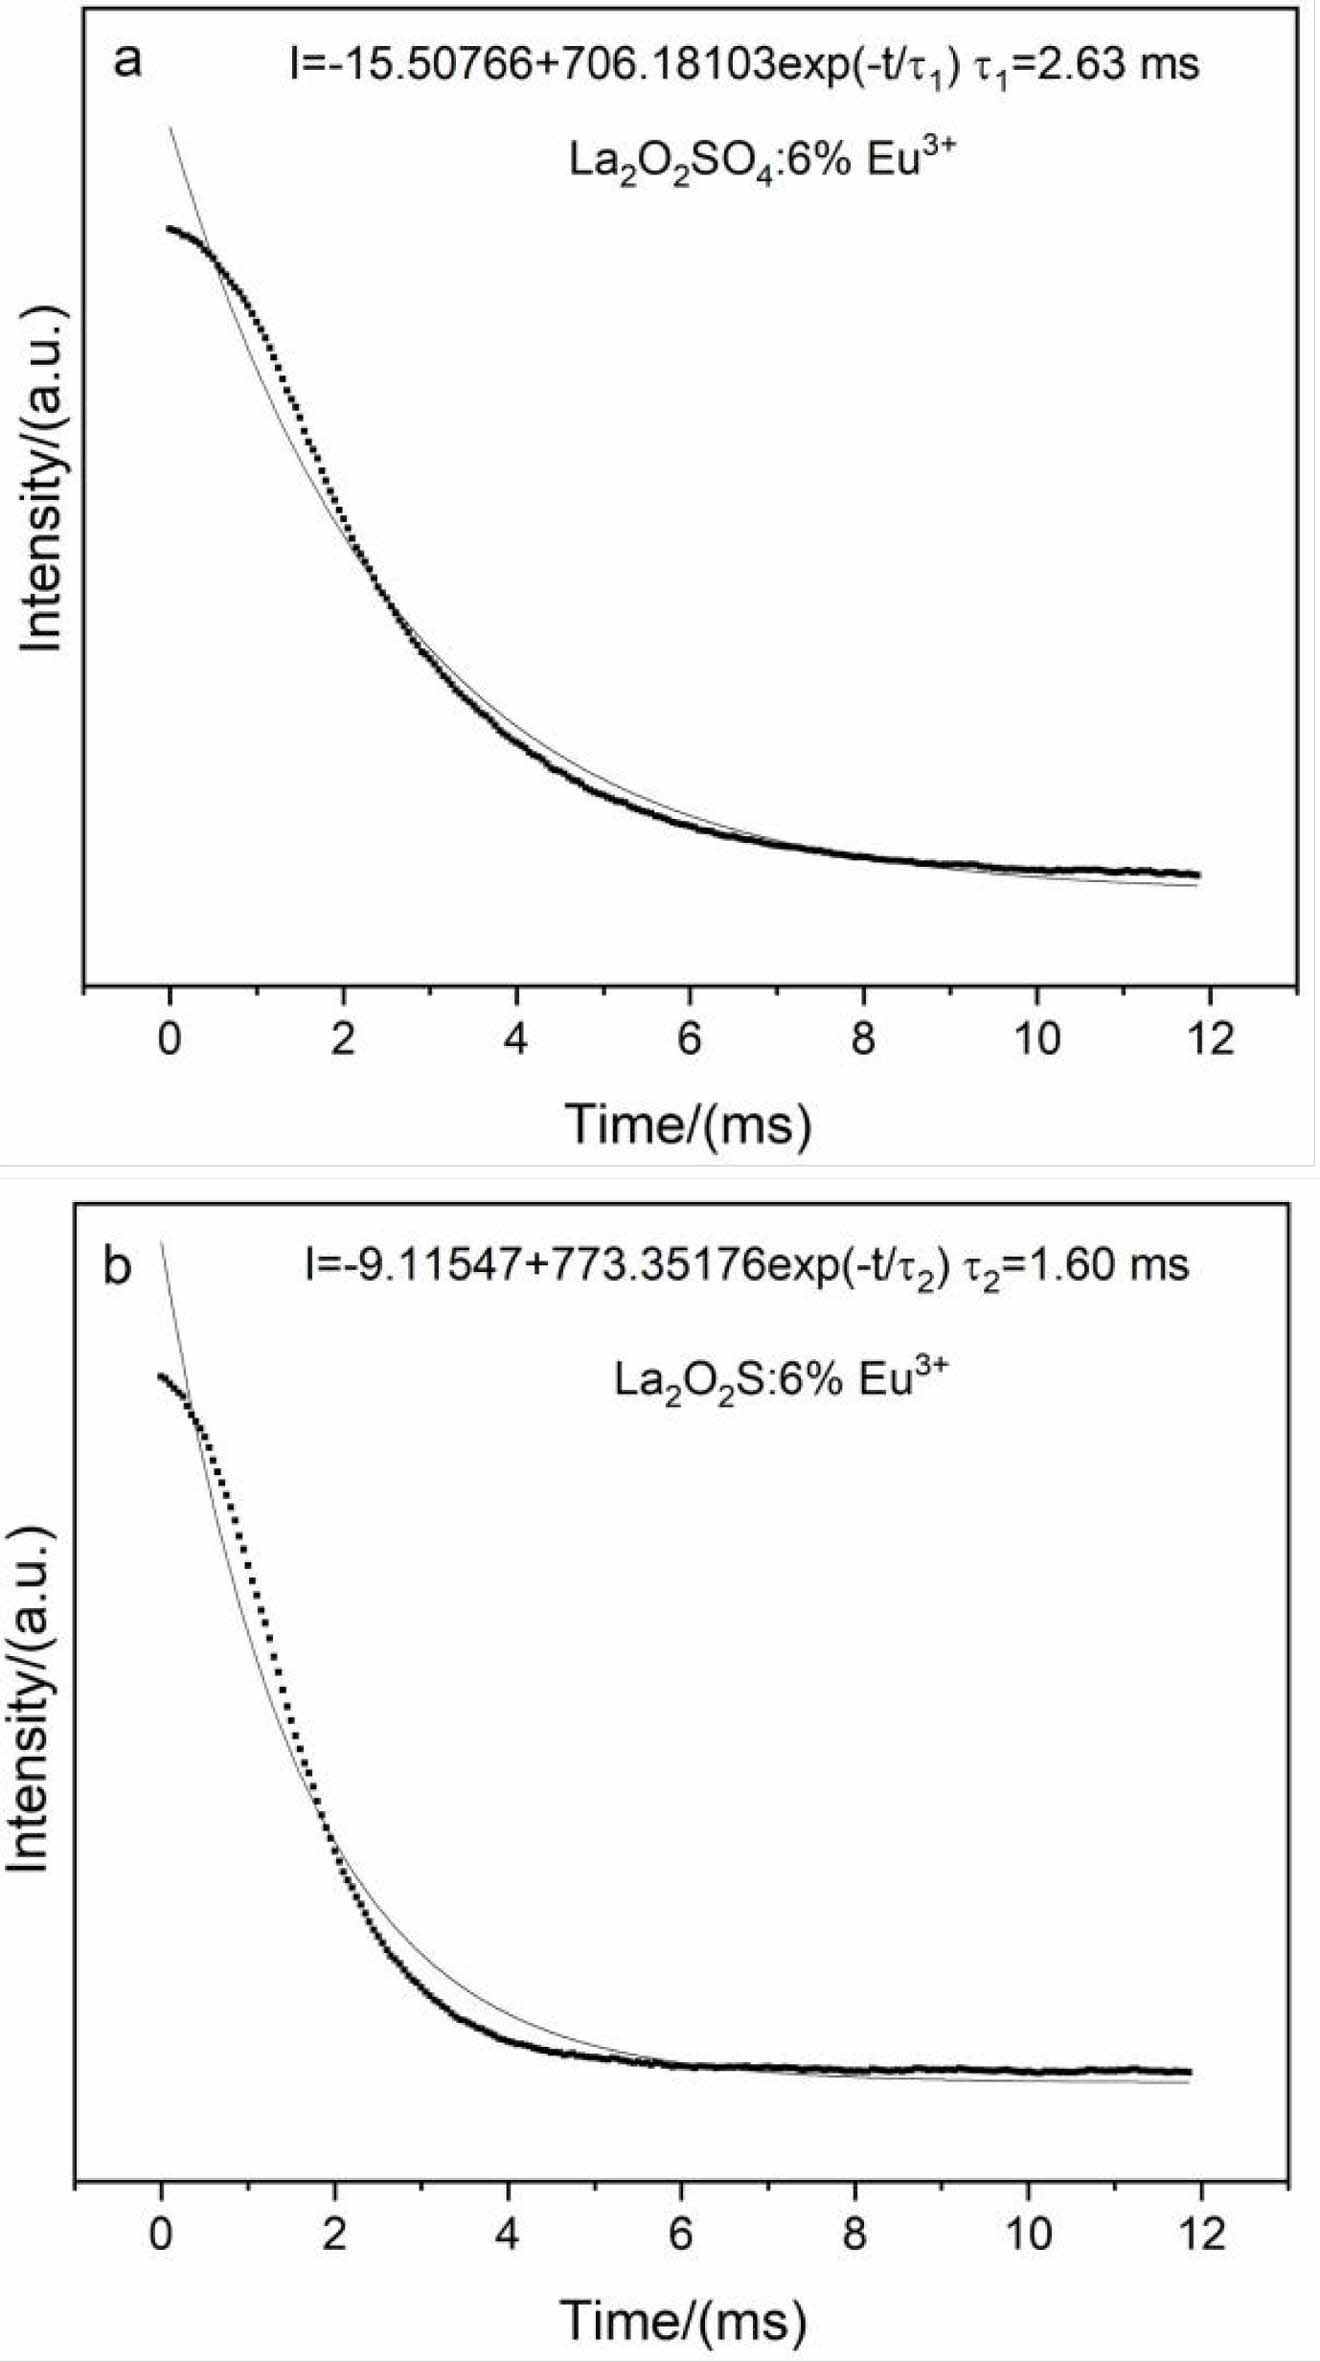
The fluorescence lifetimes of La2O2SO4:6%Eu3+ phosphor and La2O2S:6%Eu3+ nanophosphor excited by ultraviolet light at 254 nm were shown in Fig. 9. The decay curves can be well fitted into single exponential function.

where I(t) is the decay luminescence intensity, I0 is the initial luminescence intensity, and τ is the decay time. The calculated lifetimes are 2.63 and 1.60 ms for La2O2SO4:6%Eu3+ phosphor and La2O2S:6%Eu3+ nanophosphor, respectively. Notably, La2O2S:6%Eu3+ nanophosphor with more defects shows a shorter decay time compared to that of La2O2SO4:6%Eu3+ phosphor, since these defects act as the fluorescence quenching center resulting in a short fluorescence lifetime.
|
Fig. 1 Titration curve for the La2(SO4)3-NH3·H2O system. |
|
Fig. 2 FTIR spectrum and XRD pattern of the precursor. |
|
Fig. 3 DSC-TG-DTG curves of the precursor. |
|
Fig. 4 FTIR spectrum and XRD pattern of the intermediate product. |
|
Fig. 5 The XRD pattern of the reduction product at 800 oC for 1 h under reducing atmosphere. |
|
Fig. 6 FESEM morphologies of (a) the precursor, (b) the La2O2SO4 and (c) the La2O2S. |
|
Fig. 7 The excitation (a) and emission spectra (b) of the La2O2SO4:6%Eu3+ phosphor and La2O2S:6%Eu3+ nanophosphor. |
|
Fig. 8 The CIE chromaticity diagram of the La2O2SO4:6%Eu3+ phosphor and La2O2S:6%Eu3+ nanophosphor. |
|
Fig. 9 The decay curves of the La2O2SO4:6%Eu3+ phosphor and La2O2S:6%Eu3+ nanophosphor excited by ultraviolet light at 254 nm. |
|
Table 1 The CIE coordinate and CCT value for the La2O2SO4: 6%Eu3+ phosphor and La2O2S:6%Eu3+ nanophosphor |
In summary, a co-precipitation and reduction step was found to be feasible technology for preparing rice ear-like La2O2S:Eu3+ nanophosphor. It has the potential to become an environmentally friendly industrialized production technology as it requires low temperature and less time. The results show that the La2(OH)4SO4· 2H2O precursor can be converted into pure La2O2SO4 phase via thermal decomposition at 800 °C, and La2O2SO4 can be further reduced to La2O2S at 800 oC for 1 h. It was demonstrated that the precursor and La2O2SO4 display a similar lamellar structure with sub-microscale in side length and thicknesses of nanometer scale, but the structure of La2O2S changes to rice ear-like particles with the size of 20-50 nm due to fragmentation and agglomeration mechanism. Compared with the La2O2SO4 phosphor, the La2O2S nanophosphor is helpful for improving resolution in display devices. The La2O2S:6%Eu3+ nanophosphor displays main emission peak at 624 nm upon excitation at 254 nm. The calculated CIE coordinate and CCT values of the La2O2S:6%Eu3+ nanophosphor are (0.6669, 0.3214) and 3951 K, respectively. Moreover, the La2O2S: 6%Eu3+ nanophosphor possesses single exponential decay behavior with a lifetime of 1.60 ms. From the comparative study of La2O2SO4:6%Eu3+ and La2O2S: 6%Eu3+, the photoluminescent properties of La2O2S: 6%Eu3+ nanophosphor are more excellent in red light display field.
This work was supported by Foundation of Liaoning Educational Committee (No. L2019021).
- 1. R. Manigandan, K. Giribabu, R. Suresh, S. Munusamy, S. Praveen Kumar, S. Muthamizh, T. Dhanasekaran, A. Padmanaban, and V. Narayanan, RSC Adv. 5 (2015) 7515-7521.
-

- 2. J.G. Li, X.J. Wang, W.G. Liu, Q. Zhu, X.D. Li, and X.D. Sun, Nanoscale Res. Lett. 12[1] (2017) 508.
-
- 3. D. den Engelsen, T.G. Ireland, P.G. Harris, G.R. Fern, P. Reip, and J. Silver, J. Mater. Chem. C 4 (2016) 8930-8938.
-
- 4. Y. Xiao, R.F. George, W. Robert, and S. Jack, Nanoscale 5 (2013) 1091-1096.
-
- 5. V. Benjamin, N. Jörg, U. Andreas, K. Rajesh, and H. Markus, Nanoscale 5 (2013) 806-812.
-
- 6. X.Y. Tian, L. Li, M.Y. Wei, C.Y. Ji, Z. Huang, X. Liu, J. Wen, and Y.X. Peng, J. Ceram. Process. Res. 22[5] (2021) 555-567.
-
- 7. D. Nakauchi, M. Koshimizu, N. Kawaguchi, and T. Yanagida, J. Ceram. Process. Res. 20[4] (2019) 307-313.
- 8. Y.P. Du, Y.W. Zhang, L.D. Sun, and C.H. Yan, J. Am. Chem. Soc. 131[9] (2009) 3162-3163.
-
- 9. J.B. Lian, P. Liang, B.X. Wang, and F. Liu, J. Ceram. Process. Res. 15[6] (2014) 382-388.
- 10. G.X. Xu, J.B. Lian, N.C. Wu, X. Zhang, and J. He, J. Ceram. Sci. Technol. 9[3] (2018) 345-352.
- 11. M.H. Chung and J.H. Kim, J. Ceram. Process. Res. 20 [4] (2019) 431-435.
- 12. R. Vali, Comp. Mater. Sci. 37[3] (2006) 300-305.
-
- 13. Y.F. Zhu and Z. Ma, Asian J. Chem. 25[3] (2013) 1315-1318.
- 14. M. Machida, T. Kawano, M. Eto, D. Zhang, and K. Ikeue, Chem. Mater. 19[4] (2007) 954-960.
-
- 15. I. Iparraguirre, J. Azkargorta,O. Merdrignac-Conanec, M. Al-Saleh, C. Chlique, X.H. Zhang, R. Balda, and J. Fernández, Opt. Express 20[21] (2012) 23690-23699.
-
- 16. G.C. Jiang, X.T. Wei, Y.H. Chen, C.K. Duan, M. Yin, B. Yang, and W.W. Cao, Mater. Lett. 143[15] (2015) 98-100.
-
- 17. R. Balda, N. Hakmeh, M. Barredo-Zuriarrain, O. Merdrignac-Conanec, S. García-Revilla, M. Angeles Arriandiaga, and J. Fernández, Materials 9[5] (2016) 353.
-
- 18. S.V. Yap, R.M. Ranson, W.M. Cranton, D.C. Koutsogeorgis, and G.B. Hix, J. Lumin. 129[5] (2009) 416-422.
-
- 19. S.V. Yap, R.M. Ranson, W.M. Cranton, D.C. Koutsogeorgis, and G.B. Hix, J. Lumin. 129[5] (2009) 416-422.
-
- 20. Y.M. Yang, C. Mi, F. Yu, X.Y. Su, C.F. Guob, G. Li, J. Zhang, L.L. Liu, Y.Z. Liu, and X.D. Li, Ceram. Int. 40[7] (2014) 9875-9880.
- 21. Y.M. Yang, C. Mi, F. Yu, X.Y. Su, C.F. Guo, G. Li, J. Zhang, L.L. Liu, Y.Z. Liu, and X.D. Li, Ceram. Int. 40[7] (2014) 9875-9880.
- 22. D.K. Ma, S.S. Liu, Y.Q. Zhang, C.W. Zhang, and S.M. Huang, J. Exp. Nanosci. 8[4] (2013) 434-441.
- 23. B.M. Jaffar, H.C. Swart, H.A.A. Seed Ahmed, A. Yousif, and R.E. Kroon, Physica B 574 (2019) 411659.
-
- 24. L.X.Yu, F.H. Li, and H. Liu, J. Rare Earth. 31[4] (2013) 356-359.
-
- 25. Z.G. Liu, X.D. Sun, S.K. Xu, J.B. Lian, X.D. Li, Z.M. Xiu, Q. Li, D. Huo, and J.G. Li, J. Phys. Chem. C 112[7] (2008) 2353-2358.
-
- 26. E.I. Sal’nikova, D.I. Kaliev, and P.O. Andreev, Russ. J. Phys. Chem. A 85[12] (2011) 2121-2125.
-
- 27. K. Shah, A. Ciric, K.V.R. Murthy, and B.S. Chakrabarty, J. Alloy. Compd. 851 (2021) 156725.
-
- 28. J.J. Oh, B.K. Jin, W.J. Chung, D.W. Shin, and Y.G. Choi, Curr. Appl. Phys. 11[4] (2011) S15-S18.
-
- 29. M. Pokhrel, A.K. Gangadharan, and D.K. Sardar, Mater. Lett. 99 (2013) 86-89.
-
- 30. G.D. Liu, Q.H. Zhang, H.Z. Wang, and Y.G. Li, Mat. Sci. Eng. B 177[3] (2012) 316-320.
-
- 31. L.H. Lee, Progr. Colloid Polym. Sci. 82 (1990) 337-344.
- 32. X.J. Wang, J.G. Li, M.S. Molokeev, Q. Zhu, X.D. Li, and X.D. Sun, Chem. Eng. J. 302 (2016) 577-586.
-
- 33. X.J. Wang, J.G. Li, Q. Zhu, X.D. Li, X.D. Sun, and Y. Sakka, J. Alloy. Compd. 603 (2014) 28-34.
-
- 34. M. Yang, H.Y. Shi, L.W. Ma, Q.Y. Gui, J.L. Ma, M.N. Lin, A. Sunna, W.J. Zhang, L.M. Dai, J. Qu, and Y. Liu, J. Alloy. Compd. 695 (2017) 202-207.
-
- 35. Z.G. Wei, L.D. Sun, X.C. Jiang, C.S. Liao, C.H. Yan, Y. Tao, J. Zhang, T.D. Hu, and Y.N. Xie, Chem. Mater. 15[15] (2003) 3011-3017.
-
- 36. M. Liu, J. Lian, N. Wu, X. Zhang, and J. He, Solid State Sci. 112 (2021) 106520.
-
 This Article
-
2022; 23(5): 709-715
Published on Oct 31, 2022
- 10.36410/jcpr.2022.23.5.709
- Received on Apr 15, 2022
- Revised on Jun 20, 2022
- Accepted on Jun 25, 2022
Services
- Abstract
introduction
experimental procedure
results and discussion
conclusions
- Acknowledgements
- References
- Full Text PDF
Shared
Correspondence to
- Xing Li
-
Department of Science, Shenyang Jianzhu University, Shenyang, 110168, P.R. China
Tel : +86-24-24690063 Fax: +86-24-24690063 - E-mail: syjz_lixing1979@163.com
Clean-Energy Research Institute(CRI), Hanyang University, 222, Wangsimni-ro, Seongdong-gu, Seoul, 04763, Korea
E-mail: jcpr@hanyang.ac.kr