


- Controlling the size and carbon composition to determine the electrical conductivity of the kaolin-carbon composite
Agus Edy Pramonoa,*, Haolia Rahmana, Pribadi Mumpuni Adhia and Nanik Indayaningsihb
aDepartment of Mechanical Engineering, Politeknik Negeri Jakarta, Jln. Prof. Dr. G.A. Siwabessy, Kampus UI. Depok 16425, Jawa-Barat, Indonesia
bResearch Centre for Physics, National Research, and Innovation Agency (BRIN), Kawasan Puspiptek, Gd. 440-442, Tangerang Selatan, Banten 15310, IndonesiaThis article is an open access article distributed under the terms of the Creative Commons Attribution Non-Commercial License (http://creativecommons.org/licenses/by-nc/4.0) which permits unrestricted non-commercial use, distribution, and reproduction in any medium, provided the original work is properly cited.
The study is about the fabrication of kaolin-carbon ceramic composites, by controlling the size of carbon particles, with the mesh size of 150; 200; 250. Kaolin-carbon ceramic composite is fabricated with a composition ratio of 50:50; 60:40; and 70:30% weight, sintering pyrolysis at 950 °C, rate 2 °C/min, compaction 200 bar. The physical properties of the density/porosity, the conductivity properties of electric currents and voltages, the properties of electrical conductivity, elements and microstructures have been investigated. The smaller the size of the carbon particles, the lower the density. The higher the kaolin content the higher the composite density. At a composition ratio of 50:50 %wt, the size of the mesh carbon particle 150, at a voltage value of 4 volts, conducts an electric current of 0.89 [Ampere], and exhibits an electrical conductivity of 17 [S/m].
Keywords: Kaolin-carbon composite, Carbon particle size, Composition ratio, Electrical current, Electrical conductivity
The study is a development and improvement of the benefits of kaolin into engineered ceramics capable of conducting electric current. The basic ingredients of this study are kaolin, a local mining material from Singkawang, West Kalimantan, Indonesia, and synthetic carbon from organic waste. Electrically conductive carbon filler material is fabricated from organic waste of coconut coir. Why kaolin as a matrix, because kaolinite and illite are plastic components commonly used in traditional ceramics 1. It is easy to form, and it is easily mixed with carbon powder. Other researchers fabricate membranes from ceramics primarily in gas applications, due to their high thermal stability, good chemical compatibility, and good bending and press strength 2.
Composites are engineered materials, which are fabricated based on specific needs, based on properties that are planned, and desired by the designer. The basic material of composite formation consists of 2 or more of the basic materials, with the original properties of the base material. The formation of composites will form a new nature of the properties of each of the basic materials forming them. The basic material forming composites can serve as adhesive matrix, and the pair material serves as fillers or reinforcements as forming new properties of the engineered material. Composite materials can be limited to materials that contain continuous matrix constituents that bind together and give shape to a stronger, stiffer arrangement of reinforcing constituents, or other desirable properties. The resulting composite material has a balance of structural properties or other properties that are superior to its constituent materials.
The study developed ceramic carbon composites from local kaolin, and fillers from electrically conductive carbon particles fabricated from organic waste of coconut coir. Ceramic carbon composites have been widely fabricated, as shown in the following references. Green compacts of carbon ceramic composites are made by processing the mixing of dry powders from one or more of three - clay, glass, alumina and black carbon or graphite 3. Kaolin has been widely fabricated and used as a porceline material, including as an added material to white clay, this study was conducted in Korea in 2020 4, and study of porcelain production with kaolin materials from China, Vietnam, and Korea, conducted in 2019 5. For the formation of pores in the structure of light geopolymer mortar is used natural foam forming materials such as rice husks. Metakaolin was replaced with a mass of rice husks. The kaolin used in the study was extracted from Dibamba in Cameroon's Littoral region, a study conducted in 2019 6. The study deals with the development of new composites using kaolin clay. Study of the possible use of sewage sludge as raw materials combined with kaolin clay for the production of white ceramics with mechanical properties following Brazilian technical standards 7. Kaolin is one of the most widely used clays in a variety of industries, including paper, paint and coatings, cosmetics, chemistry, agriculture, concrete, and ceramics. The effect of kaolin dry milling on physical properties and microstructure development during combustion is investigated 8. Although extensive studies focused on the macro-scale physical and mechanical properties of high-temperature soils, the evolution of these macro properties across temperature ranges remains unclear. The effect of temperature changes on particle orientation from kaolin consolidation has been studied 9. Kaolin was chosen for its abundant use in ceramics, and because of the beneficial effect of the combustion process. The paper describes the measurement arrangement of dehydration that occurs between ilitic clay material and kaolin 1, by means of measurement of the temperature influence of electrical conductivity (called thermoconductometry) to detect the release of physically and chemically bound water 10. The study prepared macropori ceramic membranes using natural kaolin obtained from deposits in Nigeria and Ghana, and high-density polyetelen flour was used as a porous forming agent 2. The cytosan/kaolin composite porous membrane is successfully fabricated by the process of evaporation and casting of the solution. Suspensions or boosters with different concentrations of kaolin and chitosan exhibit Newtonian behavior, the study was conducted in 2017 11. Electroporcelain insulators are the material of choice for high and low voltage insulation. The purpose of the work was to evaluate two kaolin clays from the southern part of Ghana, the Assin-Fosu and Kumasi clays, as material source clay for the manufacture of electroporcelain insulators 12. Mullite-based ceramics are made by sintering reactions on mixtures containing kaolin clay and kaolin waste. The research aims to find out the potential reuse of kaolin waste to obtain mullite-based ceramics 13. Clay mines from different regions are classified as “ilytic-kaolinitic clay”. Clay with various physical-chemical characteristics, colors and combustion properties is used as the main raw material in the manufacture of various ceramic products for construction materials, such as building ceramics, ceramic tiles, and sanitary equipment 14. Porous mullite ceramics are made from kaolin and Al2O3 with different sintering additives TiO2, MgO and MoO3. The sintering process has a significant influence on grain morphology and densification processes with variations in the composition and viscosity of the liquid phase during combustion 15. Low-cost ceramics are fabricated from kaolin through phase inversion techniques with two sizes of kaolin particles, namely 0.04-0.6 μm and 10-15 μm, kaolin content ranging from 14 to 39% weight, sintered at 1200 °C. The influence of kaolin particle size as well as kaolin content on membrane structure, pore size distribution, porosity, mechanical strength, surface roughness and gas permeation have been investigated 16.
Material
The study use kaolin material that is a local material from Singkawang, West Kalimantan, Indonesia. Kaolin has been prepared in the form of dried flour with 325 mesh. Carbon material is prepared by carbonization process from coconut coir at a temperature of 950 °C, at a temperature rate of 2 °C/minute, in an airtight tube. Carbon is milled with a ball mill machine and sieve fibration machine to reach mesh size of 150; 200; 250. The previous research on carbonization at the temperature of 950 °C showed in relatively high electrical conductivity 17.
Characteristics of the material
Kaolin and carbon materials were tested XRD and XRF at the physics laboratory, National Research and Innovation Agency (BRIN), Serpong, Indonesia. Kaolin's elemental content is tested with X-ray Fluorescence Analyzer TORONTECH TT - EDXPRT, the main content of kaolin are Si (67.1% weight), Al (27.4% weight), the rest is shown in Table 1. Another article shows the content of almost the same elements, 8, 4. In general, the largest content of kaolin is Si, as shown in this reference article 5, 6, 7, 11, 18, 12, 19.
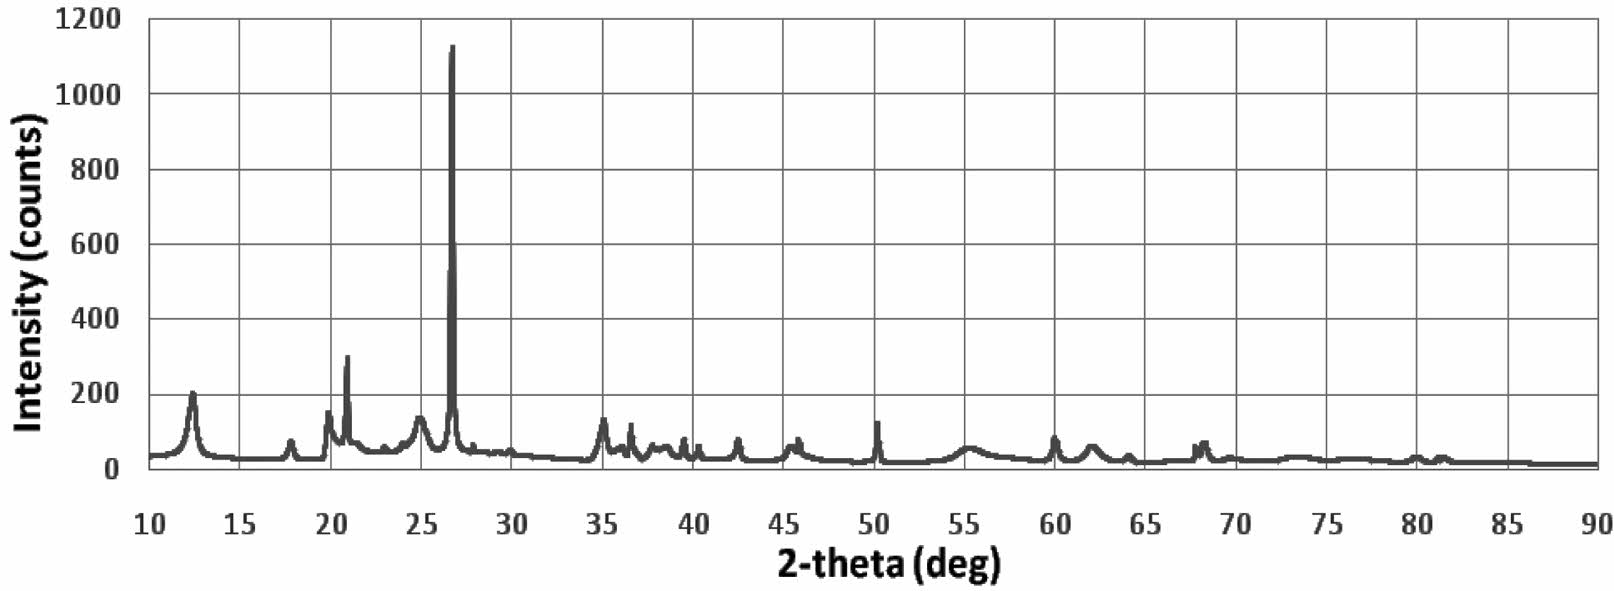
The kaolin XRD test is shown in Fig. 1, The highest intensity is at an angle of 2θ=26.961 °.
The diffraction curve profile of the kaolin material has a crystal structure, with several peaks showing its theta angular position (2θ), among others at: 12.403; 21.37; 24.87; 26.69; 35.131, 36.609; 39.53; 45.37; 61.95. Kaolin in nature will contain several kinds of elemental and compound content that depends on the location of the source. The main compounds of kaolin are Al2(OH)4Si2O5 or Al2Si2O5(OH)4 or Al2O3·2SiO2· 2H2O. In comparison, the same XRD test profile was shown by several studies, 4, 5, 6, 7, 12, 13, 18, 20, 21.
XRD analysis in Fig. 1 does not distinguish the presence of mullite, because it overlaps with quartz peaks and other phases, the identification of low numbers of these phases is quite difficult. Even in traditional ceramics, where only quartz and mullite are formed, XRD evaluation of mullite requires special and accurate investigation 22.
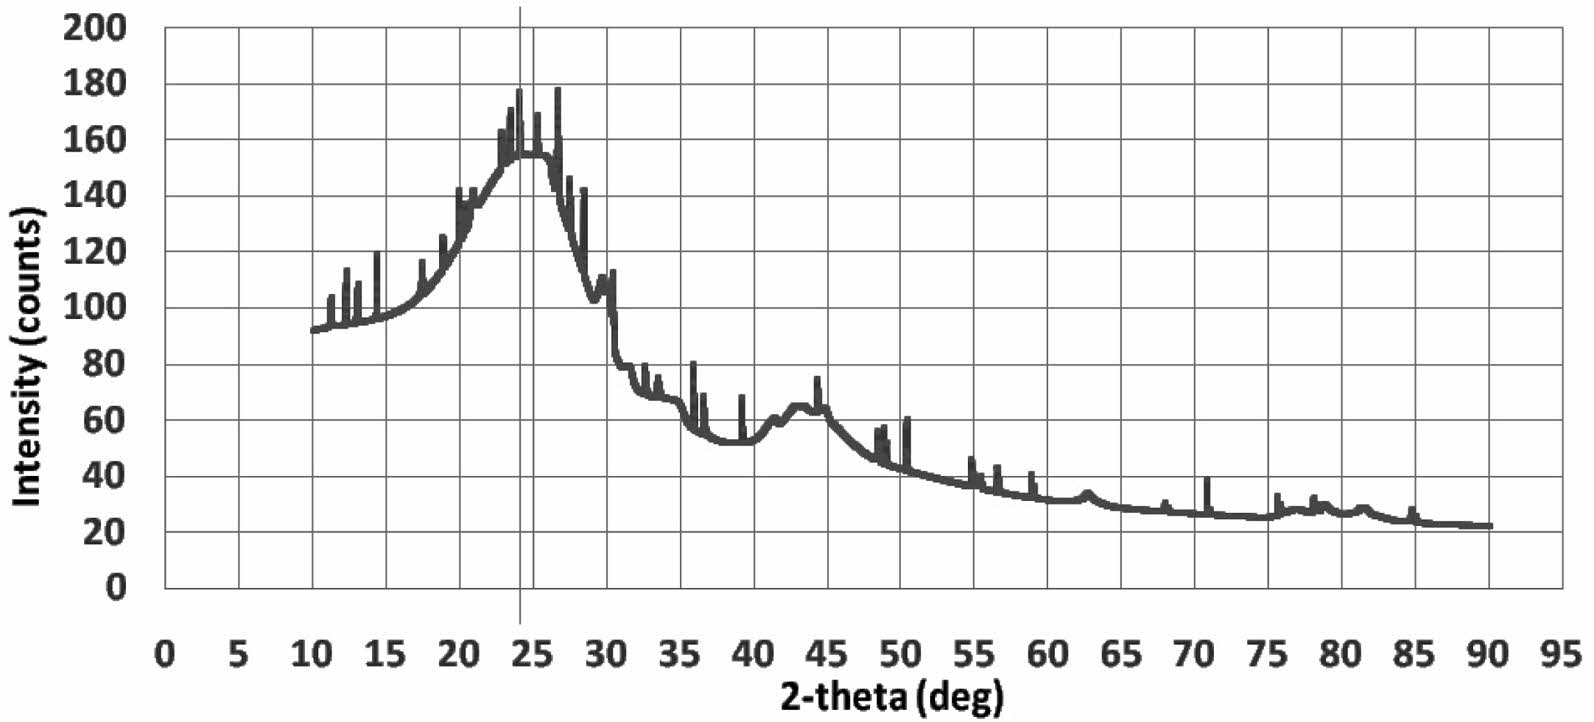
Kaolin density shows 2.31±0.07 [gram/cm3], this reference shows almost the same density, 2.40 to 2.74 [gram/cm3] 14. The XRD characteristics of carbon are shown in Fig. 2. The XRD test profile shows the amorphous structure of carbon material, an irregular arrangement of atoms. The highest intensity is at an angle of 2θ=24.25 °. The carbon study also showed similar results from the XRD test 23. The density tests of synthetic carbon showed 1.3794±0.12 [gram/cm3].
Sample fabrication
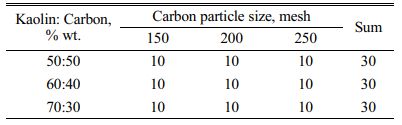
Evenly mixing kaolin-carbon is done with a mixer machine, added water 10-20 % wt of water to get the plastic properties of the mixture. The composition ratio of the mixture between kaolin-carbon is designed to be 50:50; 60:40; and 70:30 %wt. Compaction is done with a hydraulic press machine with a pressure of 200 bars, produced green compact tablet with a size of 40 mm Ø×10 mm thick. Sintering pyrolysis is carried out in an airtight tube at a temperature of 950 °C, a temperature rate of 2 °C/minute, a holding time of 4 hours, produced a specimen of kaolin-carbon composite in quantities as shown in Table 2. Sintering pyrolysis is done to protect carbon particles from oxidizing. Other researchers performed almost the same sintering process. The sintering process has a significant influence on grain morphology and densification processes with variations in composition, with a heating rate of 3 °Cmin-1 from room temperature to 950 °C. Holding time of 1 hour is done at 950 °C to promote the formation of mullite whiskers 15.
Electrical properties
The electrical properties were tested with the four-point probe method, Keithley Instruments 8, 24, 25, The 2450 Source Meter® Instrument, in the physics laboratory, National Research and Innovation Agency, Serpong, Indonesia. The test is to determine the electrical characteristics of voltage and electric current flowing on kaolin-carbon composite materials. The test follows the ASTM D4496 standard, to determine the electrical current delivery power, voltage, and resistance, and electrical conductivity of carbon ceramic materials 1, 8, 23. Measurement of electrical conductivity following ASTM D257 standard. Measurements are made on the thickness of the specimen, and the cross-sectional area of the specimen.
Density
Density testing is performed to determine the density of kaolin-carbon composites. The test was conducted experimentally using the Archimedes method based on the DIN-51097 standard 4, 6.
Porosity
Porosity testing follows ASTM standard C20-00 (2015). Porosity is expressed as the percentage of the relationship of the volume of the pore cavity in the specimen to its exterior volume.
Identify elements with SEM-EDS
The SEM-EDS test show elements contained within the kaolin-carbon composite. The test was conducted with the SEM Hitachi SU 3500, in the physics laboratory, the National Research and Innovation Agency.
Miscrostructure
Microstructure test was conducted by scanning electron microscopic Hitachi SU 3500 17, in the physics laboratory, National Research and Innovation Agency, Serpong, Indonesia. Tests were conducted to determine the condition of the microstructure of kaolin-carbon composites on a micro scale. Based on micro- structure can be known geometric shapes of particles, both kaolin ceramic matrix and carbon particles, can be known particle interface bonds, and the appearance of cavities that form porosity in ceramics can be known.
|
Fig. 1 XRD test of kaolin |
|
Fig. 2 XRD test of carbon. |

Bulk density
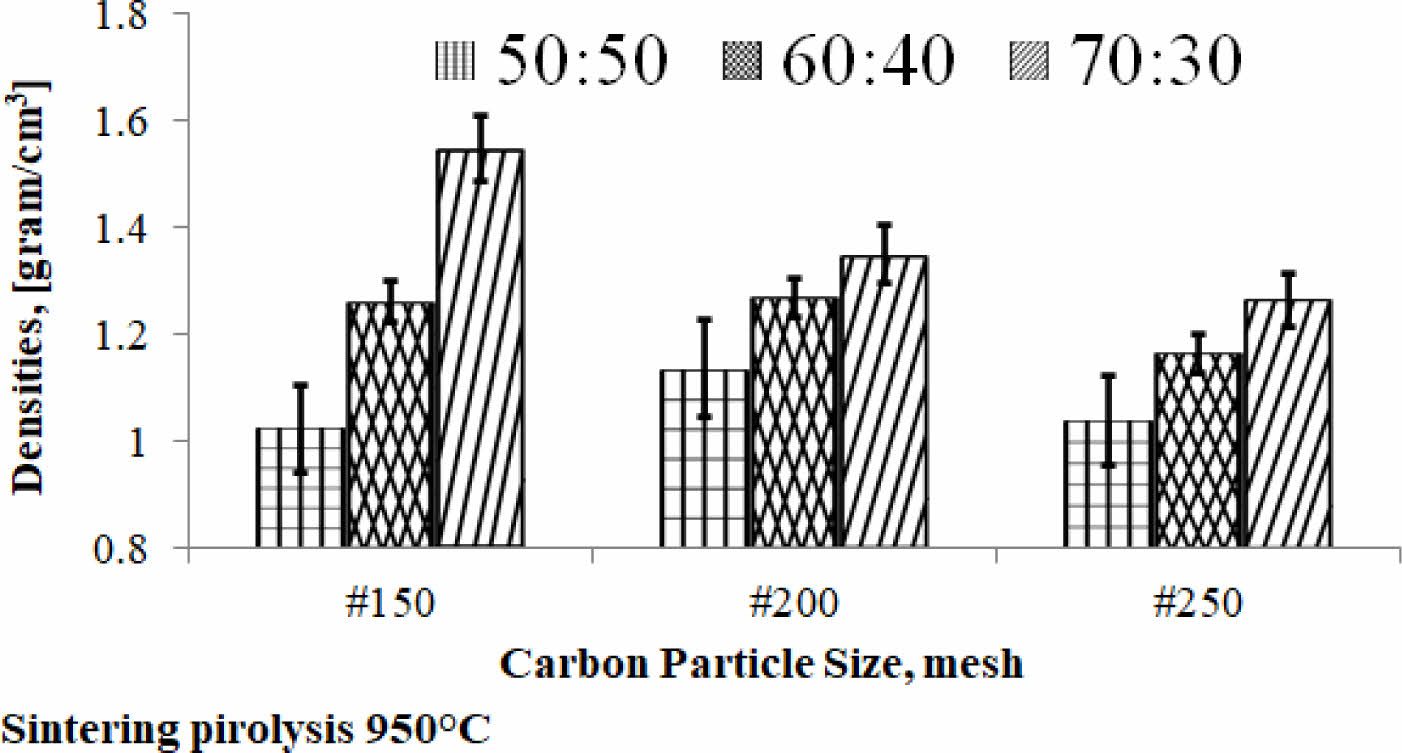
Density is the physical properties of a material that indicate the specific weight of the engineering material of this study and become the density information of the material. The density value relationship vs. carbon particle size vs. composition ratio is shown in Fig. 3. The kaolin-carbon composition ratio of 70:30 %wt indicates a tendency for density values to decrease as the size of carbon particles gets smaller, from mesh size of 150 to 250. The trend is experienced by composition ratios of 60:40 %wt and 70:30 %wt. Each composition ratio shows a different slope of decline. The sharp slope is indicated by the kaolin-carbon composite with a composition ratio of 70:30 %wt, while the ratio of 50:50 %wt indicates a sloping increase, even tending to be relatively flat. Meanwhile, as the ratio of mixed composition in composites increases from 50:50 %wt to 70:30 %wt, the density of the composite increases, meaning that the weight of the composite is getting higher, as shown in Fig. 3.
The highest density is produced by composites with a composition ratio of 70:30 %wt, at particle mesh size of 150, which is 1.55 grams/cm3. The lowest density value of the ceramic-carbon composite is produced by a composition ratio of 50:50 %wt, at particle mesh size of 150, which is 1.02 grams/cm3. It is normal because kaolin has a higher density than carbon. So, when the content of kaolin is higher, it will produce a higher density in the kaolin-carbon composite bulk. In comparison, some articles show similar density values, for example bulk density 1.025 to 1.05 [grams/cm3] 8. Densities Carbon-Ceramic Composites of all compositions are in the range of 1.65-1.87 [grams/cm3] 26.
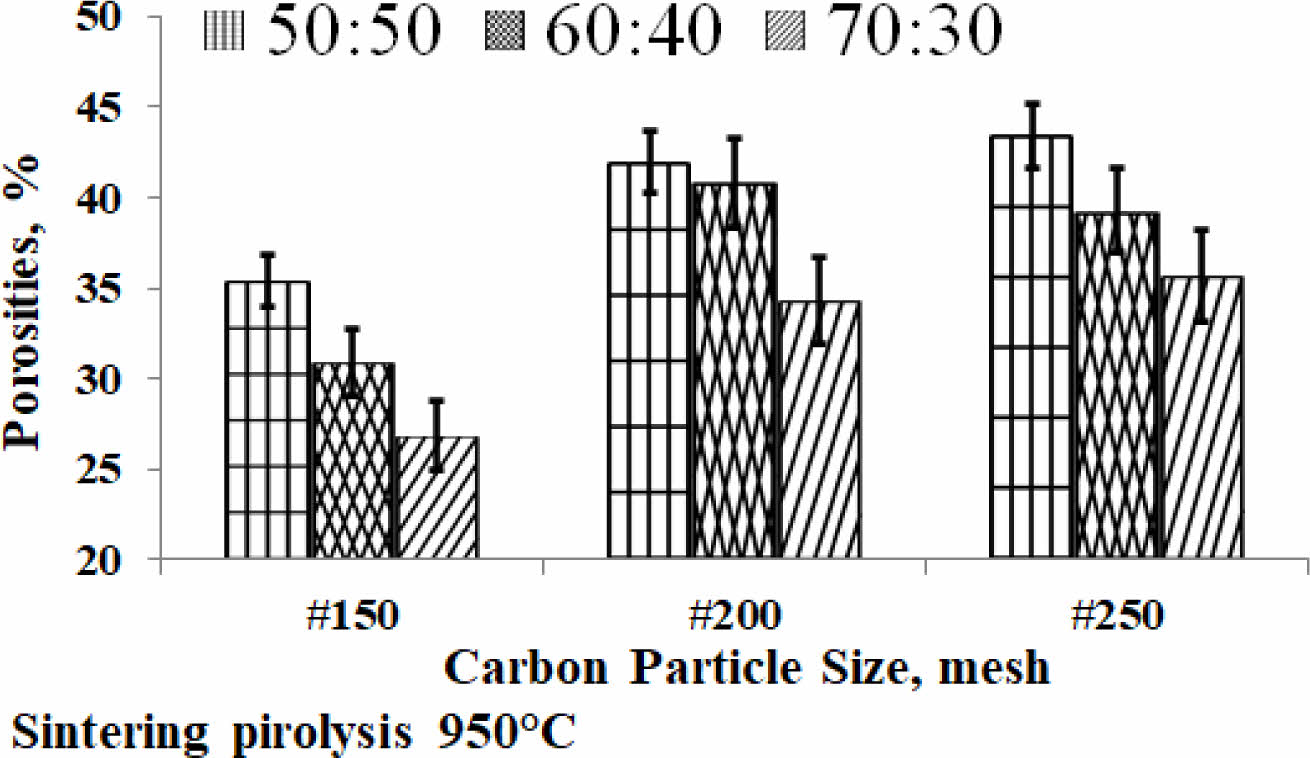
Ceramic-carbon composite porosity
Porosity is one of the physical properties that indicate the presence of micro cavities in the engineered material, meaning that the material is not completely solid. The material of this study is the result of fabrication, porosity will always be there. The kaolin-carbon composite porosity of the study is shown in Fig. 4. A high percentage of porosity indicates that the material contains a lot of cavities, as shown in composites with a composition ratio of 50:50 %wt, at the size of carbon mesh particle of 250 containing 43% porous. Meanwhile, the lowest porosity is produced by composites with a composition ratio of 70:30 % wt, at mesh particle size of 150, which is 27% porous. The study showed that the higher the kaolin content the lower the percentage porosity of the ceramic-carbon composite. Porosity decreases as the size of carbon particles gets larger, shown in mesh size 150, all composition ratios (in mesh 150) show a lower percentage of porosity than mesh sizes 200 and 250, as shown in Fig. 4. The fabrication process with a pressure compaction of 200 bars, which is the same for all variations in the size of carbon particles is thought to be the cause of the increase in porosity percentage at increasingly smaller particle sizes.
The smaller size of the carbon particles requires a compaction pressure greater than 200 bar, with greater pressure then the cavity formed can be filled and reduced, so the density also increases, and the porosity content decreases. In comparison, the following study shows porosity ranges from 28.63-67.13% 27. Meanwhile, a mixture of kaolin with Al2O3, without the sintering process produces an open porosity of about 32 to 38% 15. Another study, a ceramic membrane fabricated from kaolin produces porosity of about 27 to 62% 2. A study showed processed ceramics of kaolin waste with real porosity lower than 5% (almost zero after sintering at 1300 °C) 13.
Electrical properties
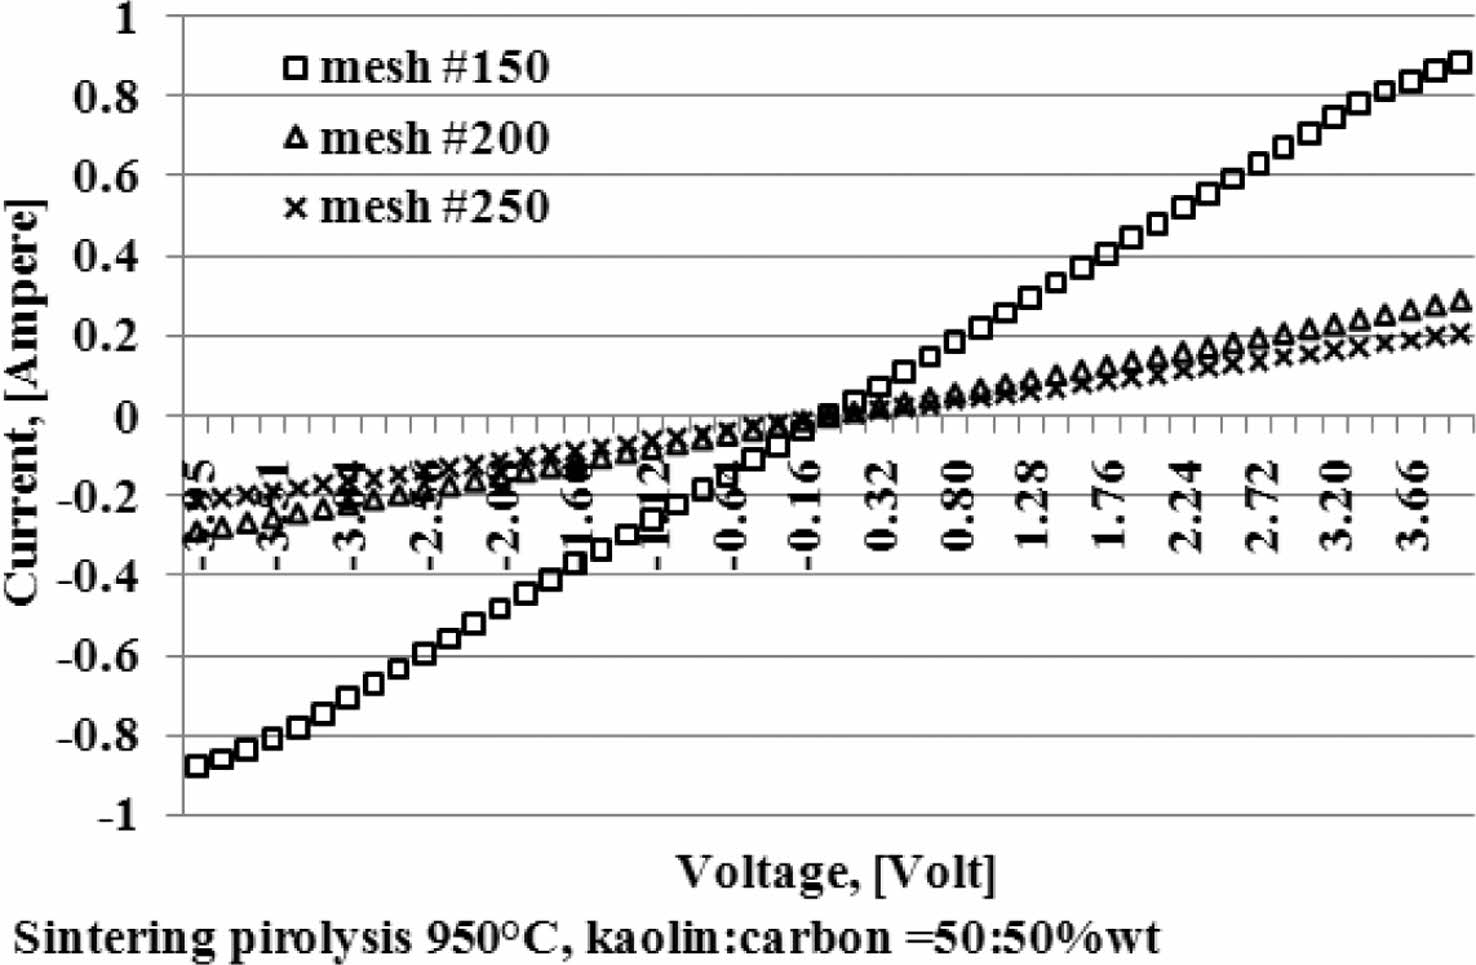
Current and voltage are measured simultaneously with the four-point probes method, the relationship of the electric current and the voltage variation shown in Fig. 5. When the voltage is reached at a value of 4 volts, at a kaolin-carbon composition ratio of 50:50 %wt, the electric current flows by 0.89 [Ampere]. At a composition ratio of 60:40 %wt, at the same voltage, it shows a current of 0.7 [Ampere]. Meanwhile, at a composition ratio of 70:30 %wt a very small current is produced, which is 0.0003 [Ampere]. The fact occurs in kaolin-carbon composites with carbon mesh particle size of 150 mesh, as shown in Fig. 5(a). For carbon particles with mesh of 200, as shown in Fig. 5(b), when the voltage shows a magnitude of 4 volts, for a composition ratio of 50:50 %wt conducts a current of 0.3 [Ampere]. For the composition ratio of 60:40 %wt it delivers a current of 0.2 [Ampere]. For the composition ratio of 70:30 %wt delivers a current of 0.07 [Ampere]. The smaller the size of the carbon particles the smaller the electrical current delivery. At mesh size of mesh of 250, when the voltage shows 4-volts, the composition ratio of 50:50 %wt conducts an electric current of 0.21 [Ampere], the composition ratio of 60:40 %wt conducts current of 0.16 [Ampere], composite with a ratio of 70:30 %wt conducting an electric current of 0.06 [Ampere], as shown in Fig. 5(c). The graph shows linearity, meaning the higher the voltage that passes through the ceramic-carbon composite will result in a higher current. The angle of the slope tangent indicates the height of the current delivery that occurs or 1/R, as shown in Fig. 6. Fig. 6 also shows the higher the carbon content in the composite the greater the angle produced, and means it shows the higher the current delivery. The size of carbon particles affects the delivery of electric current from kaolin-carbon composites, as shown in Fig. 7.
At a composition ratio of 50:50 %wt, and a sintering pyrolysis process of 950 °C, at a voltage value of 4 volts, the particle size of carbon mesh of 150 delivers a current of 0.89 [Ampere], mesh of 200 delivers a current of 0.3 [Ampere], mesh of 250 delivers current 0.21 [Ampere].
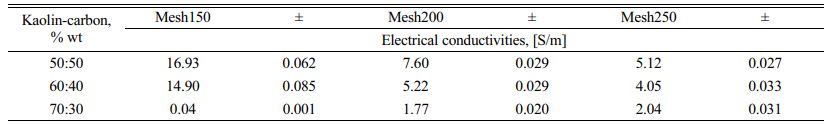
The fact suggests that the smaller the size of the carbon particles the lower the electrical current delivery of the kaolin-carbon composite in the study. At all ratios the composition of kaolin-carbon indicates the smaller the size of the carbon particles the lower the electrical conductivity, as shown in Fig. 8. The tendency of kaolin-carbon composite electrical conductivity to follow the electric current, the greater the size of the carbon particles the higher the electrical conductivity. At a composition ratio of 50:50 %wt with the size of carbon mesh of 150, it shows an electrical conductivity of 17 [S/m]. Meanwhile, composites with a composition ratio equal to the size of carbon mesh particles 250 showed an electrical conductivity of 5 [S/m]. In contrast, the mesh size of carbon particle 150 at a kaolin-carbon composition ratio of 70:30 %wt showed the lowest electrical conductivity of 0.044 [S/m].
Meanwhile, as the size of the carbon particles gets smaller, in mesh 250, it produces a higher conductivity, 2 [S/m]. The study shows the opposite fact to mesh sizes 150 and 200. Electrical conductivity for all variations in composition ratio and variation in carbon particle size is shown in Table 3.
Content of kaolin-carbon composite elements
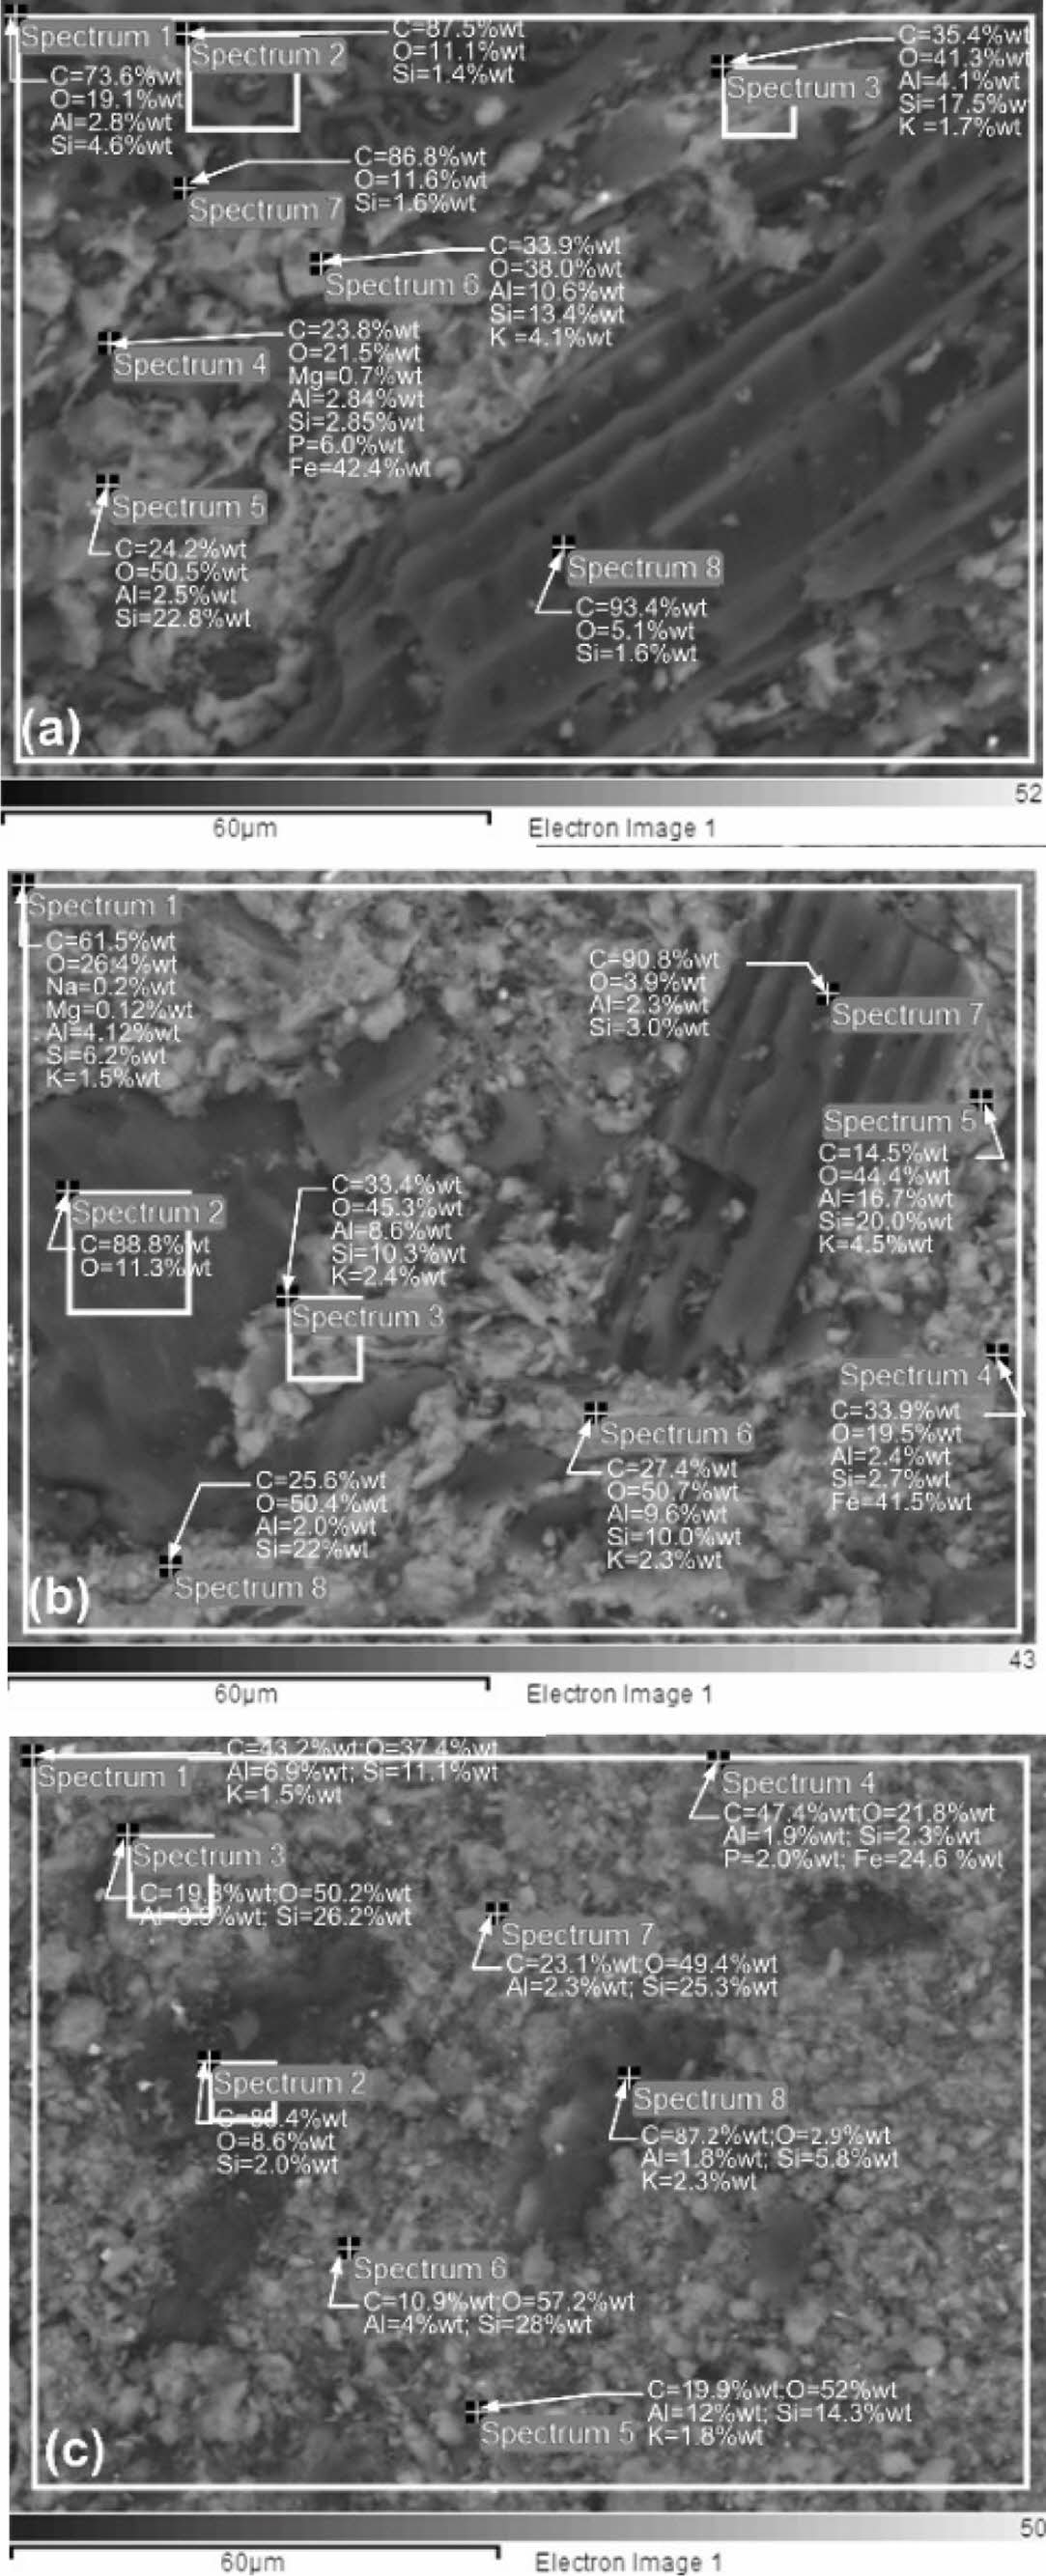
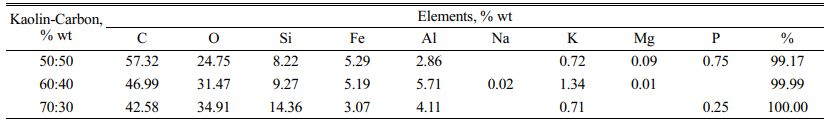
Determination of the elemental content in the kaolin-carbon composite was carried out by energy-dispersive X-ray spectroscopy (EDS) test, SEM Hitachi SU 3500. The test is randomized with the unique features of eight spectrum points at each test sample composition ratio. Observations were made on all composition ratios, but only on the size of carbon particles of 150 mesh. The distribution of spectrum points is shown in Fig. 9. All kaolin-carbon composite composition ratios indicate a high percentage of carbon elements. It is shown in Fig. 9(a), a kaolin-carbon composite with a composition ratio of 50:50 % wt, some black features at spectrum points 1, 2, 7, and 8 show the content of carbon elements respectively 73.6, 87.5, 86.8, and 93.4 % wt of carbon. In Fig. 9(b), kaolin-carbon with a composition ratio of 60:40 % wt, at spectrum points 1, 2, and 7 shows carbon elements respectively 61.5, 88.8, and 90.8 % wt of carbon. In Fig. 9(c), with a composition ratio of 70:30 % wt, the carbon element is represented by spectrum points 2, and 8, respectively 89.4, and 87.2 % wt. Each percentage of the weight of the elements in the composite is averaged. The highest carbon element content is 57.32 % wt formed by a 50:50 % wt kaolin-carbon composite, consecutively a composition of 60:40 % wt forming a carbon element of 46.99 % wt, and a composition of 70:30 % wt indicating a carbon element content of 42.58 % wt, as shown in Table 4. Table 4 also shows the content of Si elements as the main element of kaolin, sequentially following the composition ratio showing the content elements Si 8.22 %wt, 9.27 %wt, and 14.36 %wt. The sequence of the main element content in this kaolin-carbon composite shows that the higher the weight of the kaolin the higher the content of the Si element.
Microstructure
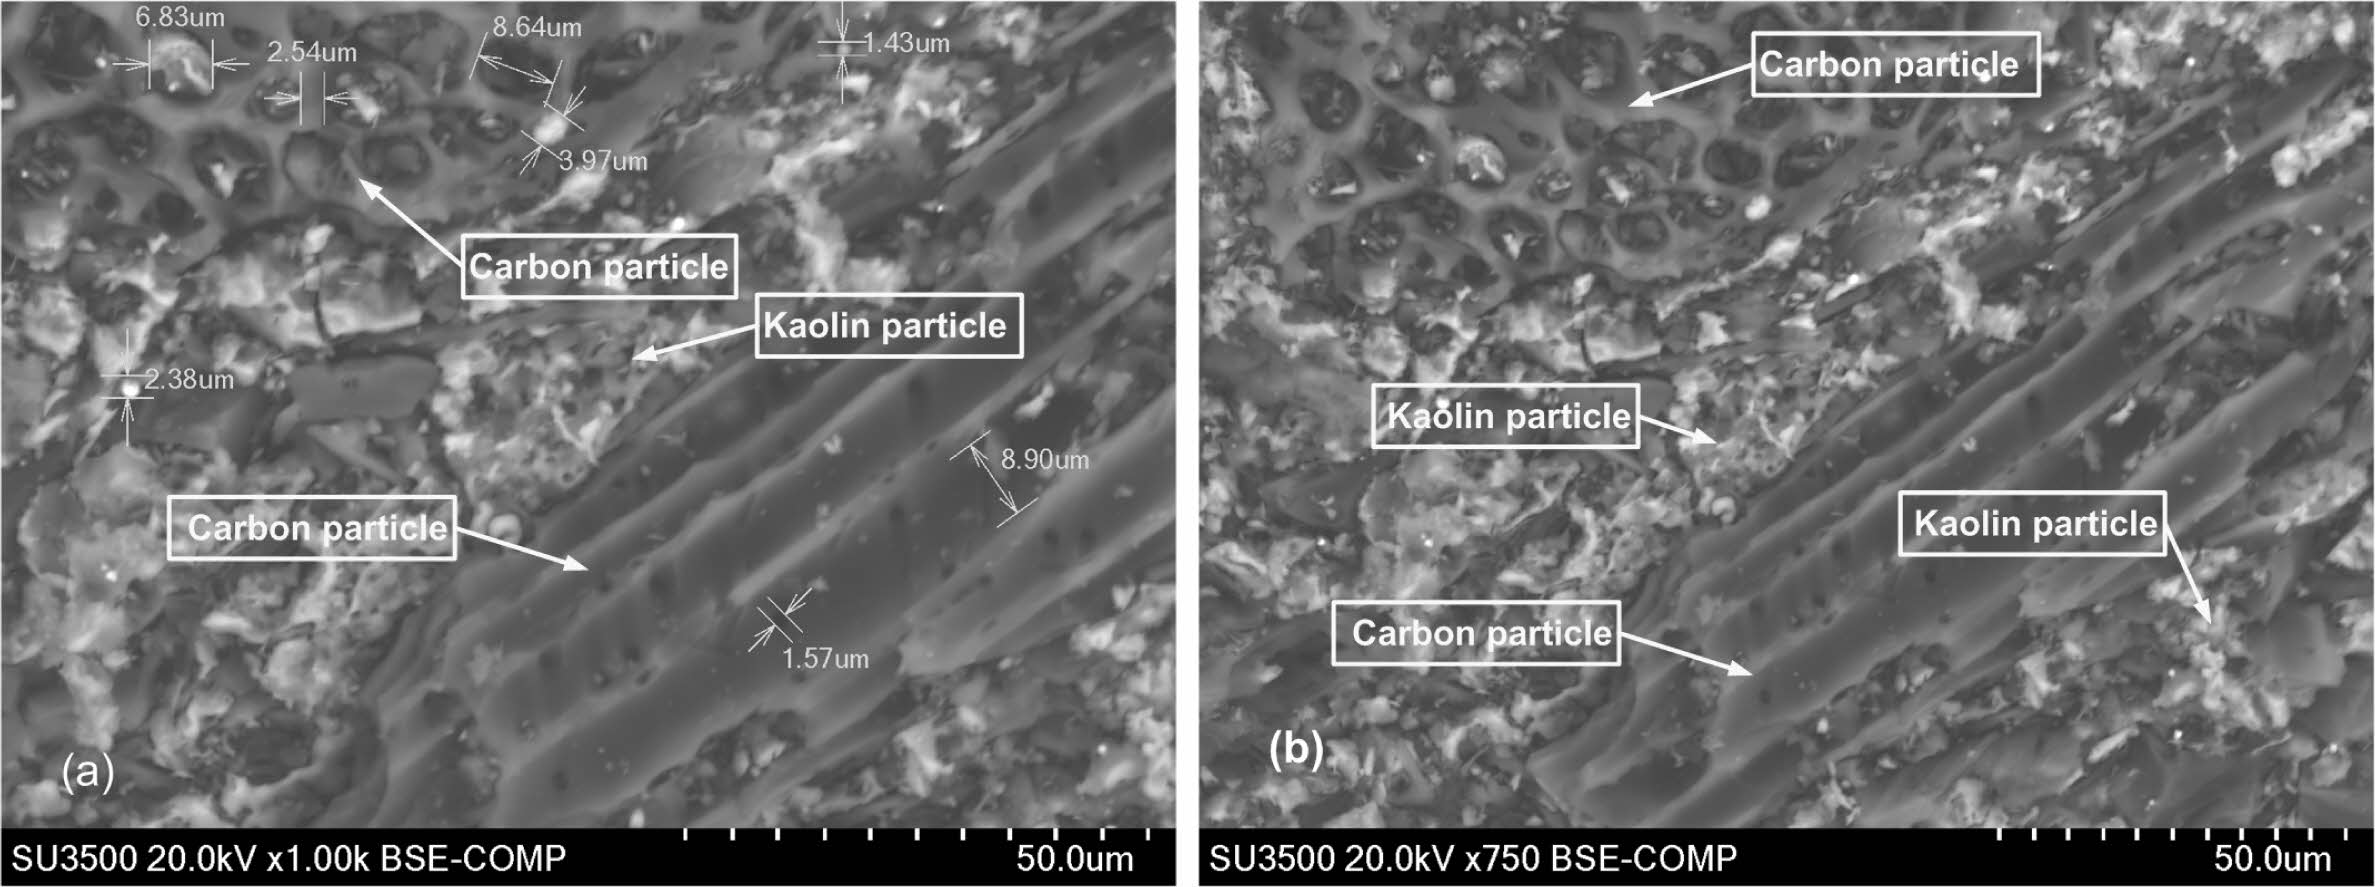
The microstructure tests of kaolin-carbon composite are to show evidence of porosity in the composite. Fig. 10(a) shows the microstructure of cavities or porous formed within the ceramic-carbon composite. The composite contains porosity with a size of about 9 mm. It occurs in composites with a composition ratio of 50:50 %wt, sintering 950 °C, and mesh particle of 150.
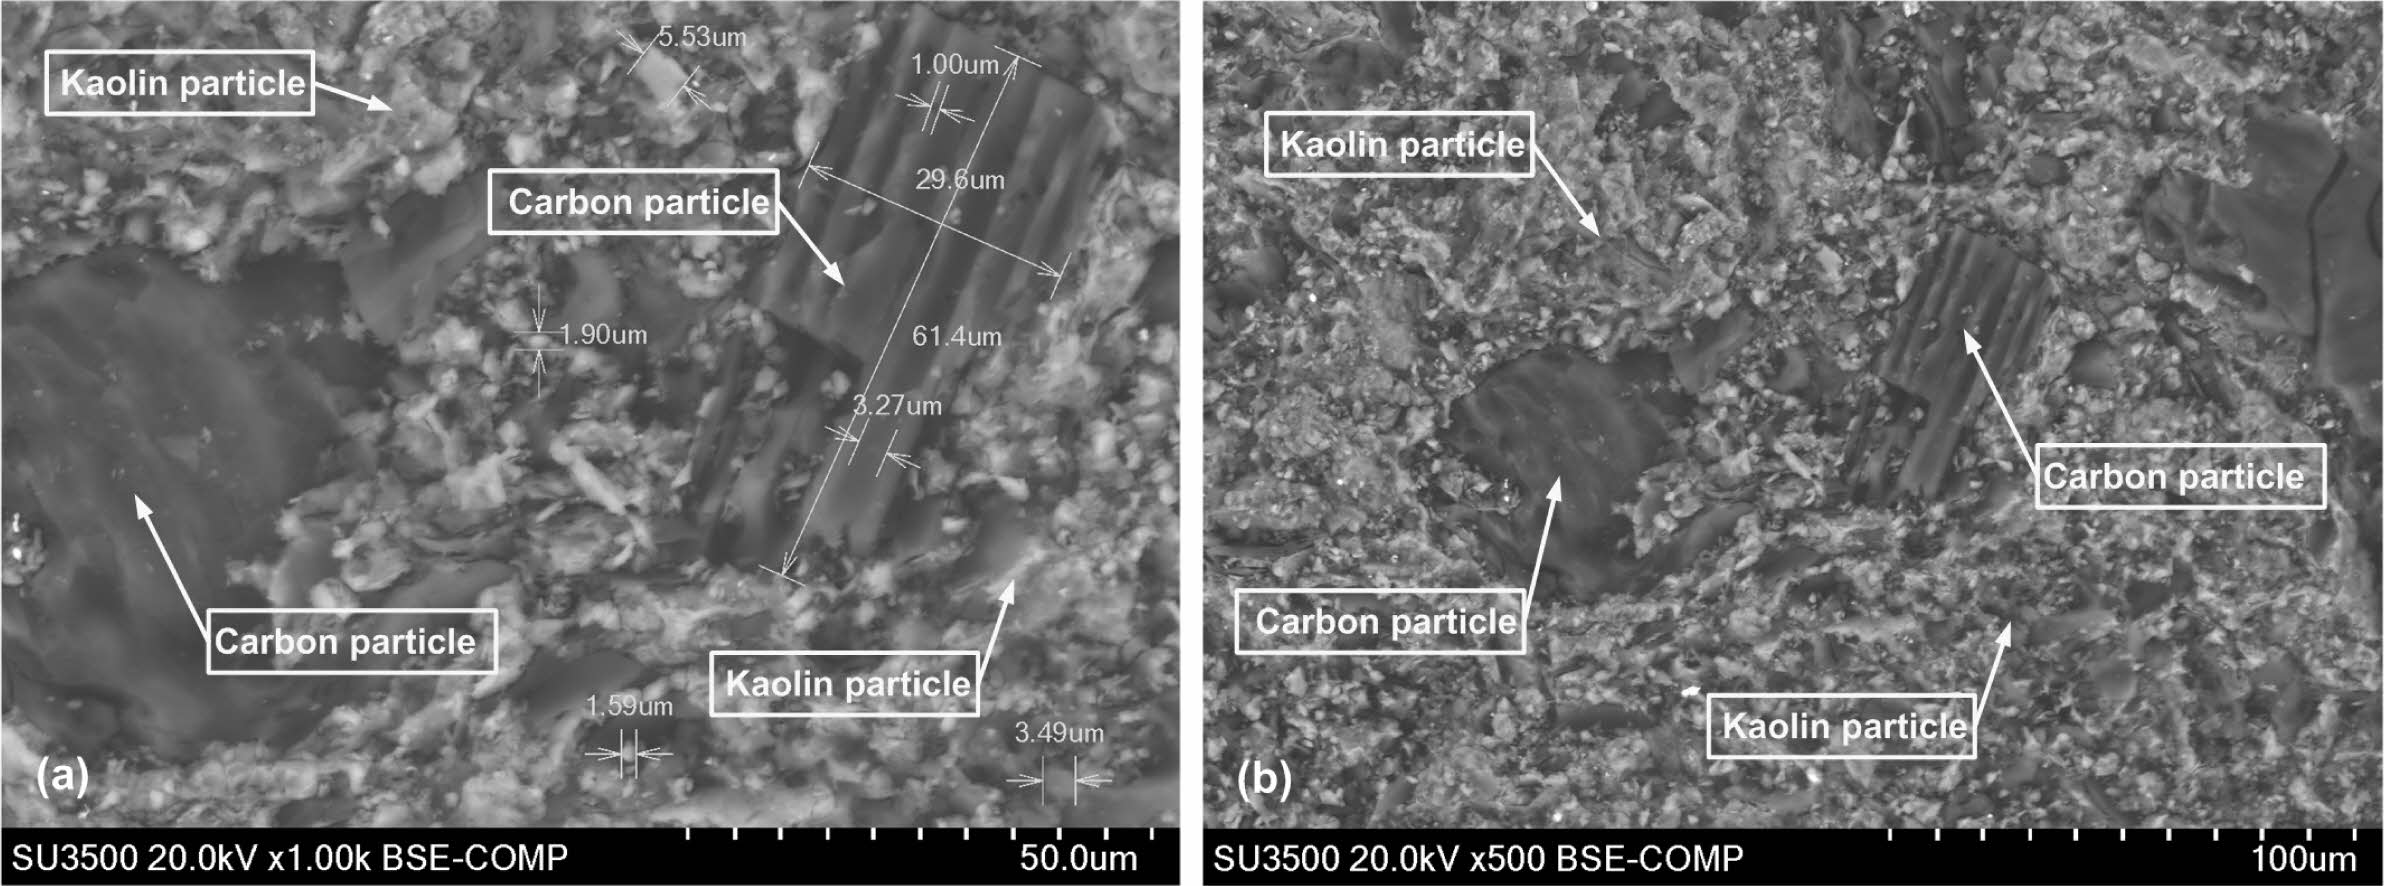
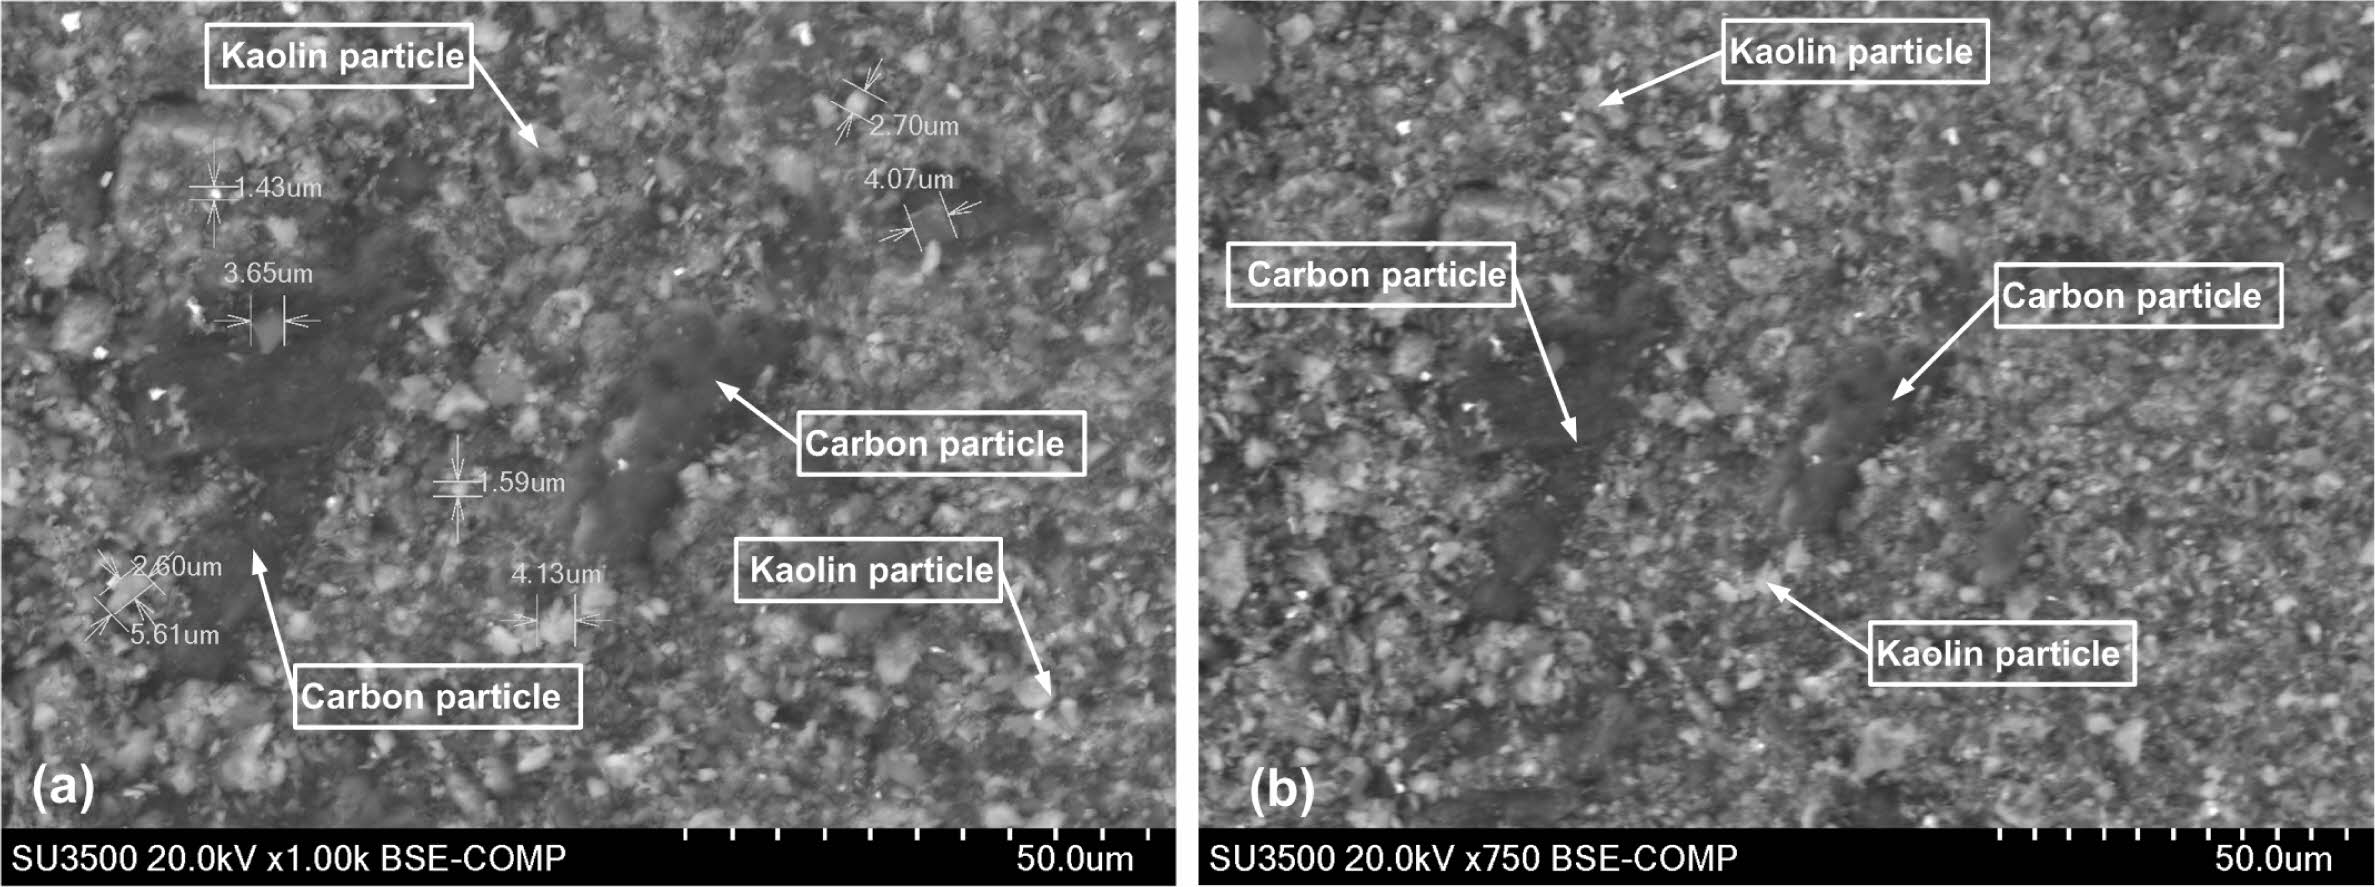
The black feature in the image is thought to be carbon, and the bright white feature is thought to be kaolin ceramic, as shown in Fig. 10(b). The size of carbon particles is generally 30 to 61 μm, as shown in Fig. 11(a). The carbon distribution that occurs in the kaolin-carbon composite is shown in Fig. 10(b) and Fig. 11(b). The 200-bar compaction technique in green compacts was not able to remove porous cavities from composites in the study. A kaolin-carbon composite with a relatively closer microstructure, with a relatively lower porosity is shown in Fig. 12. The composite is of a kaolin-carbon composition ratio of 70:30 %wt confirms at a lower percentage of porosity than other compositions. The volume of kaolin weight of the composite is greater than that of any other composition ratio. Particle size between 1.43-5.61 μm with a gray-white feature thought to be kaolin shown in Fig. 12(a).
Fig. 12(b) shows a closer microstructure and smaller cavities. This condition indicates that the composition ratio of 70:30 is denser than other compositions.
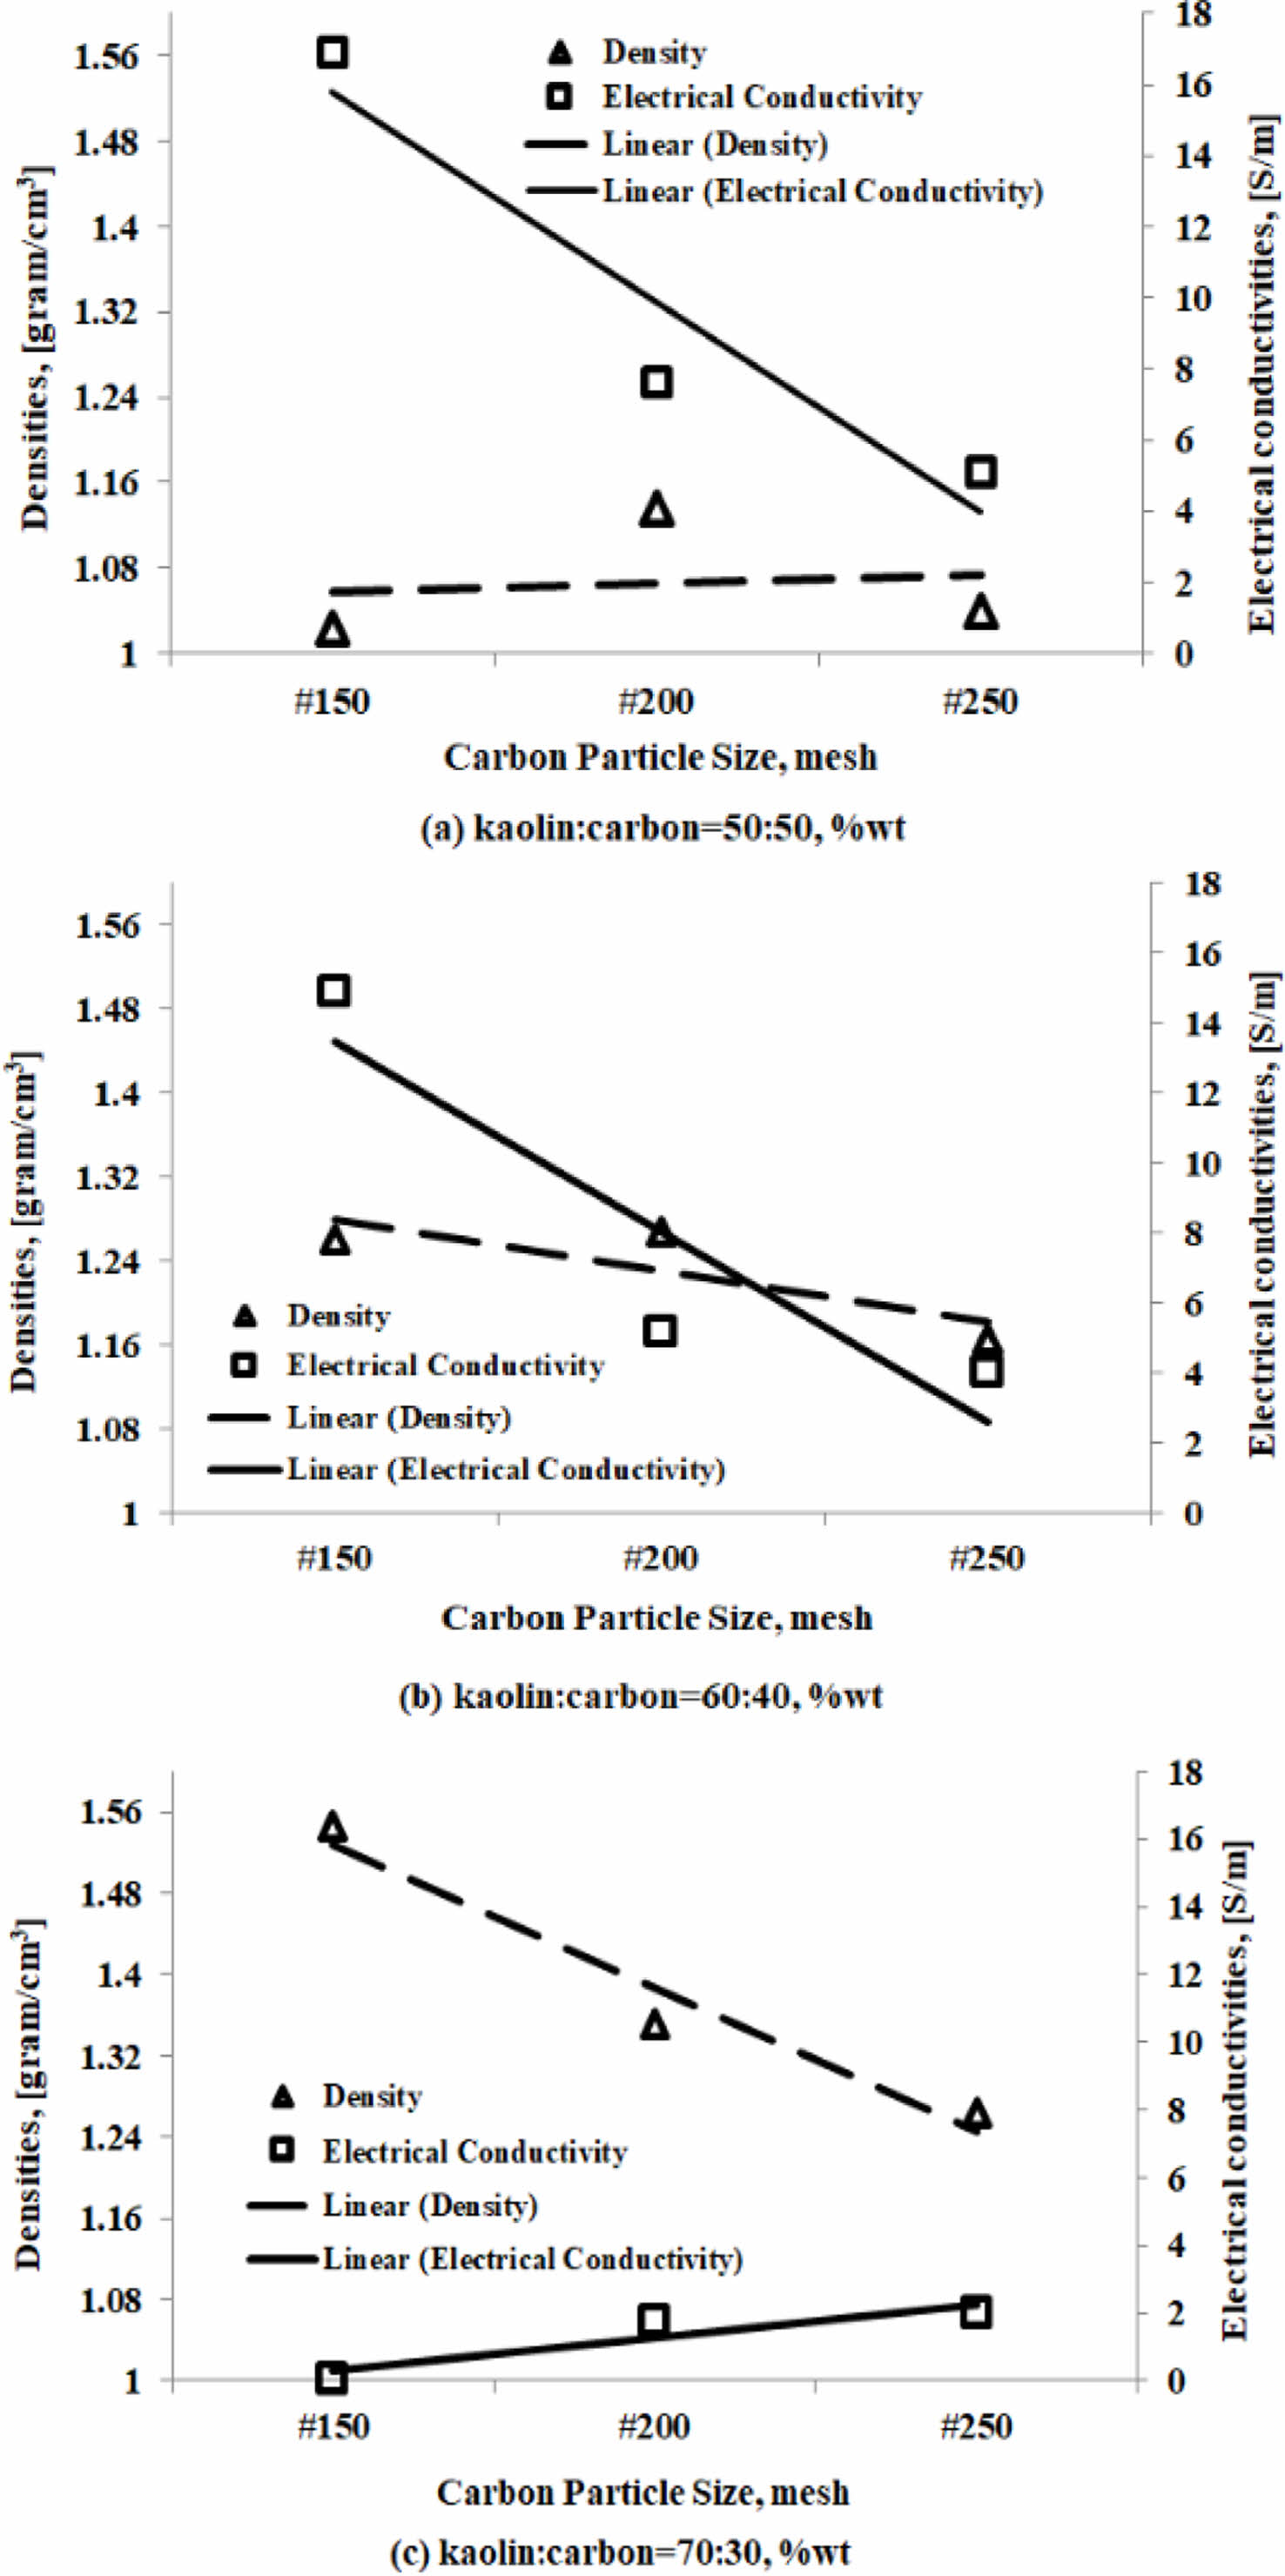
Relationship between density and electrical conductivity
The electrical conductivity properties are influenced by the density properties of these engineering materials. But in fact, the electrical conductivity properties of the materials in the study do not fully follow the tendency of their density properties. An increase or decrease in density value will not necessarily be followed by an increase or decrease in the value of electrical conductivity. The analysis will only show a tendency between the density properties and the electrical conductivity properties of the kaolin-carbon composite. As shown in Fig. 13(a), a kaolin-carbon composite with a composition ratio of 50:50 %wt. The smaller the size of carbon particles, the greater the composite density although not very sharp, but instead the electrical conductivity tends to decrease sharply.
The same fact is shown by the carbon kaolin composite with a composition ratio of 60:40 %wt.
The smaller the size of the carbon particles, the lower the density, at the same time followed by a decrease in electrical conductivity. This fact shows that the density of the kaolin-carbon composite affects electrical conductivity, as shown in Fig. 13(b). The sharp opposite occurs in kaolin-carbon composites with a composition ratio of 70:30 %wt. The smaller the size of the carbon particles the sharply lowers the density of the composite, but conversely the electrical conductivity of the composite also increases sharply. The fact is thought to be caused by a good bond between carbon particles, so it conducts an electric current well, but at the same time many cavities are formed, thus lowering the density of this material. The main cause and effect of this kaolin-carbon composite engineering material is at the level of density and porosity, so it can significantly affect the mechanical, and electrical properties. The sample fabrication process that affects density and porosity is at the time of mixing, compaction, and sintering pyrolysis. The compaction process with a pressure of 200 bars can not eliminate the water content used when the formation of plasticity properties of the green compact. Furthermore, when the process of sintering pyrolysis the water content evaporates and leaves porous cavities in the composite.
|
Fig. 3 Densities of kaolin-carbon composite. |
|
Fig. 4 Porosities of kaolin-carbon composite. |

|
Fig. 5 Current-voltage of kaolin-carbon composite. |
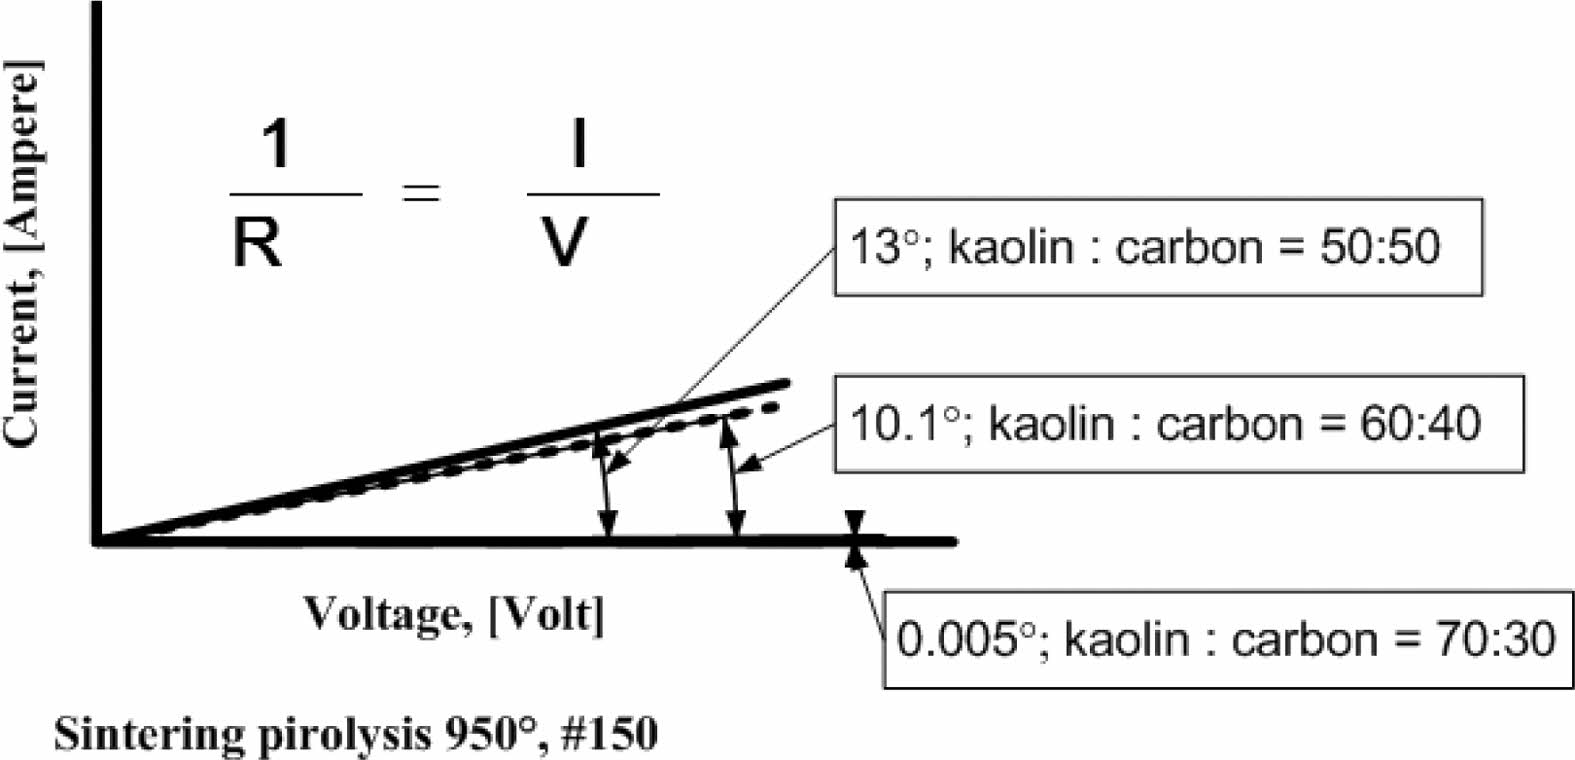
|
Fig. 6 Directions of 1/R of kaolin-carbon composite. |
|
Fig. 7 Effect of carbon particle size on current. |
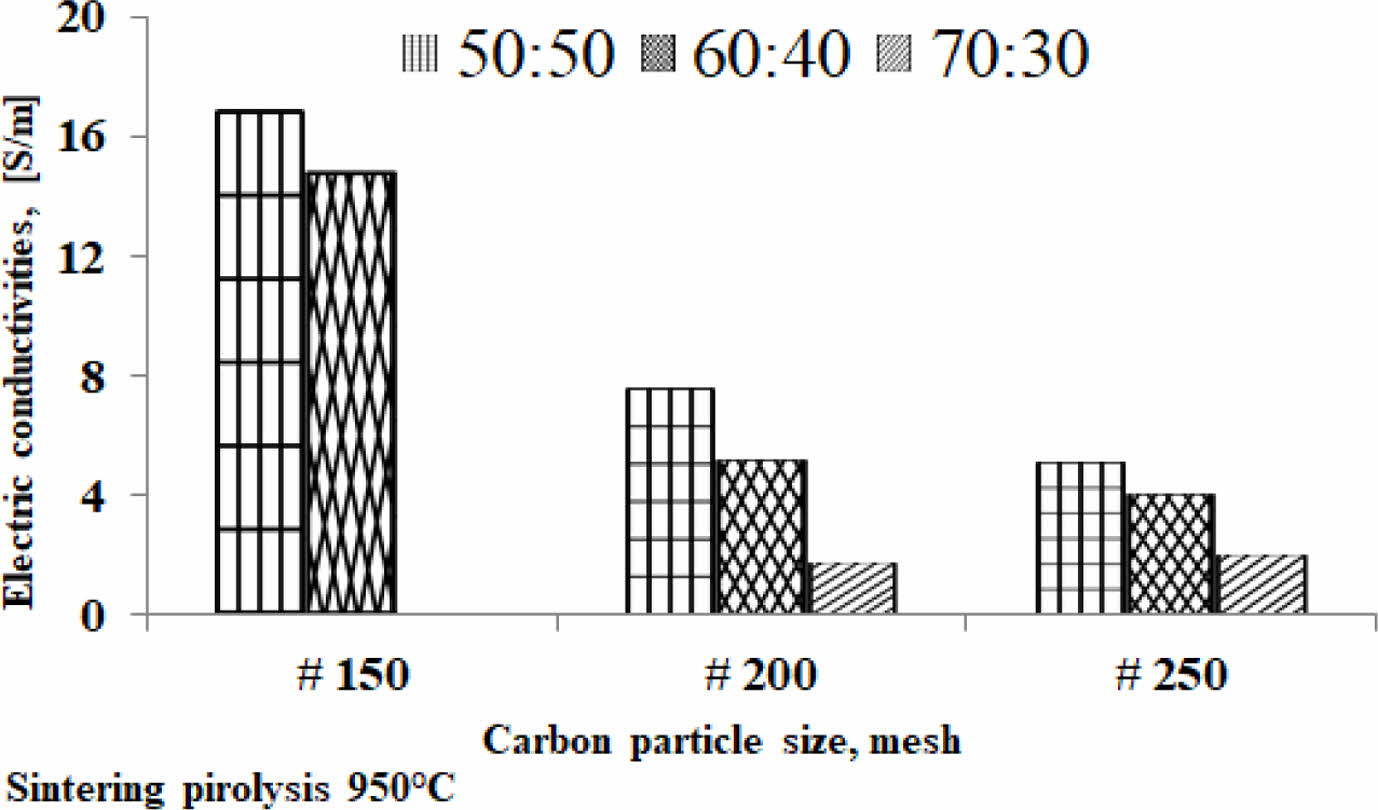
|
Fig. 8 The relationship of electric conductivity and carbon particle size. |
|
Fig. 9 Elements of kaolin-carbon compsite. |
|
Fig. 10 Microstructure of KCC, composition ratio of 50:50, sintering pyrolysis 950 °C |
|
Fig. 11 Microstructure of KCC, composition ratio of 60:40, sintering pyrolysis 950 °C. |
|
Fig. 12 Microstructure of KCC, composition ratio of 70:30, sintering pyrolysis 950 °C. |
|
Fig. 13 Densities vs. electrica conductivities of KCC. |
The size of the carbon particles is getting smaller, the lower the density. The higher the kaolin content the higher the density produced. The smaller the size of the carbon particles, the higher the percentage of porosity, the fact occurs in all composition ratios. But the higher the kaolin content, the smaller the percentage of porosity content. The larger the size of the carbon particles produces a high current delivery, especially at a composition ratio of 50:50 %wt, and 60:40 %wt. Instead, the smaller the size of the carbon mesh particle of 200, and 250 delivers a low current. The composition ratio of 70:30 %wt does not show significant current delivery. The electrical conductivity of the kaolin-carbon composites in the study did not fully follow their density tendencies. A kaolin-carbon composite with a ratio of 50:50 %wt indicates that the smaller the size of the carbon particles, the higher the density of the composite, although not very sharp. But instead, electrical conductivity tends to decline sharply. Meanwhile, composites with a composition ratio of 60:40 %wt showed the same trend between density and electrical conductivity. The smaller the size of the carbon particles the lower the density and electrical conductivity.
DIPA Politeknik Negeri Jakarta, The College's Flagship Research Scheme has funded this research, Contract Number: Number: l69/PL3.18/SPK/2020, dated July 7, 2020. The author thanked UP2M, Politeknik Negeri Jakarta.
The authors acknowledge the facilities, scientific and technical support from Advanced Characterization Laboratories Serpong, National Research and Innovation Agency (BRIN).
- 1. M. Kubliha, V. Trnovcová, J. Ondruška, I. Štubňa, O. Bošák and T. Kaljuvee, Appl. Clay Sci. 149 (2017) 8-12.
-

- 2. D.O. Obada, D. Dodoo-Arhin, M. Dauda, F.O. Anafi, A.S. Ahmed and O.A. Ajayi, Appl. Clay Sci. 150 (2017) 175-183.
-
- 3. R. Kumar and P. Bhargava, J. Asian Ceram. Soc. 5 (2017) 304-312.
-
- 4. H. Katsuki, S. Hirata, M. Inada, C.-S. Choi, J.-H. Park, J.-H. Lee, U.-S. Kim, K.-S. Han, J.-H. Kim, W.-S. Cho and K.-T. Hwang, J. Asian Ceram. Soc. 8 (2020) 492-501.
-
- 5. J.-Y. Kim and K.-T. Hwang, J. Korean Ceram. Soc. 56 (2019) 566-576.
-
- 6. H.I. Riyap, C.N. Bewa, C. Banenzoué, H.K. Tchakouté, C.H. Rüscher, E. Kamseu, M.C. Bignozzi and C. Leonelli, J. Asian Ceram. Soc. 7 (2019) 199-212.
-
- 7. V. Mymrin, C.F.G. Santos, K. Alekseev, M.A. Avanci, M.A. Kreusch, Ti. Borga, O. Graupmann, F.L. Cavalin, R.A. Monteiro and V.A. Ruy, Appl. Clay Sci. 155 (2018) 95-102.
-
- 8. J. Ondruška, Š. Csáki, V. Trnovcová, I. Štubňa, F. Lukáč, J. Pokorný, L. Vozár and P. Dobroň, Appl. Clay Sci. 154 (2018) 36-42.
-
- 9. K.A. Jaradat, Z. Darbari, M. Elbakhshwan, S.L. Abdelaziz, S.K. Gill, E. Dooryhee and L.E. Ecker, Appl. Clay Sci. 150 (2017) 163-174.
-
- 10. A. Kriaa, M. Hajji, F. Jamoussi and A.H. Hamzaoui, Surf. Eng. Appl. Electrochem. 50 (2014) 84-94.
-
- 11. S.B. Rekik, S. Gassara, J. Bouaziz, A. Deratani and S. Baklouti, Appl. Clay Sci. 143 (2017) 1-9.
-
- 12. A. Yaya, E.K. Tiburu, M.E. Vickers, J.K. Efavi, B. Onwona-Agyeman and K.M. Knowles, Appl. Clay Sci. 150 (2017) 125-130.
-
- 13. H.P.A. Alves, J.B. Silva, L.F.A. Campos, S.M. Torres, R.P.S. Dutra and D.A. Macedo, Ceram. Int. 42 (2016) 19086-19090.
-
- 14. S. Boussen, D. Sghaier, F. Chaabani, B. Jamoussi and A. Bennour, Appl. Clay Sci. 123 (2016) 210-221.
-
- 15. Z. Hou, B. Cui, L. Liu and Q. Liu, Ceram. Int. 42 (2016) 17254-17258.
-
- 16. S.K. Hubadillah, Z. Harun, M.H.D. Othman, A.F. Ismail and P. Gani, J. Asian Ceram. Soc. 4 (2016) 164-177.
-
- 17. A.E. Pramono, R.S. Mulyono, R.G. Sudarmawan, M.Z. Nura, H. Rahman and N. Indayaningsih, J. Ceram. Process. Res. 21 (2020) 465-478.
-
- 18. N. Belmokhtar, H. El Ayadi, M. Ammari and L.B. Allal, Appl. Clay Sci. 162 (2018) 1-9.
-
- 19. A. Mocciaroa, M.B. Lombardia and A.N. Scian, Appl. Clay Sci. 153 (2018) 90-94.
-
- 20. L. Basnayaka, N. Subasinghe and B. Albijanic, Appl. Clay Sci. 156 (2018) 45-52.
-
- 21. M.M. Bazin, N. Ahmad and Y. Nakamura, J. Asian Ceram. Soc. 7 (2019) 417-425.
-
- 22. E. Karamanova, G. Avdeev and A. Karamanov, J. Eur. Ceram. Soc. 31 (2011) 989-998.
-
- 23. H.P.S. Abdul Khalil, M. Jawaid, P. Firoozian, M. Amjad, E. Zainudin and M.T. Paridah, Int. J. Polym. Anal. Charact. 18 (2013) 329-338.
-
- 24. H. An, D. Shin, and H.-I. Ji, J. Korean Ceram. Soc. 56 (2019) 91-97.
-
- 25. Y.L. Kim, J. Korean Ceram. Soc. 54 (2017) 66-69.
-
- 26. L.M. Manocha, G. Prasad and S. Manocha, Mech. Adv. Mater. Struct. 21 (2014) 172-180.
-
- 27. D.O. Obada, D. Dodoo-Arhin, M. Dauda, F.O. Anafi, A.S. Ahmed and O.A. Ajayi, Appl. Clay Sci. 132-133 (2016) 194-204.
-
 This Article
-
2022; 23(5): 638-646
Published on Oct 31, 2022
- 10.36410/jcpr.2022.23.5.638
- Received on Mar 3, 2022
- Revised on Apr 5, 2022
- Accepted on Apr 9, 2022
Services
- Abstract
introduction
experiments
results and discussion
conclusion
- Acknowledgements
- References
- Full Text PDF
Shared
Correspondence to
- Agus Edy Pramono
-
Department of Mechanical Engineering, Politeknik Negeri Jakarta, Jln. Prof. Dr. G.A. Siwabessy, Kampus UI. Depok 16425, Jawa-Barat, Indonesia
Tel : +62-217863530 Fax: +62-217863530 - E-mail: agus.edypramono@mesin.pnj.ac.id
Clean-Energy Research Institute(CRI), Hanyang University, 222, Wangsimni-ro, Seongdong-gu, Seoul, 04763, Korea
E-mail: jcpr@hanyang.ac.kr