


- Seismic performance test and numerical simulation of prefabricated hydrophobic rock wool board-filled shear wall
Yan Lia,b, Dao-heng Yingb, Wen-yang Dongc,*, Song Zhub and Xu Huangb
aThe Research Centre of Green Architecture Technology in Cold Area, Jilin Jianzhu University, Changchun, China
bSchool of Civil Engineering, Jilin Jianzhu University, Changchun, Jilin Province, China
cComputer Science and Technology Engineering Centerpartment, The 964th Hospital, Changchun, Jilin Province, ChinaThis article is an open access article distributed under the terms of the Creative Commons Attribution Non-Commercial License (http://creativecommons.org/licenses/by-nc/4.0) which permits unrestricted non-commercial use, distribution, and reproduction in any medium, provided the original work is properly cited.
In view of the prefabricated shear wall structure, this paper puts forward a prefabricated integrated shear wall structure in which the concrete filled wall with hydrophobic rock wool board partition is poured, produced and installed together with the solid wall limb. Based on the quasi-static test of four concrete double-leg shear walls with the same size, wall limb and reinforcement of coupling beam, the seismic performance of shear walls without filled and integrated whole filled is explored, and the characteristics of failure form, bearing and deformation capacity, stiffness, ductility and energy dissipation capacity of the walls are summarized. The experimental results show that the flexural shear failure occurs in the prefabricated integrated shear wall under horizontal reciprocating load. Compared with the unfilled wall component, the lateral stiffness and shear bearing capacity are obviously improved, and the seismic performance is better at the same time. Based on the ABAQUS analysis software, the quasi-static test results are analyzed by numerical simulation and the hysteresis curve with good agreement is obtained. According to the test results and the numerical simulation, a reasonable filled wall structure scheme for precast integrated concrete shear wall structure is put forward
Keywords: Fabricated shear wall, Filled wall, Pseudo-static test, Numerical simulation, Seismic performance
Prefabricated concrete structure is an important part of residential industrialization, prefabricated building assembles prefabricated components in the construction site, compared with cast-in-place reinforced concrete structure, it has the advantages of short construction period, small environmental pollution, low climate limitation and saving labor force, which can promote the sustainable development of the construction industry [1].
With the gradual development of building indus- trialization, prefabricated integral shear wall structure gradually shows good adaptability [2]. Compared with prefabricated frame structure, prefabricated shear wall has large lateral stiffness, small lateral displacement good shear resistance and bearing capacity under horizontal force [3,4]. In recent decades, a large number of experimental studies on seismic performance of prefabricated shear wall structures have been carried out [5,6]. Among them, Hu Wenbo et al. [7] conducted an experimental study on the seismic performance of precast integrated reinforced concrete shear wall and proposed a reasonable filling wall construction scheme for precast integrated concrete shear wall structure.Han Wenlong et al. [8] proposed a precast hollow slab shear wall and conducted an experimental study on its seismic performance, providing reference for the seismic design of precast hollow slab shear wall. Hong-nan Li et al. [9] conducted experimental and numerical studies on the seismic performance of two new hybrid precast concrete shear walls, and the experimental and numerical results show that the new hybrid precast concrete shear wall has good seismic performance.In addition, the prefabricated shear wall structure, prefabricated circular hole plate shear wall and double-sided superimposed shear wall, which is connected by pulp-anchor connection, steel sleeve extrusion connection, bolt connection, prestressed connection and steel connection, has also been studied and applied to some extent.The related studies show that, when the filled wall is properly added to the prefabricated shear wall, the reinforced component has strong ductility, the bearing capacity is improved, and the seismic performance is good [10]. Therefore, it has important engineering application value to study the seismic performance of filled wall in prefabricated shear wall [11-13].
In the prefabricated concrete shear wall structure project, the requirements for the lateral stiffness of each part of the prefabricated shear wall are different. During the design and production, holes will be reserved in the interior, and light blocks will be used for filling after the main construction, which increases the construction procedure of the prefabricated structure [14-16]. Accordingly, in order to optimize the stiffness of the prefabricated shear wall, enhance the anti-seismic deformation coordination ability and improve the energy dissipation capacity of the structure, this paper designs an integrated prefabricated structure scheme between the filled wall and the shear wall with connected beam [17]. By the quasi-static test of shear wall component, the seismic performance of the wall and the difference between the wall and the two-leg shear wall without filled wall are verified, and the numerical simulation of the test is carried out by using the ABAQUS, and the reasonable construction scheme of the filled wall is given [18,19].
Component design and fabrication
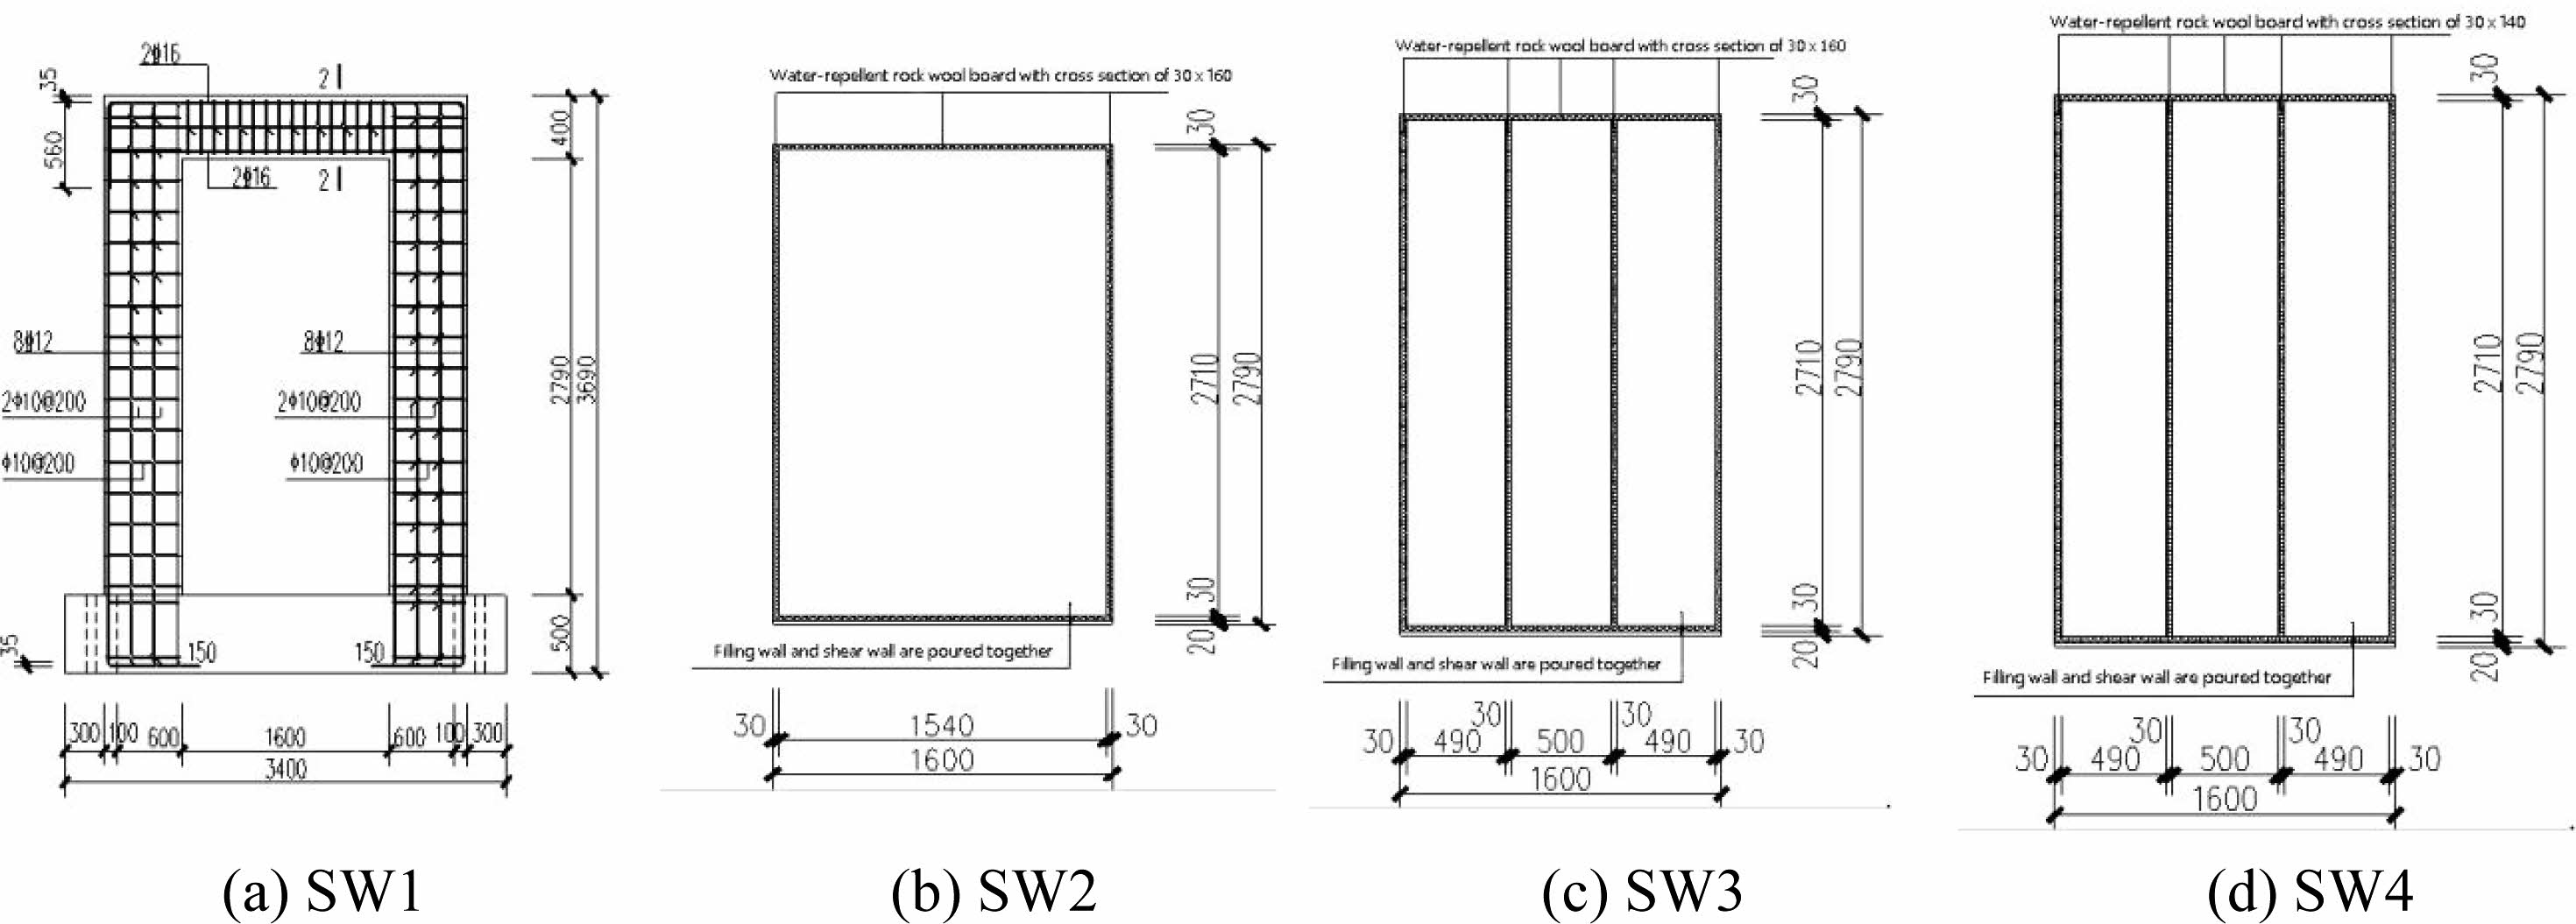
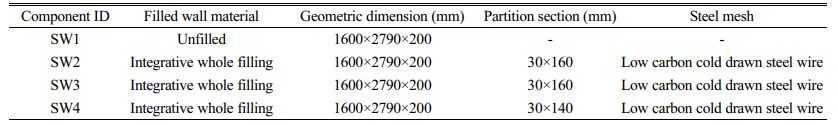
In the text, four components with the same shape size and reinforcement form of the wall limbs were designed. The outer wall dimensions of the four components are 2800 mm×3190 mm×200 mm, the geometric dimension of the filled wall hole is 2790 mm×1600 mm×200 mm, the filled wall portion is cast together with the wall limbs, low-carbon cold drawn steel wire mesh with a diameter of 4 mm is placed on both sides of the filled wall with a spacing of 200 mm. The main design parameters of the component are shown in Table 1, component SW1 is hollow coupling beam shear wall, the component SW2 is partitioned by hydrophobic rock wool board with a width of 30 mm and a thickness of 160 mm on the four sides of the filled wall. Component SW3 is provided with a hydrophobic rock wool board partition with a partition section size of 30 mm×160 mm around and in the middle of the filled wall. A hydrophobic rock wool board partition with a partition section dimension of 30 mm×140 mm is set in the component SW4 at the same position as the filled wall of the component SW3. The axial compression ratio of the above components is 0.2. The connection between the wall and the bottom beam adopts constrained grout-anchored steel bar lap connection, this method is easy to construct, economical and anchored firmly. The geometric dimensions and reinforcement of the components are shown in Fig. 1.
Material properties
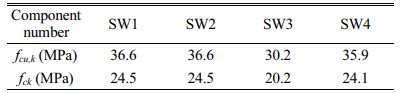
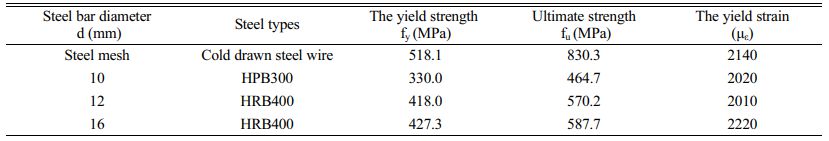
The C30 strength concrete is used in the test. The concrete cube test block with a side length of 100 mm is made when the component is poured. The compressive strength of the concrete cube is carried out before the test. The average compressive strength of the concrete cube is shown in Table 2, and the mechanical properties of reinforcing bars are shown in Table 3.
Test device and loading system
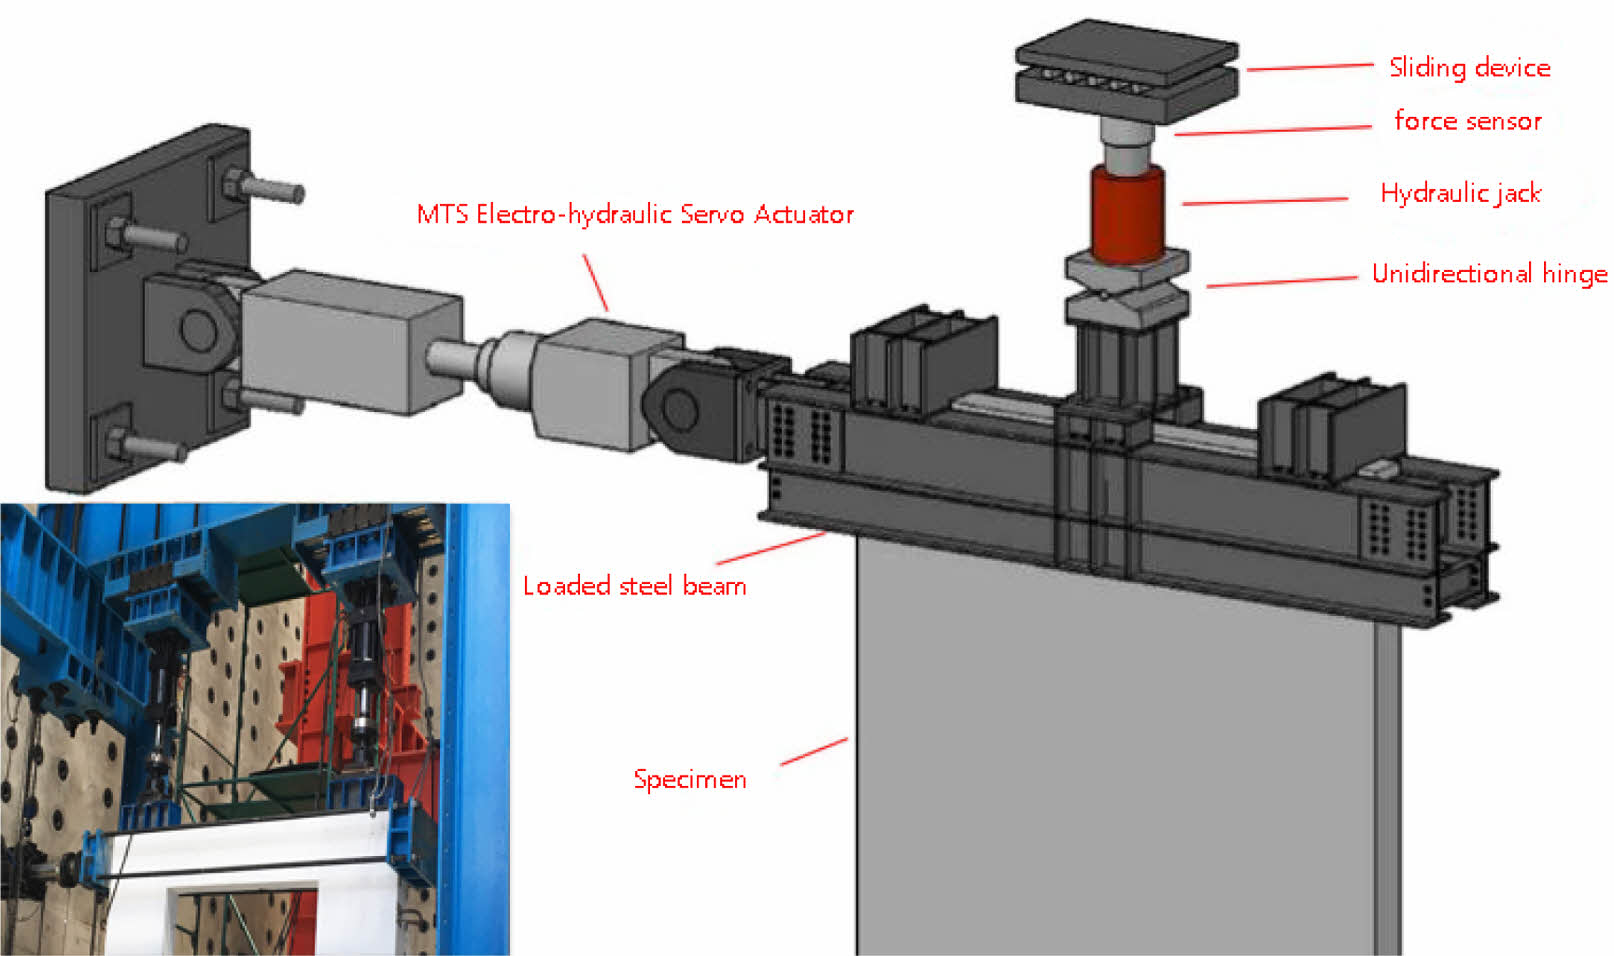
The test adopts 100t MTS electro-hydraulic servo actuator, and the four components were subjected to low cycle loading. The loading device is shown in Fig. 2.
The constant vertical load controlled by axial com- pression ratio of 0.2 is first applied in the test loading. The horizontal load adopts the force loading mode before the wall enters the yield, and each stage increases by 10%. When the structure yields, reciprocating displacement control is adopted, incremental yield displacement is taken, and each stage is cycled twice. When the horizontal load is reduced to close to 85% of the maximum bearing capacity of the test, it is considered whether to continue loading according to the failure of key parts. If the failure is serious, the loading will be stopped.
|
Fig. 1 Structural form and reinforcement size detail. |
|
Fig. 2 Loading device. |
Destruction phenomenon
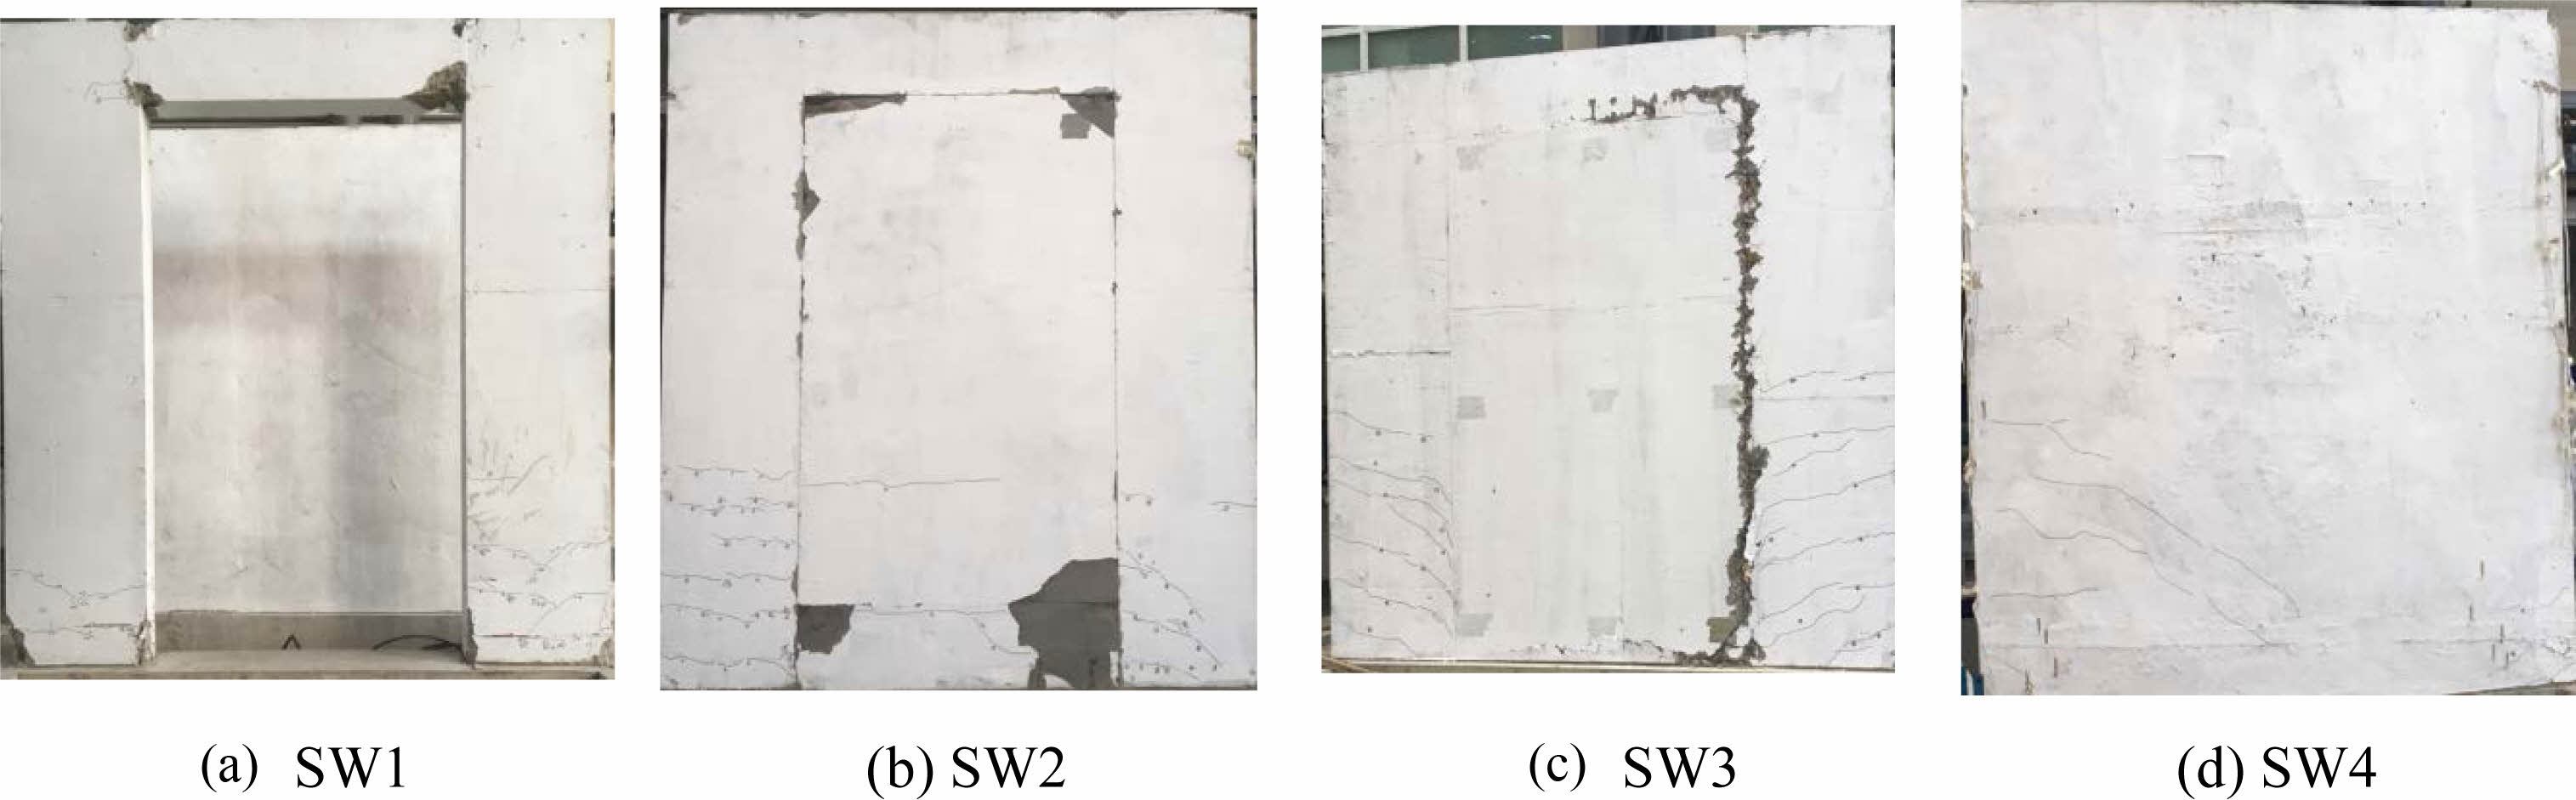
The failure modes of each specimen after the test are shown in Fig. 3. Different failure phenomena and characteristics of various walls are shown.
Unfilled shear wall
During the test of component SW1 without filled wall, firstly, it appears horizontal cracks at the lower part of the wall limb and vertical cracks at the end of the connecting beam; As the load continues to increase, the crack area expands, the cracks increase and extend into the wall limb. Finally, the concrete at the bottom of the wall limb peels off obviously, the steel bars are exposed, and the end of the beam is also damaged obviously. And the failure shape of the component SW1 shows obvious bending failure characteristics.
Prefabricated integrated shear walls
The destruction phenomena of Integrated shear walls components SW2, SW3, SW4 are similar. In the process of loading, the load increases rapidly, first horizontal cracks appear in the lower part of the wall limb on both sides, then diagonal cracks begin to appear in the middle of the wall, which are mainly concentrated at the bottom of the wall limb and around the connection between the wall limb and the coupling beam, and gradually extend in the diagonal upward direction. With the increase of horizontal displacement, diagonal cracks begin to appear at the joint of the wall limb and the coupling beam. There are also many short diagonal cracks along the partition at the partition position of the hydrophobic rock wool board set in the middle part of the component SW3 and SW4. Finally, the failure of the component is mainly caused by horizontal cracks of both sides of the wall limb and long diagonal cracks in the filled wall area. Compared with the component SW2, the filled walls of the component SW3 and SW4 increase the vertical hydrophobic rock wool board partition measure in the middle part, further weaken the overall stiffness of the shear wall, the partition part shares more plastic displacement, the maximum plastic deformation is lower than the component SW2.
Hysteresis curve
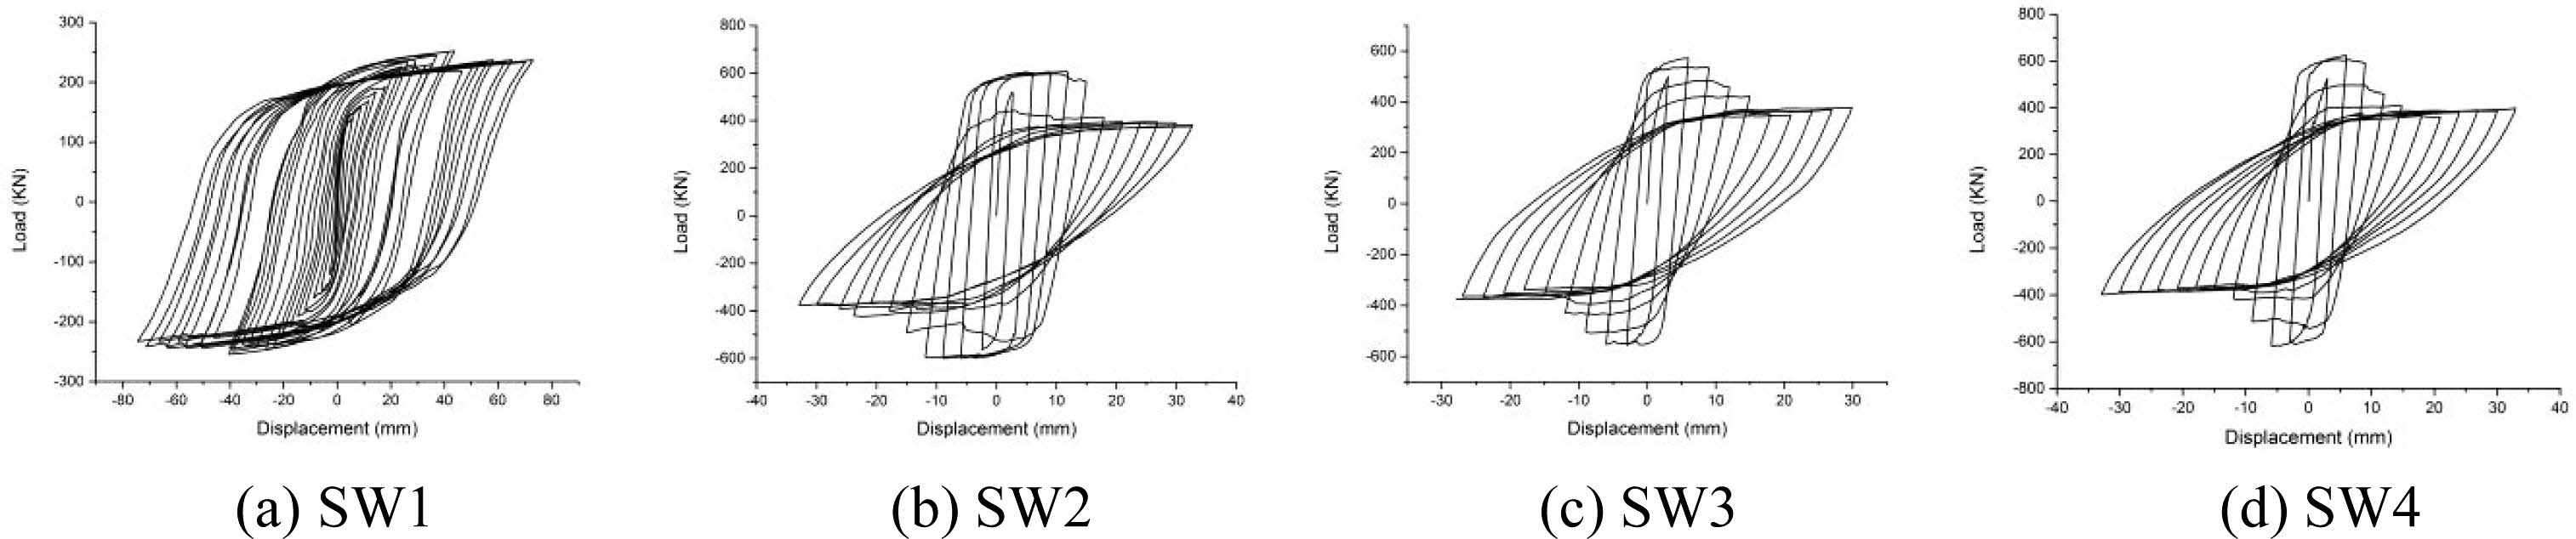
Fig. 4 shows the wall end load-displacement hysteresis curves of each component. The comparison of hysteresis curves shows that:
Bearing capacity of the component SW1 without filled wall is low and the growth rate is slow, the slope of the curve in the descending section is lower, and the ultimate displacement in the horizontal direction is larger. The component SW3 shows obvious difference, in the early stage of loading, the lifting speed of the load is significantly higher than that of the member SW1, the bearing capacity difference is large, but the yield time is earlier, and the ultimate displacement is relatively small. The reason is that the filled wall and shear wall limb are integrated in pouring, which has good integrity, the stiffness of the bottom of the coupling beam shear wall is enhanced, the filled wall acts as a diagonal support for the wall limb, and the yield position moves upward. Play the role of resisting bending moment together.
The curve shape of component SW2, SW3 and SW4 is similar, the peak load of SW2 and SW4 is close. The energy dissipation capacity of component SW3 is stronger than the component SW2, and because the thickness of the rock wool board in the partition area is reduced for the component SW4, the damping effect is reduced, and the energy dissipation capacity is lower than that of the component SW3. The decline section of the component SW3 appears later, and the stiffness degradation is slightly slower, indicating that the deformation ability is stronger. Hysteresis curve of the component SW3 is full and energy dissipation capacity is strong.
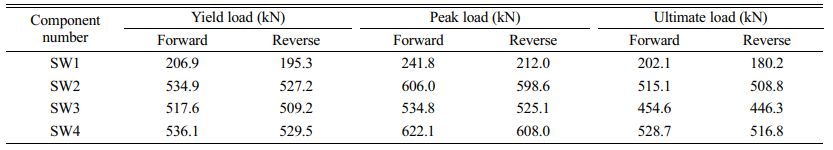
Bearing capacity
The load values corresponding to each stage of loading are shown in Table 4. The load-bearing capacity of the integrated prefabricated component of the filled wall and the coupling beam shear wall at each load stage is significantly improved than that of the ordinary coupling beam shear wall, and the yield load of the component SW2, SW3 and SW4 is close. Since the structural measures of the filled wall of the component SW3 effectively weaken the overall stiffness of the shear wall and the peak bearing capacity of the wall has decreased, the peak bearing capacity of the component SW3 is 12% lower than that of the component SW2. Due to the decrease in the thickness of the rock wool board of the component SW4, its peak bearing capacity is increased by 16% compared with the component SW3.
Stiffness degradation
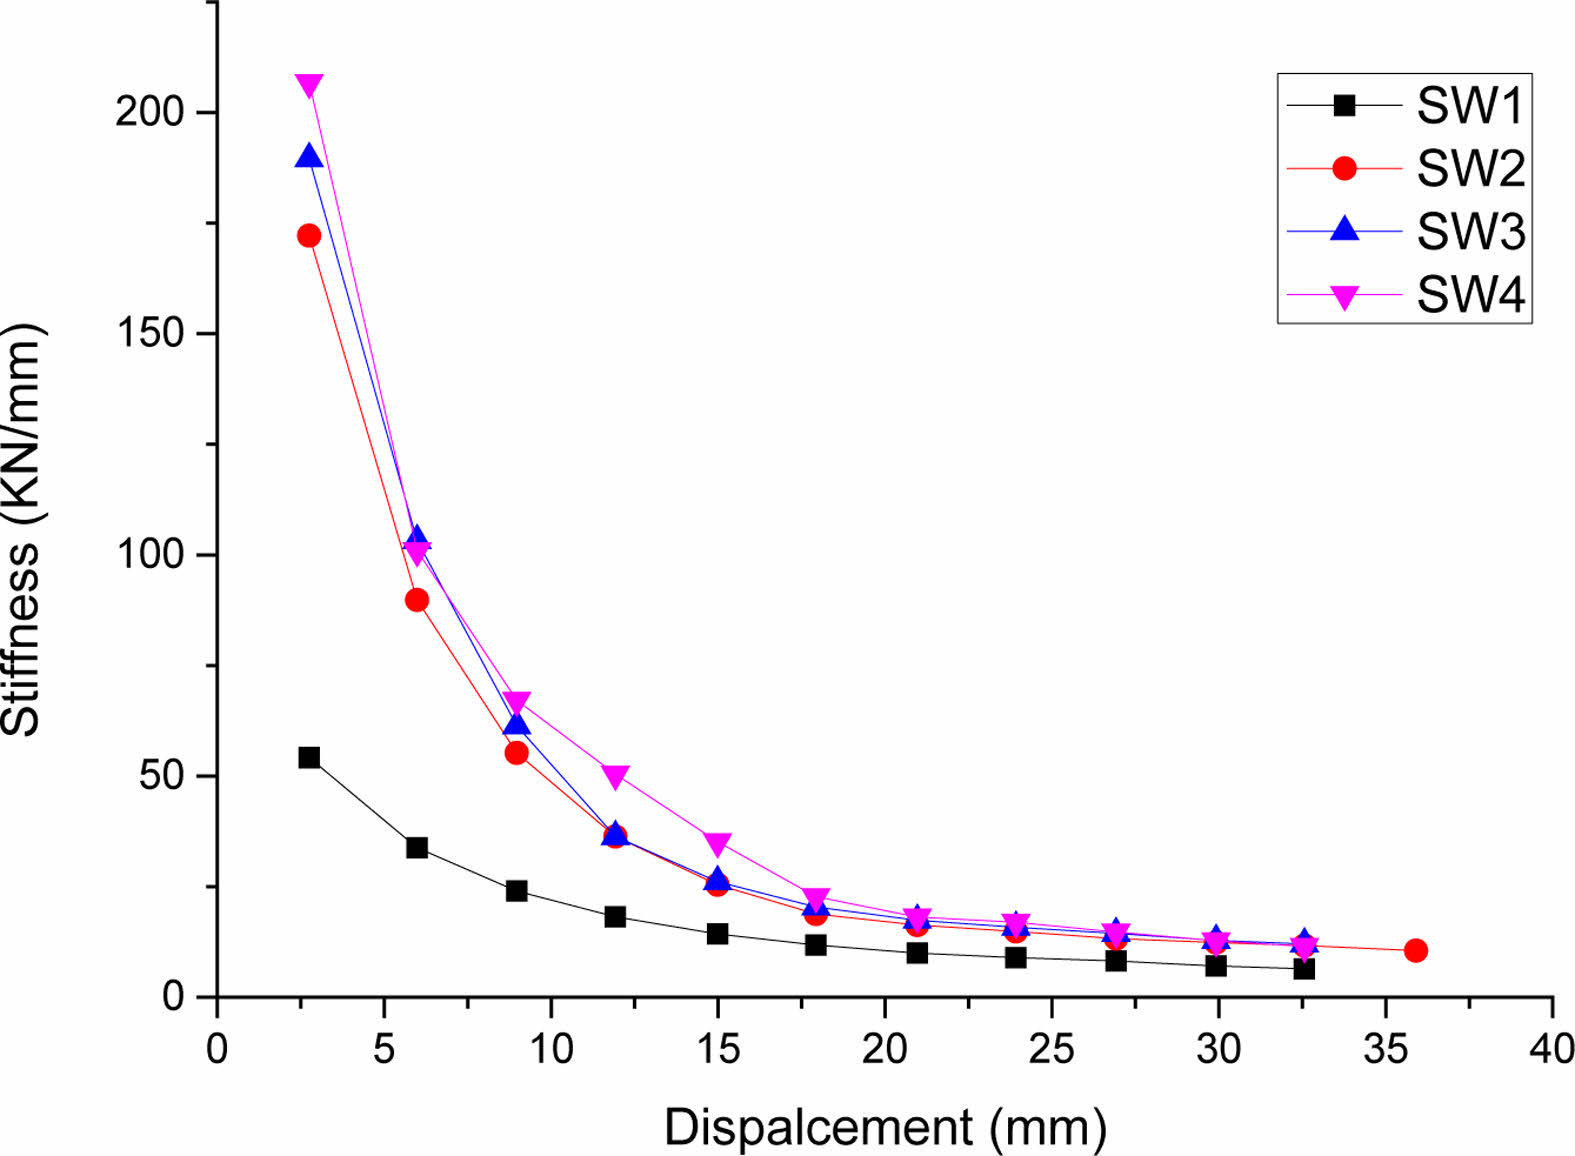
The secant stiffness is calculated according to formula (1):
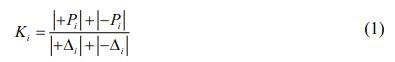
In the formula: Ki is the secant stiffness in the ith loading cycle, Pi is the peak load in the ith loading cycle, Δi is the displacement corresponding to the load peak point in the ith loading cycle.
The stiffness degradation curve of the components is shown in Fig. 5. From the curve in the Fig. 5, it can be seen that the early stiffness of the component degenerates quickly, while the initial stiffness of the component SW1 is obviously lower than that of other components with filled walls. The initial stiffness of the component SW2 and SW4 is close, the component SW3 is slightly lower than the component SW2 because of the increase of the rock wool partition position. The thickness of the rock wool board at the partition of the component SW4 is lower than that of the component SW3, and the stiffness weakening effect is slightly lower than that of the component SW3. Compared with the stiffness of the component SW2, the component SW3 and the component SW4 have only a small decrease.
Ductility
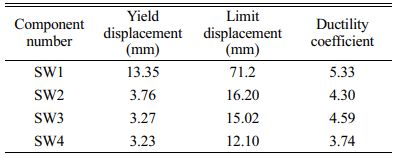
The displacement ductility coefficient is used to evaluate the ductility of the component. The displace- ment ductility coefficient is the ratio of the ultimate displacement of the component (the displacement when the load of the component drops to 85% of the peak load) and the yield displacement of the component. For each component, the displacement ductility coefficient is shown in Table 5: it can be seen from the Table 5 that the ultimate displacement of the component SW1 is the largest, the ductility coefficient is higher than that of other prefabricated components with built-in filled wall, and the deformation ability is strong. The ductility coefficient of the component SW3 is 6.7% higher than that of the component SW2 due to the increase of partition gap. The thickness of rock wool board in the partition part of the component SW4 filled wall is less than that of the component SW3, the effect of increasing stiffness is obvious, and the ductility coefficient is reduced by 18.5%. According to the above analysis, each shear wall component has certain deformation ability, and the effect of increasing the ductility of the structure is obvious by reducing the stiffness of the prefabricated shear wall.
Energy dissipation capacity
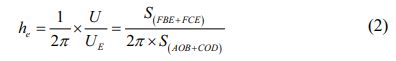
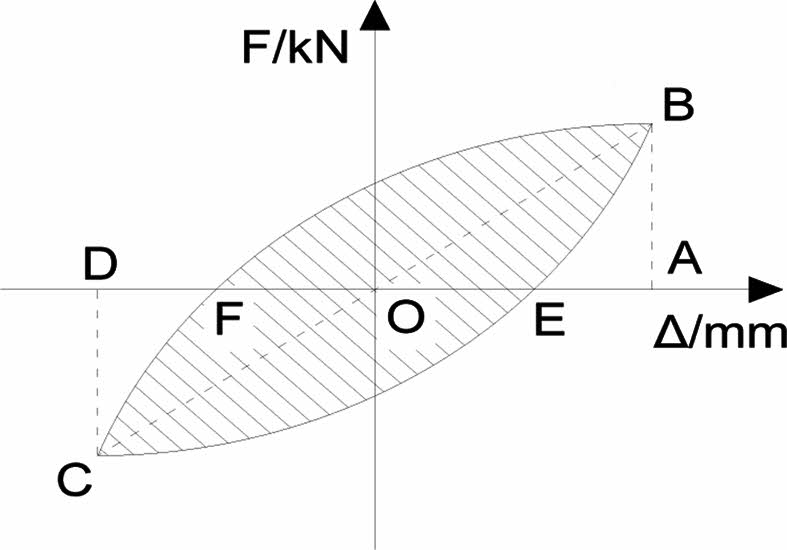
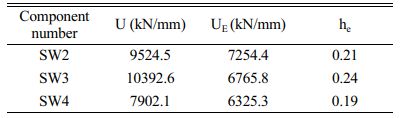
The components SW2, SW3, and SW4 designed in this paper are partitioned at the filled wall, and the energy dissipation capacity is improved by enhancing the deformation capacity of the structure. and the energy dissipation capacity of the structure can be reflected by the area surrounded by the hysteresis loop and the equivalent viscous damping coefficient. The calculation method of the equivalent viscous damping coefficient he is shown in Fig. 6, and the equivalent viscous damping coefficient is shown in Table 6:
In the formula: The U is the area surrounded by the hysteresis loop when the ultimate displacement is reached, the UE is nominal elastic potential energy.
The comparison of energy dissipation and equivalent viscous damping coefficient shows that due to the increase of vertical partition of the component SW3 the equivalent viscous damping coefficient increases by 14% compared with the component SW2, and the energy dissipation capacity is enhanced. The equivalent viscosity damping coefficient of the component SW4 is 21% lower than that of the component SW3 and energy dissipation capacity is reduced due to the decrease of rock wool board’s thickness. Equivalent viscous damping coefficient of the component SW3 is large, which indicates that the method of setting hydrophobic rock wool board partition obviously enhances the energy dissipation capacity of the component. When the components SW2, SW3 and SW4 reach the ultimate displacement, the energy consumption is 9.5 kJ, 10.3 kJ and 7.9 kJ respectively. The energy consumption of the component SW3 is obviously higher than that of other integrated shear wall components, and the seismic performance is strong [20].
The formula is:
|
Fig. 3 Finally failure shape. |
|
Fig. 4 Hysteresis curves of shear wall. |
|
Fig. 5 Comparison of stiffness degradation curve. |
|
Fig. 6 Diagram for equivalent viscous damping coefficient. |
In this paper, on the basis of taking into account the calculation accuracy and efficiency, combined with the software ABAQUS, the numerical simulation of the pseudo-static test of 4 components is carried out [21].
Model establishment
The concrete element mesh type is set to C3D8R type and the reinforcement element is set to T3D2 type in the process of numerical simulation. Interaction between loading beam and wall is set to ‘Tie’. Rigid connection between components, contact surface common to use the unified node, and the same degree of freedom. Through ‘Merge’, all the steel bars are merged into a steel skeleton, and the command ‘Embedded Region’ is adopted to build the steel skeleton into the concrete part.
The bottom surface of the bottom beam is completely fixed constraint mode, and the vertical axial pressure with axial compression ratio of 0.2 is applied to the structure. If the concentrated load is applied directly to the loading surface, the stress concentration phenomenon is easily caused. Therefore, the concentrated load is converted into equivalent uniform load and applied to the surface of the loading beam. A reference point is set on the side of the loading beam RP-1, the reference point is coupled with the side of the loading beam, and a reciprocating displacement load is applied to the reference point.
Constitutive model of materials
In this simulation, the constitutive relationship of concrete applies the plastic damage model [22,23], which can not only effectively analyze the stress of concrete structure under dynamic load and cyclic load, but also simulate the stiffness recovery of concrete structure under horizontal reciprocating load, it can better simulate the real stress state of concrete. The concrete structure model is calculated by the formula of stress-strain curve of material in the ‘Code for Design of Concrete Structures’ [24]. The expressions are as follows:
Tension:
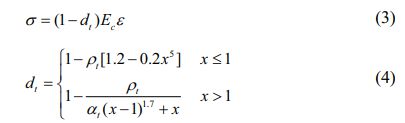
In the formula: σ is concrete stress, EC is elastic modulus, ε is concrete strain, αt is parameter of the descending section of the concrete uniaxial tensile stress-strain curve, ρt is the ratio between the representative value of concrete uniaxial tensile strength and the corresponding peak tensile strain; dt is the evolution parameter of uniaxial tensile damage.
Compression:
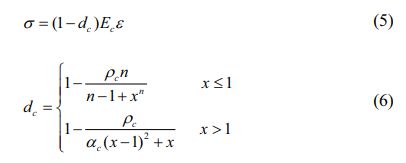
In the formula: The αc is the descending section parameter of the stress-strain curve of concrete under uniaxial compression, ρc is the ratio of the representative value of the uniaxial compressive strength of concrete and the corresponding peak compressive strain, n is the ratio of the difference between the peak compressive stress and its corresponding uniaxial compressive strength. dc is the evolution parameter of uniaxial compression damage.
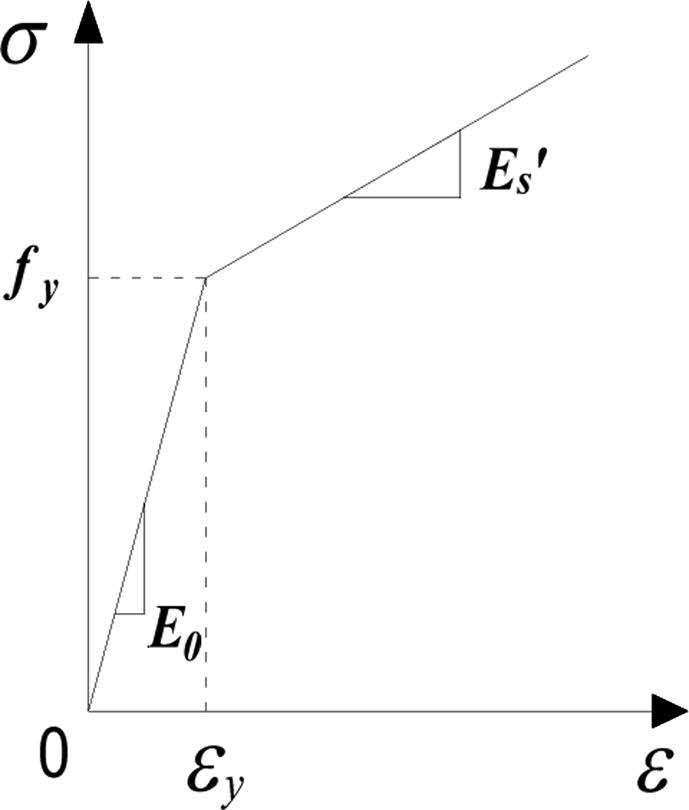
Fig. 7 shows the two-fold line model used in the constitutive relationship of steel bar in this simulation. A diagonal straight section of the stress-strain curve appears after the yield of the steel bar, including the Bauschinger effect, and the isotropic hardening mode is applied.
Material parameters: The concrete strength is C30, the density is 2400 kg/m3, the Poisson's ratio is 0.2, the elastic modulus is 2.96×10¹⁰ N/m2, the expansion angle is 30, and the defined viscosity parameter is 0.0005. The longitudinal reinforcement is HRB400, the stirrup is HPB300, the density is 7800 kg/m3, the elastic modulus is 2×10¹¹ N/m2, the Poisson’s ratio is 0.3, yield strength fyk=400 N/m2, and tensile strength design value fy=360 N/m2. The elastic modulus of low-carbon cold drawn steel wire is 2×10¹¹ N/m2, the Poisson's ratio is 0.3, and the yield strength fyk=500 N/m2.
Analysis of simulation results
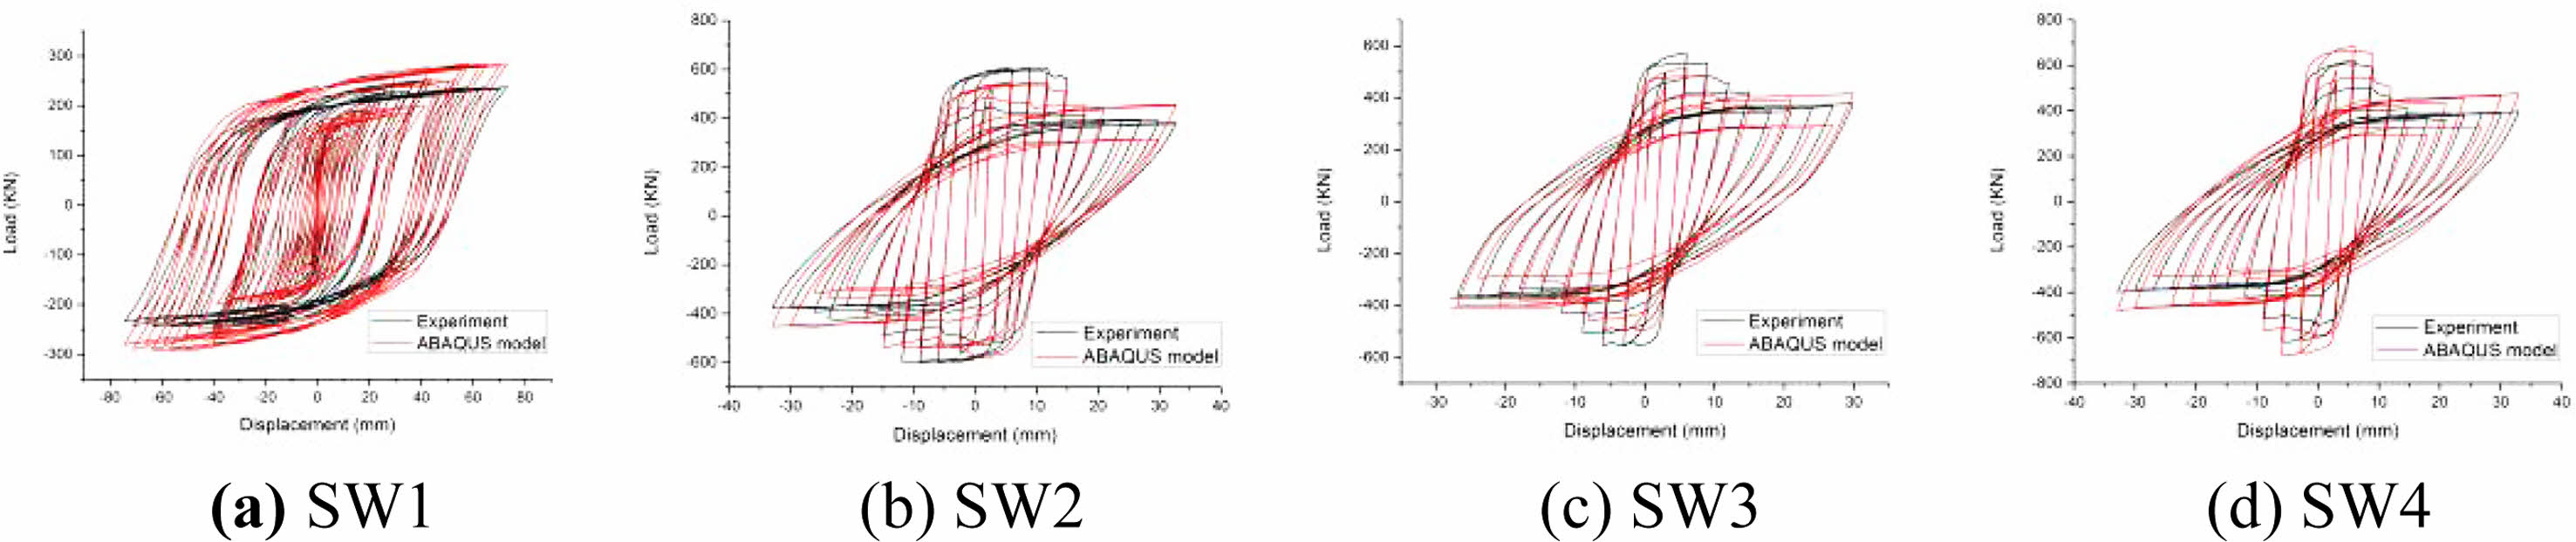
Using ABAQUS to simulate the above components, the comparison of the numerical calculation results of the hysteresis curve obtained is shown in Fig. 8.
From Fig. 8, it can be concluded that the ABAQUS software can simulate the mechanical properties of shear walls affected by different parameters to a certain extent, and the errors are acceptable. This software can be used to further analyze the seismic performance of the shear walls in this paper. Affected by the function of the ABAQUS, when the bearing capacity drops to 85% of the peak bearing capacity, the component is considered to be damaged and the simulation stops [25,26].
Impact of axial compression ratio
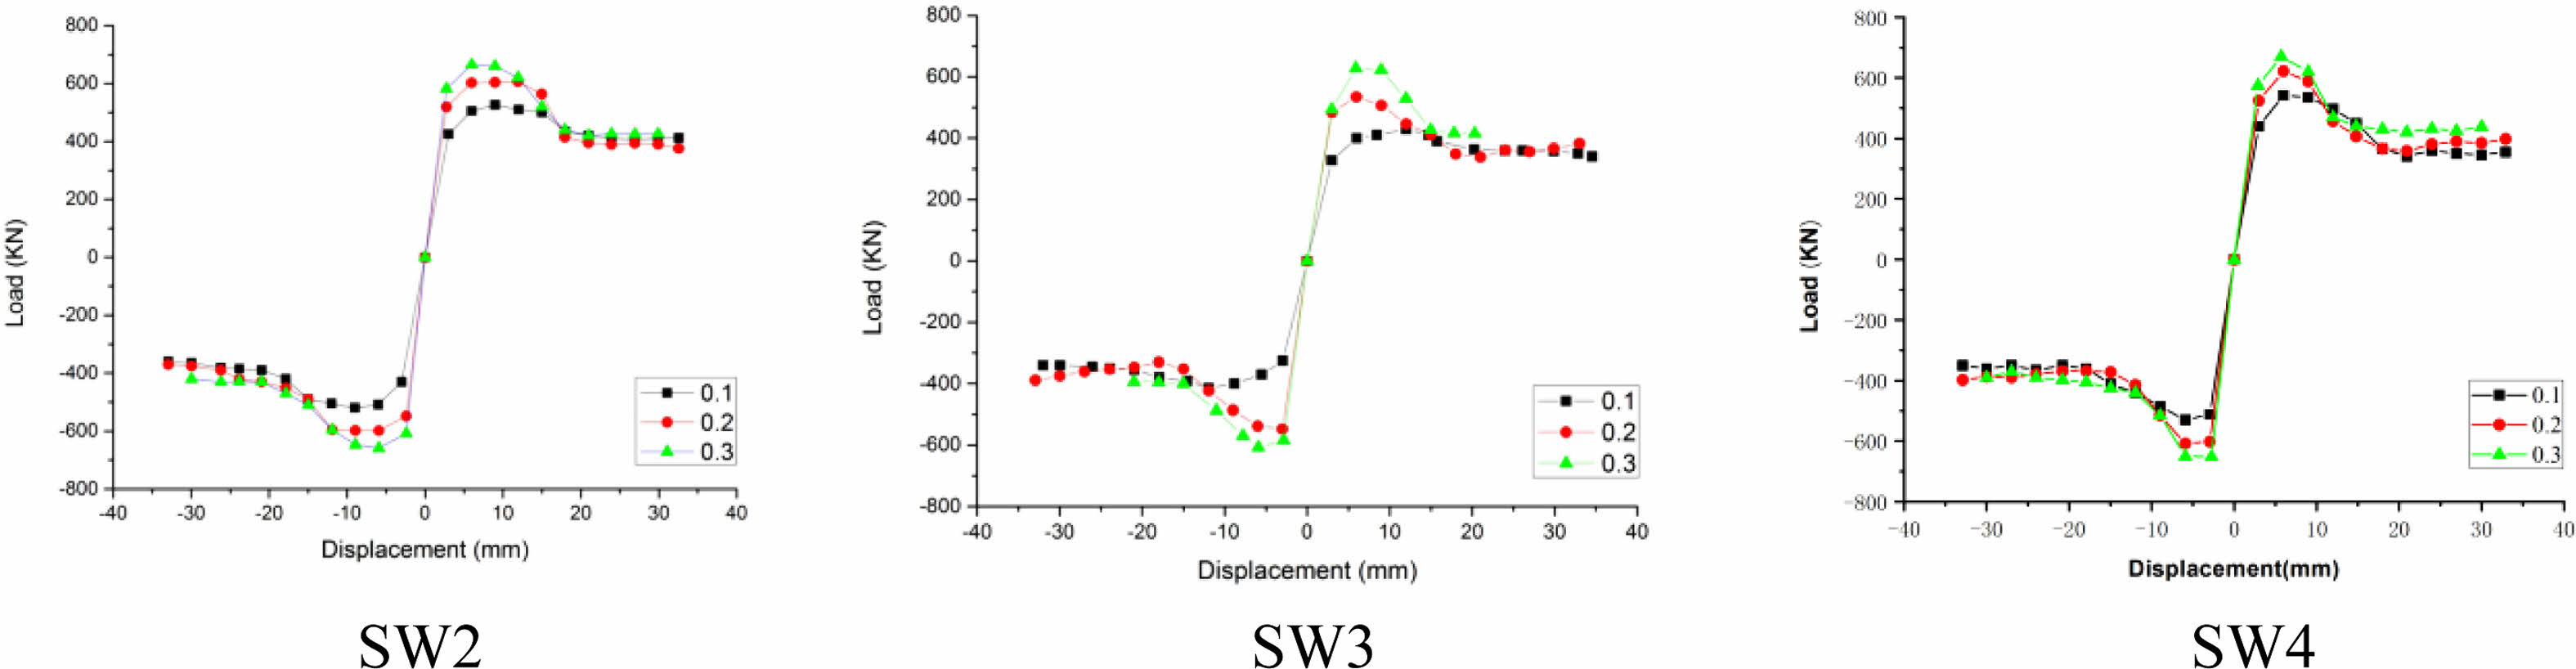
When analyzing the influence of the axial compression ratio, the range of the axial compression ratio of the component SW2, SW3 and SW4 shear walls mentioned above is taken as 0.1, 0.2 and 0.3, and other parameters are kept unchanged. Fig. 9 reflects the change of load-displacement skeleton curve under different axial compression ratio. As can be seen from the diagram, the increase of axial compression ratio makes the horizontal peak bearing capacity of integrated shear wall components increase significantly, but the peak displacement is obviously reduced, it shows that the increase of axial compression ratio greatly increases the brittleness of integrated shear wall components. So that the component failure is advanced, and the axial compression ratio is too lager to accelerate the decline of the bearing capacity of the prefabricated integrated shear wall component, and reduce the ductility of the structure. In the same axial compression ratio, the section curve of the component SW2 and SW4 from peak load to ultimate load is steeper, indicating that the deformation ability of the component SW3, in the integrated shear wall components, is better. The component SW3’s axial compression ratios range from 0.1 to 0.2 and 0.3, it’s ultimate bearing capacity was increased by 23.2% and 18.5% respectively, ductility coefficient decreased by 5.0% and 22.0%, respectively. Therefore, it is suggested that the axial compression ratio of integrated shear wall components is 0.2-0.3.
|
Fig. 7 Stress-strain curve of reinforcement. |
|
Fig. 8 Comparison of hysteresis curves between simulated and tested specimens. |
|
Fig. 9 Skeleton curves with different axial compression ratios |
There are many factors that can change the seismic performance of prefabricated shear wall. In order to analyze the seismic performance of prefabricated integrated shear wall components more comprehensively, this chapter will use the analysis results by software ABAQUS and shear wall test results, the seismic performance of the component SW2, SW3 and SW4 shear walls under different partition widths is discussed. It provides a reference for analyzing the influence law of seismic performance of prefabricated integrated shear wall [27,28].
Impact of the partition width of the filled wall on seismic performance
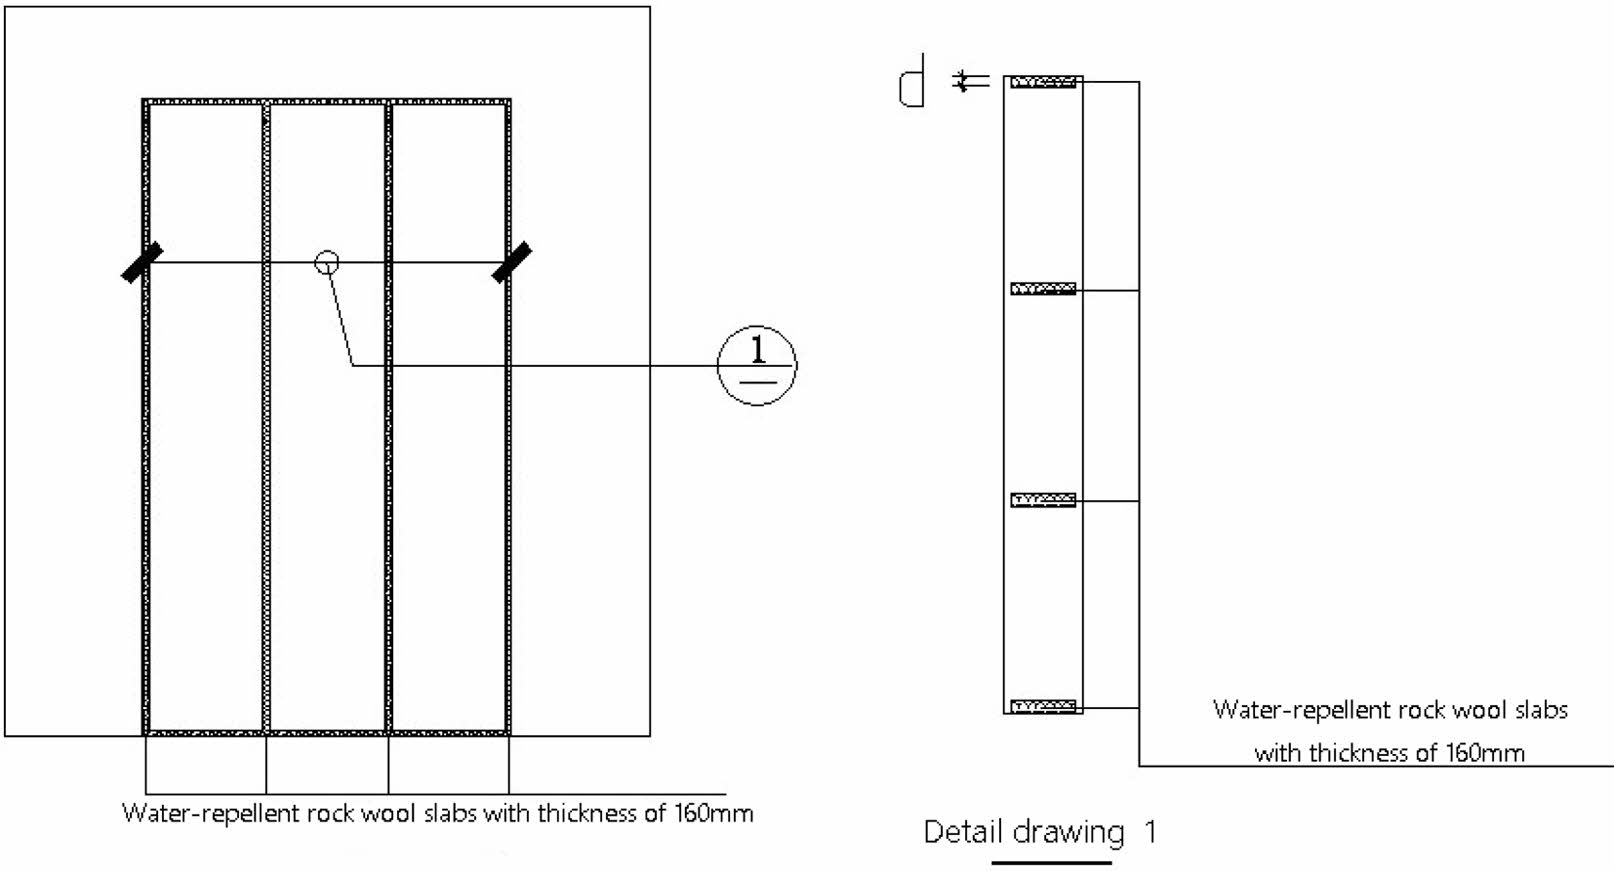
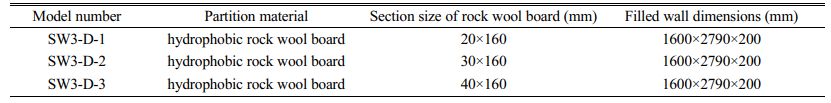
On the basis of the component SW3 model, only the width d of rock wool board is changed, the seismic performance of the component is analyzed when the partition width is 20 mm, 30 mm and 40 mm, and the SW3-D-1, SW3-D-2 and SW3-D-3 is numbered respectively. Change the width of rock wool board as shown in Fig. 10, component model parameters are shown in Table 7.
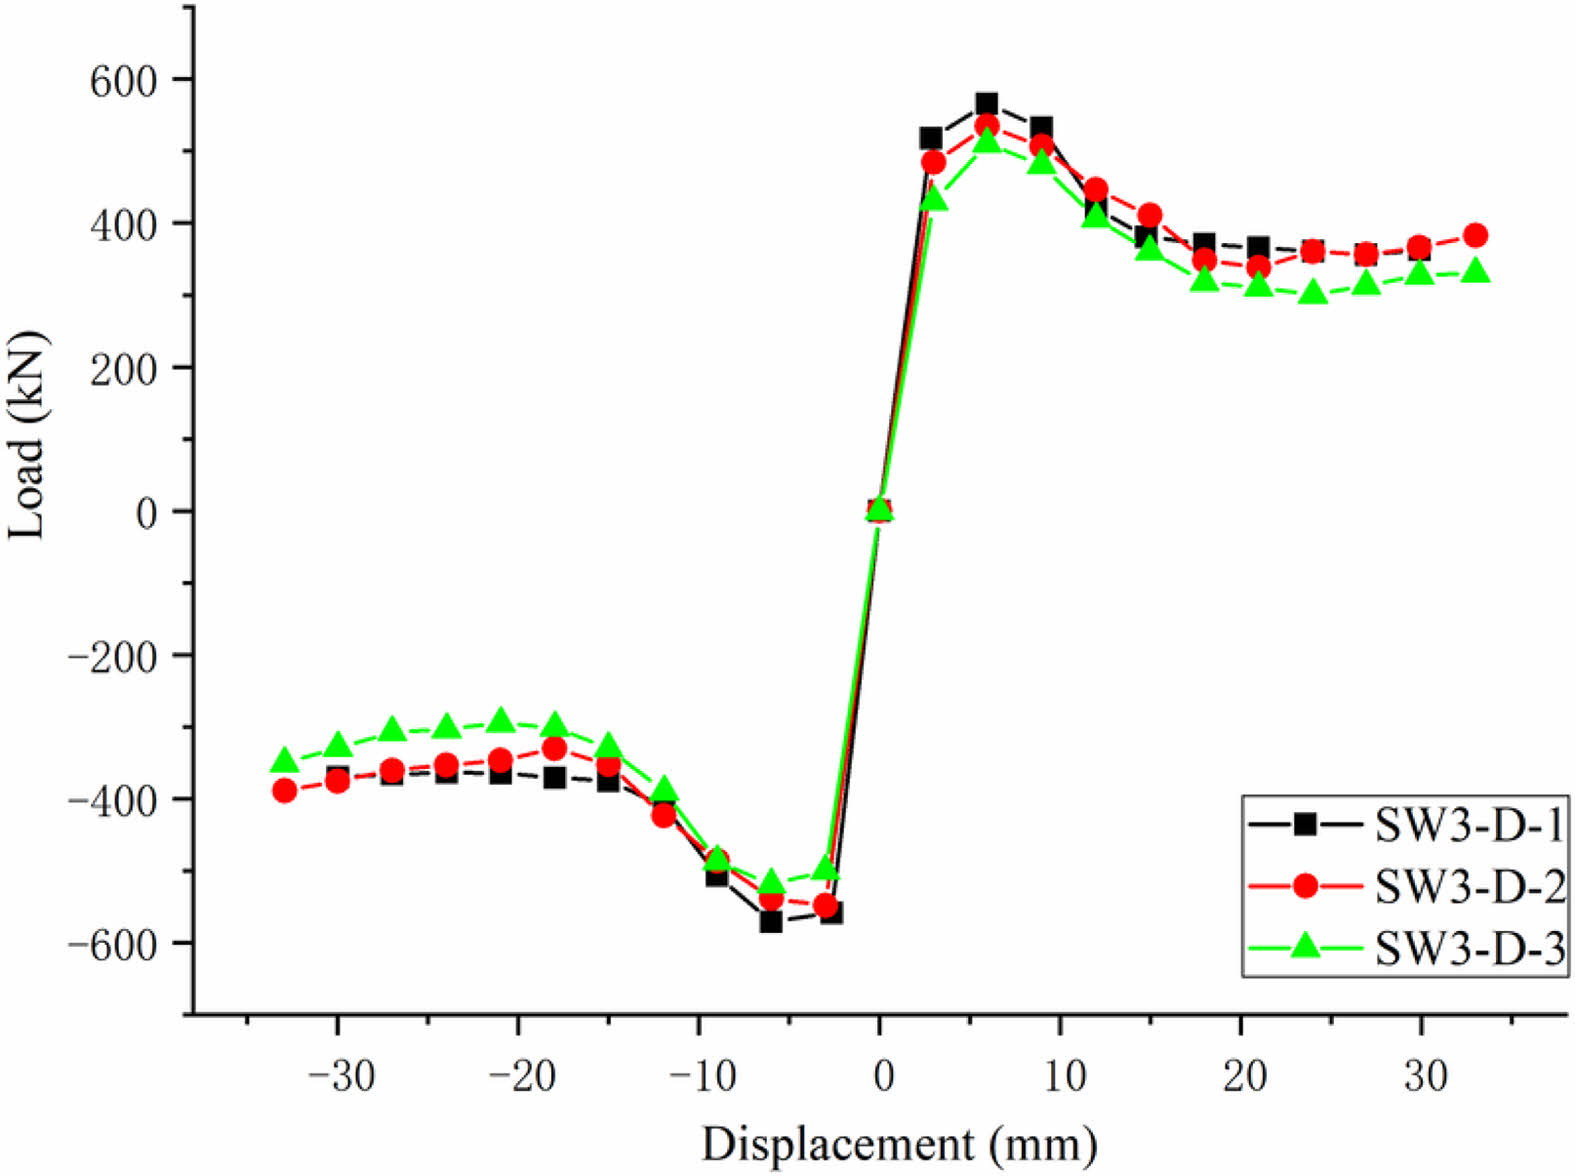
Fig. 11 shows the filled wall skeleton curves with different partition widths. The yield load and ultimate bearing capacity of the model with partition width of 20 mm and 30 mm are similar. When the partition width is 30 mm and 40 mm, the yield load and ultimate bearing capacity of the component decrease because of the increase of the partition width, the reason is that the increase of the partition width weakens the shear resistance of the shear wall structure, the horizontal bearing capacity of the structure is reduced. The model with a partition width of 30 mm increases the ductility coefficient by 7.5% compared with the model with a partition width of 20 mm, which indicates that increasing the partition width can weaken the lateral stiffness of the structure and increase the ductility. When the partition width increases from 30 mm to 40 mm, the ductility coefficient of the component decreases by 8.5%, which has the phenomenon of early failure. The reason is that the excessive partition width accelerates the damage of the filled wall part, and the concrete at the bottom angle of the filled wall is quickly crushed. The analysis shows that the component SW3 deformation ability of integrated shear wall component is the best when the partition width is 30 mm [29-31].
|
Fig. 10 Infill wall construction schematic diagram. |
|
Fig. 11 Comparison of skeleton curves. |
·The quasi-static test result shows that the unfilled shear wall is subjected to bending failure under horizontal reciprocating load because of the short wall limb, and the prefabricated integrated concrete shear wall is damaged by bending shear failure due to the diagonal support of the filled wall, in which the solid wall limb shows obvious bending failure, and the concrete filled wall with built-in rock wool board shows shear failure. The structural measures of installing hydrophobic rock board partition in the longitudinal direction of the filled wall can effectively weaken the stiffness of the components.
·Compared with the unfilled wall, the lateral stiffness, horizontal shear capacity and bearing capacity of prefabricated integrated shear wall components are greatly improved, and the seismic performance is better.
·Based on the software ABAQUS, the numerical simulation of four test walls is carried out, and the hysteresis curve with good agreement with the test results is obtained, which has good ductility and strong seismic performance.
·The horizontal bearing capacity and initial stiffness of the components increase with the increase of the axial compression ratio, and the deformation capacity of the structure becomes worse if the axial compression ratio is too lager. The decrease of the thickness of the hydrophobic rock wool board increases the bearing capacity of the components, but the stiffness also increases, which is not conducive to seismic performance. Therefore, it is suggested that the construction scheme of prefabricated integrated concrete shear wall is as follows: the axial compression ratio of integrated shear wall component is kept within 0.2-0.3, and the hydrophobic rock wool boards with a cross section of 30 mm×160 mm are arranged around and in the middle of the filled wall. Low-carbon cold drawn steel wire mesh with a diameter of 4 mm is placed on both sides of the filled wall with a spacing of 200 mm.
This work was supported in part by the National Key Research and Development Program of China (No.2017YFC0806100) and the Jilin Scientific and Technological Planning Project (No.20210402073GH).
- 1. B. Zhao, X.L. Lv, and L.Z. Liu, Earthq. Eng. Eng. Vibr. 25[1] (2005) 81-87.
-

- 2. Y. Li, Y. Zhao, and F.L. Meng, J. Jilin Jianzhu Univ. 035 [006] (2018e) 7-10.
- 3. B. Butenweg, M. Marinković, and R. Salatić, Bull. Earthq. Eng. 17 (2019) 3397-3422.
-
- 4. K. Xiao, Q. Zhang, and B. Jia, Front. Struct. Civil Eng. 10 (2016) 63-71.
-
- 5. L.L. Xie, X. Chong, L.F. Zhang, X.G. Ye, Q. Jiang, and D.C. Wang, Eur. J. Environ. Civil Eng. 25[12] (2019) 2236-2256.
-
- 6. W.B. Hu, X.M. Zhai, and H.B. Jiang, J. Build. Struct. 37[08] (2016) 1-10.
-
- 7. W.L. Han, J.R. Qian, W.J. Zhang, Z.Z. Zhao, Y.B. Zhang, T. Ma, and Y.Z. Zhang, J. Constr. Struct. 41[2] (2020) 32-41.
-
- 8. H.N. Li, Y.C. Tang, C. Li, and L.M. Wang, Eng. Struct. 198 (2019) 109560.
-
- 9. Z.G. Peng, P. Qin, and Z.K. Tan, Build. Struct. 48[6] (2018) 5-11.
-
- 10. B. Aykaç, E. Özbek, R. Babayani, M. Baran, and S. Aykaç, Eng. Struct. 152 (2017) 168-179.
-
- 11. L. Wang, K. Qian, F. Fu, and X.F. Deng, Mag. Concr. Res. 72[23] (2020) 1203-1221.
-
- 12. O. Onat, A.A. Correia, P.B. Lourenço, and A. Koçak, Earthq. Eng. Struct. Dynam. 47[14] (2018) 2821-2839.
-
- 13. X.M. Zhai, X.S. Zhang, C. Cao, and W.B. Hu, Constr. Build. Mater. 214 (2019) 539-556.
-
- 14. X. Zhang, X.Q. Liu, Z. Lu, and J.R. Xu, Struct. Des. Tall Spec. Build. 30[9] (2021) e1856.
-
- 15. B. Dal Lago, P. Negro, and A. Dal Lago, Soil Dynam. Earthq. Eng. 106 (2018) 182-195.
-
- 16. Y. Chen, G.E. Okudan, and D.R. Riley, Autom. Constr. 19[6] (2010) 665-675.
-
- 17. Y.S. Chun, J. Ceram. Process. Res. 20 (2019) 31-35.
-
- 18. N. Sangeetha, V.M. Brathikan, R.K. Nitheeshwar, and S. Jayabalu, J. Ceram. Process. Res. 23[4] (2022) 529-534.
-
- 19. W.F. Xu, X. Yang, F.L. Wang, and B. Chi, Appl. Sci. 8[10] (2018) 1856.
-
- 20. T.A. Ozkul, A. Kurtbeyoglu, M. Borekci, B. Zengin, and A. Kocak, Eng. Fail. Anal. 100 (2019) 60-75.
-
- 21. T. Li, S. Zhang, Z.H. Xu, Q.W. Lu, X.X. Du, and X.B. Hu, China Civ. Eng. J. 53[4] (2020) 38-49.
-
- 22. J. Lubliner, J. Oliver, S. Oller, and E. Oñate, Int. J. Solids Struct. 25[3] (1989) 299-326.
-
- 23. J. Lee, and G.L. Fenves, J. Eng. Mech. 124[8] (1998) 892-900.
-
- 24. China Standards, No. GB 50010-2010 (2010).
- 25. C.G. Qin, G.L. Bai, Y.Z. Xu, N.F. Su, and T. Wu, Shock Vib. PT.1 (2018) 1-14.
-
- 26. Y. Li, X.P. Wang, Z.G. He, and Q. Fang, Ind. Constr. 50[12] (2020) 88-92.
-
- 27. C. Lin, Z.X. Guo, Q.X. Huang, Y. Ye, Z.L. Chai, and Y. Liu, J. Build. Struct. 39[9] (2018) 30-37.
-
- 28. W.Y. Zhang, K. Wang, Y. Chen, and Y.K. Ding, Thin-Walled Struct. 144 (2019) 106279.
-
- 29. S. Sridhar, S. Nandhakumar, M. Nallusamy, and R. Maguteeswaran, J. Ceram. Process. Res. 23[4] (2022) 498-502.
-
- 30. S.H. Jakhrani, A. Qudoos, Atta-ur-Rehman, H.G. Kim, I.K. Jeon, and J.S. Ryou, J. Ceram. Process. Res. 20[SP 1] (2019) 1-18.
-
- 31. S.G. Cho, W.K. Park, G.H. So, S.T. Yi, and D. Kim, KSCE J. Civil Eng. 19[3] (2015) 698-709.
-
 This Article
-
2022; 23(5): 629-637
Published on Oct 31, 2022
- 10.36410/jcpr.2022.23.5.629
- Received on Mar 3, 2022
- Revised on Apr 5, 2022
- Accepted on Apr 19, 2022
Services
- Abstract
introduction
test overview
test results and analysis
numerical simulation
prefabricated integrated shear wall construction scheme
conclusions
- Acknowledgements
- References
- Full Text PDF
Shared
Correspondence to
- Wen-yang Dong
-
Computer Science and Technology Engineering Centerpartment, The 964th Hospital, Changchun, Jilin Province, China
- E-mail: delwine@126.com
Clean-Energy Research Institute(CRI), Hanyang University, 222, Wangsimni-ro, Seongdong-gu, Seoul, 04763, Korea
E-mail: jcpr@hanyang.ac.kr