


- Study of site occupation and resonances in Ba1-xLaxTiO3 ceramics prepared by the sol gel method
Adil Moutaouaffiqa, Mounir Belhajjia, Abdelilah Rjeba, Salaheddine Sayouria,*, Driss Sqalli Houssainib and Taj-Dine Lamcharfic
aLPAIS, Faculty of Sciences-DM, USMBA, B.P. 1796, Fez-Atlas, Morocco
bLTI, FST-Fès, Route d’Imouzzer, B.P. 2202, Fès, Morocco
cLSSC, FST-Fès, Route d’Imouzzer, B.P. 2202, Fès, MoroccoThis article is an open access article distributed under the terms of the Creative Commons Attribution Non-Commercial License (http://creativecommons.org/licenses/by-nc/4.0) which permits unrestricted non-commercial use, distribution, and reproduction in any medium, provided the original work is properly cited.
Lanthanum (La) doped Barium titanate powders, Ba1-xLaxTiO3 ceramics, with various La concentration (0, 0.25, 0.50, 0.75, 1.5 and 3%), were prepared through the sol-gel process and characterized by Thermogravimetric analysis (TGA), Differential thermal analysis (DTA), X-Ray diffraction (XRD), Fourier Transform Infrared (FT-IR) , Raman spectroscopy and Scanning electron microscopy (SEM). We have also performed dielectric measurements for temperatures such as 50 < T < 300 °C. X-ray diffraction (XRD) patterns of the prepared powders, calcined at a relatively low temperature (900 °C/4 h), revealed their crystallization in the pure perovskite structure without the presence of secondary phases. Moreover, from these analyses, it was shown that La may enter both Ba and Ti sites contrary to what is widely reported in the literature indicating that La incorporates Ba sites only. Scanning electron microscopy (SEM) analysis showed quite regular morphology of the grains and an average grain size which decreases with introduction of La, in agreement with structural characterization. Raman and Fourier Transform Infrared (FT-IR) analyses have given results in accordance with those of XRD and SEM characterizations. The permittivity variations as functions of the frequency showed a decrease in the interval [1kHz-100kHz], followed by an anormal increase in the interval [100 kHz-1MHz], indicating that the samples approached their frequency of resonance
Keywords: Ba1-xLaxTiO3 ceramics, Sol-gel, Structure analysis, Dielectric properties
Barium titanate (BaTiO3) continues to attract attention of researchers owing to its interesting ferroelectric, dielectric and piezoelectric properties [1, 2] which makes it one of the promising candidates for many technological applications such as capacitors, transducers, non-volatile memories, thermistors, dynamic random access memory (DRAM) and tunable microwave device applications [3, 4]. This compound possesses the perovskite structure which plays a major role in the determination of the physico-chemical properties of this material [5], and it is known to undergo three successive phase transitions with decreasing temperature, from a cubic structure (Pm3m) to a tetragonal structure (P4mm) at 130 °C, then to an orthorhombic structure (Amm2) at 5 °C, and finally to a rhombohedral structure (R3m) at -90 °C. Structural phase transformations have also been shown to occur under suitable doping at the Ti site [6, 7].
BaTiO3 is a displacive type ferroelctric material of which dielectric properties can be modified by chemical substitution of barium and/or titanium by a wide variety of isovalent and aliovalent dopants.
Interesting and exotic properties are theoretically expected in doped BaTiO3 like ferroelectricity at room temperature, enhanced dielectric properties, etc [8]. Moreover, synthesis techniques also influence its physical properties. Based on this fact, several studies have been undertaken adopting different synthesis techniques such as sol-gel, solid state ceramic technique, laser ablation and chemical process [9]. In this regard, doping has been made for BaTiO3 with different elements such as La, Bi, Mg etc [1, 7].
It is known that in the perovskite structure, the A-sites are occupied by ions of higher co-ordination number and the B-sites by ions of relatively lower co-ordination number. As a result, the incorporation of the dopant in A or B-sites can determine the physical properties of BaTiO3.
In addition to the sintering process, these properties are however greatly influenced by impurities, especially by a donor or an acceptor dopant. When the dopants are incorporated into the BT lattice, the substitutional chemistry is determined by strain, charge distribution and ionic size [3].
It is known that the strong temperature dependence of the permittivity around the ferro-to-paraelectric transition temperature (FPT) restrains the application of pure BT in MLCC devices. Doping of BT with rare earth elements has been shown to reduce the temperature dependence of capacitance by broadening the sharp peak of the FPT (Tc), and to lower the dissipation factor in dielectric ceramics [10].
Owing to their intermediate ionic radius between Ba2+ (1.35 Å) and Ti4+ (0.64 Å) and the possibility to occupy Ba-and/or Ti-sites in BT [11], rare-earth elements (RE) have been found to be effective in adjusting the composition and defects [12] in this material.
In a study of site occupation of rare-earth cations in BaTiO3 Tsur and Randall [13] have concluded that for elements with ionic radii values between 0.087 nm and 0.094 nm (Er, Y, Ho, Dy, Gd), the dopants show amphoteric behavior as they can occupy both cations lattice site in the BaTiO3 structure. The occupation of one of the two sites A or B, or the simultaneous occupation of these two sites seems to influence the physico-chemical properties of this material [14].
Besides, thermodynamic conditions strongly influence the ratio of incorporation at the A-site and B-site which depends on the Ba/Ti ratio.
Resonance phenomena in such materials are theoretically expected at relatively high frequencies. However, under doping these phenomena may appear as revealed by the present study; to our knowledge, the occurrence of resonances have rarely been reported earlier [9, 12].
In the present study, La-doped BaTiO3 (BLaxT) ceramics, with x = (0, 0.25, 0.50, 0.75, 1.5 and 3%) were prepared using the sol gel method; the choice of this method of processing was based on its various advantages, low processing temperature, high purity, homogeneity and an excellent control of the stoichiometry of the products [15]. We have investigated the structuralproperties of the samples using X-ray diffraction (XRD), Fourier Transform Infrared (FT-IR) spectroscopt, Raman spectroscopy and scanning electron microscopy (SEM). We have also performed dielectric measurements for temperatures such as 50 < T < 300 °C. Experimental results were analysed and then discussed as functions of the doping concentration, and compared to those reported in the literature.
In particular, in La-doped BaTiO3 compounds most of the published studies revealed that La incorporates Ba sites. In our work we have shown that La may replace both Ba and Ti atoms. Moreover, resonances have been shown to take place in the as-prepared samples.
The sol-gel route was used to elaborate a series of BLaxT (x = 0, 0.25, 0.50, 0.75, 1.5 and 3%) crystalline powders [9, 16] through the destabilization of colloidal solution (DCS). The choice of this technique was based on its several advantages such as an excellent control of the stoichiometry, a good homogeneity of the powders and a crystallization of the powders at a relatively low temperature [15].
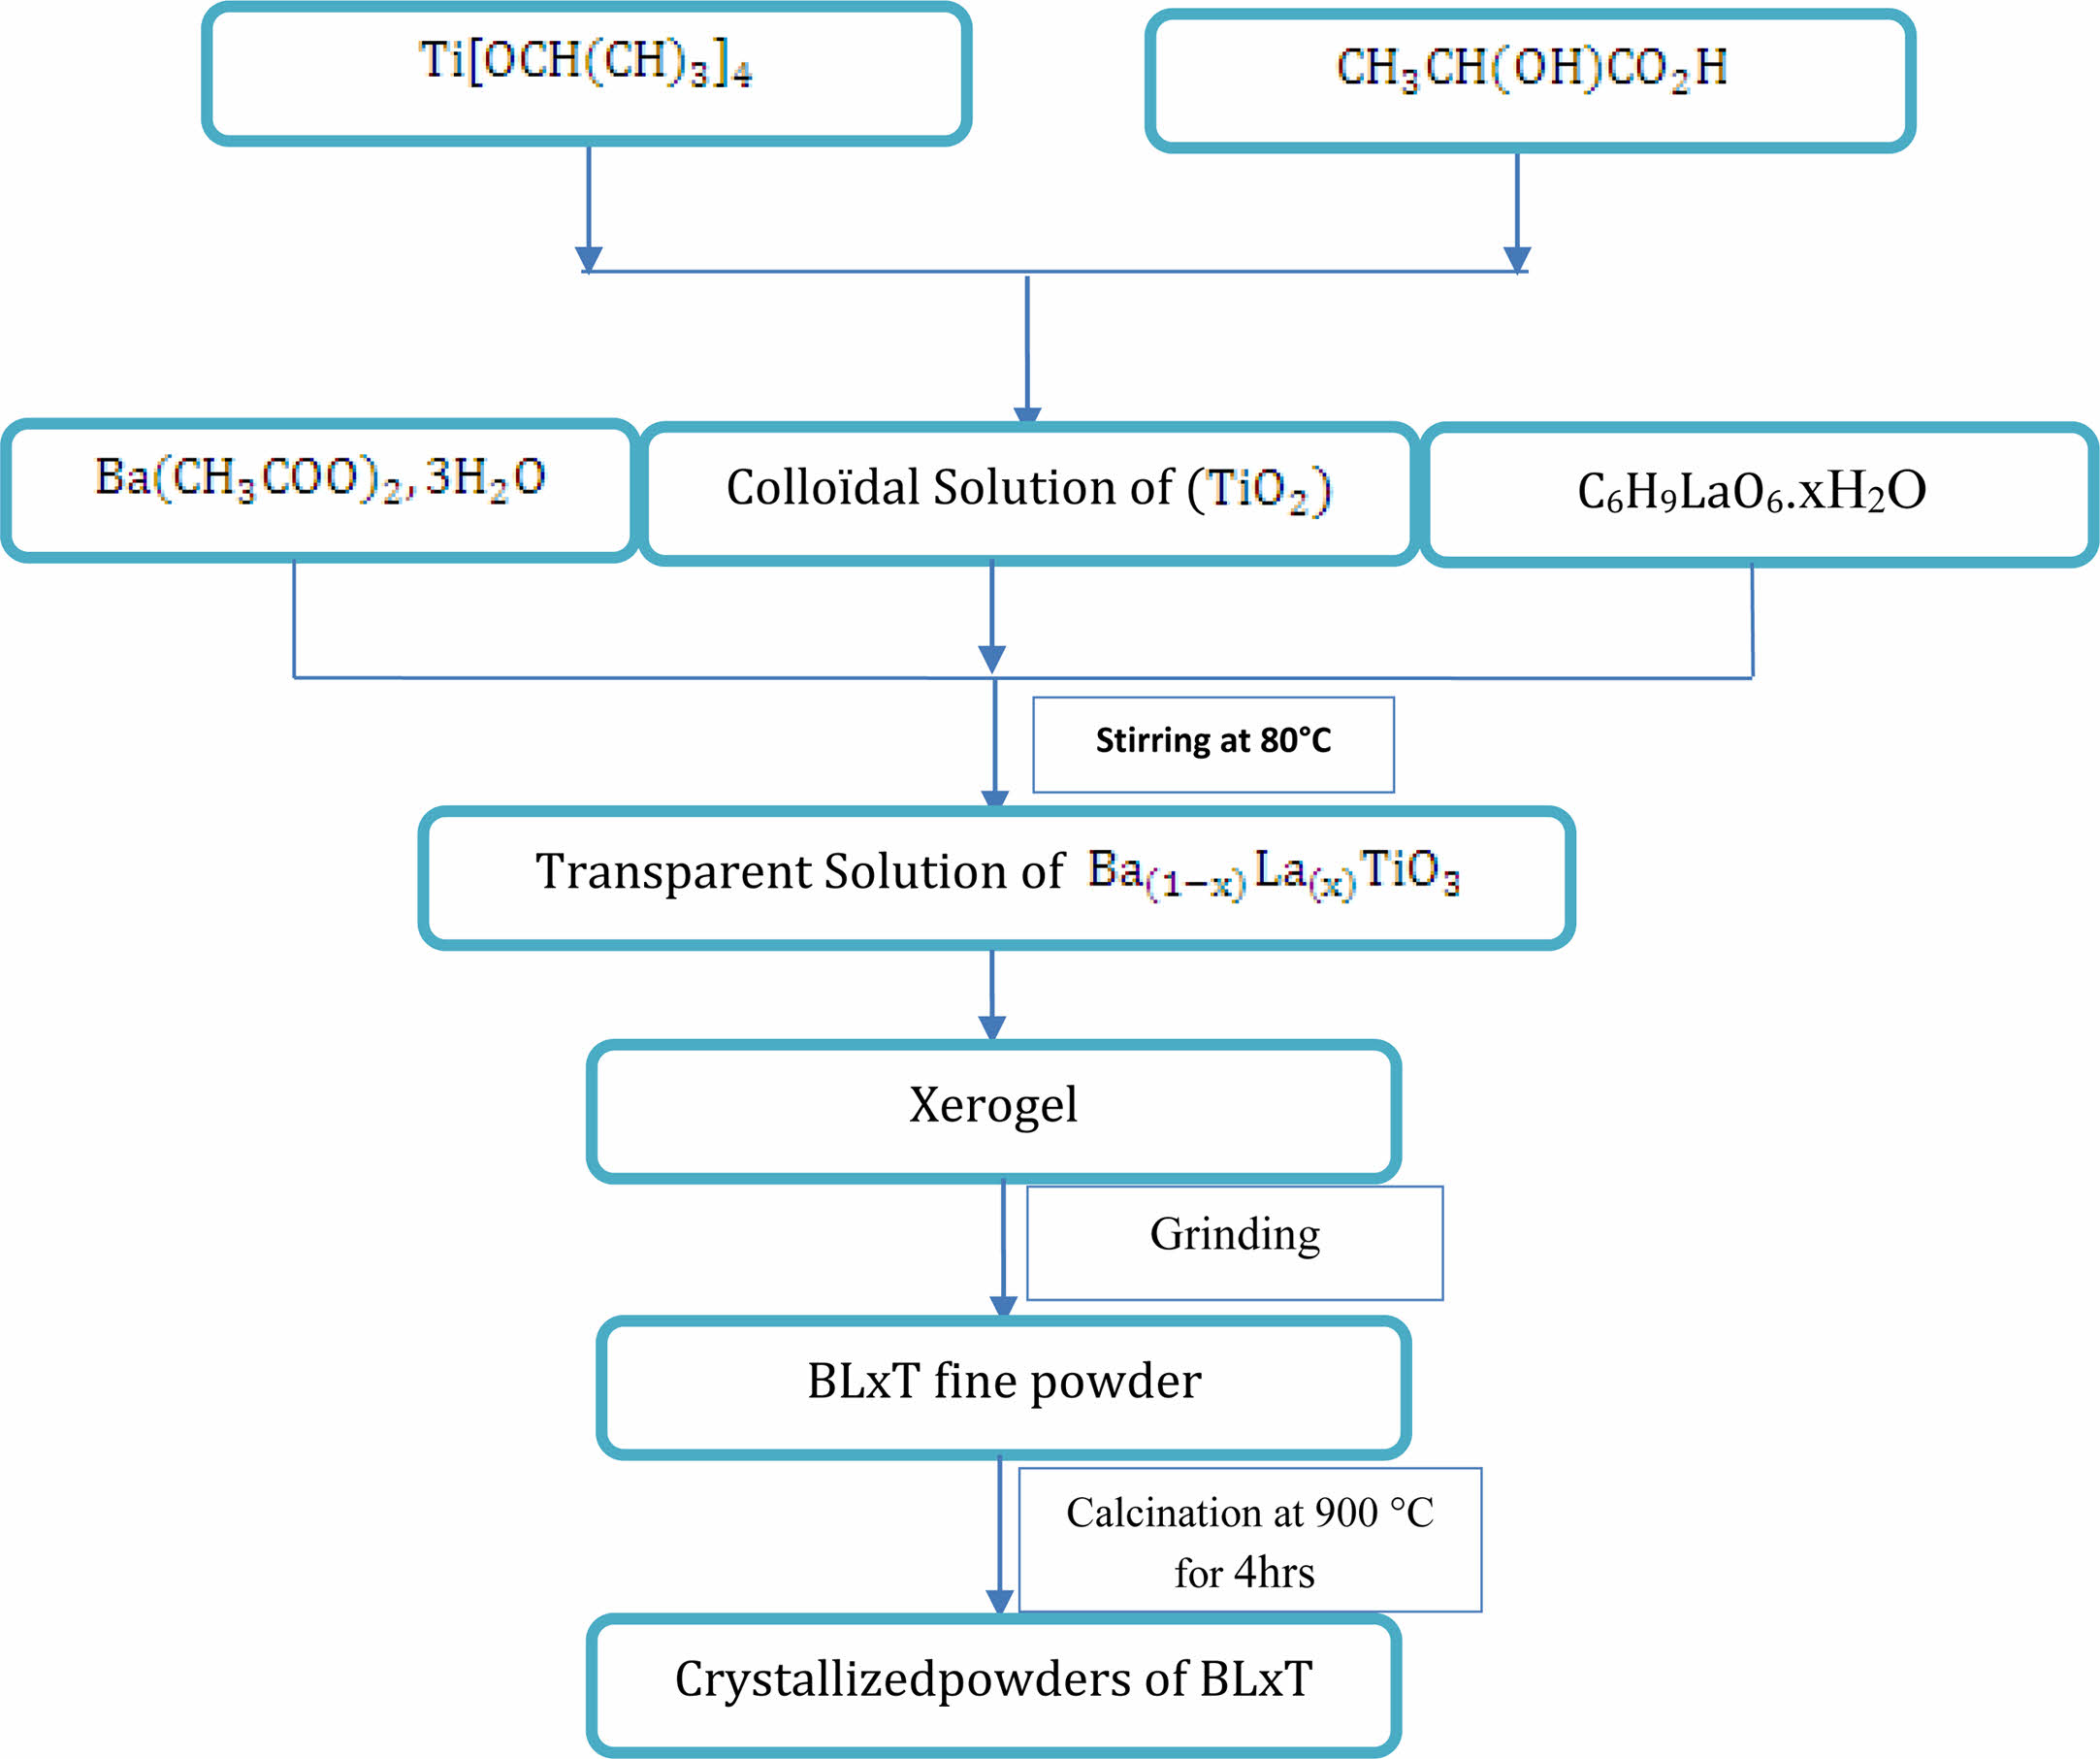
The powders were prepared using barium acetate trihydrate (Ba(CH3COO)2, 3H2O) (99.9% purity), titanium isopropropoxide Ti[OCH(CH3)2]4 (97% purity) and Lanthanum acetate C6H9LaO6·xH2O (99.9% purity) as precursors, lactic acid (CH3CH(OH)COOH) as peptizing agent and distilled water as solvent. The different steps of the preparation of BaLaxT powders are illustrated by Fig. 1. The first step consists in the preparation of a colloidal solution of TiO2. To this end, TiO2 is added to an aqueous solution of lactic acid and water with a continuous stirring at 70 °C to obtain a white precipitate. After 24 hours of reaction, the white precipitate is changed into a clear homogeneous solution, that is stable over time.
The obtained colloidal solution was then added in stoichiometric quantities to Lanthanum and Barium acetates ( Second step). A stirring at 80 °C for 72 h of the obtained transparent sol led to a translucent gel. Fine powders were obtained from the gel after drying at 80 °C and grinding, and then were calcined in air in a programmable oven at the temperature of 900 °C for 4 h. This temperature was determined from Thermogravimetric (TGA), and Differential thermal analyses Thermogravimetric (TGA), and Differential thermal analyses (DTA). These analyses were performed on the sample BLT1.5. The structure of the (Ba1-x LaxTiO3) calcined powders was studied using X-Ray Diffraction (XRD) [XPERT-PRO diffractometer with Cu-Kα radiation (λ = 1.5405980 Å)], Raman spectroscopy (SENTERRA) and Fourier transform infrared spectroscopy (FT-IR). To perform dielectric measurements, the products were pressed into pellets (diameter of around 12 mm, thickness of around 1 mm) under an uniaxial pressure equal to 12 tons/cm2. The pelletized samples were finally heat treated at 1200 °C for 6 h in a programmable furnace. This step (sintering process) is necessary to densify and consolidate the compacted powder samples through the action of heat. to form a continuous 3D structure. The morphology of the samples was then analyzed using a Scanning Electron Microscope (SEM) (quanta 200 FEI).
|
Fig. 1 Flow chart of the sol-gel preparation of BLaxT ceramic samples. |
Thermal analysis
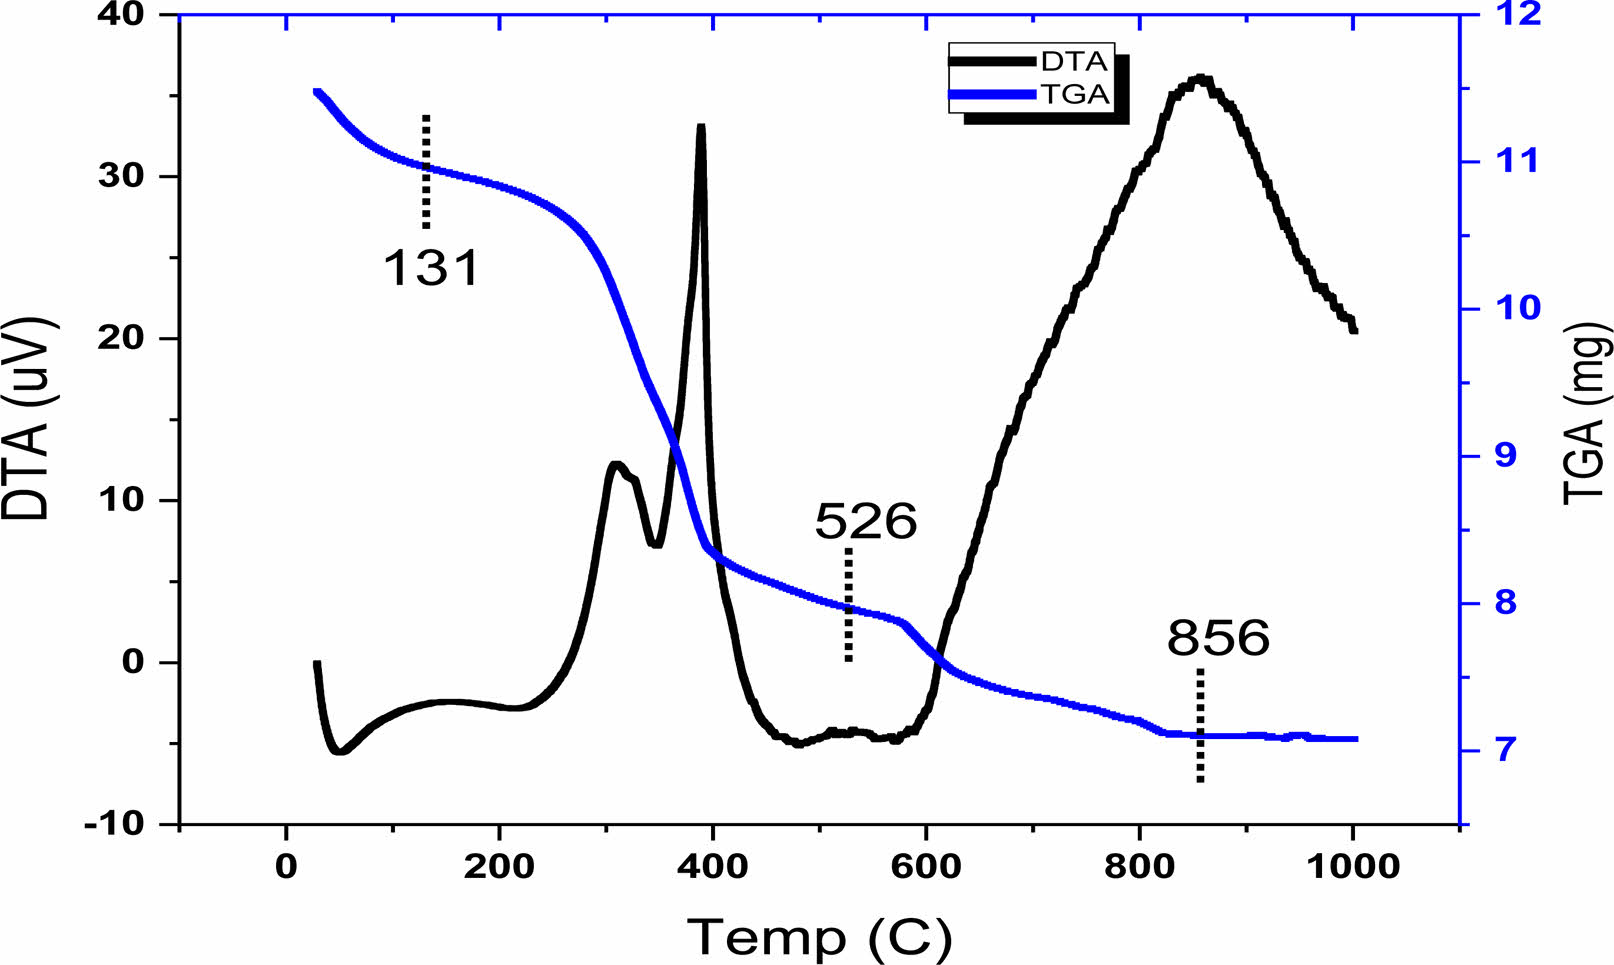
The TGA and DTA techniques were used to follow the different steps of decomposition (mass loss) of the raw powder corresponding to the sample BLa1.5T, as shown on Fig. 2. This thermal analysis of the sample was performed in air up to 1000 °C with a temperature rate of 5 °C/min which makes it possible to determine the temperature of calcination of the samples. Three steps of decomposition (mass loss), recorded in the range of 30-131; 131-526; and 526-856 °C (corresponding to an overall mass loss of approximately 35%), are displayed by The TGA curve. The first step corresponding to the interval (30-131 °C) represents a mass loss that can be attributed to the elimination of water and of excess of lactic acid [17]. This mass loss is accompanied by a small endothermic peak in the DTA curve. The progressive mass loss corresponding to the second interval of temperature (131-526 °C) is accompanied by two peaks one endothermic and the other exothermic in the DTA. This mass loss can be ascribed to the decomposition of the organic matter and the elimination of CO2 and the remaining H2O [18]; rearrangements of chemical bonds in the gel are expected in this temperature interval, and the gel is transformed into polymers [19]. The last mass loss recorded in the interval (526-856 °C) was accompanied by an endothermic peak in the DTA curve (at around 856 °C), as a consequence of the decomposition of organic polymers and the formation of inorganic substances (the formation of BLaT) [20]. A complete crystallization of the powders was achieved as no mass loss was recorded above 856 °C. As mentioned in the introduction, the sol gel process permits a heat treatment of the samples at low tempertures. Indeed, the temperature of 856 °C is relatively low compared to others reported in the literature using other techniques of elaboration [21]. Furthermore, powders with nanometric grains are thermodynamically unstable [22].As a consequence of the TGA-DTA analysis, we have adopted the temperature of 900 °C as temperature of calcination of the samples for our structural analysis.
X-ray Diffraction study
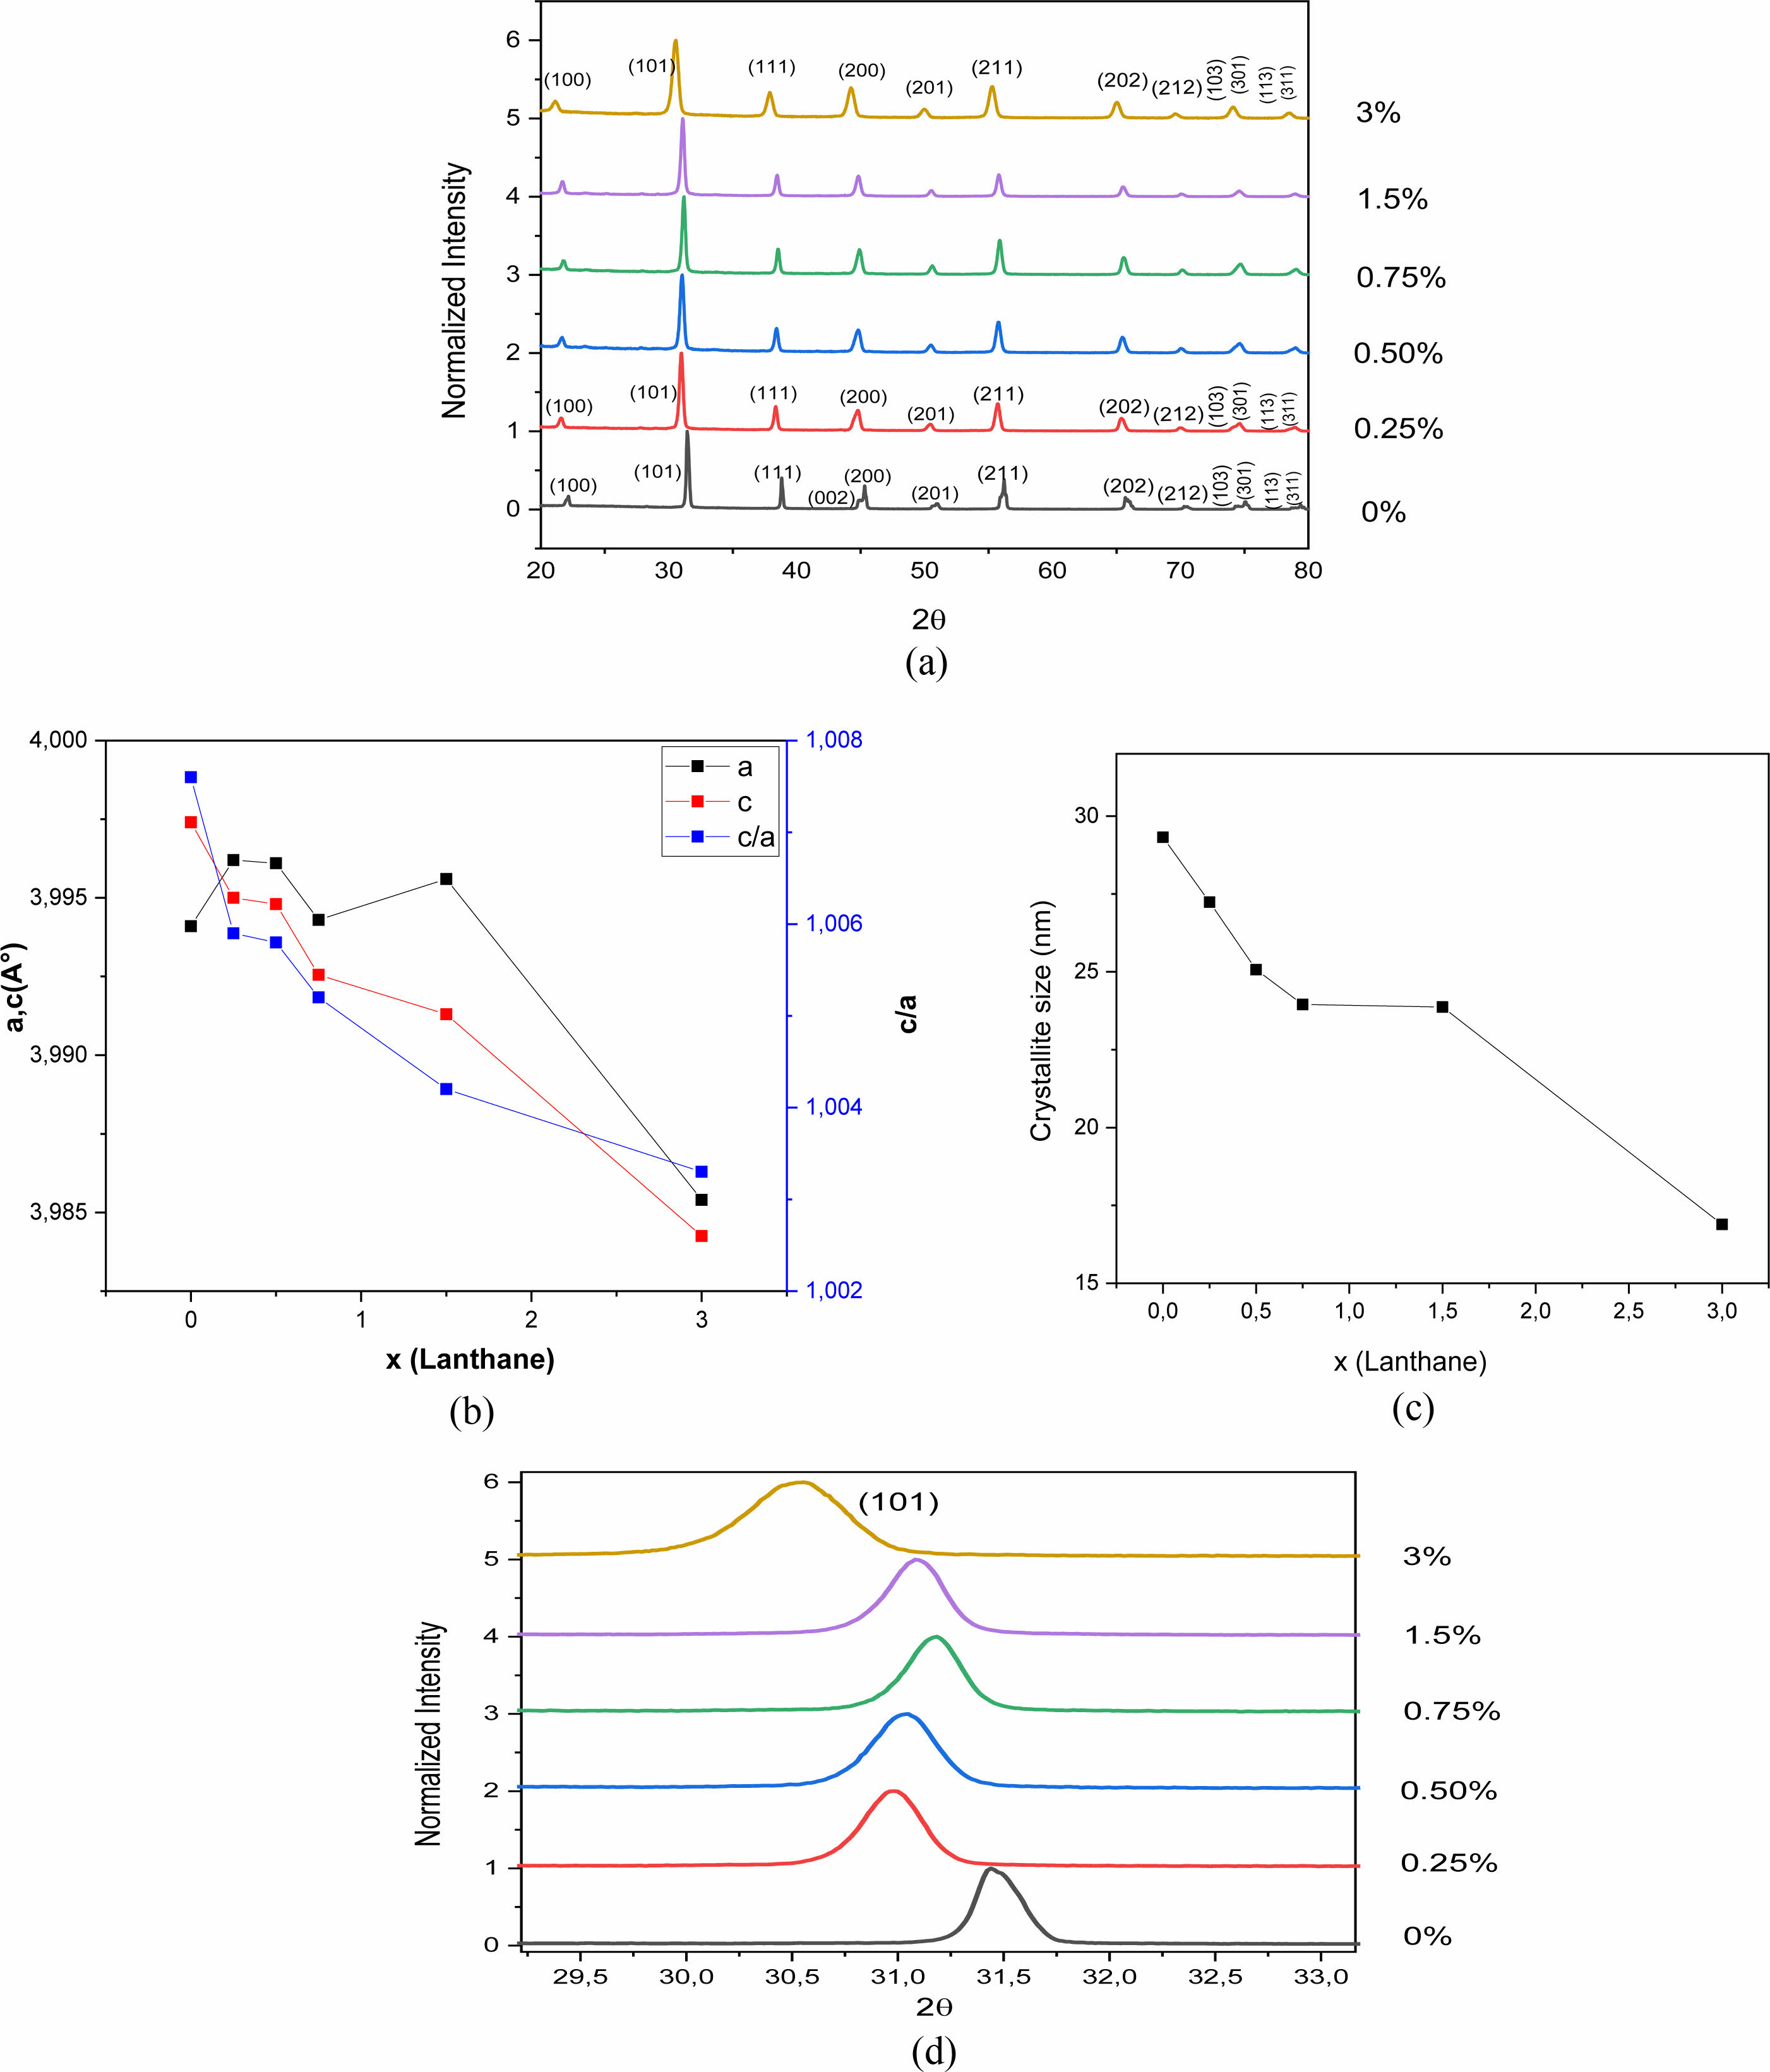
X-ray Diffraction (XRD) analysis makes it possible to check the structure of the samples and to follow the structural transformation under doping. Fig. 3(a) shows the X-ray diffractograms of the BLaxT powders (x = 0; 0.25, 0.5; 0.75; 1.5 and 3%) calcined at 900 °C for 4 h. In this figure it is clearly seen that all the BLaxT powders crystallize in the perovskite phase without the presence of any secondary phase, indicating that the solubility limit of La in BaTiO3 could be greater than 3%.
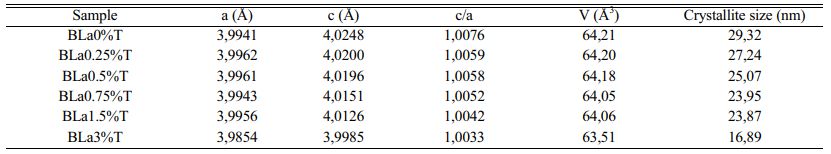
The determined values of the lattice parameters ‘a’ and ‘c’ as well as their ratio (tetragonality c/a) and the volume of the unit cell of BLaxT are given in Table 1, The calculations were done using the Rietveld Fullprof refinement program and illustrated in Fig. 3(b). The evolution of the tetragonality ‘c/a’ shows that the more the content of La increases, the more the tetragonality of the phase decreases which indicates a gradual transition from the tetragonal phase to the pseudo-cubic phase for the doped samples.
The merging of the pair peaks (200) and (002) with increasing x, present in the pure sample (x = 0, Fig. 3(a)) and characteristic of the tetragonal structure [23], supports the occurence of this transition.
It is expected that if Barium is replaced by Lanthanum in the BaTiO3 matrix (Ba is surrounded by 12 oxygen atoms) then a shrinkage of the volume of the unit cell occurs, while Titanium substituted by Lanthanum gives rise to an increase in the volume of the unit cell since the ionic radius of La3+ (r (La3+) = 1.172 Å) is smaller than that of Ba2+ (r (Ba2+) = 1.35 Å) but is larger than that of Ti4+ (r (Ti4+) = 0.60 Å). It was reported that for rare earth elements (RE) with ionic radii such as rRE ≥ 0.094 nm, dopants may occupy the A -site (A = Ba) [13] in the ABO3 perovskite structure. In this case and to compensate for the charge umbalance (Ba2+ , La3+) a creation of vacancies at the A site (Barium) may occur. From Table 1 we first observed an increase of the parameter ‘a’ with the increase of x (x = 1.5), indicating that La3+ entered both Ba2+ and Ti4+ sites but with a predominance of occupation of the latter; the occupation of the Ti sites gives rise to a compensation mechanism through oxygen vacncies placed along the c axis [24] that leads to a decrease of the parameter c which is consistent with its evolution (Table 1). Moreover, a shift of the peaks towards lower angles (Fig. 3(d)) is observed for the concentration x = 1.5. This shift, illustrated for the peak (101) as seen in Fig. 3(d), is in accordance with the recorded increase of the parameter ‘a’ and consequently the occupation of La of both La and Ti sites with predominance of occupation of Ti ones.
The simultaneous occupation of the two A and B sites is also supported by the microstructural study detailed below (Paragraph 3.5). It is worth noticing that according to most of the published papers related to BaxLa1-xTiO3 ceramics, La3+ ions incorporated preferably Ba sites for low and high concentrations in La3+ [11, 12, 20], while from our structural results this dopant may replace both Ba2+ and Ti4+ ions.
The crystallite size (D) of the obtained BLaxT samples was calculated from the X-ray diffraction patterns according to the peak (101) using the Debye-Scherrer formula [25]:
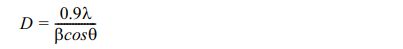
Where D is the crystallite size, λ is the X-ray wavelength (1.5406 Å), θ is the diffraction angle and β is the Full Width at Half Maximum (FWHM) of the peak (101). The estimated values for the samples are given in Table 1 and their evolution as a function of x is shown inFig. 3(c). The latter shows that when the lanthanum concentration increases the crystallite size decreases, in accordance with the evolution of the volume of the unit cell (Table 1).
Raman Study
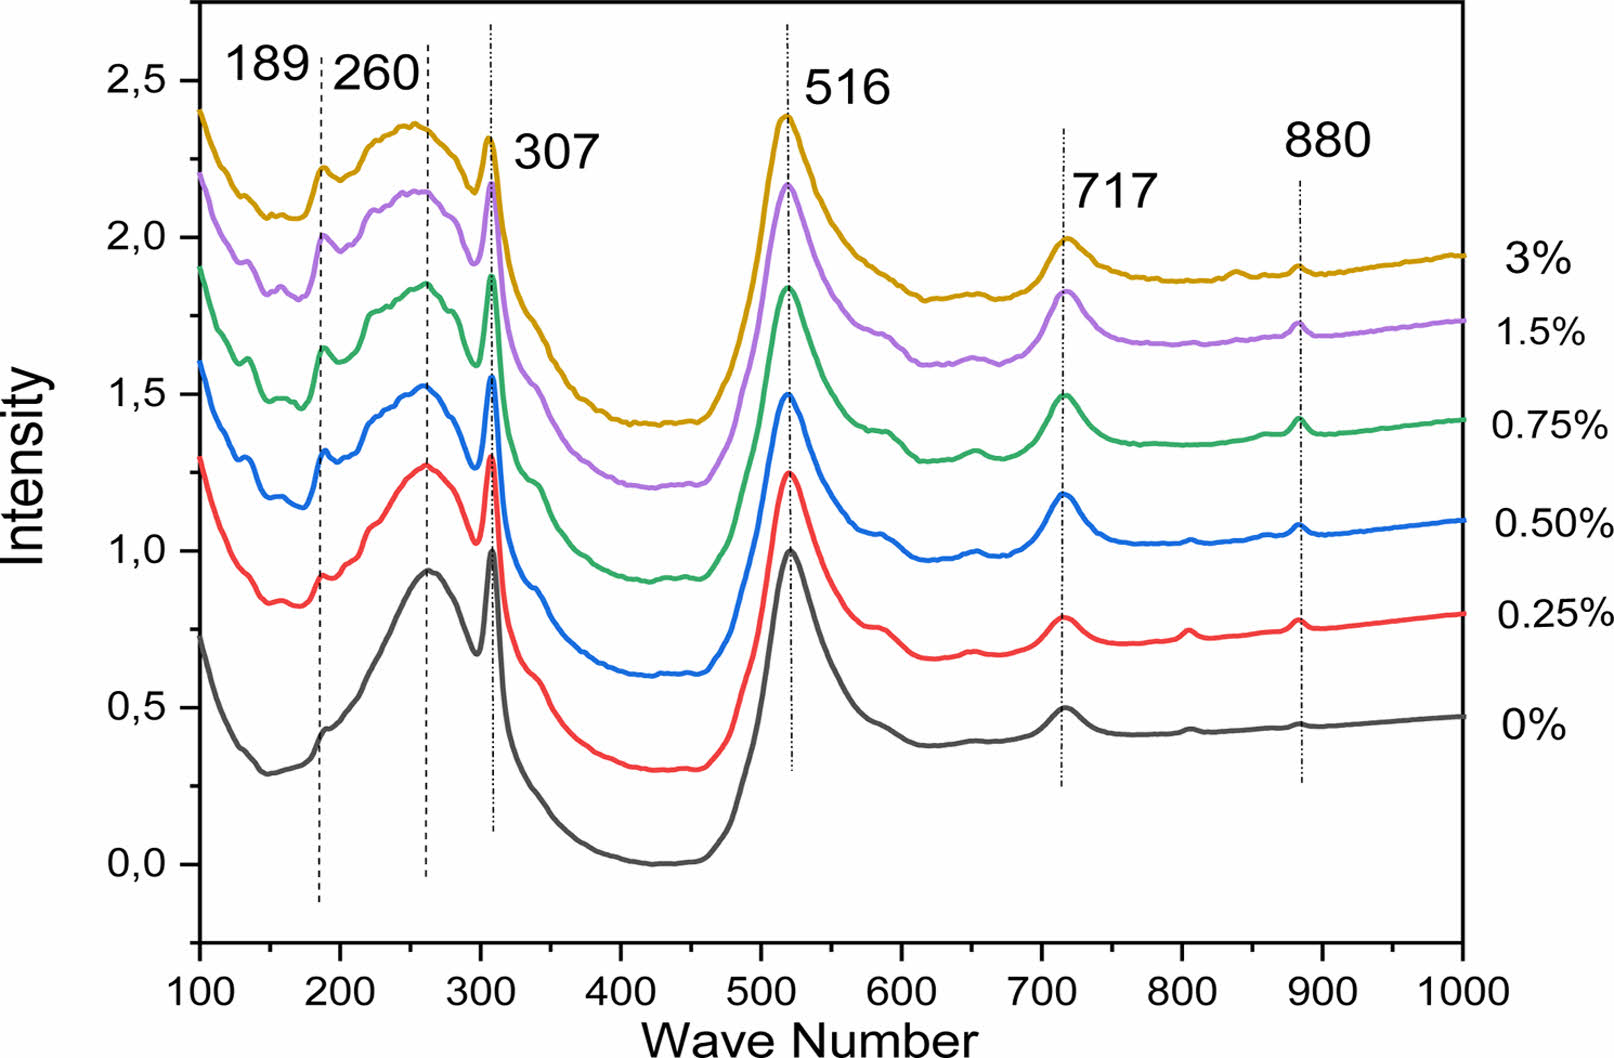
Raman spectroscopy has been used to study the expected structural phase transition in La-doped BaTiO3 samples. This technique is usefull to observe the vibration modes, rotation and other low frequencies in the system. Fig. 4 shows the Raman spectra of the Ba1-xLaxTiO3 samples recorded at room temperature as a function of the lanthanum concentration in the range of 100-1000 cm-1. It is known that in the single tetragonal crystal BT (P4mm), the Raman modes are the [A1 (TO1)] mode at 165 cm-1, the [A1 (TO2)] mode at 264 cm-1, a peak associated with [ B1, E (LO, TO)] mode at 307 cm-1, [A1(TO3)] mode at 516 cm-1 and [A1 (LO3), E (LO)] mode at 720 cm-1 [18]. Although the cubic phase theoretically does not reveal any active Raman mode, generally, Raman analysis shows broad bands around 250 and 520 cm-1, which may be caused by a local disorder associated with the position of Ti atoms [26]. In Fig. 4, most of the Raman peaks could be assigned to those of the tetragonal phase.
As revealed by the Raman spectra of the BLaxT samples (x > 0) a clear similarity with these spectra with the spectrum of the pure BT is observed, confirming the tetragonal phase of the compounds and the incorporation of La in the BT matrix. The obtained results are in a very good agreement with those of the Raman analysis of polycrystalline powders of BaTiO3 reported in the literature [27]. All the Raman spectra of the doped samples show a slight decrease of their peaks with increasing x, the presence of the clear peak at around 307 cm-1 associated with the E (TO3) + E (LO2) mode which is a characteristic peak for the tetragonal phase, and a widening of the E (LO4)/A1 (LO3) band located at 717 cm-1. These are the consequence of the presence of different types of cations and anions, namely Ba2+, La3+, Ti4+, O2-, which confirms the disordered nature of the phase, indicateng that the phase is pseudo- cubic, according to the XRD results (Table 1). The obtained results are in a good agreement with those published by Garcia et al. [28] and also with those of Elbasset et al. relative to BaSrTiO3 [29] and those of ref. [30].
Besides, the vibration mode observed at 189 cm-1 in BLaxT (x = 0) becomes intense and narrower when the lanthanum amount increases and softens with the widening of the modes A1 (TO1) and E (TO3+LO2) which indicates a decrease in the tetragonality of the compounds [11].
The strain vibration of the hydroxyl group of the BLT lattice [31] may explain the occurence of the weak peak observed at around 806 cm-1 (x > 0). In fact, shiratori et al. [32] associated this type of strain with a lattice damage. Moreover, we observed on the spectra a light band around 880 cm-1 called A1g mode. It can be noticed that this higher frequency band has been reported to exist in Ba (Ti1-xNbx)O3 [33], Ba (Ti1-yCay) O3 [34], Ba1-xLixTiO3 and (Ba1-xLax) (Ti1-x /4 −yCey) O3 [35] ceramics with aliovalent substituents, where as it has not been observed in (Ba1-xSrx) TiO3 [36] and Ba(Ti1-xZrx)O3 ceramics with isovalent substituents [37].
Therefore, the observed A1g mode is in an agreement with the obtained XRD results detailed above.
FT-IR analysis
Fourier transform infrared spectroscopy (FTIR) is generally used to: Identify and characterize unknown materials (e.g., films, solids, powders, or liquids). As this technique is sensitive to chemical bonds [38], it is used to monitor the reaction process of preparation of material and to characterize functional materials [39].
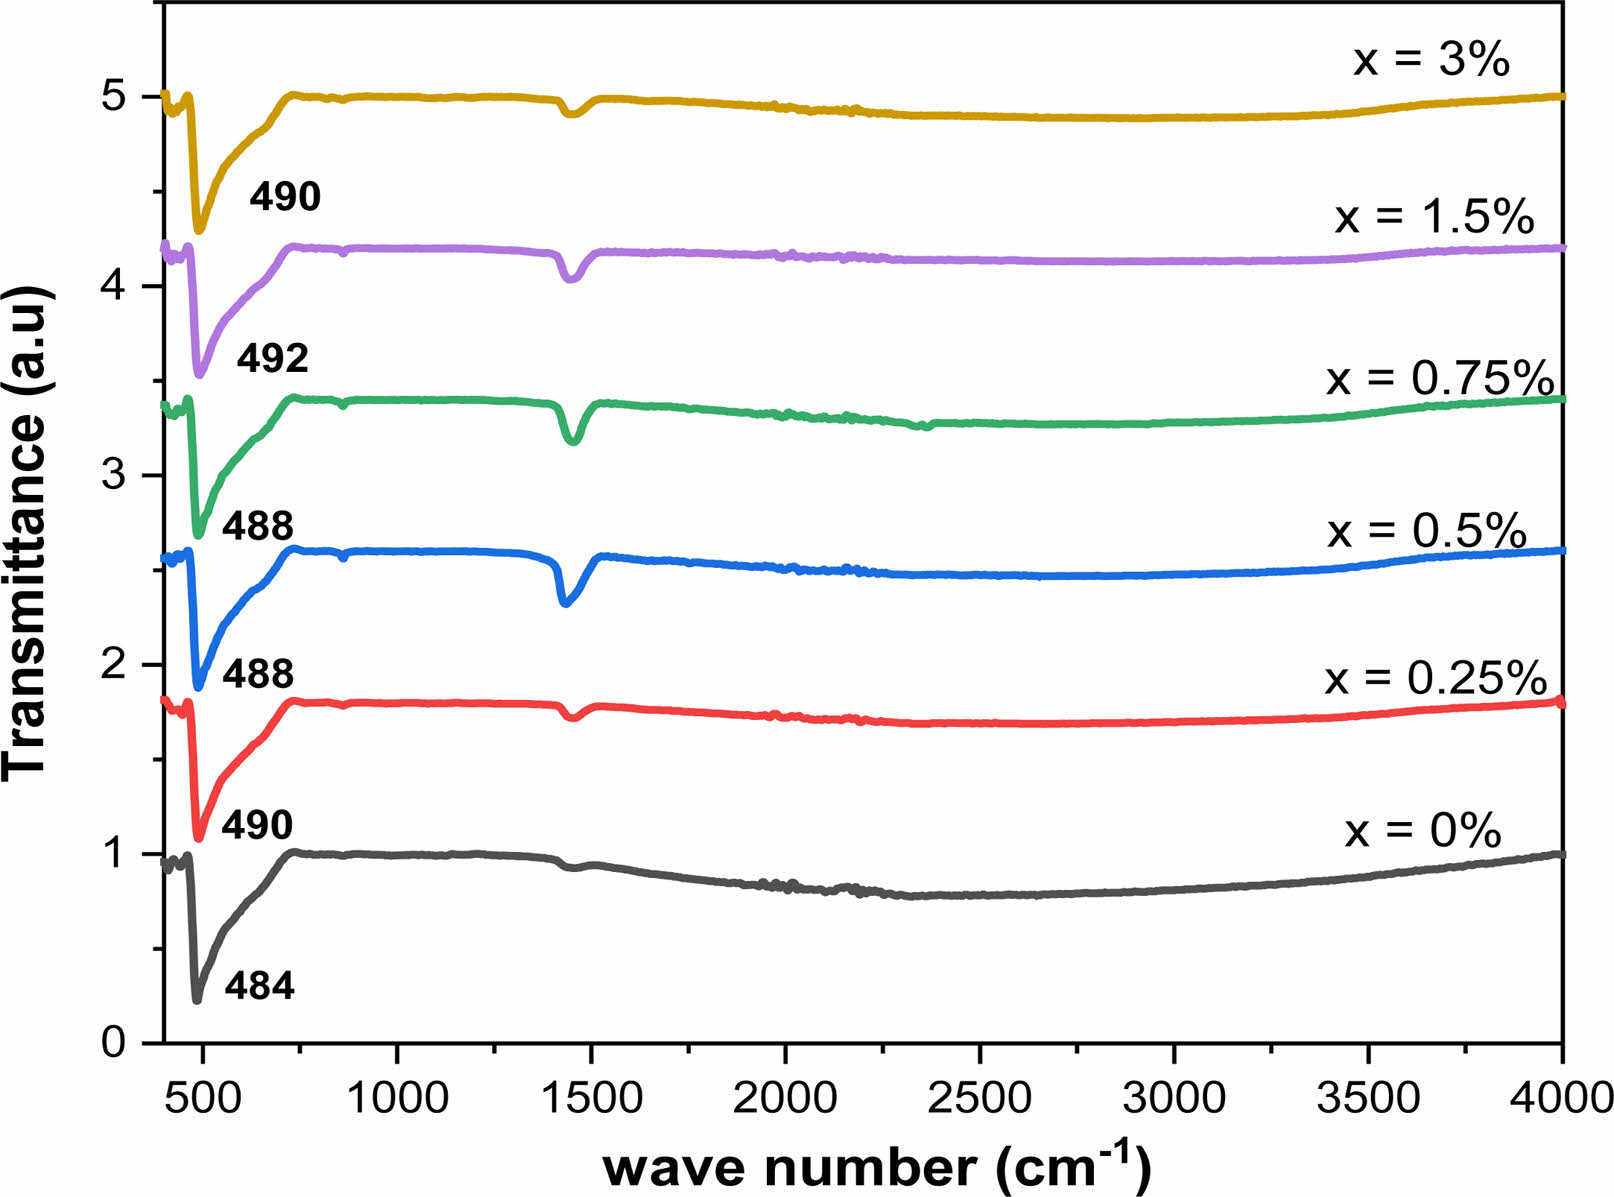
FT-IR spectra of Ba1-xLaxTiO3 powders for different La concentrations in the wavenumber range from 450 to 4000 cm-1 are displayed in Fig. 5. These spectra show two sets of absorption bands. The first one is characterized by a wide band in the low frequency range from 460 cm−1 to 730 cm−1, associated with the vibrations of the TiO6 octahedron. Moreover, all the samples show the molecular fingerprint of BaTiO3 as revealed by the Ti-O and Ti-O-Ti bonds between 460 cm-1 and 730 cm-1. The absorption peaks for the same mode of the compositions (x = 0, 0.25, 0.50, 0.75, 1.5 and 3%), were obtained at around 484, 490, 488, 488, 492 and 490 cm-1, respectively. The incorporation of Lanthanum into the BaTiO3 lattice moved the characteristic peak of Ti-O to high energy values. In our samples, the incorporation of La3+ ions into Ba2+ and Ti4+ sites influenced the binding distance betrween Ti4+ and O2- ions resulting in a high binding strength [40, 41]. In addition, the bands observed in the region from 1430 cm-1 to 1550 cm-1 could be attributed to symmetrical and antisymmetric vibrations (stretching of carboxyl groups bound to barium and / or titanium (COO−)) [42]. The results we obtained are therefore in good agreement with those of the literature [20]. The observations made on infrared spectra agree well with those revealed by XRD and Raman analyses.
Microstructure study
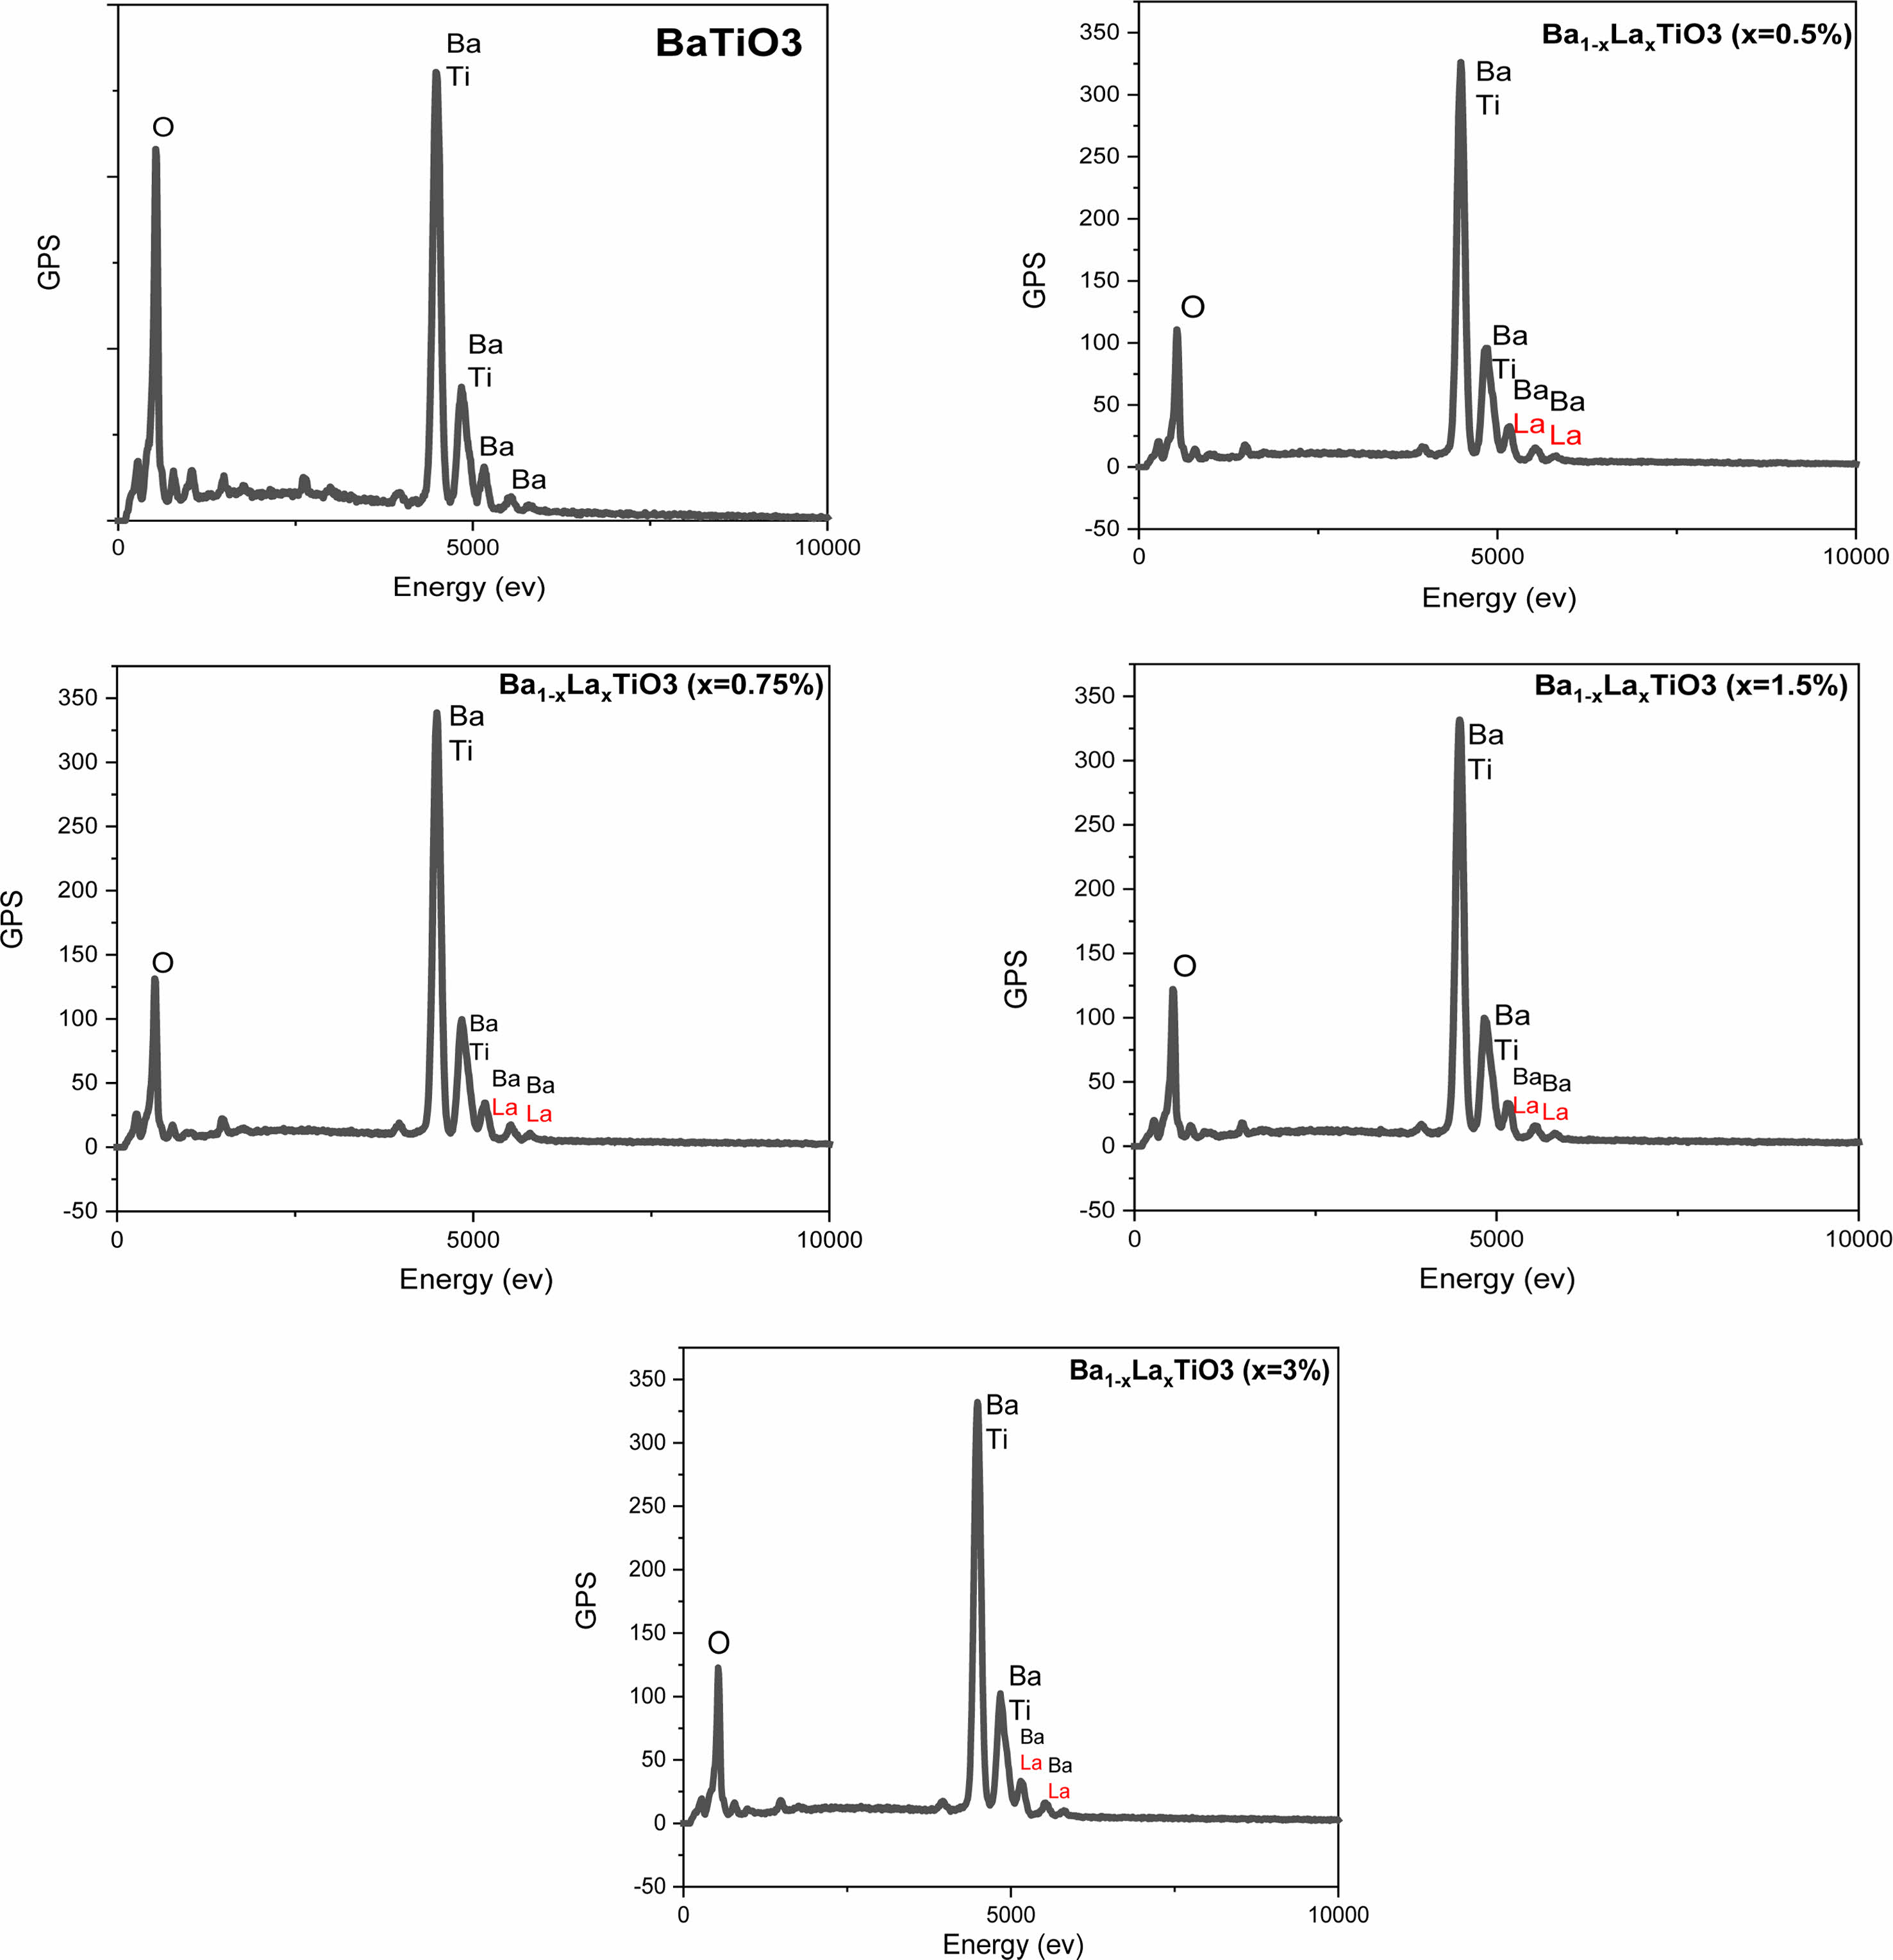
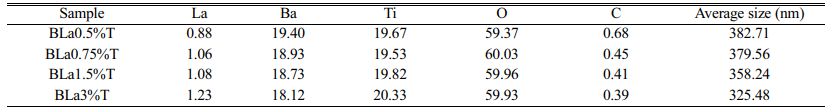
The characterization by X energy dispersive spectroscopy (EDS) of Ba1-xLaxTiO3 samples sintered at 1200 °C for 6 hours (Fig. 6) allowed us to extract the values of the parameters gathered in Table 2. These results confirm the presence of all the chemical elements Ba, La, Ti and O, and that the variation of the percentages of Ba and Ti under doping with La (Table 2) (The percentage of oxygen remains pratically constant) is in agreement with the fact that both Ba and Ti sites are occupied but with a predominance of occupation of Ti sites (Fig. 3(d)), and is concordant with XRD and Raman results.
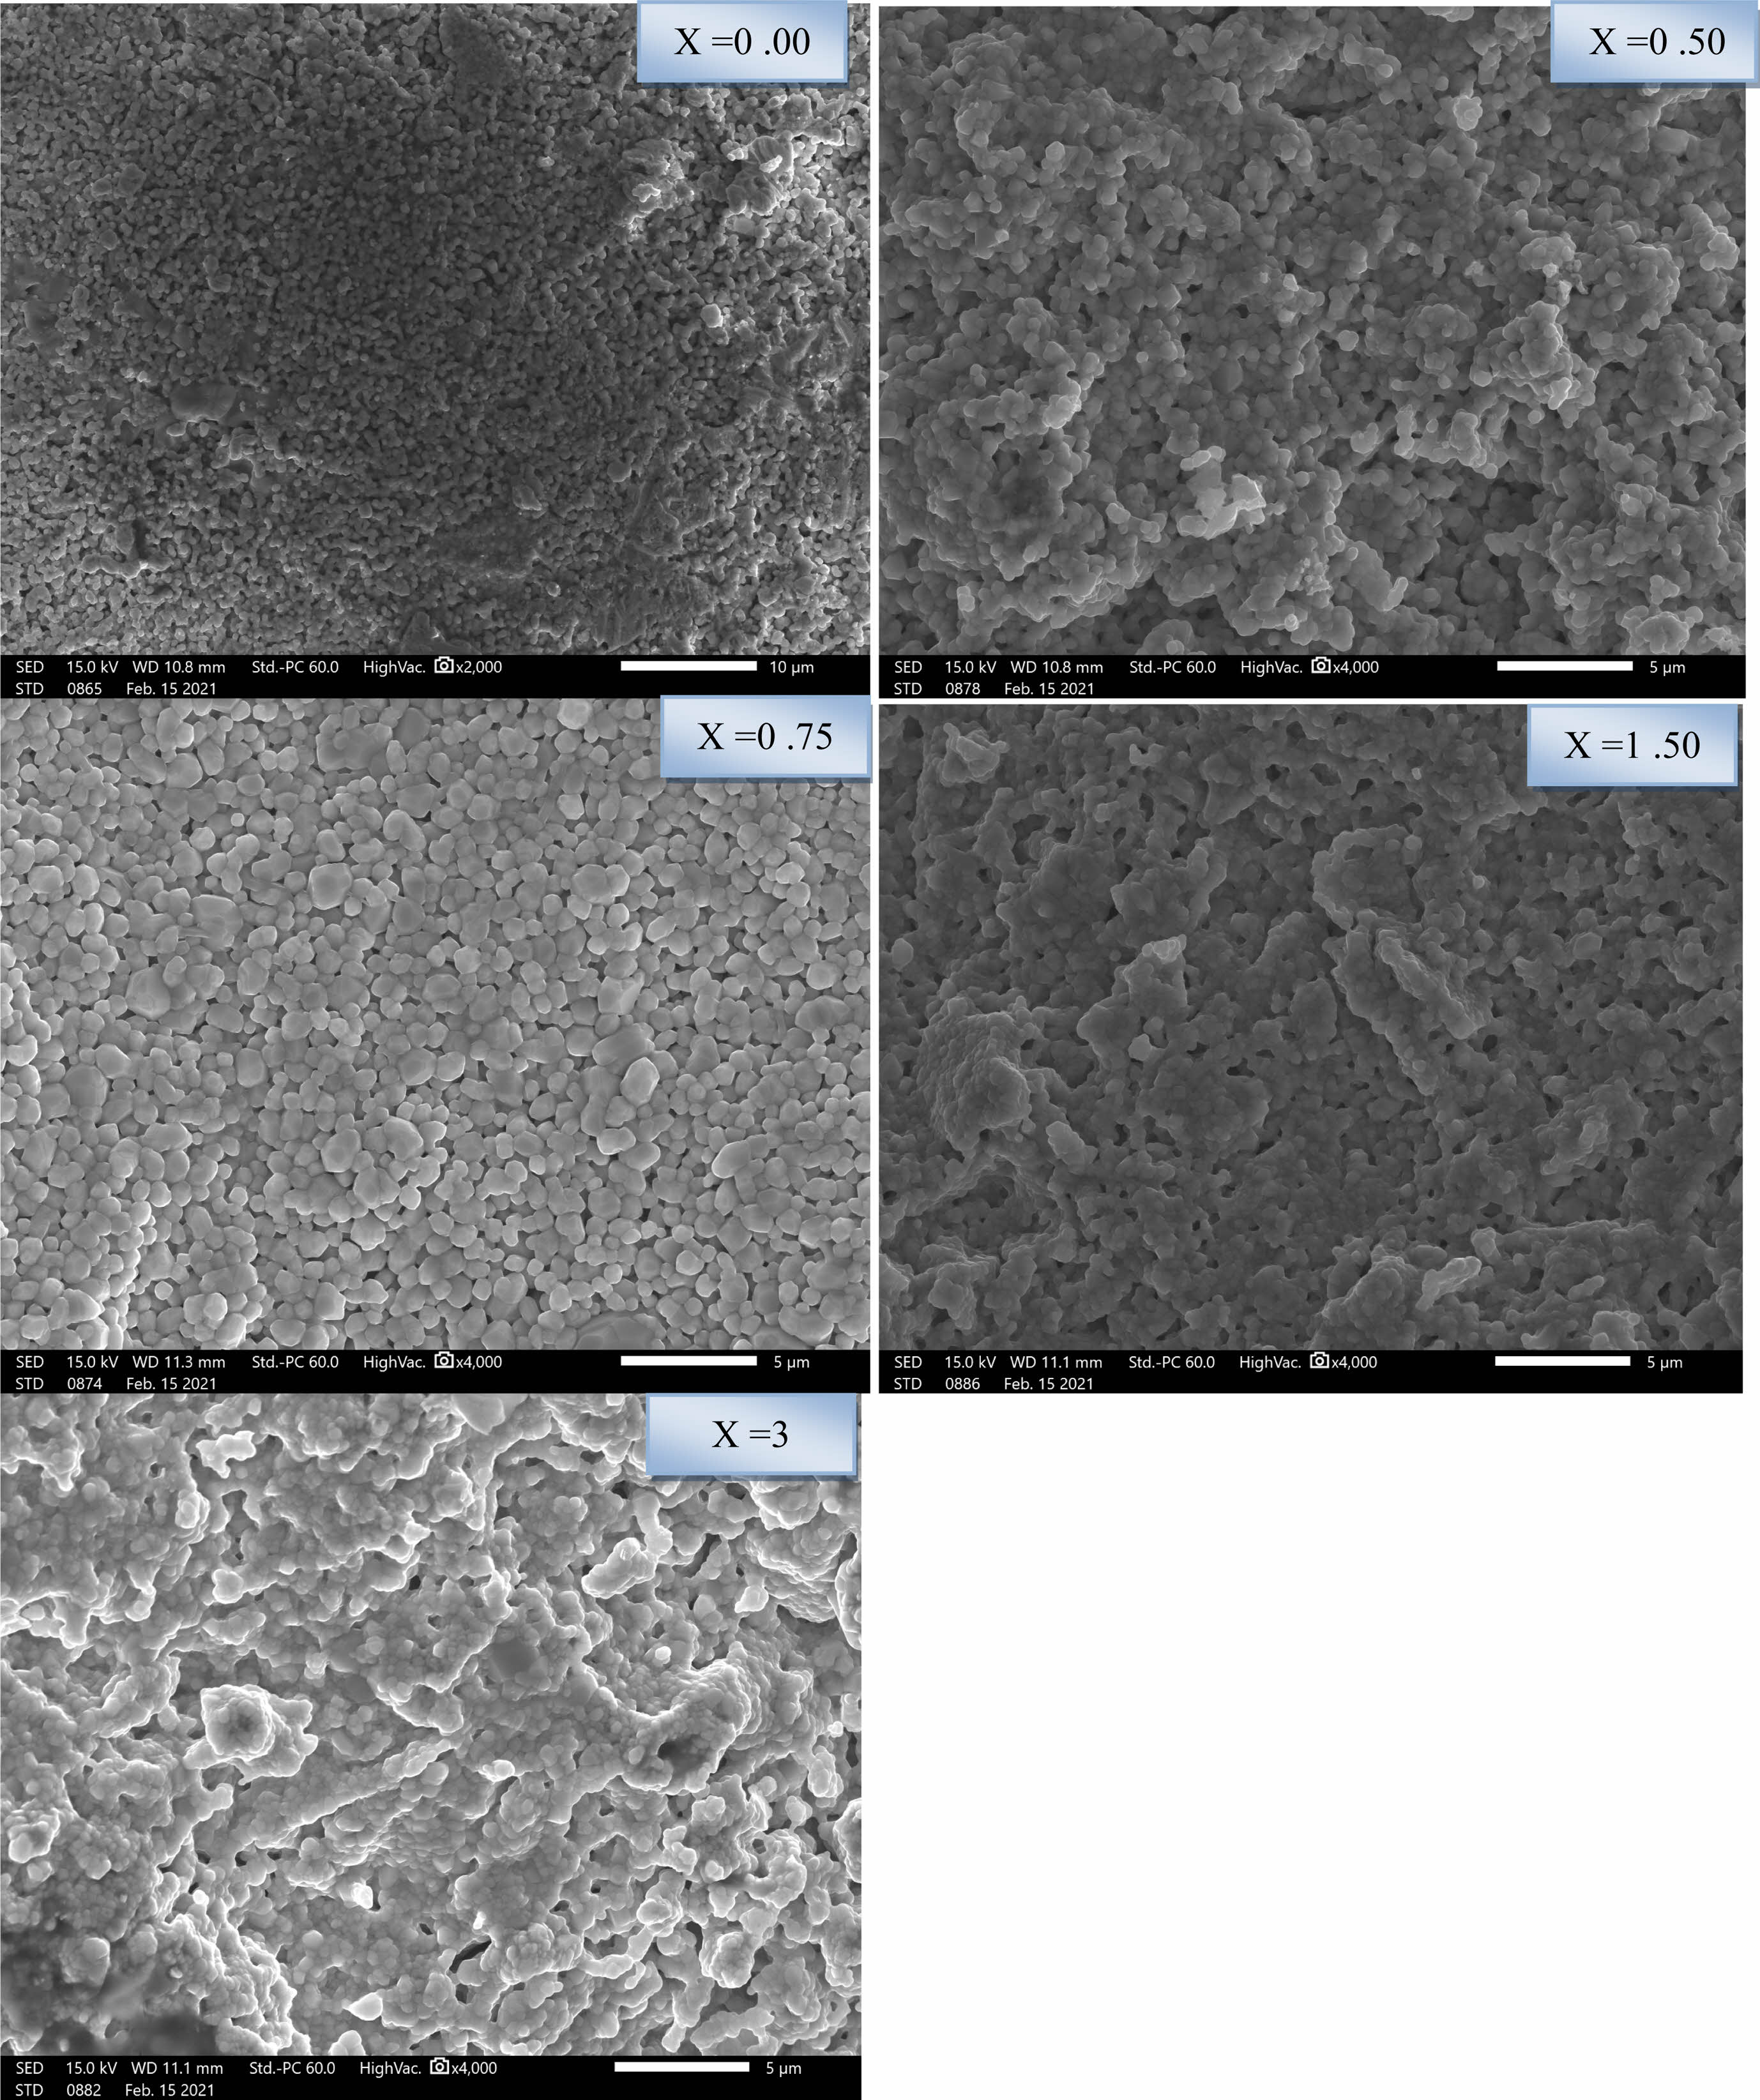
The micrographs provided by the scanning electron microscopy of BLT sintered at 1200 °C for 6 hours are given in Fig. 7. They show that the ceramics are relatively dense, homogenous and have a good repartition with fine size and almost spherical shaped particules.
The average grain size of the particules decreased under doping from around 433 nm (pure sample) to around 325 nm (sample with 3%) (Table 2). It can be noticed that the above recorded values relative to the sintered pellets are higher than those of the crystallite sizes of the calcined powders due to the sintering process which enhance the mechanical resistance of the samples and reduces the porosity within these samples giving rise to a consolidation of the particules and consequently their size.
Dielectric studies
Dielectric properties were studied on the the pelletized samples (Discs (capacitors) of about 12 mm of diameter, sintererd at 1200 °C for 6 h).
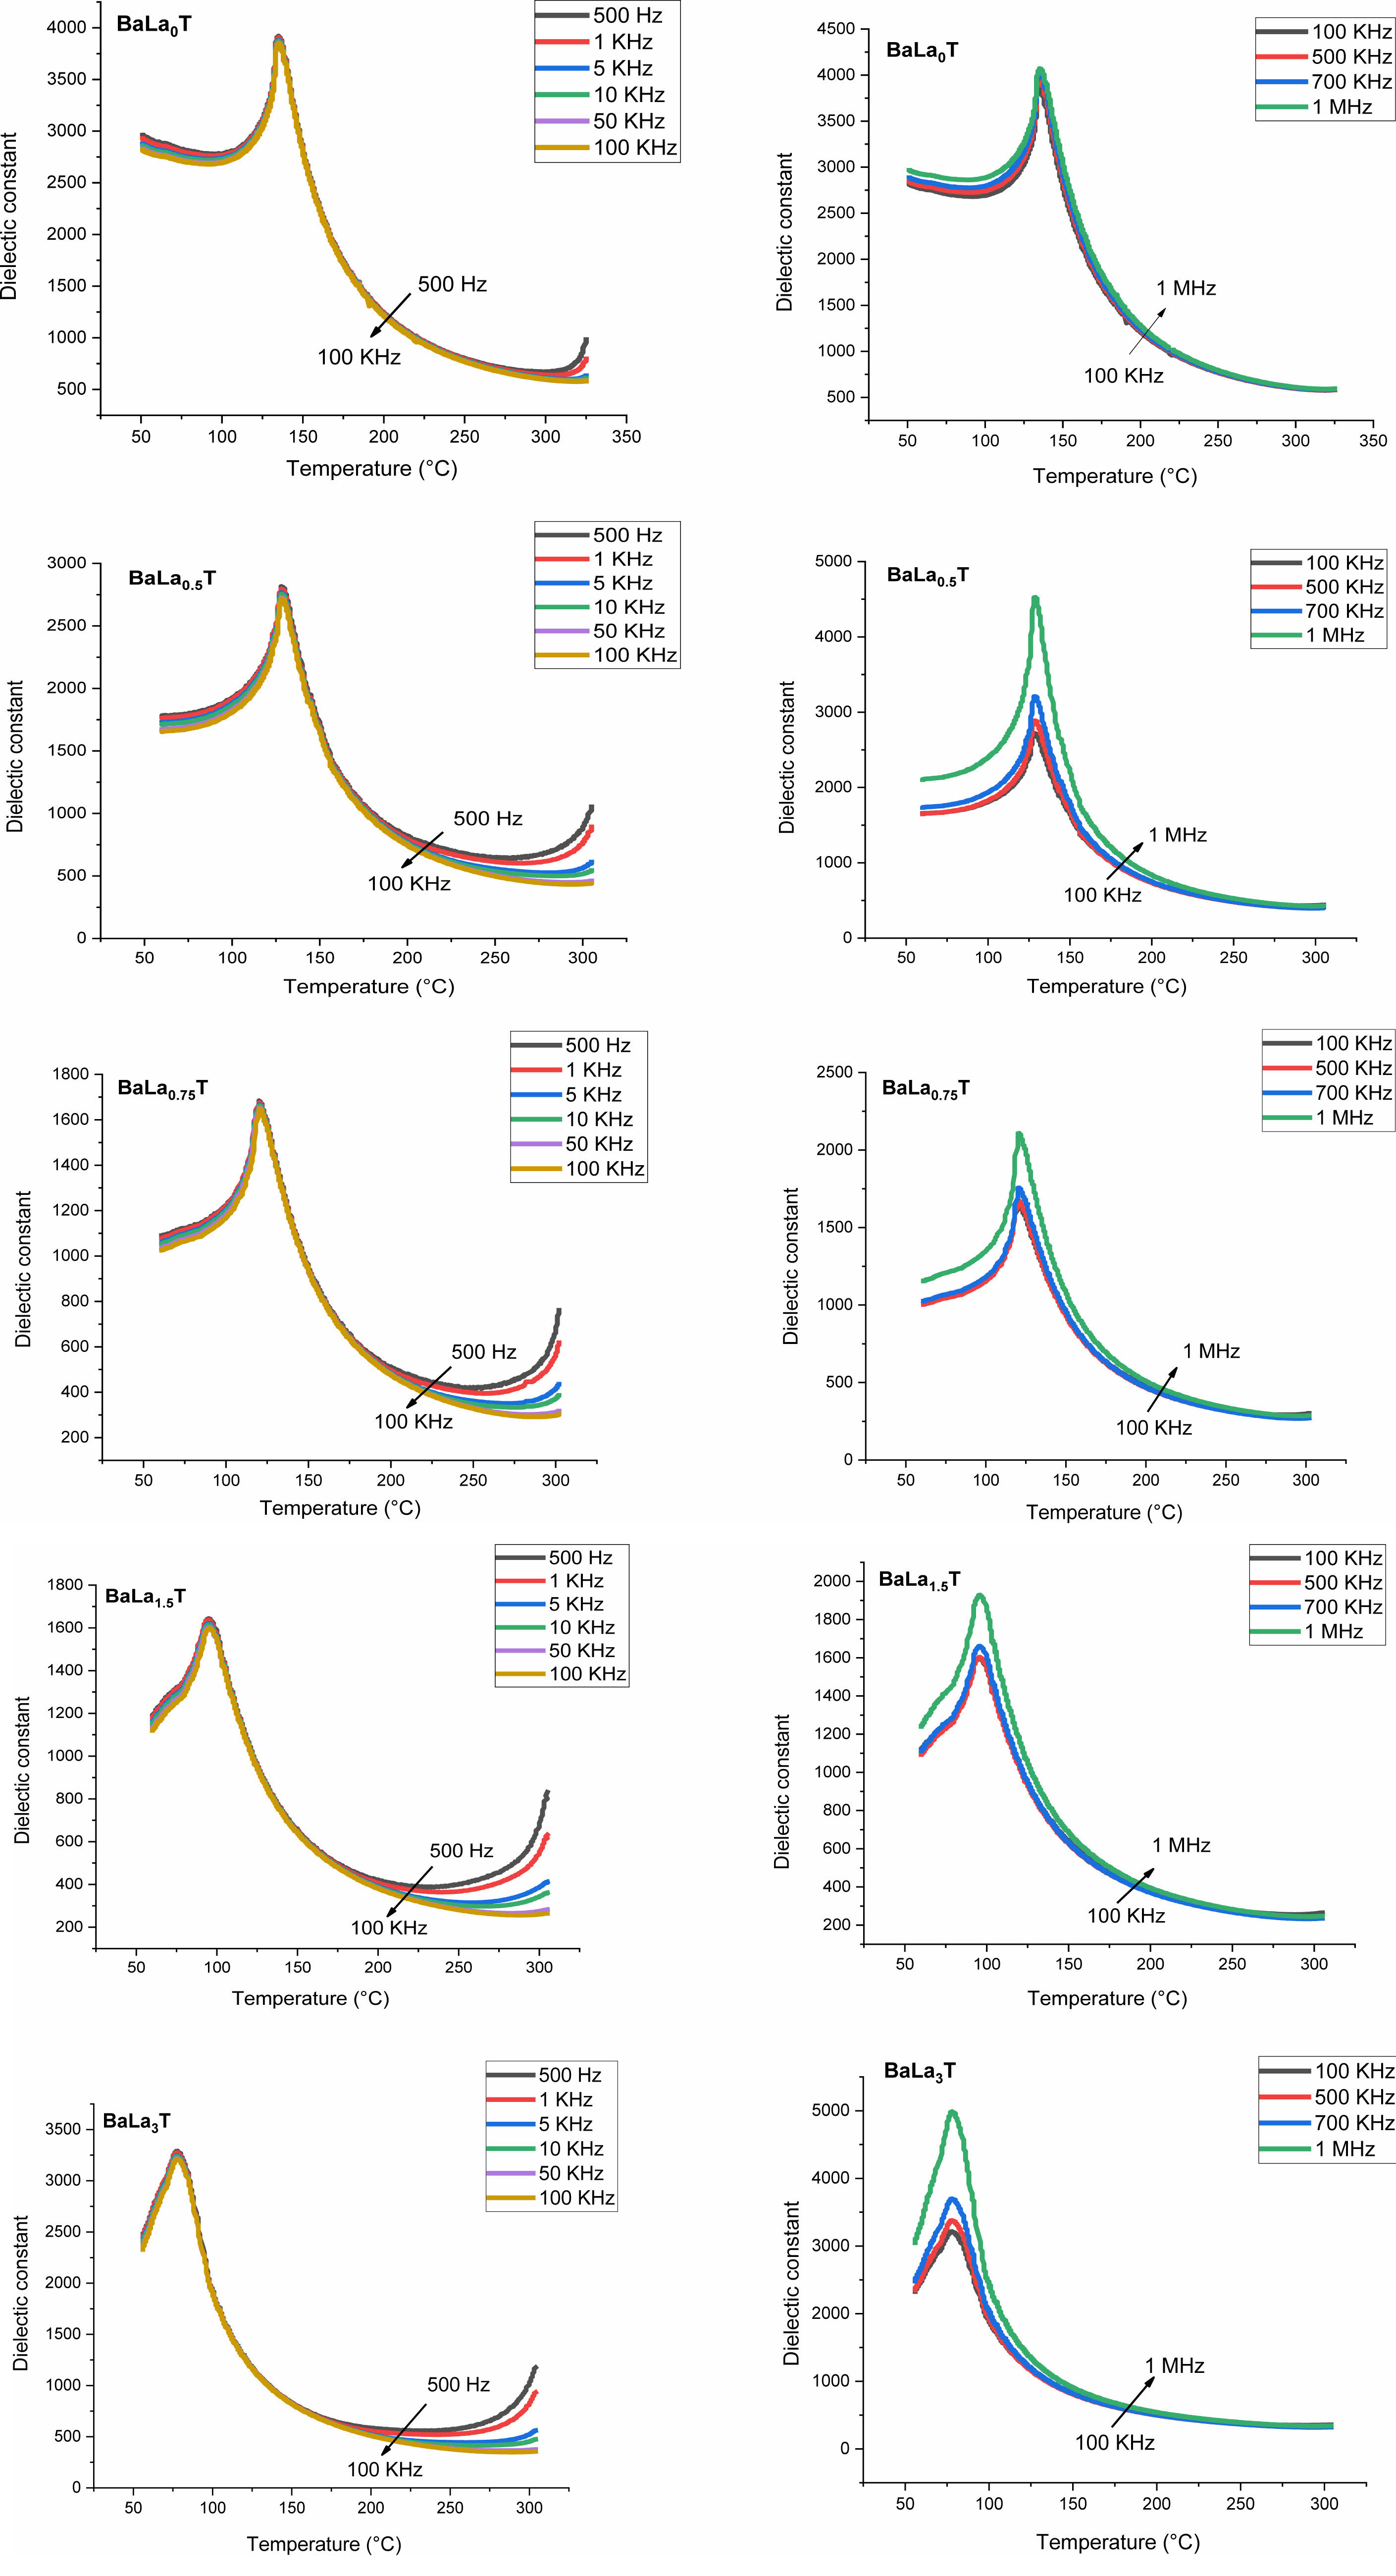
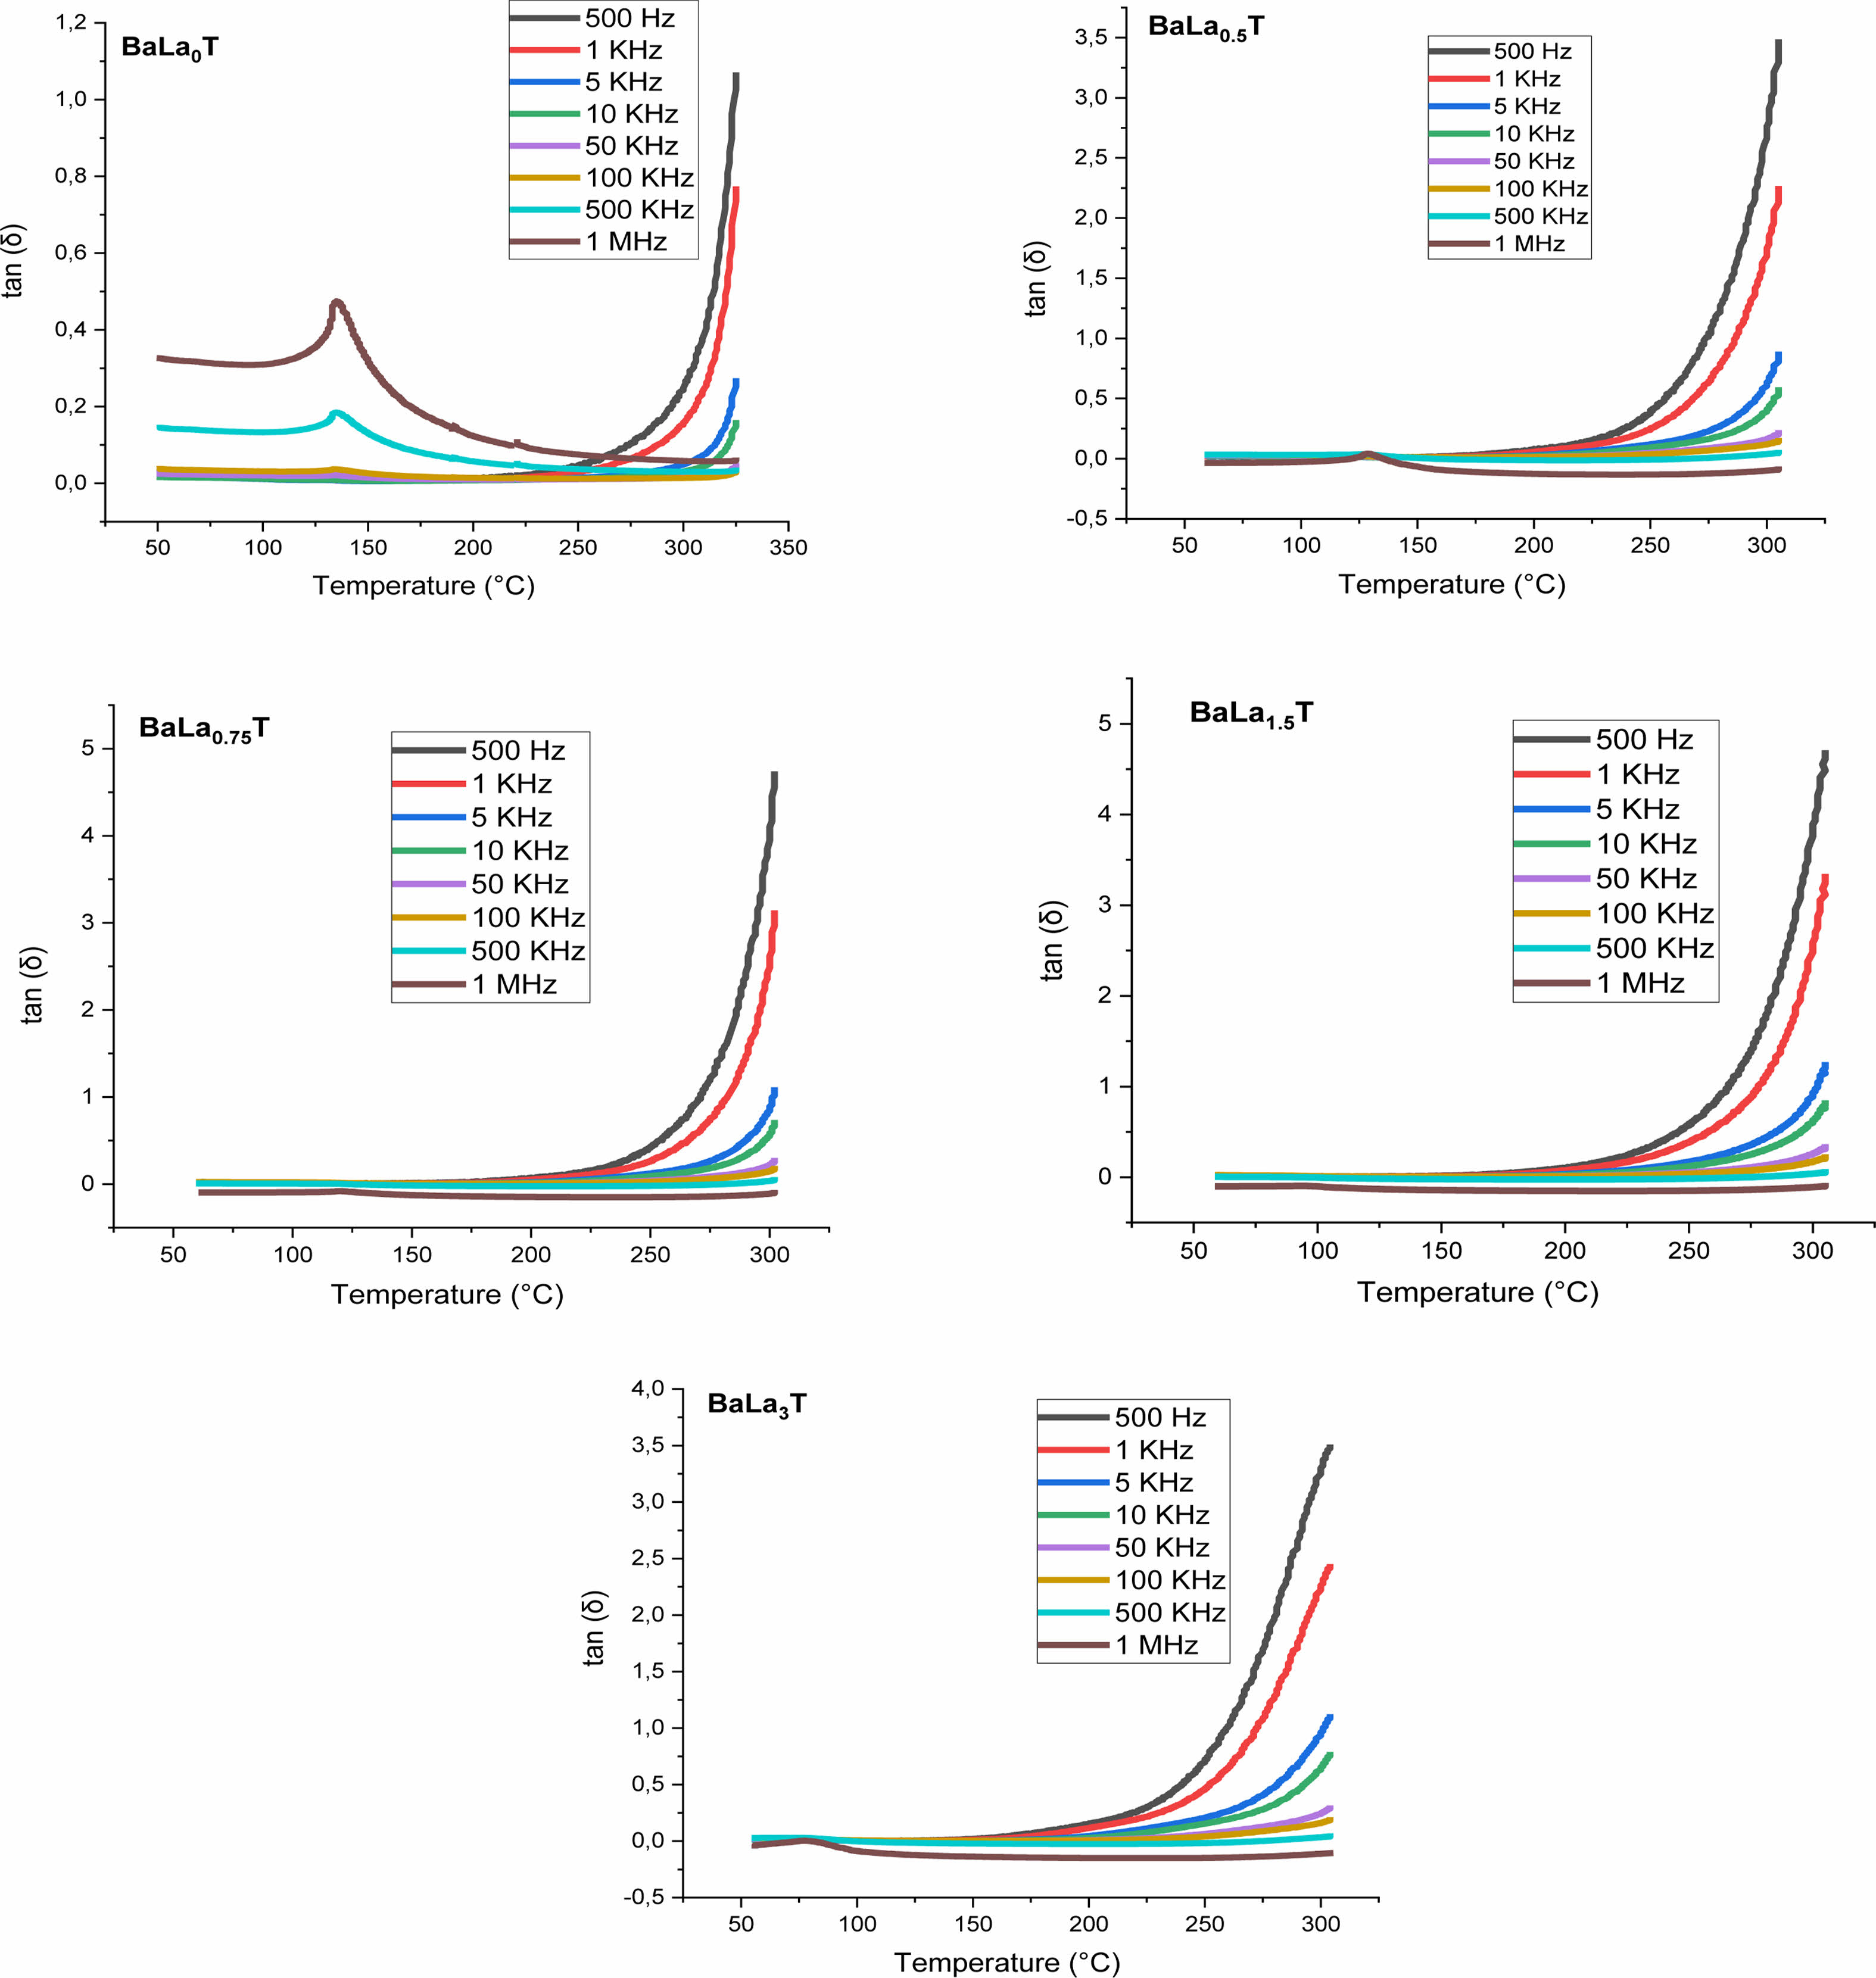
Figs. 8 and 9 show the thermal variation of the permittivity, εr, and dielectric loss, tan(δ), of the samples with x = 0, 0.5, 0.75, 1.5, 3% for the frequencies less and greater than 100 kHz, respectively.
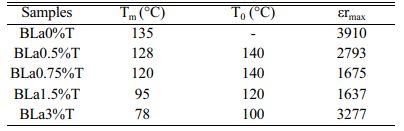
The pure BT sample behaves as a classical ferroelectric (Fig. 8) with a sharp peak corresponding to the ferro-paraelectric transition, with the Curie temperature Tc = 135 °C; when the temperature increases, the relative permittivity increases to its maximum value, εmax, corresponding to the Curie temperature Tc, which is frequency independent and at which the crystal symmetry of the sample changes from the tetragonal (ferroelectric phase) stucture to the cubic one (paraelectric phase).
The incorporation of La into the BT matrix resulted in a decrease of the Curie temperature from 135 °C (pure sample) to 78 °C (sample with x = 3%), and that a weak diffuse character took place from the concentration x = 0.75%. We also noticed that with increasing x the maximum value of the permittivity at the ferro-to- paraelectric transition (FPT) (at the temperature Tm), εmax, decreases first until x = 1.5% and then increases (Table 3); as a comparison, the values of the permittivity recorded in the present work are higher than those reported by Andreea Vasilescu et al. who prepared Ba1-xLaxTiO3 samples (0 ≤ x ≤ 8%) with the help of the sol-gel process (εrmax = 900 for the undoped sample, εrmax = 1450 for x = 8%) [43].
The strong increase of εrmax for the concentration x = 3% may be linked to the strong shift of the corresponding XRD spectrum (The peak (101) as illustration; Fig. 3(d)) to lower angles (La3+ mainly occupy Ti sites) in comparison to those corresponding to the other concentrations. This fact is also supported by SEM study, as revealed by the increase of the percentage of occupation of Ti sites compared to that of Ba ones (Table 2).
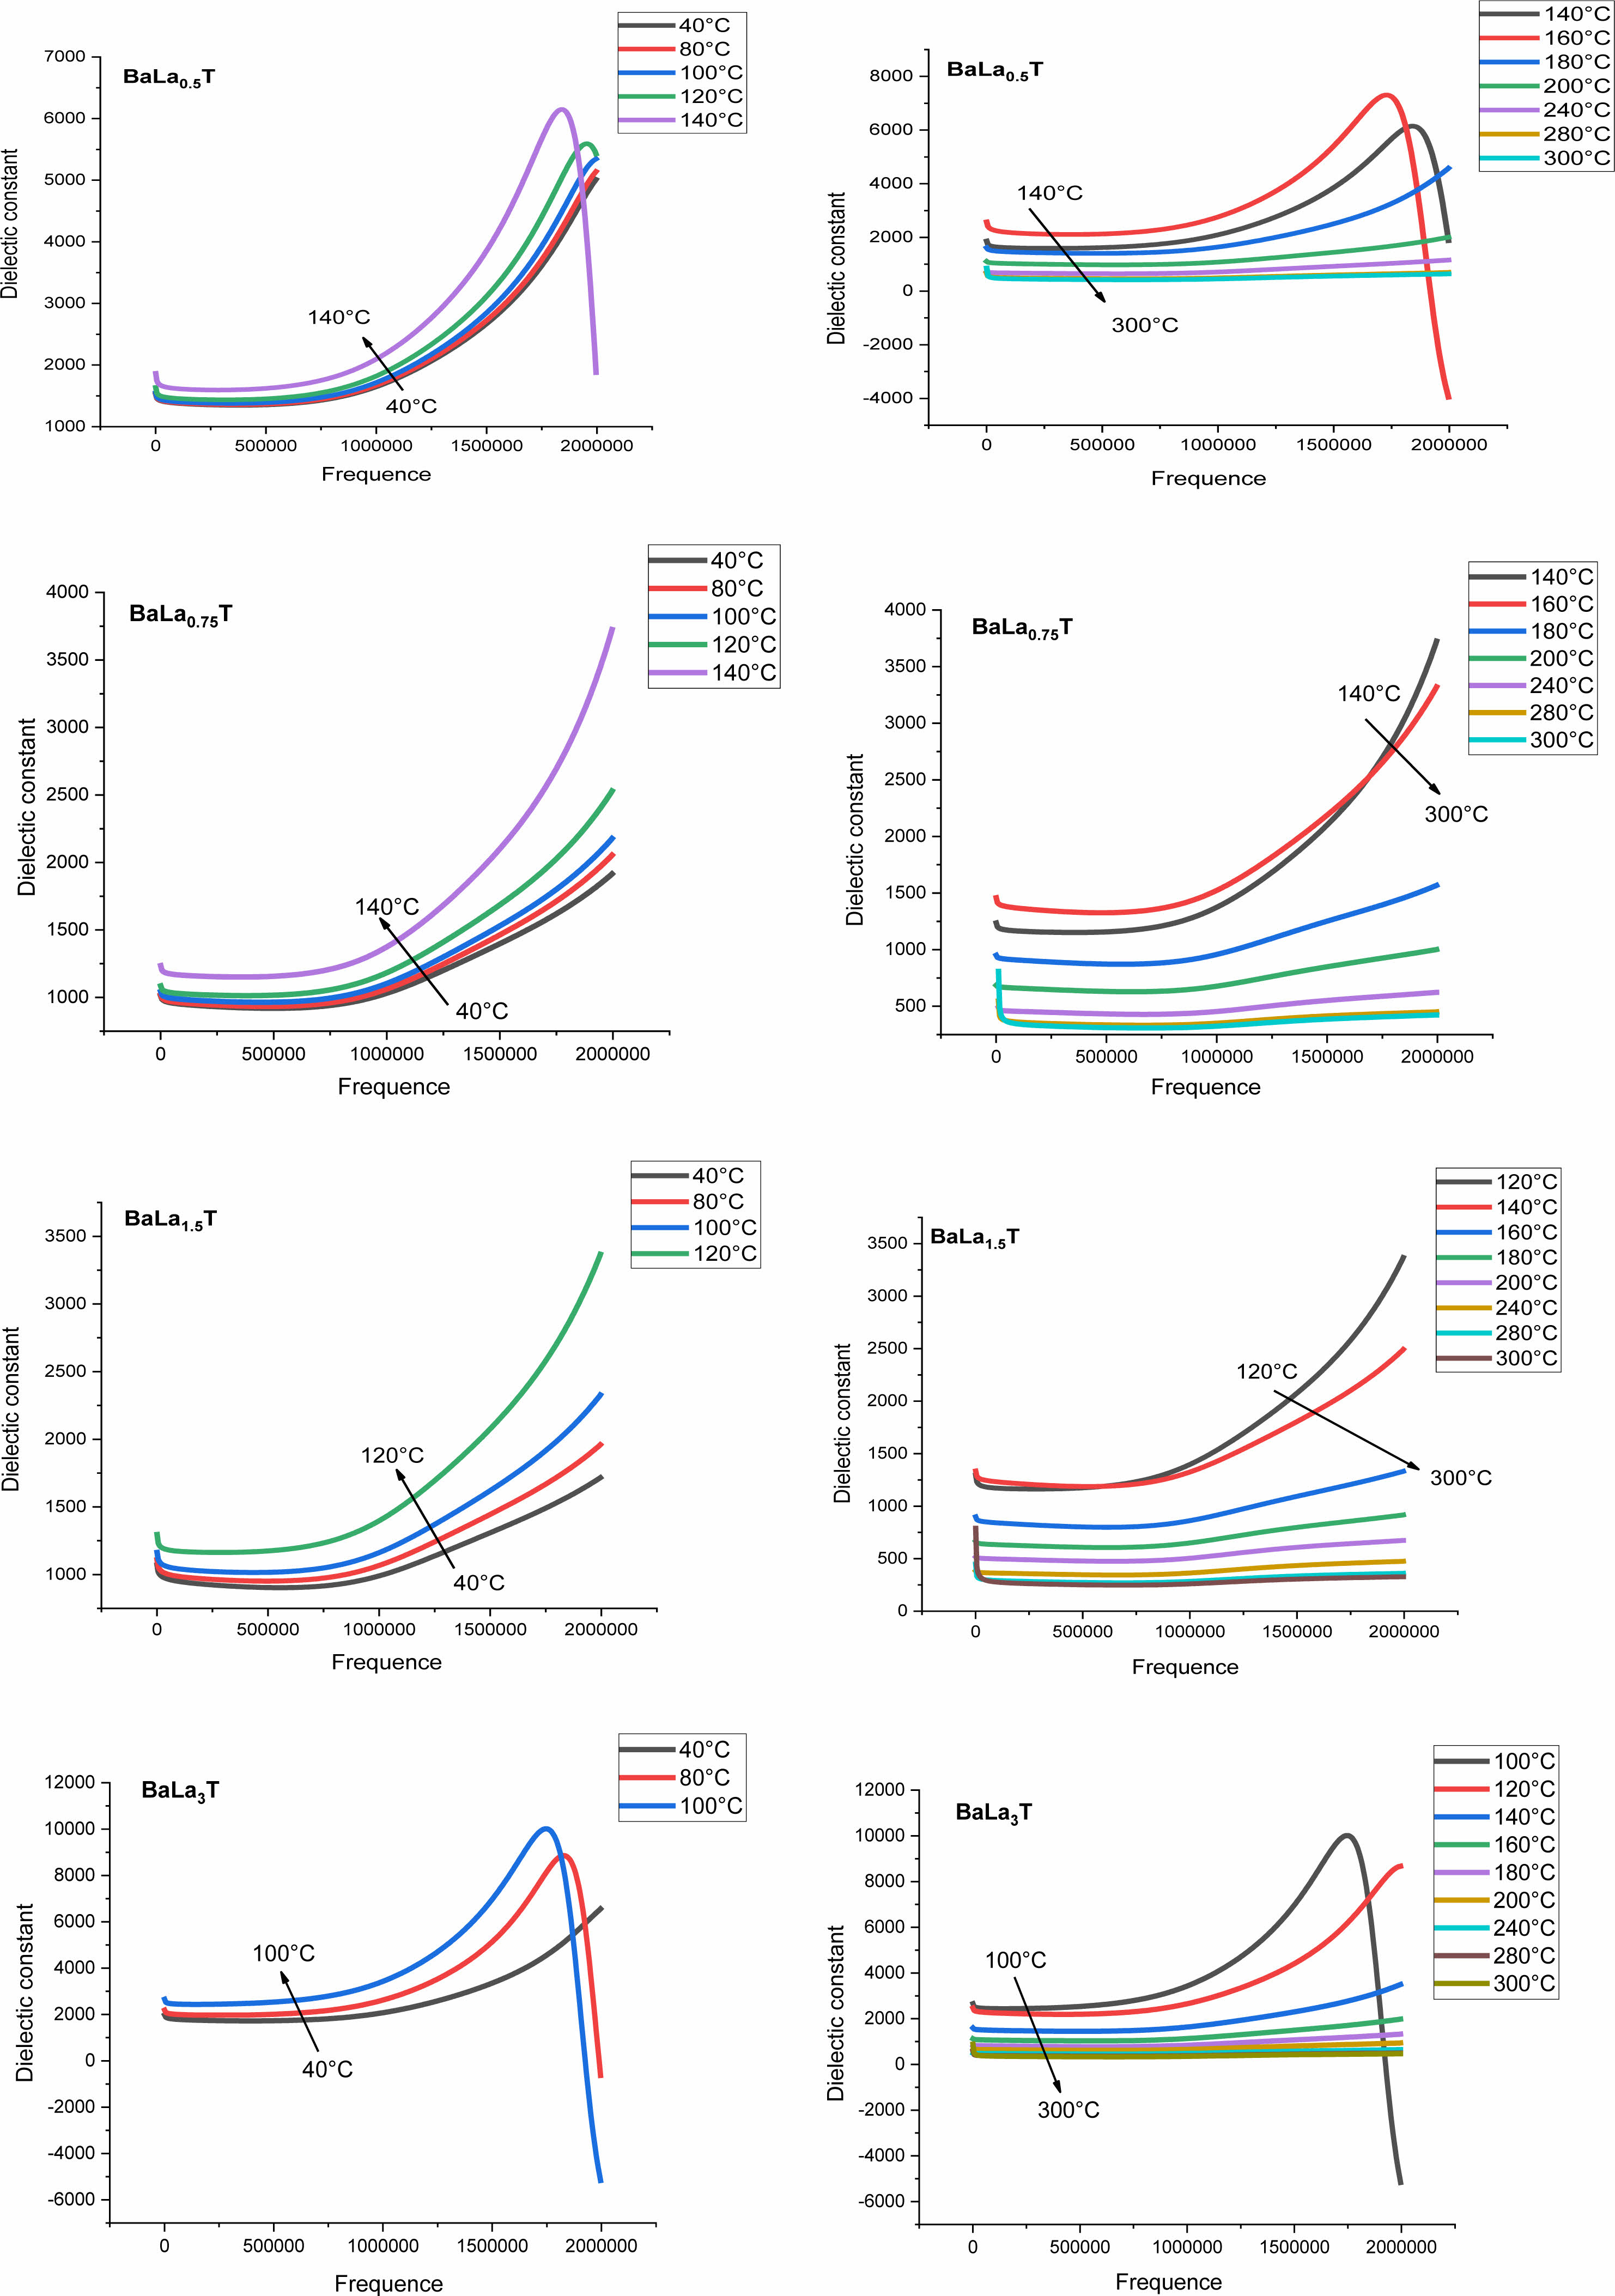
Moreover, we observed that with increasing the frequency the maximum of the permittivity (εrmax) at the FPT decreases first until the frequency f0 = 100 kHz and then increases for the frequencies superior to f0, indicating that the samples approach their resonance frequency (fr), phenomenon that in our knowledge has not been reported in La doped BaTiO3 compounds. The resonance frequency may be of a mechanical nature. In fact, these resonances are expected at very high frequencies, however the disorder consecutive to doping decreases fr as revealed by the present work. Fig. 9 displays the variations of tan(δ). It is observed that doping with La reduced strongly losses around the FPT. The increase of tan(δ) above the FPT is a normal behavior as the samples acquire a conductor character (paraelectric phase).
The frequency dependence of the permittivity curves corresponding to all the concentrations, show also that with increasing temperature and for a given frequency εr increases until the temperature T0 and then decreases (Table 3). This temperature is comparable for each concentration x in La to the Ferro to paraelectric transition temperature (Table 3, Figs. 10). This thermal behavior may provide an alternative way to prediet the FPT [44].
|
Fig. 2 TGA and DTA curves of BLa1.5T precursor gel. |
|
Fig. 3 (a) XRD patterns of La-doped BaTiO3 samples calcined at 900 °C for 4 h, (b) evolution of the cell parameters of the as-prepared BLaxT samples as function of x, (c) evolution of the crystallite size of the asprepared BLaTx samples as a function of x, (d) shifting of the peak (101). |
|
Fig. 4 Raman spectra, at room temperature (RT), of BLaxT (x = 0- 3) powder samples. |
|
Fig. 5 FTIR spectra for Ba1-xLaxTiO3 powders calcined at 900 °C for 4 h in air. |
|
Fig. 6 EDS spectrum for Ba1-xLaxTiO3 ceramic samples sintered at 1200 °C for 6 h in air. |
|
Fig. 7 SEM micrographs of Ba1-xLaxTiO3. |
|
Fig. 8 Temperature dependence of the dielectric constant of BLaxT, as a function of frequency. |
|
Fig. 9 Temperature and frequency dependences of loss tangent of BLaxT sintered at 1200 °C for 6 h. |
|
Fig. 10 Evolution of the dielectric constant, at different temperatures, as a function of the frequency for different BLaxT compositions sintered at 1200 °C. |
|
Table 1 Lattice parameters, tetragonality, unit cell volume (V) and Crystallite size of La-doped BaTiO3. |
|
Table 2 Percentage of chemical elements obtained by energy dispersive spectroscopy (EDS) and grain size of La-doped BaTiO3. |
La doped Barium titanate ceramics, with various La contents (x = 0; 0.25, 0.5; 0.75; 1.5 and 3%), were successfully produced by the sol-gel method and structurally characterized by X-Ray diffraction (XRD), Fourier Transform Infrared (FT-IR) and Raman spectroscopy. The obtained XRD spectra of the sol gel processed samples calcined at a relatively temperature (900 °C) are exempt of any secondary phase indicating a complete incorporation of La3+ in the BaTiO3 matrix; this result was also confirmed by Raman and FT-IR analysis. XRD results showed that the Lanthanum diminishes the physical parameters (lattice constants, tetragonality, volume of the unit cell and crystallite size) of the as prepared La-doped BaTiO3 ceramics. Contrary to most of the published works on La-doped BaTiO3, our investigations showed that La3+ ions can replace both Ba2+ and Ti4+ ions, a result which was also confirmed by Raman analysis (presence of the high frequency mode in the spectra) and SEM characterization (extracted EDS parameters). This site occupation of both Ba and Ti sites has been shown to influence the electrical properties of the samples, in particular their permittivity, as revealed by dielectric measurements. Moreover, dielectric investigations showed also that the La-doped BaTiO3 samples approached their frequency of resonance, which frequency is expected at high values (Giga-Hertz). To our knowledge, the simultaneous occupation of Ba and Ti sites by La atoms in La-doped BaTiO3 samples and the existence of a frequency of resonance at relatively low frequencies have not been reported.
For further understanding of the phenomena observed in the present study more samples with intermediate compositions will be prepared in the near future and their structural and physical properties investigated.
- 1. M.V. Petrović, J.D. Bobić, T. Ramoška, J. Banys, and B.D. Stojanović, Mater. Charact. 62[10] (2011) 1000-1006.
-

- 2. V.S. Puli, P. Li, S. Adireddy, and D.B. Chrisey, J. Adv. Dielect. 5[03] (2015) 1550027.
-
- 3. B.C. LaCourse and V.R. Amarakoon, J. Am. Ceram. Soc. 78[12] (1995) 3352-3356.
-
- 4. R.H. Upadhyay, A.P. Argekar and R.R. Deshmukh, J. Bull. Mater. Sci. 37[3] (2014) 481-489.
-
- 5. B.H. Devmunde, S.B. Somwanshi, P.B. Kharat, and M.B. Solunke, J. Phys. 1644[1] (2020) 012055.
-
- 6. G.D.O. Santiago Santos, F.D.O. Freitas Bergamaski, L.G. Magalhaes, K.I.B. Eguiluz, J.C.A.D. Santos, D.V. Sampaio and G.R. Salazar-Banda, J. Nanosci. Nanotechnol. 20[2] (2020) 1033-1038.
-
- 7. W. Zhang, J. Yang, F. Wang, X. Chen, and H. Mao, Ceram. Int. 47[4] (2021) 4486-4492.
-
- 8. M. Rizwan, I. Zeba, M. Shakil, S.S.A. Gillani, and Z. Usman, Optik 211 (2020) 164611.
-
- 9. R. Bahloul, S. Sayouri, K. Limame, M.M. Yahyaoui, B. Jaber, and L. Laanab, J. Ceram. Process. Res. 18[4] (2017) 329-335.
- 10. H.F. Cheng, T.F. Lin, C.T. Hu, and I.N. Lin, J. Am. Ceram. Soc. 76[4] (1993) 827-832.
-
- 11. M. Ganguly, S.K. Rout, C.W. Ahn, I.W. Kim, and M. Kar, Ceram. Int. 39[8] (2013) 9511-9524.
-
- 12. A. El Ghandouri, S. Sayouri, T. Lamcharfi, and A. Elbasset, J. Adv. Dielect. 9[3] (2019) 1950026.
-
- 13. Y. Tsur, A. Hitomi, I. Scrymgeour, and C.A. Randall, J. Appl. Phys. 40.1R (2001) 255-258.
-
- 14. M. Belhajji, S. Sayouri, A. Nfissi, and T. Lamcharfi, J. Mater. Sci. 30[17] (2019) 16065-16079.
-
- 15. M. Lanki, A. Nourmohammadi, S.M.H. Feiz and E.R. Adarmanabadi, J. Ceram. Process. Res. 17[4] (2016) 394-400.
- 16. A. Nfissi, Y. Ababou, S. Sayouri, L. Mrharrab, F. Saadaoui, E. Ech-chamikh, and T. Lamcharfi, J. Ceram. Process.Res. 21[2] (2020) 233-239.
-
- 17. A. Moghtada and R. Ashiri, Ultrason Sonochem 33(2016) 141-149.
-
- 18. A. Salhi, S. Sayouri, L. Hajji and T. Lamcharfi, J. Ceram. Process. Res. 17[12] (2016) 1236-1242.
- 19. M.R. Mohammadi and D.J. Fray, Particuology 9[3] (2011) 235-242.
-
- 20. A. Mahmood, A. Naeem, Y. Iqbal, T. Mahmood, and A. Ullah, J. Mater. Sci.: Mater. Electron. 26[8] (2015) 5635-5644.
-
- 21. C.A. Stanciu, M. Cernea, E.C. Secu, G. Aldica, P. Ganea, and R. Trusca, J. Alloys Compd. 706 (2017) 538-545.
-
- 22. J. Xue, J. Wang, and D. Wan, J. Am. Ceram. Soc. 83[1] (2000) 232-234.
-
- 23. J. Zhang, J. Zhai, X. Chou, J. Shao, X. Lu, and X. Yao, Acta Mater. 57[15] (2009) 4491-4499.
-
- 24. S. Lee, W.H. Woodford, and C.A. Randall, Appl. Phys. Lett. 92[20] (2008) 201909.
-
- 25. U. Holzwarth and N. Gibson, Nat. Nanotechnol. 6[9] (2011) 534-534.
-
- 26. U.D. Venkateswaran, V.M. Naik, and R. Naik, Phys. Rev. B. 58[21] (1998) 14256.
-
- 27. F. Krimech, S. Sayouri, and T. Lamcharfi, J. Ceram. Process. Res. 18[7] (2017) 536-542.
- 28. F. Conzález Garcia, C.R. Foschini, J.A. Varela, E. Longo, F. Moura, and A.Z. Simões, Process. Appl. Ceram. (2011) 205-213.
-
- 29. A. Elbasset, F. Abdi, T. Lamcharfi, S. Sayouri, and M. Aillerie. IREPHY. 7[3] (2013) 287-293.
- 30. Y. Liu, Y. Feng, X. Wu, and X. Han, J. Alloys Compd. 472.1-2 (2009) 441-445.
-
- 31. T. Noma, S. Wada, M. Yano, and T. Suzuki, J. Appl. Phys. 80[9] (1996) 5223-5233.
-
- 32. Y. Shiratori, C. Pithan, J. Dornseiffer, and R. Waser, J. Raman Spectrosc. 38[10] (2007) 1288-1299.
-
- 33. R. Farhi, M.El Marssi, A. Simon, and J. Ravez, Eur. Phys. J. B. 18[4] (2000) 605-610.
-
- 34. M.C. Chang and S.C. Yux, J. Mater. Sci. Lett. 19 (2000) 1323-1325.
-
- 35. D.Y. Lu, X.Y. Sun, and M. Toda, J. Phys. Chem. Solids 68[4] (2007) 650-664.
-
- 36. A.E. Ghandouri, S. Sayouri, T. Lamcharfi, and L.Hajji, J. Ceram. Process. Res. 19[2] (2018) 154-170.
- 37. P.S. Dobal, A. Dixit, R.S. Katiyar, Z. Yu, R. Guo, and A.S. Bhalla, J. Raman Spectrosc. 32[1] (2001) 69-71.
-
- 38. K. Babooram and Z.G. Ye, J. Mater. Chem. 18[2] (2006) 532-540.
-
- 39. R. Asiaie, W. Zhu, S. A. Akbar, and P.K. Dutta, J. Mater. Chem. 8[1] (1996) 226-234.
-
- 40. M. Ganguly, S. K. Rout, C.W. Ahn, I.W. Kim, and M. Kar, Ceram. Int. 39[8] (2013) 9511-9524.
-
- 41. W. Wang, L. Cao, W. Liu, G. Su, and W. Zhang, Ceram. Int. 39[6] (2013) 7127-7134.
-
- 42. E. Sanchez, T. Lopez, and R.J. Gomez, J. Solid State Chem. 122[2] (1996) 309-314.
-
- 43. C.A. Vasilescu, M. Cernea, S.E. Corina, G. Aldica, P. Ganea, and R. Trusca, J. Alloys Compd. 706 (2017) 538-545.
-
- 44. R. Ranjan, D. Pandey, W. Schuddinck, O. Richard, P. De Meulenaere, J. Van Landuyt, and G. Van Tendeloo, J. Solid State Chem. 162[1] (2001) 20-28.
-
 This Article
-
2022; 23(5): 570-582
Published on Oct 31, 2022
- 10.36410/jcpr.2022.23.5.570
- Received on Sep 28, 2021
- Revised on Jan 28, 2022
- Accepted on Jul 21, 2022
Services
Shared
Correspondence to
- Salaheddine Sayouri
-
LPAIS, Faculty of Sciences-DM, USMBA, B.P. 1796, Fez-Atlas, Morocco
Tel : +212 6 73 78 52 88 Fax: +212 535 73 33 49 - E-mail: ssayouri@gmail.com
Clean-Energy Research Institute(CRI), Hanyang University, 222, Wangsimni-ro, Seongdong-gu, Seoul, 04763, Korea
E-mail: jcpr@hanyang.ac.kr