


- Influence of cowpat ash particles on micro structure, mechanical and tribological properties of Al 7075 composites
B. Varuna,*, S. Gopib and R. Manikandanc
aAssistant Professor, Department of Mechanical Engineering, Sri Ramakrishna Institute of Technology, Coimbatore 641 010, Tamil Nadu, India
bAssociate Professor, Department of Production Engineering, Government College of Technology, Coimbatore 641 013, Tamil Nadu, India
cAssistant Professor, Department of Mechatronics Engineering, Sri Krishna College of Engineering and Technology, Coimbatore 641 008, Tamil Nadu, IndiaThis article is an open access article distributed under the terms of the Creative Commons Attribution Non-Commercial License (http://creativecommons.org/licenses/by-nc/4.0) which permits unrestricted non-commercial use, distribution, and reproduction in any medium, provided the original work is properly cited.
In the current study the effects of reinforcing cowpat ash (CPA) in aluminium 7075 alloy are briefly reported. CPA was reinforced in varying the weight percentage by 3, 6 and 9 using double stir casting technique. The effects of CPA particles are analysed and compared with base material through physical and tribological behaviours. Bonding and distribution of CPA particles were examined by optical microscope and scanning electron microscope. Mechanical and tribological properties was carried out in produced samples. The micro structural images disclosed that the CPA particles were uniformly distributed in the aluminium matrix. The fabricated composite materials density was decreasing while increasing CPA particles, but on the other hand the porosity was increasing. The ultimate tensile strength and hardness of samples increased up to 6% of CPA reinforcement and extra addition in particles has reduced their strength. The base alloy exhibited better impact strength than the composite material. Maximum decrease in wear rate was attained at 6% CPA reinforcement. The fracture SEM images exhibited cracks, voids, dimples for tensile and impact specimens and micro cuttings, micro ploughing in the worn-out surface. The corrosion rate decreased with increase in CPA particles
Keywords: Double stage stir casting, Optical & SEM microscope, Mechanical and tribological properties, Fractured and worn SEM analysis.
In an engineering application when coming to weight strength ratio, aluminium alloys are mostly preferred. To improvise the strength of alloy many techniques can be adopted like, heat treatment process, adding reinfor- cements to form metal matrix (MMCs), cryogenic treatment, coating on the surface etc. MMCs has been preferred by the researchers in most automotive and aerospace applications. Mostly the Aluminium MMCs, has been used in different automobile parts such as engine blocks, pistons, brake drum, connecting rods, etc. since the weight and cost are low when compared with other alloys. Dry sliding wear between metal-to-metal like cam shaft, bearings, gears and different applications including sliding contact or rolling contact.
Metal matrix composites can be developed in many ways namely, stir casting, powder metallurgy, diffusion bonding, vapour deposition pressure die casting and infiltration process.
Stir casting is accepted as the most flexible route among various fabrication techniques such as Squeeze casting, Compo casting and Powder metallurgy etc. Prior to the fabrication of composite, some vital parameters like stirring speed, stirring time, melt temperature, holding time, stirrer location, design, movement of the stirrer, preheating of die, powder feed rate and reinfor- cements etc., can be considered. The optimum selection of these parameters decides the properties of composite material. The advantages of using stir casting techniques are simplicity, flexibility, applicability to large quantity production, minimizes the final cost of the product and very resourceful technique among the other methods. The major drawback in stir casting technique is that reinforcements get segregated during solidification. The dispersion of the reinforcements rely on wettability between the particles and the alloy, solidification rate and density of the particles. To overcome the above listed discrepancies an interesting method called as double stage/two stage stir casting is adapted. Aluminium MMCs offer excellent strength and wear properties than the Al-alloy regardless of load and sliding speed. It is essentially because of the way that the hard carbides like SiC, WC, TiC etc., which makes it plastically compelled and enhances the hardness, tensile strength, compressive strength, high temperature resistance, wear and corrosion resistance of the base material [1-23].
The present scenario in MMCs is utilizing the agro waste and reinforcing them instead of hard ceramic particles. Research works has been carried out in reinforcing agro waste has reinforcements and promising results have been reported. Few of the agro waste which have been considered has reinforcements are rice husk ash, sugarcane ash, baboo ash, ground nut ash etc. Mohd et al. (2019) evaluated the effects of rice husk ash by reinforcing different weight fraction in aluminium matrix. Microstructure exhibited even distribution of RHA in the matrix. Density was increased upto 5% and reduced at higher percentage [43]. Kawin et al. (2019) evaluated the properties of 9% bagasse ash on turning operation. Taguchi L9 optimization was used by changing the parameters like speed, cutting depth and feed. The multi-performance objective resulted in decrease of surface roughness from 5.57 to 5.417 µm [44]. Venkatesh et al. (2019) have reinforced ground nut shell ash and boron carbide at different composition and found that increase in agro waste has reduced hardness and tensile property in composite materials when compared to base material [45].
Shamim et al. (2017) fabricated aluminium (Al-Si-Mg-Ti) composites by reinforcing egg shell which was varied by 0.5, 1.5 and 3 wt%. It was found that at low percentage of reinforcement the tensile strength has reduced than the base alloy due to formation of rosette grouping in the matrix but while increasing the per- centage an increase in the tensile strength was inferred in the material [46]. Raju et al. (2019) evaluated wear at elevated temperature of Al 1100 reinforced with 5, 10 and 15% CSA by volume fraction through stir casting technique. The specific strength has increased gradually and the maximum was attained at 15% CSA reinfor- cements. The lowest wear rate was identified at higher percentage of reinforcements up to 8 N/mm2 pressure and increase in pressure has increased the rate of wear at higher temperature. The coefficient of friction increased initially and gradually decreased with increase in CSA particles. The particles in the matrix are identified by XRD and EDAX analysis [47]. Natrayan et al. (2018) evaluated the properties in reinforcing different leaves along with SiC in Al6061. The SiC was kept constant at 1.5 wt% in grams and the other leaf ashes are varied at 0.75 wt% in grams. The density of hybrid composites reduced compared to aluminium. The hardness and strength have raised in specimens and maximum increase in properties was found to be for 1.5% SiC and 0.75% BLA. A gradual decrease in wear rate was found for hybrid composites and extreme reduction in wear rate was achieved by reinforcing BLA particles [48].
Aneis Maasyirah Hamzah et al. reinforced RHA in ceramic blocks and found that the physical properties have increased [49]. Do Quang Minh et al. investigated rice husk and silica gel at different ratios to form SiC/ SiO2-C composite. The best result was attained at 1.4/1 ratio for advanced friction system applications. It is been concluded that rice husk waste can improve the economic value of rice plant [50]. Nithyanandhan et al. developed hybrid composite material by reinforcing bamboo steam ash and aluminium oxide in Al 6063 through stir casting technique. The percentage of reinfor- cements were varied and their mechanical properties have enhanced when compared with the base alloy [51]. Based on the literature survey its evident that effective utilization of agro waste particles can pave the way in producing composite material at light weight, low cost, high strength, high performance and eco-friendly aluminium MMCs in aeronautical and automotive applications [24-51].
An experimental attempt has been done in reinforcing cowpat in the form of ash particles in aluminium 7075 alloy. Aluminium 7075 are extensively utilised in auto- mobile, aeronautical, sporting, electric and electronic industries. Cowpat are selected because of various reasons namely, low density, huge availability, low cost and eco-friendly. CPA contains elements like silicon oxide, aluminium oxide, iron oxide, magnesium oxide etc., which will improve the properties of aluminium. The proportions of CPA reinforcements are differed and their influences in the matrix are examined through microstructure, mechanical, wear and corrosion testing. The fabricated samples are tested for identifying the density, porosity, hardness, ultimate tensile strength, impact strength, wear and corrosion and are compared with Al 7075. The causes of failure in fractured specimens for tensile, impact and worn-out surface are identified and analysed through SEM images.
Material selection
Aluminium 7075 was purchased in rod form and its chemical composition is identified through spectro analysis and the predictions are given in Table 1. The raw cowpat is collected from the nearby cow stable. The raw cow feces are flattened and dried out in daylight for two days to remove the wetness. The dried CPA are crushed and converted into particles and burnt to produce ash. Further to eliminate the carbonous constituents existence in CPA ash it was heated at 600 oC for two hours in a muffle furnace. The produced reinforcement was screened in a sieving machine and it was found that the size of the particles are less than 40 microns. X ray fluorescent analysis was carried out for the produced CPA particles and the chemical composition are given in Table 2.
Fabrication process
Fabrication was done using an electric furnace to melt the aluminium and double stage stir casting method was adopted to produce composite materials. Double stage stir casting method provides good distribution of particles in matrix alloy and also it assists in bonding of particles with matrix alloy than the conventional stir casting method. Aluminium alloy was melted at 750 oC and CPA was preheated at 300 oC in a muffle furnace to increase the wettability and also to avoid rejection of particles in the matrix. Aluminium was melted and brought down to semi solid stage and then the particles were reinforced and manually stirred for ten minutes. The reinforced semi solid slurry is again melted and a four-bladed mechanical stirrer made of bronze was used for stirring the molten composite material for ten minutes.
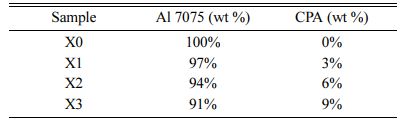
The above procedure is carried out for different composition of CPA particles has given in Table 3. The weight composition of CPA was selected and finalised based on the results obtained during pilot experiments. The reinforcement less than 3 wt% did not show any appreciable improvement in impact strength and the reinforcement greater than 9 wt% led to agglomerations in the castings. So, the addition of reinforcement was varied from 3% to 9 wt%.
The samples are produced by transferring the melt into a steel split die having a dimension of 100 × 100 × 10 mm. The fabricated composite samples were machined to form different specimens using an electric discharge machine to identify the effects of CPA on mechanical and tribological properties.


Microstructure analysis of CPA in AMCs
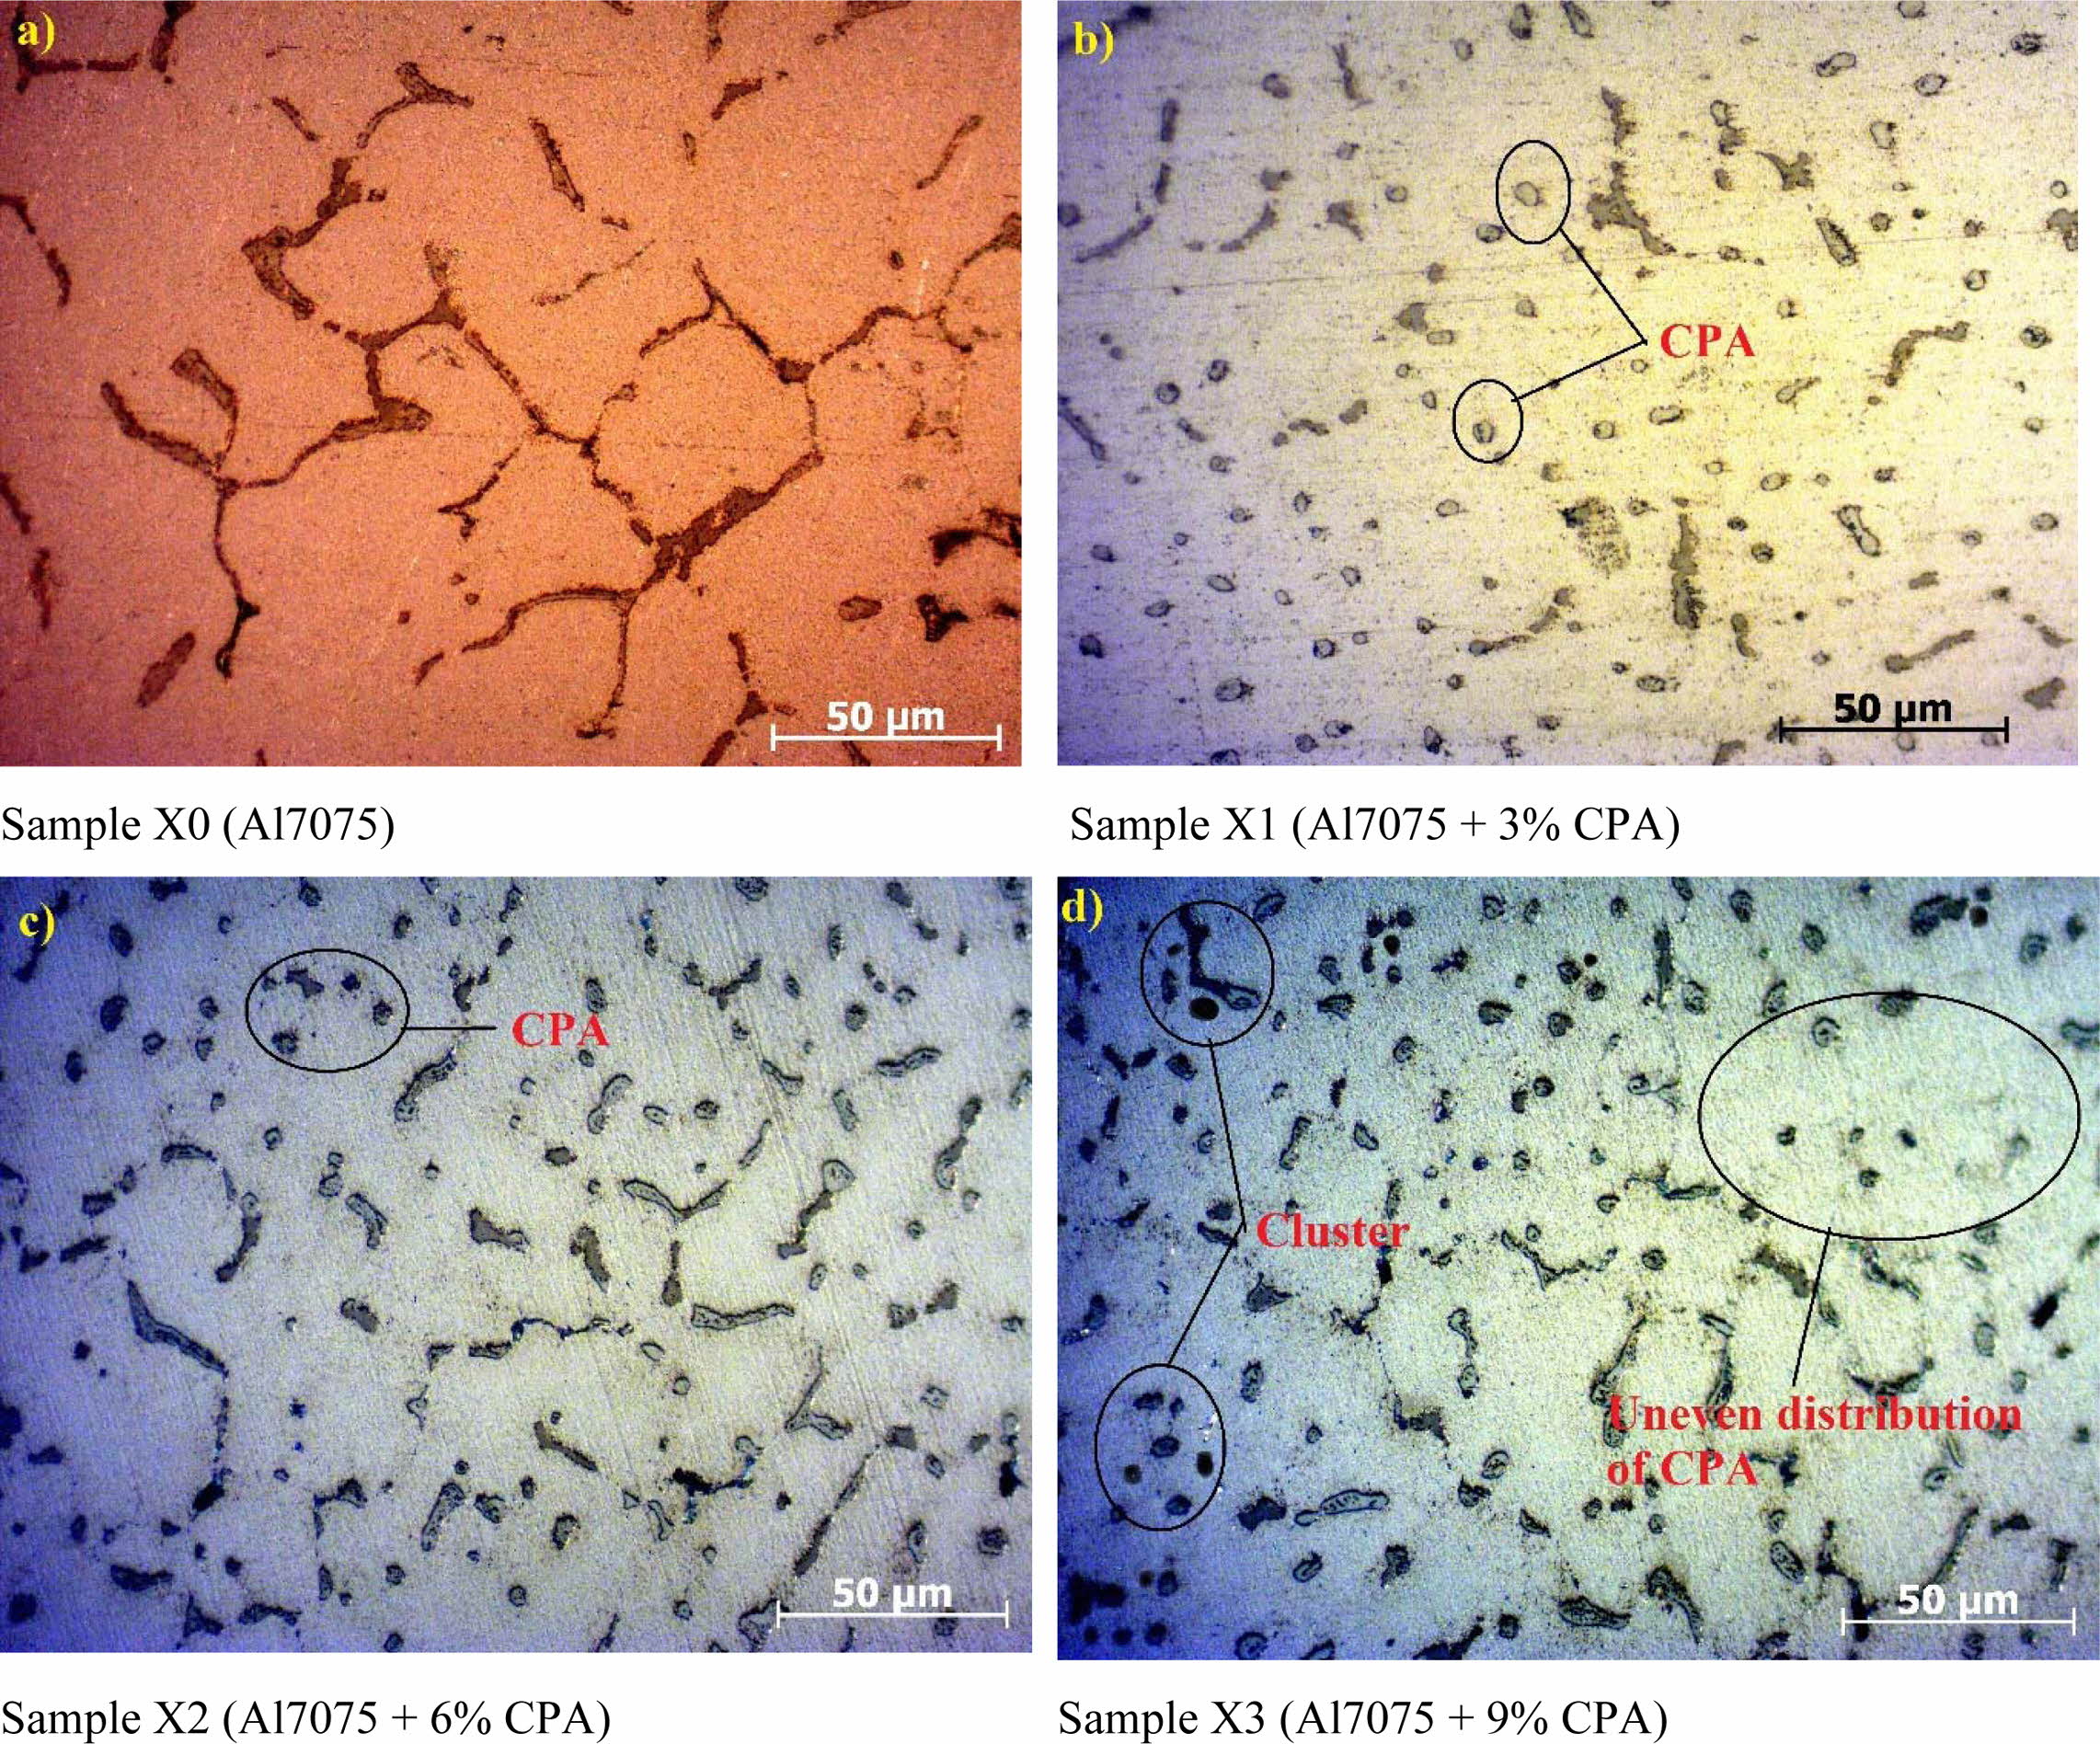
For microstructural studies the specimen dimensions were 10 ´ 10 ´ 10 mm which was polished as per metallographic standards and etched with Keller’s reagent. Optical microstructure image of CPA and composite materials are shown in Fig. 1 and 2 respectively. From Fig. 2 images it is very clear that the CPA particles are homogeneously distributed in the matrix. At the time of solidification process in the composite materials, different intermetallic phases are formed namely S-phase (Al2CuMg), MgZn2, Al2Mg3Zn3, Mg2Si, Al7Fe2Cu(Mn), Al15(FeMn)3(SiCu)2 or Al12Fe3 (SiCu). The presence of MgZn2 micro segregation with fine grains can be seen in Fig. 1(a). When the material undergoes plastic deformation dislocation occurs in the grain boundaries which will carry over disruption from one grain to another grain.
The boundaries of grain and the size of grain in a composite material act a main role in evaluating their mechanical properties. When the grain boundaries increase the grain size decreases wherein the strength of the composite material increases and vice versa. Form the microstructural images it is evident that the grain boundaries have increased when the matrix is reinforced with CPA. It is also evident that the grain size has decreased with increase in reinforcement percentage. The grain boundary increases when reinforced and hence the propagation of dislocation has to be carried over in different directions from one grain to another. The presence of CPA particles acts has a barrier to dislocation which infers the rise in strength of the material. The grain refinements of the composite materials can be achieved only when the reinforcements are distributed uniformly and with less porosity. Distribution of reinforcements and porosity of composite materials totally rely on fabrication method and selected process parameters. Two stage stirring process and the preheating of reinforcement particles have imparted the uniform dispersion. High heat transfer or cooling was the reason for good grain refinement, uniform dispersion and good bonding between matrix and reinforcement. The same has been confirmed through the microstructural analysis. From the optical images it is also clear that double stage stir technique and selected parameters are efficient and effective in distributing the CPA in the matrix and to enhancing the properties of fabricated materials respectively [52-57].
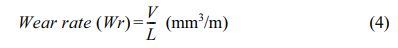
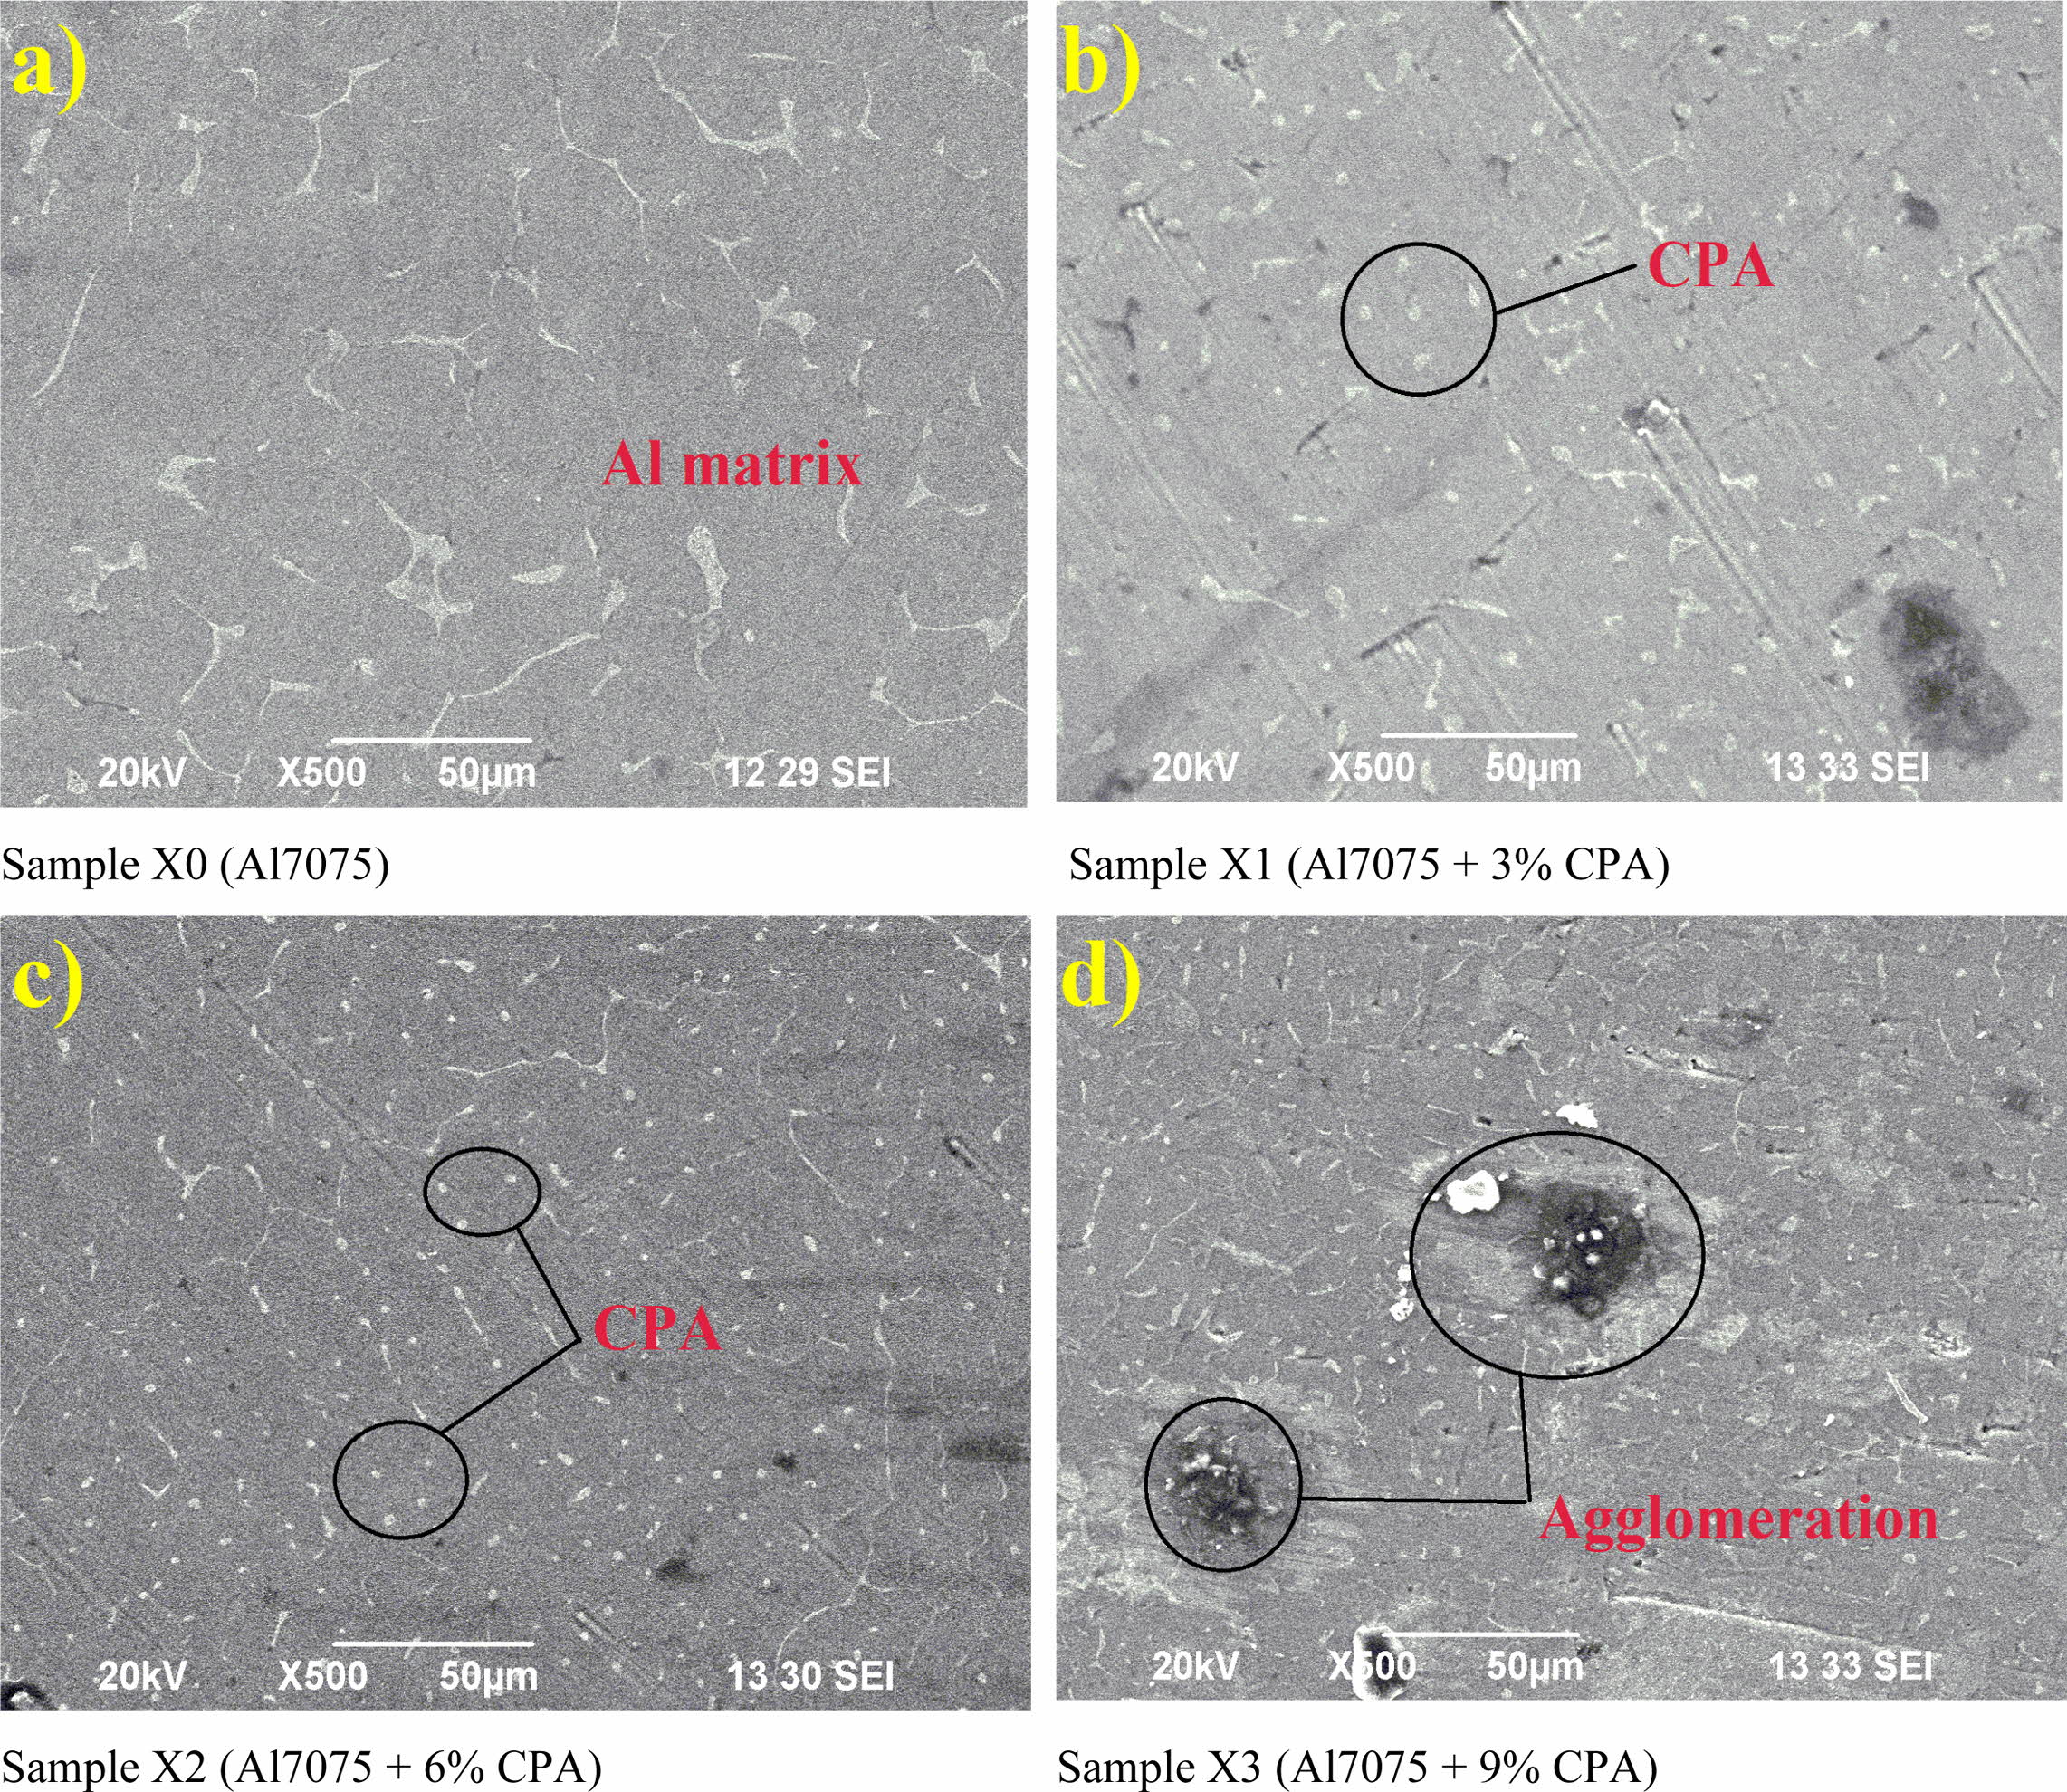
To identify and to attain better understanding of dispersion of CPA particles in Al 7075 matrix SEM was examined. Fig. 3 shows the SEM images of the fabricated samples and it is identified that the particles are distributed in a uniform manner and slight agglo- meration can in seen at higher percentage of CPA re- inforcement. Density of CPA particles is very low and the particles are very soft hence during reinforcement they tend to float on the melt surface. Low porosity, less agglomeration and segregation of CPA particles in the composite materials can be attained only when the particles are uniformly distributed. To improve the distribution, bonding and to maintain the suspension of CPA reinforcement for a long time among the matrix, CPA was first manually stirred in semi solid stage and then mechanically stirred in double stage stir casting technique. Identifying the influencing parameters and their ranges in the method plays an important role in uniform dispersion of CPA particles. From the SEM images it is evident that the CPA particles have uniformly distributed in the matrix.
Influence of CPA on density and porosity
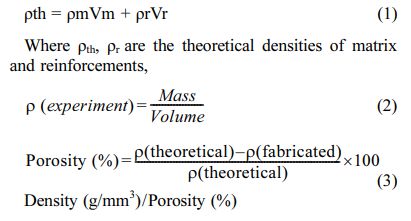
The most important and challenging task in produc- ing a good composite material is relied on the porosity level of the samples. Porosity in composite material is identified by theoretical and fabricated density. The dimensions of specimens used to identify density were 10 × 10 × 10 mm. The formulas used to calculate the densities and porosity are given in eq. (1)-(3),
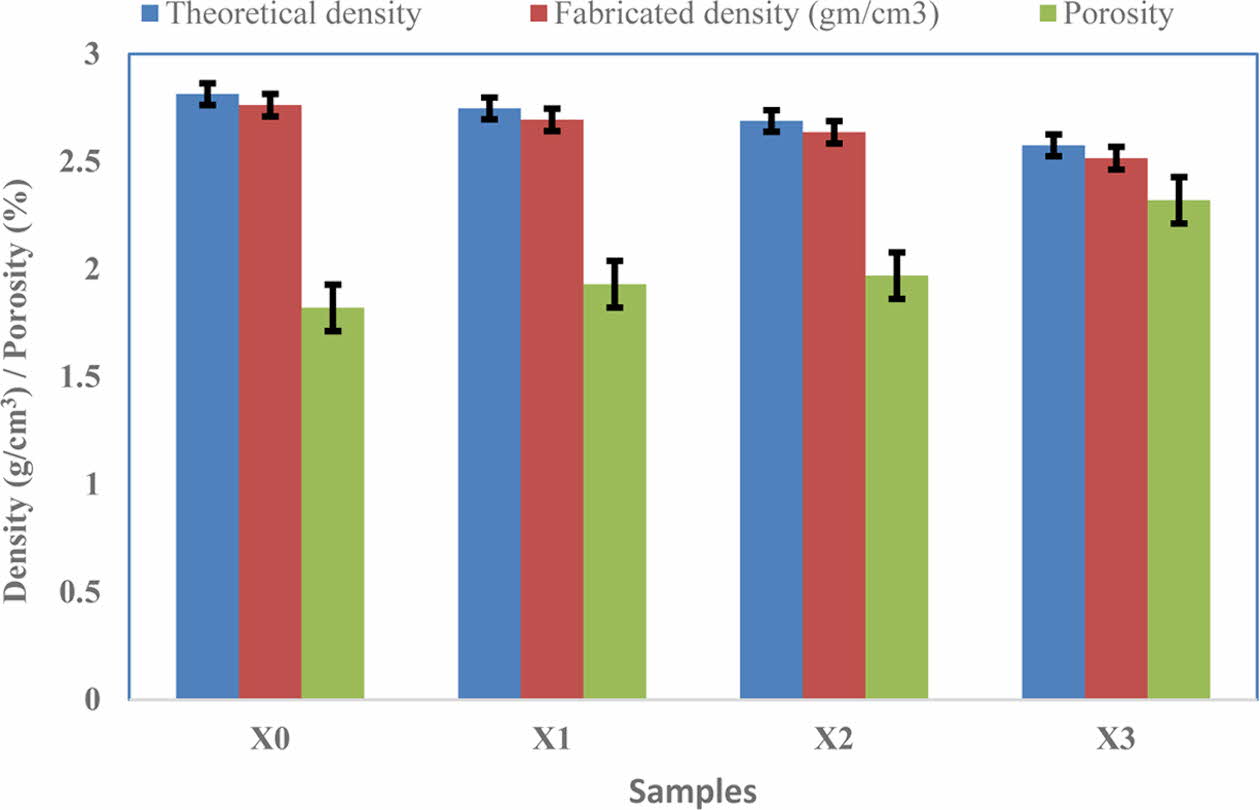
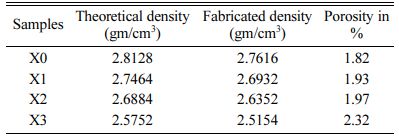
The numerical values of densities and porosity of the fabricated materials are given in Table 4. Fig. 4 signifies the difference between theoretical density, fabricated density and porosity among the samples. From the graph it can be identified that density of composite materials has gradually decreased when compared with the base alloy, but on the other hand porosity in the material increases with increase in CPA particles. The decrease in fabricated density were identified has 2.47% for sample X1, 4.27% for sample X2 and 8.91% for sample X3 to base alloy.
Research studies on porosity of composite materials have reported that the level of defects like porosity in the material can be accepted upto 4%. In the current study the porosity level is 2.32% which is less than the accepted level and hence it can be determined that the selection of method and the parameters selected are optimal in fabrication of Al-CPA composites [39-42]. From the current density study, it can be determined that lightweight aluminium composites at low cost can be produced by double stage stir casting. The need for light weight composites at minimum cost can be attained by reinforcing CPA particles since the density of the fabricated materials have reduced.
Influence of CPA on Mechanical properties
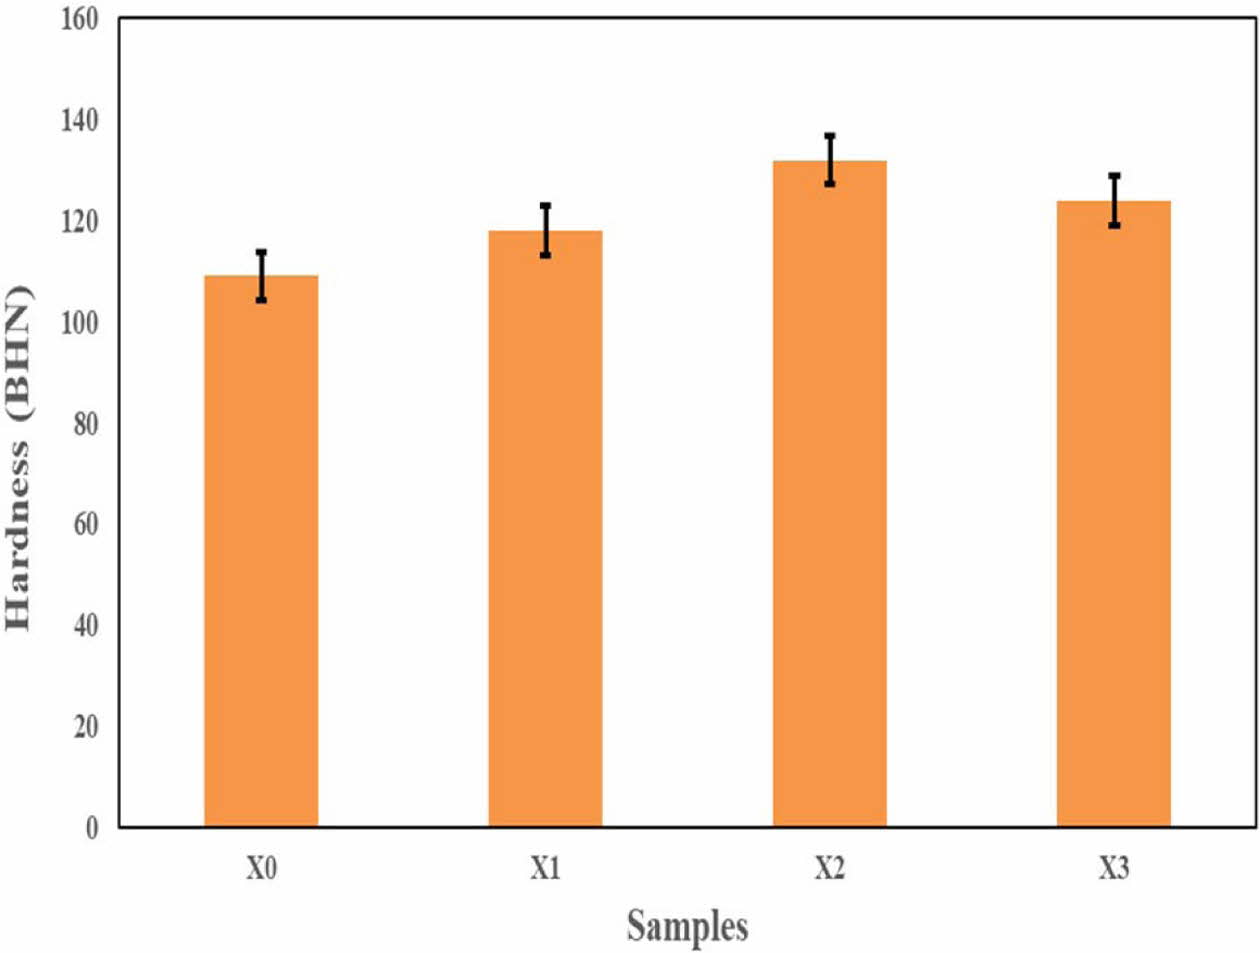
Brinell hardness test was conducted to identify the stiffness of composite specimens as per ASTM: E10 standard. The parameters used are load (2500 N), 5 mm steel ball indenter, and time (30 seconds) and the experiments were conducted at room temperature. Indentations were carried out at five places and their mean was reported has hardness. The CPA particles has gradually increased the hardness of the alloy which is graphical shown in Fig. 5. The presence of CPA particles has strengthened the matrix and contributed an im- provement in stiffness and toughness of the composite materials. The hardness has increased by up to 8% of CPA reinforcement when compared to Al 7075. The major causes for improvement in hardness are the elements present in the CPA particles assist in enhancing the resistance of the material during plastic deformation. When indentations are made the elements present in the matrix toughens the surface area thereby the hardness of the material increases. Secondly, the matrix is a ductile material and when the CPA are added it converts into a brittle material in that way the hardness increases.
Among the selected composition 6% of CPA has exhibited the highest hardness and further increase in reinforcement has reduced the hardness. Similar remarks were stated by Usman et al. where the hardness increased with the increase of bamboo ash reinforcement upto 6% and further increase has decreased the hardness [39]. Saravanan et al. on manufacturing of Al-RHA indicated a rise in stiffness with a raise in percentage of RHA [41]. A decreasing nature of hardness while increasing the CPA particles was inferred for more than 6% in composite materials. The reasons for the decrease in hardness may be due to non-wettability and improper dispersion of reinforcements in the matrix. The density of CPA particles is low and when reinforced it floats in the surface of the melt which leads to improper distribution in the matrix for higher weight reinforcement percentage (9%). When the reinforcement percentage increases the viscosity of the melt increases causing difficulties in pouring the melt in die. Because of this porosity and voids may be created due to time delay.
Dispersion of reinforcements, solidification process, variation in density of matrix and reinforcements and porosities are the other factors that decides hardness of composite material [52-57]. The average hardness was found to be 109, 118, 132 and 124 BHN for X0, X1, X2 and X3 samples respectively. Maximum increase in hardness of 21.10% was attained for sample D having 6% CPA when compared to base alloy.
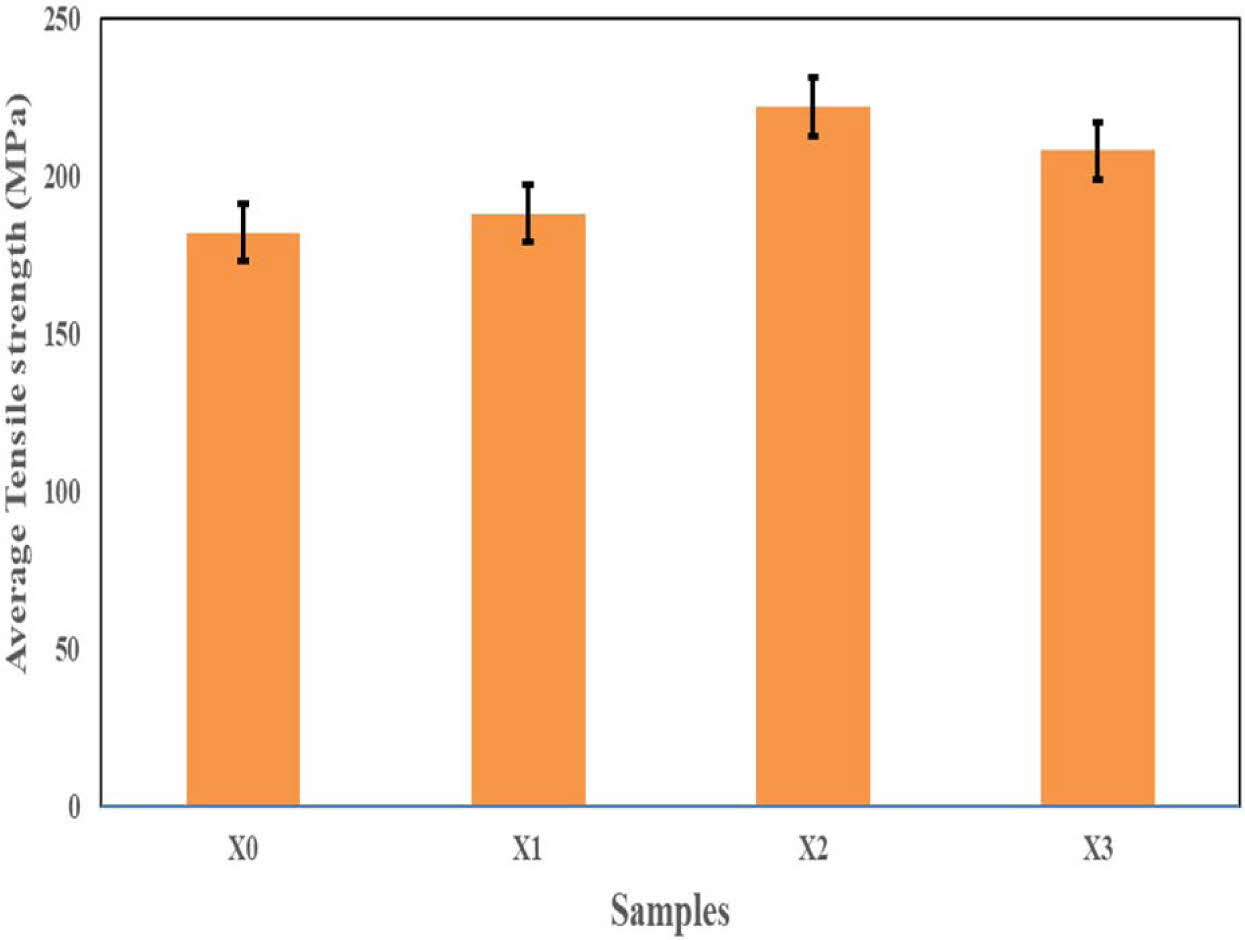
The ultimate tensile strength in composite materials was measured to identify the maximum resistance of the reinforcement against tensile forces. ASTM: E08 standard was used to identify the strength for fabricated materials. Two specimens were tested for each composition and their mean is reported. M 30-UTM machine was used to conduct the tensile test. The presence of CPA particles has increased the strength for the composite materials when compared with Al 7075 as shown in Fig. 6. Addition of CPA particles have converted the ductile nature of the matrix material into brittle which in turn has increased the tensile strength of the materials. The maximum strength of composite was attained for samples reinforced with 6% CPA. The hard elements present in CPA particles acts has a barrier and prevents the crack to propagate during dislocation. Increase in strength may be attributed to increase in matrix's dislocation density. The presence of reinforcement increases the grain boundaries which delays the growth and propagation of micro cracks thereby increasing the strength of the material.
The bonding strength between the matrix and particles, distribution of reinforcements uniformly can be accom- plished by preheating the CPA. Due to heating the thermal stress are generated which may also cause an influence in the strength. Also, the thermal variation among the matrix and CPA may be the reason for increase in strength. The bulk mechanical properties can be attained when there are no defects and flaws found in the material [52-57]. From the graphical representation it is identified that the strength is decreasing while increasing CPA more than six percentage. The raise in weight of particles causes raise in brittleness of the material which hinders the elongation and paves the way to failure thereby reducing the strength. The ultimate tensile strength of the fabricated materials was 182, 188, 222 and 208 MPa for X0, X1, X2 and X3 samples respectively.
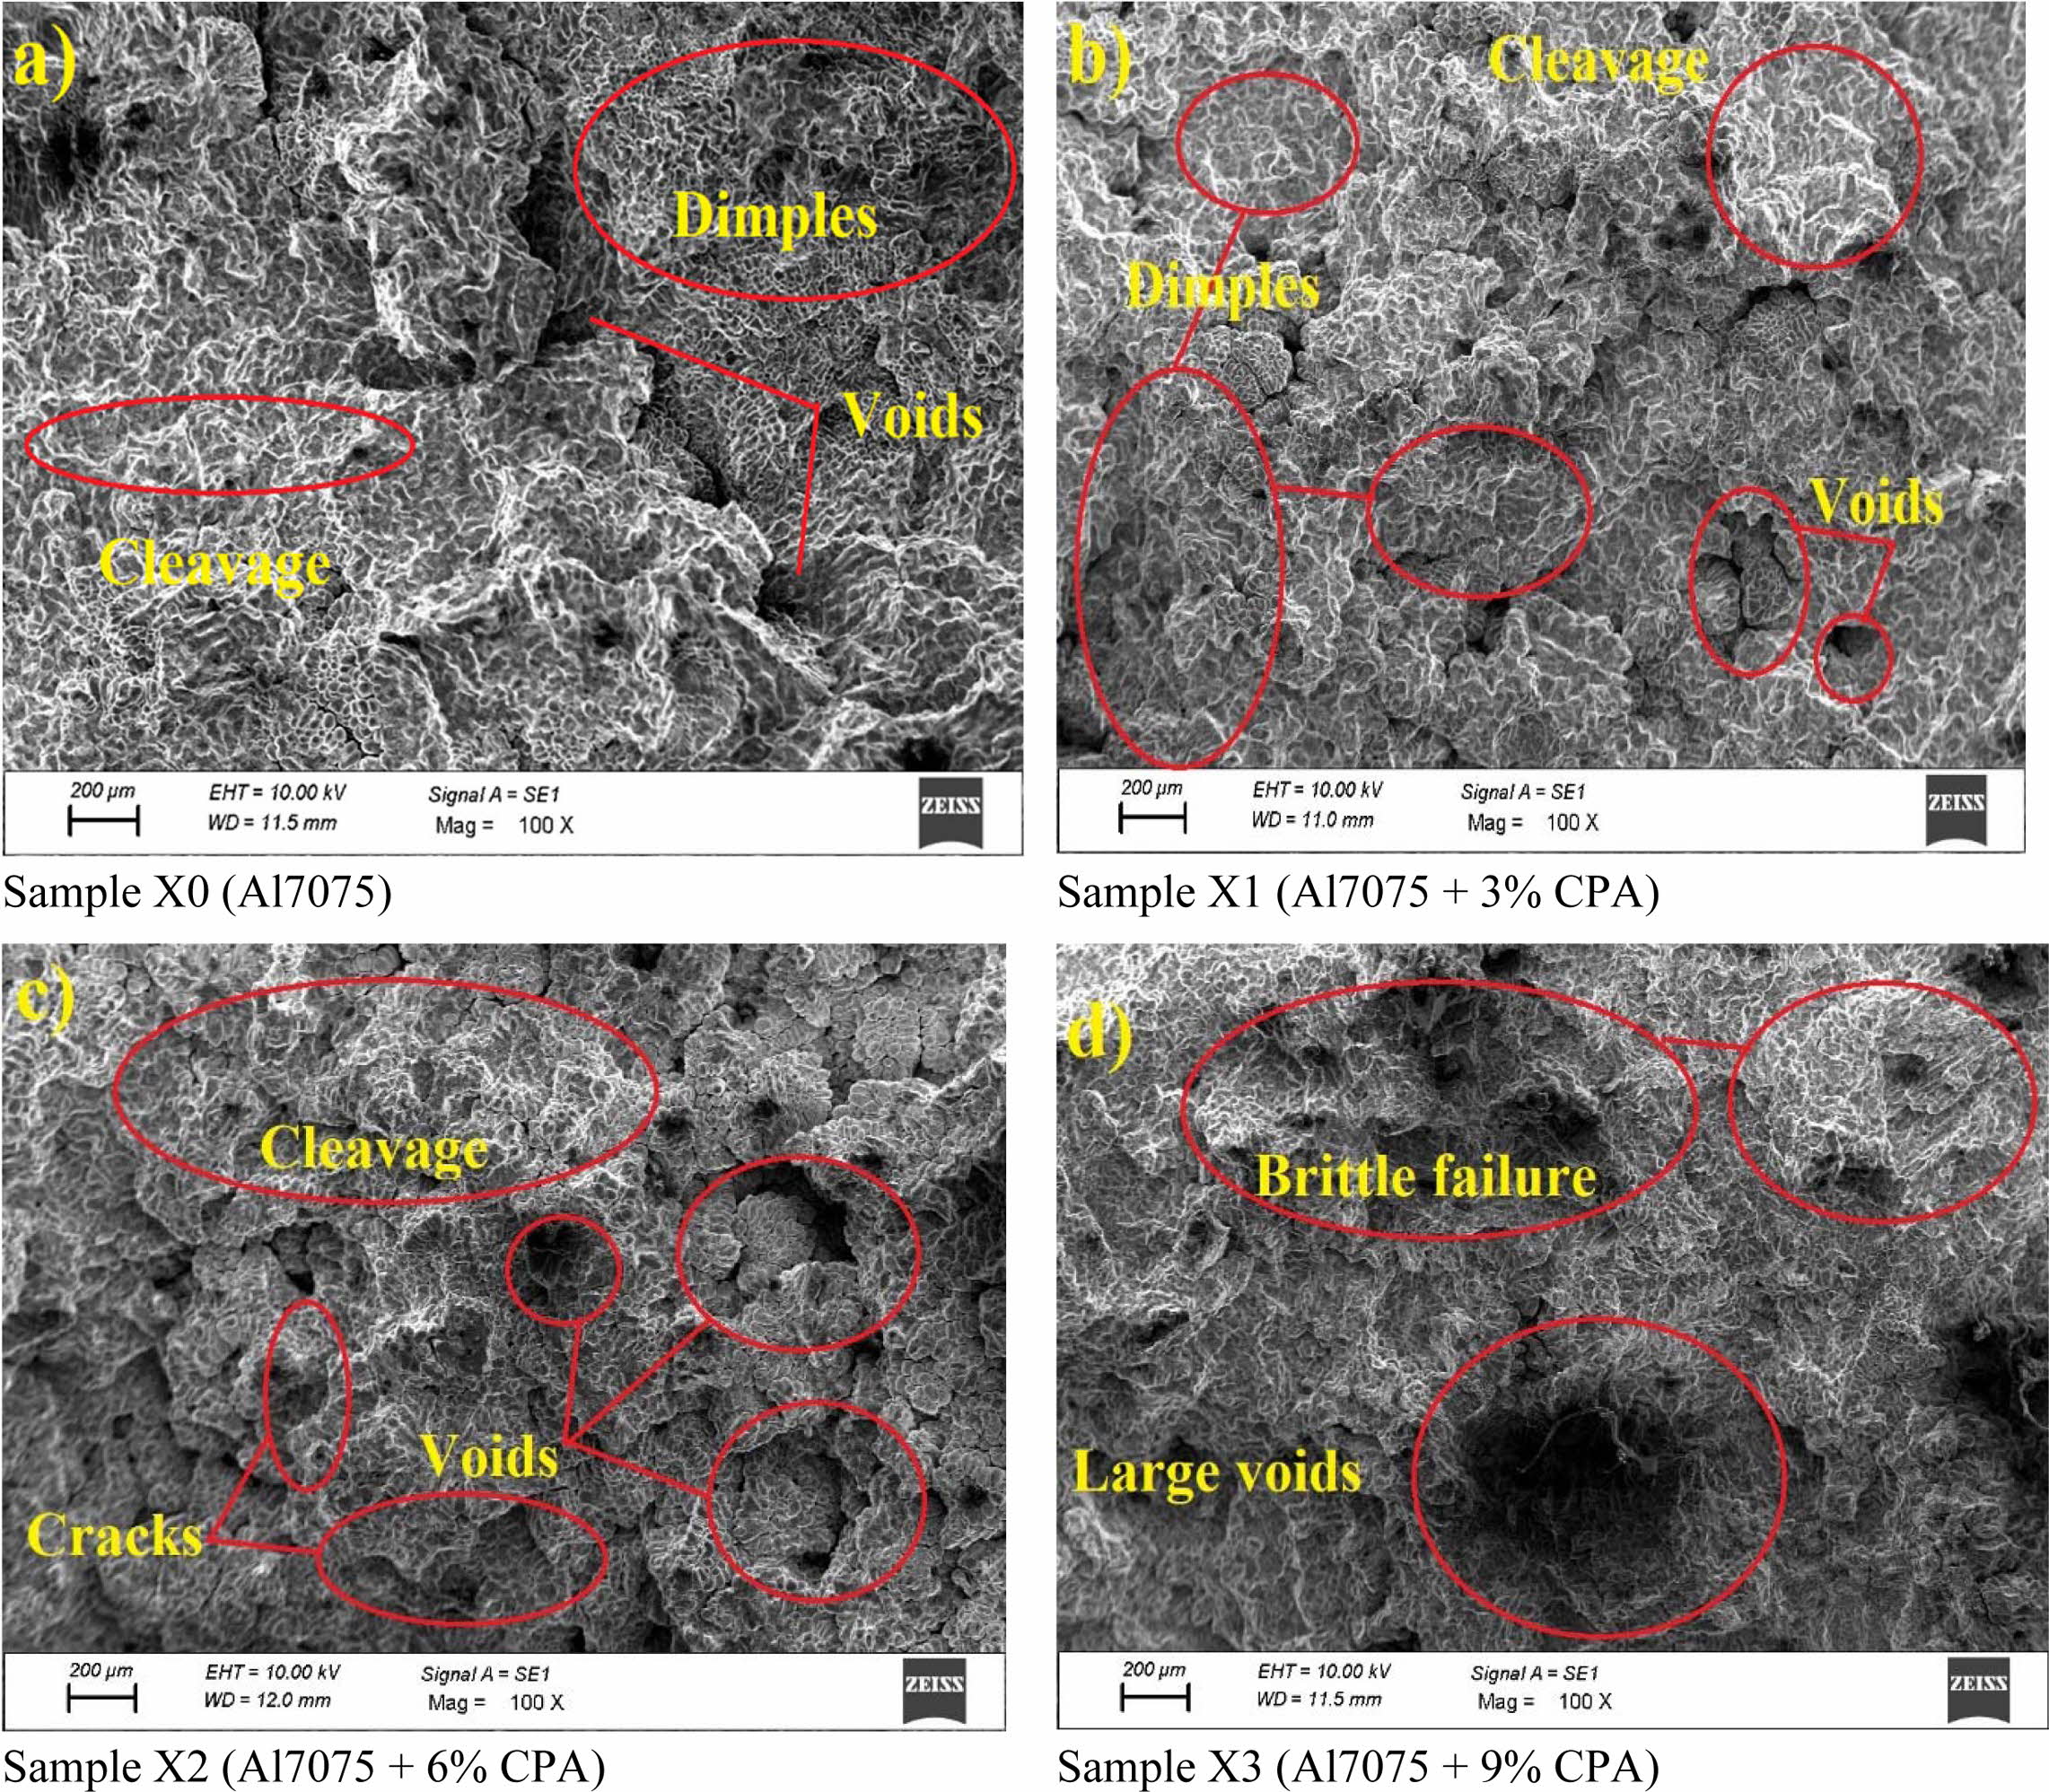
To identify the reasons for failure and to detect the resistance of the reinforcements in the composite materials tensile fracture analysis were done. SEM images of the fractured tensile specimens are shown in Fig. 7. The images revealed both dimples and cleavage failure patterns in the specimens. Metallurgically dimples are formed due to ductile failure and cleavage failure are attributed to brittle failure. When the specimens are undergoing tensile load, necking will occur if it is a ductile fracture which causes to form microvoids and movements in grain boundary occurs if it is a brittle fracture. Grain boundary movements in the material are formed due to the nature of less plastic deformation. Due to grain movements and microvoids, propagation of crack increases causing failure when load applied is greater than the strength of composite materials [52-57].
From sample X0 image, it is clear that more dimples and voids are uniformly distributed. It is due to Al 7075 reveal ductile failure characteristics causing numerous dimples over the entire surface. From Fig. 7 for composite samples (b-d) the voids are gradually increased when there is an increase in CPA percentage. The increase in CPA particles causes voids due to improper grain refinement in the matrix. For sample X1 and X2 images, it can be inferred that ductile failure has happened because of good bonding between CPA and Al7075. The CPA reinforcement enhances the elasticity property and acts as a barrier which delays propagation of crack thereby enhancing the strength. Dimple sections can be seen in all images suggesting that CPA particles maintain some amount of ductility. From sample X2 image, crack initiations are observed which would reduce load bearing capacity in the material.
Higher strength in composite materials depend on crack resistance and its propagation of growth in matrix. Resistance can be formed due thermal variation between the matrix and particles. The variation in coefficient of linear thermal expansion is more in Al 7075 and low in CPA reinforcement thereby creating thermal mismatch for the fabricated material. The resistance in material can be increased by reinforcing CPA particles upto certain percentage which will interrupt and enhance the plastic deformation property when load is applied. From sample X3 image, it can be observed that on increase in CPA particles has patched way to increase in crack formation and brittleness along the surface of the material. The increase in brittleness of the material may be due to the presence of weak inter metallic phases. This inter metallic phase provides accumulation of nucleation sites and large voids thus causing rapid failure in necking region of the specimen.
The causes for failure may be because of non-uniform dispersion of CPA particles at higher weight percentage. The strain carrying capacity of the material reduces if the reinforcement is not distributed uniformly. The other reason may also be due to secondary phase change during casting process. The secondar phases are formed in the casting process since there is a variation in the coefficient of thermal expansion for Al 7075, CPA and precipitated phases. The breakdown of metal matrix composites can be classified into three from earlier studies, namely the fracturing of reinforcement particles, particle debonding at the interface of matrix-particles and lastly because of the growth and combining effect of voids. The failure modes of the tensile specimens were observed and it can be concluded that the causes of failure rely on the microstructure, processing methodology and dispersion of reinforcement.
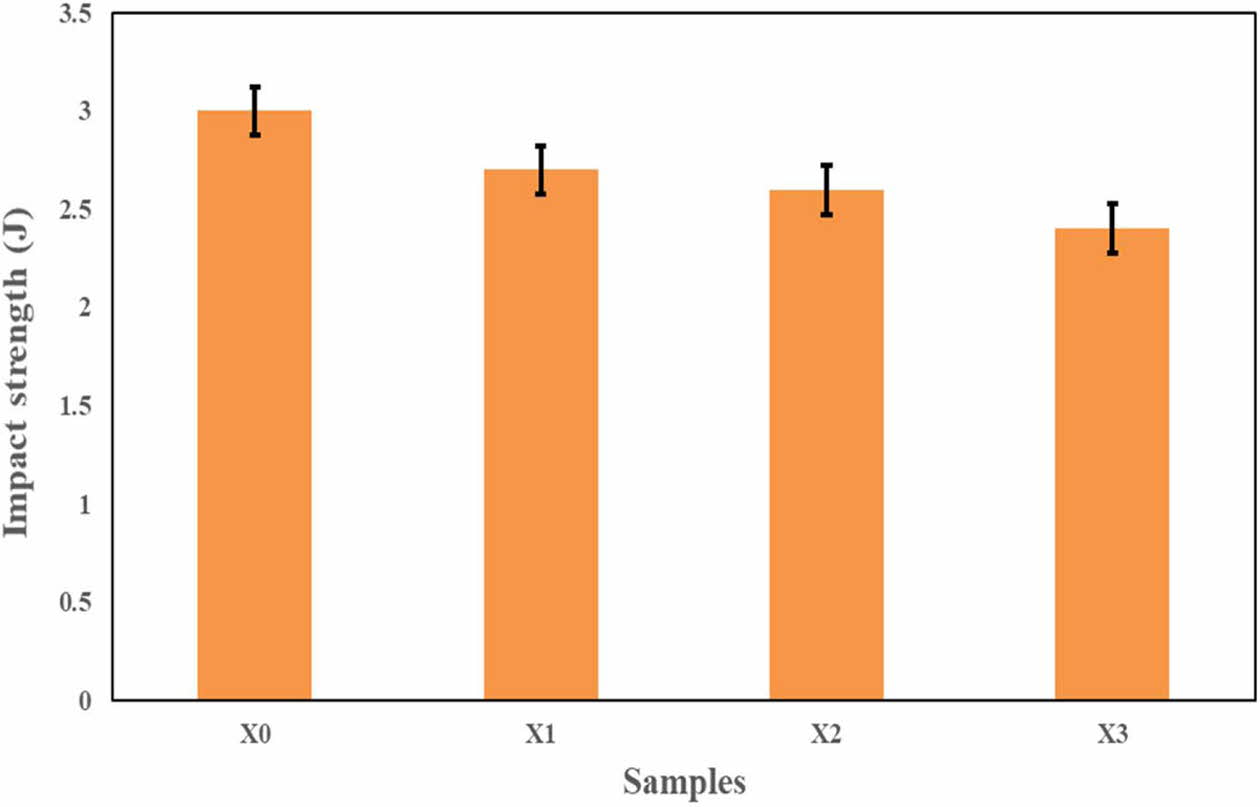
Impact strength was carried out to identify the resistance against energy absorption in composite materials. ASTM: E23 standard was used to identify the strength in the fabricated samples. Charpy impact tester was used to conduct impact strength and two specimens were tested for each sample and their mean was reported. The properties of CPA particles on impact strength are shown in Fig. 8. From the graphical representation it is clear that impact strength has gradually decreased for composite materials when compared to Al 7075. The major reason is because of the conversion of material property in the process. The matrix is a ductile material and when reinforced with CPA particle the matrix gets converting into a brittle material thereby reduces the impact strength in the composite material. It can also be seen that the increase in weight percentage of CPA particles has decreased the impact strength. Same kind of decrease in impact strength while increasing agro waste has been reported by other researchers.
Stress concentration will occur in the matrix due to the presence of CPA particles which will patches way to higher crack propagation when sudden load is applied thereby reducing the impact strength in the composite materials. At higher weight percentage the CPA particles may not distribute evenly in the matrix which causes clusters in the matrix. The clusters formed reduces the bonding strength between particles and the matrix which reduces the impact strength [52-57]. The average impact strength of the fabricates samples was found to be 3, 2.7, 2.6 and 2.4 J for X0, X1, X2 and X3 samples respectively.
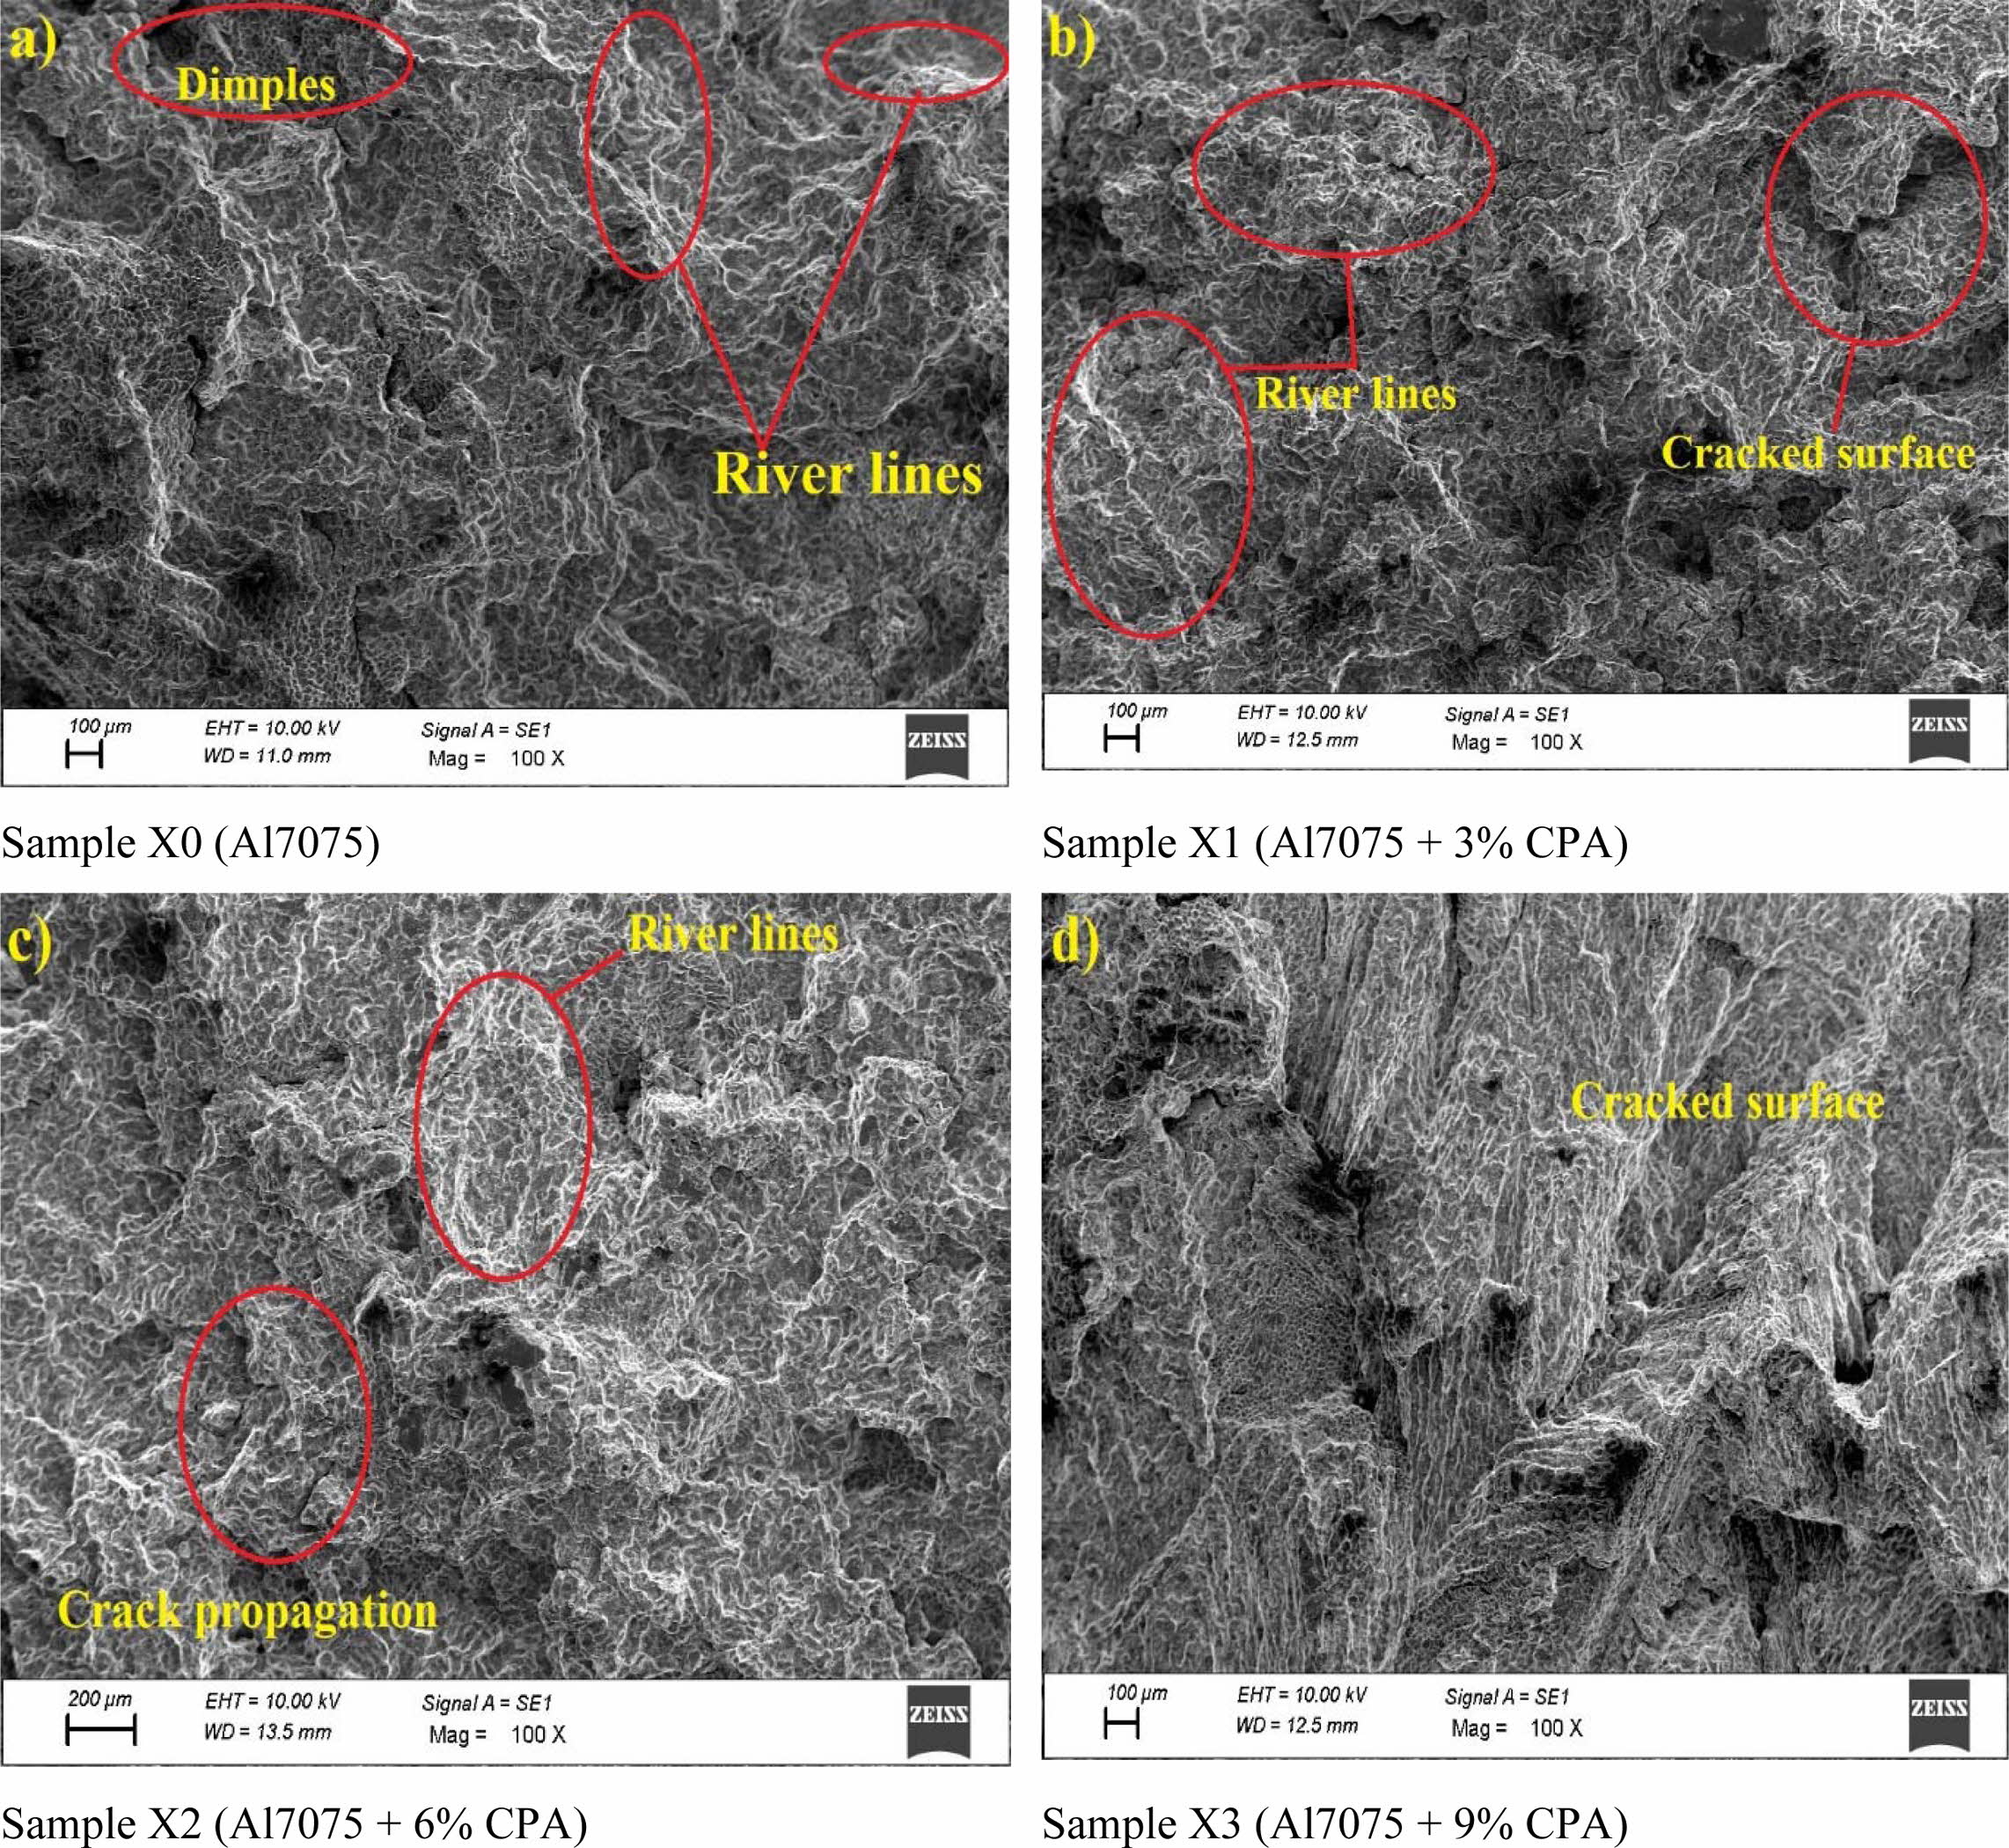
SEM images of the fractured impact specimens are shown if Fig. 9. Similar metallurgical terms used in tensile fractured specimens implies even for the impact fractured specimens. Sample X0 being a ductile material exhibits more dimple failure. The conversion process of ductile to brittle changes the impact property in the composite materials. Initiation and propagation of cracks are formed in the grain boundaries leading to river lines formation in matrix. The presence of CPA produces instability in crack formation thereby reducing the impact strength. The increase in percentage of CPA particles causes voids formation around the particles in the matrix. A cavity is created because of the void formation which in turn reduces the resistance of energy absorption of the composite materials. Earlier researchers have reported that when the tensile strength increases the impact strength reduces because of the presence of cavity and similar result has been attained in the current study.
Influence of CPA on Tribological properties
Wear rate is studied to identify the resistance of the composite materials against sliding between other surfaces. ASTM: G99 standard was selected to identify the wear rate of the specimens using pin-on-Disk apparatus. The apparatus consists of a sliding disc made of steel having a diameter of 165 mm. The dimensions of the fabricated specimens are 10 mm dia and 28 mm height. The volumetric loss (V) was found by identifying loss of height in material multiplied by area of specimen. Rate of wear was determined by ration between volumetric loss and the sliding distance has given in equation 4.
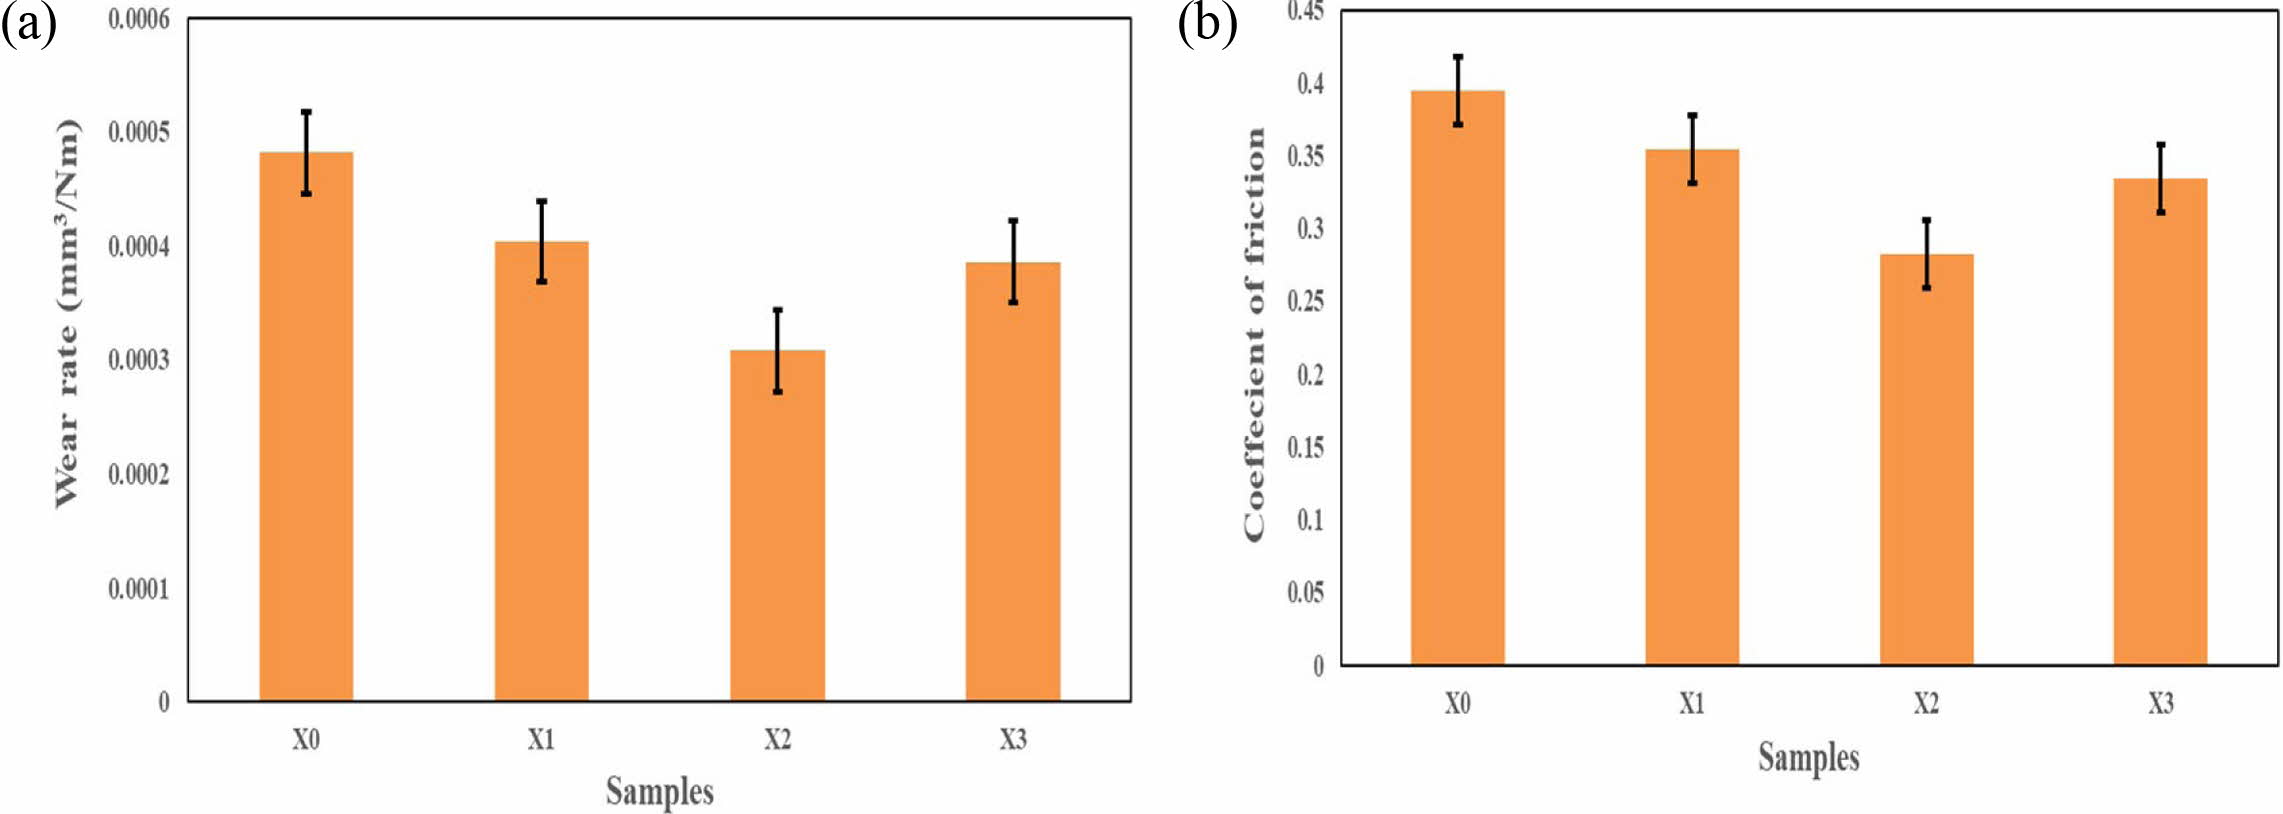
Based on literature survey it is found that the most influencing parameters of wear rate for composite materials are load (30 N), sliding velocity (1.6 m/s) and sliding distance (1000 m). The effects of CPA on rate of wear and coefficient of friction are shown in Fig. 10 (a & b) respectively. From the image it can be observed that the wear rate has reduced enormously for the composite materials. The CPA particles minimizes transfer of shear stress from one grain to another during sliding action which produces less plastic deformation in the material. Due to less plastic deformation the wear rate of the composite material reduces. A layer is formed due to the oxidation effect of the reinforcement due to sliding. The composite materials resistance increases because of the layer formed in between the work specimen and sliding surface [58-68].
High resistance of wear was identified in specimen X2 having 6% CPA composition and with an increase in resistance of 36% when compared with the base material. CPA particles act has a liquid lubricant which increase the resistance in the material and reduces the wear rate and coefficient of friction. For sample X3 an increase in wear rate can be identified, this is because when the percentage of CPA increases clusters may form. Due to this during sliding action, the stress concentration in the clustered area increases thereby removing the reinforced particle at a higher rate which reduces the resistance of the material. The clustering of particles also causes distortion, spalling and fracture between the specimen and the sliding surface. The resistance of the composite material during sliding action through wear rate was 0.000482, 0.000404, 0.000308 and 0.000386 mm3/Nm and coefficient of friction 0.394, 0.354, 0.282 and 0.334 for samples X0, X1, X2 and X3 respectively.
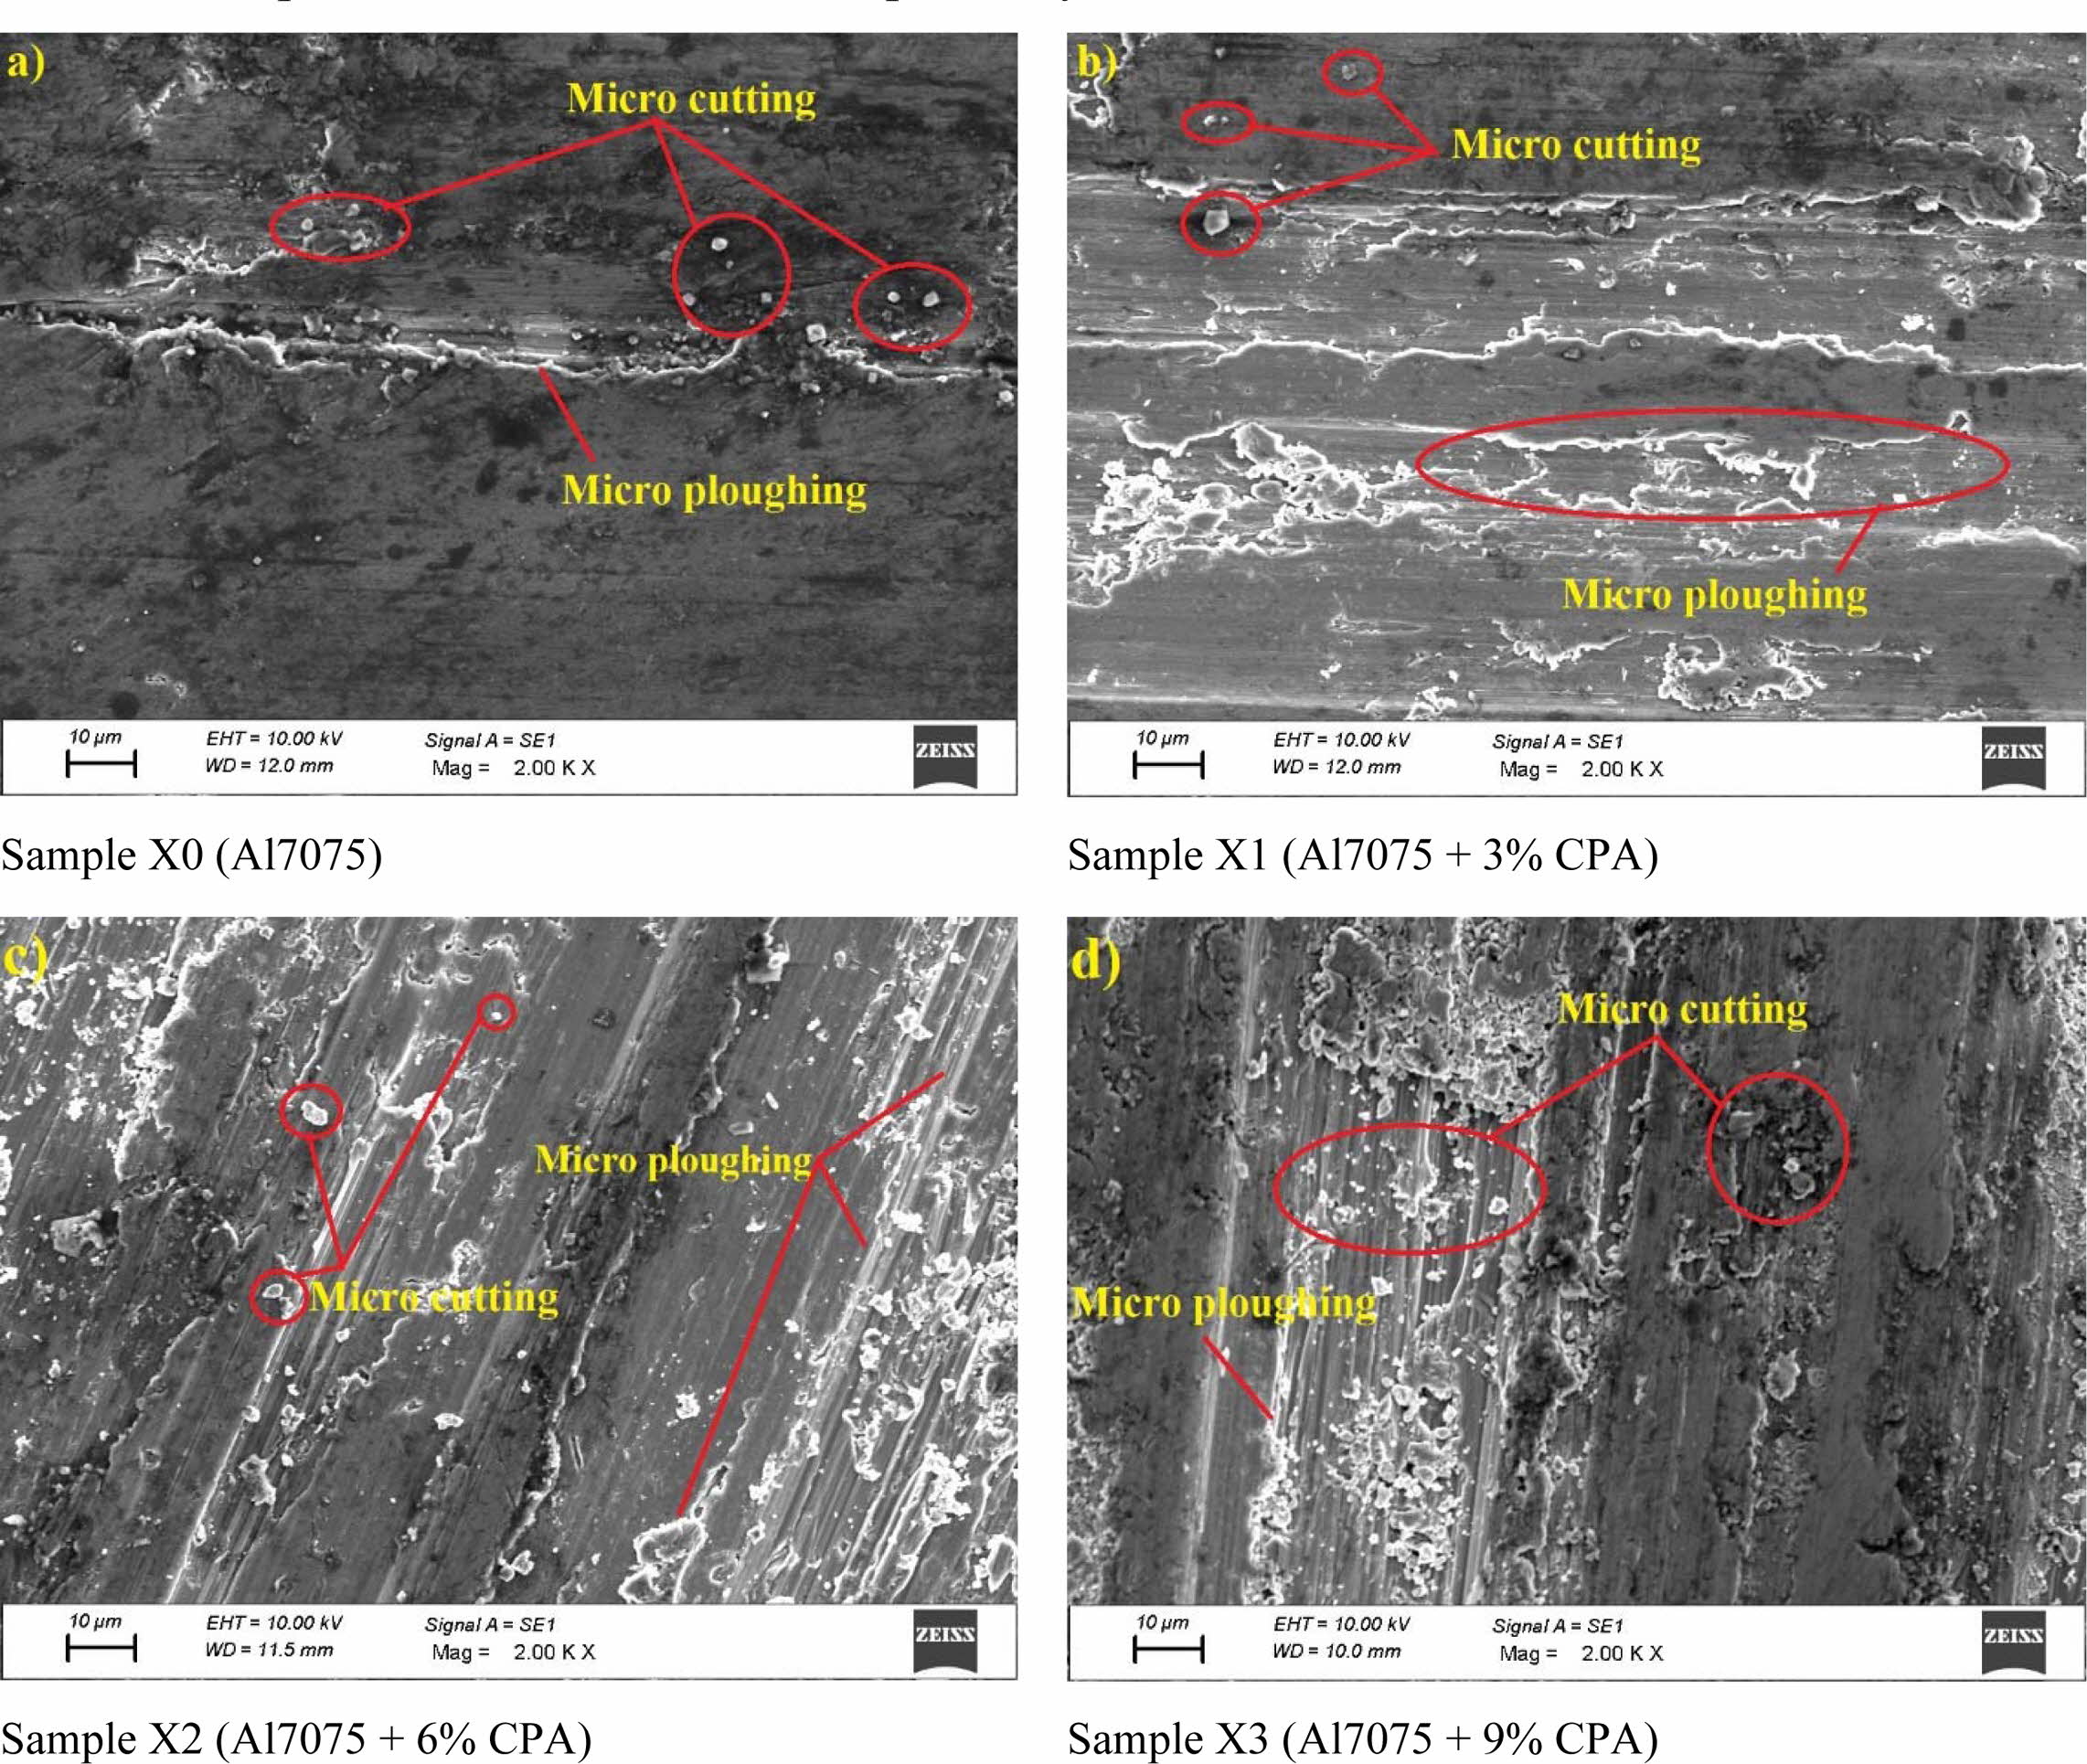
SEM of the worn-out exterior for all the specimens are shown in Fig. 11. Microscopic removal mechanisms take place during the sliding action. Micro-cutting and micro-ploughing occur in the wear specimens due to the action of abrasive wear. Early researchers have reported that when the resistance is low, micro cuttings are formed during deformation which causes high wear rate and micro ploughings are formed when the resistance is high during deformation. The wear resistance mecha- nism for composite materials always undergo transition from micro-ploughing to micro-cutting against the sliding force. From the worn-out surface images, its observed that specimens have undergone plastic deformation. During plastic deformation, micro edge formation occurs because of micro-ploughing and material is removed in form of microchips which occur because of micro-cutting mechanisms. The base material has ex- perienced more formation of microscopic chips than micro-edges and hence higher rate of wear was observed than the composite materials. The presence of CPA acts has a barrier and lubricant for all the composite samples. The surfaces also appear to be smooth because of the CPA reinforcement content. The worn-surface of CPA composite was characterized by plastic deformation and clear evidence of ploughing and smearing and resulting in a great amount of wear loss shown in Fig. 11. It was found that as the amounts of CPA addition were small, the solid lubricant effect was relatively less. Therefore, the fracture-toughness effect dominated, which resulted in an increase in the wear loss. Due to increase in percentage of CPA particles for sample X3 the transition from micro-ploughing to micro-cutting is less when comparing to other composite samples [58-68].
An electro chemical analysis for corrosion were done as per ASTM: G31 – 72 standards. The sample dimensions were 10 × 10 × 10 (mm) and the samples were polished and cleaned for testing. After the cleaning process the samples were immersed in water to remove superfluous impurities from the surface. Araldite plaster was coated on the surface and corrosion rate was identified using Tafel extrapolation technique. The solution was prepared by adding 210 gms of sodium chloride in 6000 cm3 of deionised water. During the experiment the samples were used as working electrode, reference electrode was Ag–AgCl and auxiliary electrode was platinum wire.
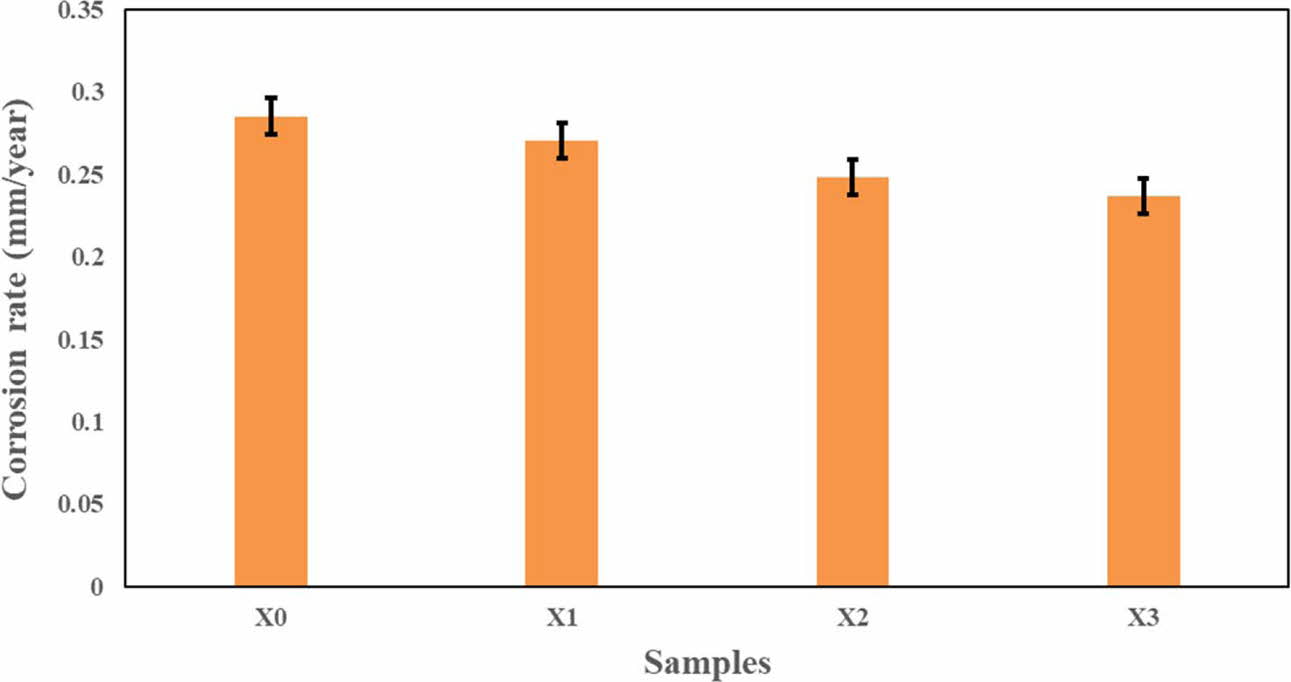
The effects of CPA on corrosion are graphically represented in Fig. 12. From the graph it is clear that the corrosion rate has gradually decreased when accumulated with CPA particles in the matrix. Oxidation on the surface of the specimens occur when it is immersed in the prepared solution. The presence of chloride ions in the solution tends to break the oxidation film which in turn increases the corrosion rate of the base alloy. The major element in CPA is silicon dioxide which strengthens the oxide film and acts has a barrier from chloride ions. The corrosion rate decreases with increase in CPA particles. Corrosion rate decreases when higher dislocation density occurs in the samples. Higher dislocation density is formed because of the variation in thermal expansion between CPA and matrix [69-70]. The lowest corrosion rate was identified for sample X3 having 9% CPA. The corrosion rate of the fabricates samples was found to be 0.2852, 0.2702, 0.2484 and 0.2368 mm/year for X0, X1, X2 and X3 samples respectively.
|
Fig. 1 Microstructure of CPA. |
|
Fig. 2 Optical microstructure of fabricated samples. |
|
Fig. 3 SEM of fabricated samples. |
|
Fig. 4 Influence of CPA in density |
|
Fig. 5 Influence of CPA on hardness. |
|
Fig. 6 Influence of CPA on tensile strength. |
|
Fig. 7 SEM of fractured tensile test specimens. |
|
Fig. 8 Influence of CPA on impact strength |
|
Fig. 9 SEM of fractured impact test specimens. |
|
Fig. 10 (a) Influence of CPA on wear rate and (b) Influence of CPA on coefficient of friction. |
|
Fig. 11 SEM of worn-out specimens. |
|
Fig. 12 Influence of CPA on corrosion |
Based on the current study the impact of CPA on aluminium 7075 alloy are summarised:
• The CPA particles having 40 μm were produced successfully through double stir casting technique. The optical and SEM revealed good bonding and uniform distribution between the CPA reinforcement and matrix respectively.
• The density of the composite material has gradually reduced with increase in CPA particles when com- pared with Al7075. The highest porosity level was 2.32% for 9% CPA which is lower than the accep- table porosity level of 4%.
• The hardness of the fabricated material has enhanced when compared to Al7075 alloy and peak value was obtained at 6 percent of CPA.
• The maximum tensile strength was attained at 6% CPA. A small decrease in strength was found on increasing the content of CPA (9%) yet the strength has not reduced than the base alloy. The base material exhibited highest impact strength than the composite materials.
• Dimples, cleavages, voids, cracks, river lines were observed in SEM images for the fractured tensile and impact specimens.
• Maximum of 36% increase in wear resistance was found for sample X2. Micro ploughing and micro cutting were observed through SEM images for the worn-out surface of the specimens. Corrosion rate has decreased with increase in weight percentage of reinforcement.
• From the study it can be concluded that CPA agro waste shall be used as a reinforcement in streng- thening the aluminium alloys.
All authors declare that they have no conflicts of interests.
No funding was received to carry out the research work reported in this paper.
- 1. H.C. Alexander Chee, R.S.K. Singh, and K.Y. Sara Lee. J. Ceram. Process. Res. 22[3] (2021) 289-295.
-

- 2. V. Vijayakumar, P. Johnson, R. Whenish, A.J. Rajan, and V.H. Wilson, J. Ceram. Process. Res. 22[4] (2021) 401-408.
-
- 3. X. Zhu, H. Dong, and K. Lu. Surf. Coat. Technol. 202[13] (2008) 2927-2934.
-
- 4. J. Hashim, L. Looney, and M.S.J. Hashmi. J. Mater. Process. Technol. 123[2] (2002): 258-263.
-
- 5. G.G. Sozhamannan, S.B. Prabu, and V.S.K. Venkatagalapathy. J. Surf. Eng. Mater. Adv. Technol. 2 (2012) 11-15.
-
- 6. S.B. Prabu, L. Karunamoorthy, S. Kathiresan, and B. Mohan, J. Mater. Process. Technol. 171[2] (2006) 268-273.
-
- 7. M. Aizenshtein, N. Froumin, E. Shapiro-Tsoref, M.P. Dariel, and N. Frage, Scripta Materialia 53[11] (2005) 1231-1235.
-
- 8. J. Jung, and S. Kang. J. American Ceram. Soc. 87[1] (2004) 47-54.
-
- 9. F. Toptan, A. Kilicarslan, A. Karaaslan, M. Cigdem, and I. Kerti, Mater. Des. 31 (2010) S87-S91.
-
- 10. K.K. Alaneme and A.O. Aluko, Scientia Iranica 19[4] (2012) 992-996.
-
- 11. N. Radhika and R. Raghu, Tribology in Industry 37[1] (2015) 20.
- 12. K. Ravi Kumar, K. Kiran, and V.S. Sreebalaji, J. Alloys Comp. 723 (2017): 795-801.
-
- 13. V.R. Rao, N. Ramanaiah, and M.M.M. Sarcar, Int. J. Adv. Sci. Technol. 88 (2016) 13-26.
-
- 14. R.K. Uyyuru, M.K. Surappa, and S. Brusethaug, Tribology Int. 40[2] (2007) 365-373.
-
- 15. N. Radhika and R. Raghu, J. Tribology 139[4] (2017) 041602.
-
- 16. S. Sakthivel, R. Manikandan, and T.V. Arjunan, Int. J. Adv. Eng. Emer. Technol. 7[4] (2016).
- 17. R. Manikandan and T.V. Arjunan, Int. J. Appl. Eng. Res. (2015)
- 18. V.R. Rao, N. Ramanaiah, and M.M.M. Sarcar, Appl. Mech. Mater. 592 (2014) 349-353.
-
- 19. M. Shahid. R.A. Malik, H. Alrobei, J. Kim, M. Latif, A. Hussain, M. U. Iqbal, and A. Hafiz, J. Ceram. Process. Res. 22[2] (2021) 149-157.
-
- 20. T. Boyraz and A. Akkus, J. Ceram. Process. Res. 22[2] (2021) 226-231.
-
- 21. J. Umar Mohamed, PL. K. Palaniappan, P. Maran, and R. Pandiyarajan, J. Ceram. Process. Res. 22[3] (2021) 306-316.
-
- 22. P. Viensiri, S. Wattanasiriwech, and D. Wattanasiriwech, J. Ceram. Process. Res. 22[3] (2021) 323-328.
-
- 23. M. Manoj, G.R. Jinu, T. Muthuramalingam, and R.L.B. Singh, J. Ceram. Process. Res. 22[4] (2021) 475-481.
-
- 24. R. Manikandan and T.V. Arjunan, Metal. Mater. Int. 27[5] (2021) 885-899.
-
- 25. Y.R. Loh, D. Sujan, M.E. Rahman, and C.A. Das, Resources, Conservation and Recycling 75 (2013) 14-22.
-
- 26. V.S. Aigbodion, S.B. Hassan, E.T. Dauda, and R.A. Mohammed, J. Miner. Mater. Charact. Eng. 9[10] (2010) 907-917.
-
- 27. M. Arulraj and P.K. Palani, J. Brazilian Soc. Mech. Sci. Eng. 40[1] (2018) 1-10.
-
- 28. R. Manikandan, T.V. Arjunan, Akhil R. Nath O.P, Compos, Part B 183 (2020) 107668.
-
- 29. O.P. Stru, E. Hibridnega, and M.N.O. Aluminija, Optimization 263 (2019) 268.
- 30. R Manikandan and T.V. Arjunan, Mater. Res. Express 7[1] (2020) 016584.
-
- 31. D. Siva Prasad and A. Rama Krishna., Int. J. Adv. Sci. Technol. 33 (2019) 51-58.
- 32. R. Manikandan, T.V. Arjunan, J. Chinese Soc. Mech. Eng. 41[4] (2020) 503-511
- 33. K.K. Alaneme, I.B. Akintunde, P.A. Olubambi, and T.M. Adewale, J. Mater. Res. Technol. 2[1] (2013) 60-67.
-
- 34. K.K. Alaneme, B.O. Ademilua, and M.O. Bodunrin, Tribology in Industry 35[1] (2013) 25.
- 35. G. Narasaraju and D. Linga Raju, Mater. Today: Proceedings 2[4] (2015) 3056-3064.
-
- 36. J.E. Oghenevweta, V.S. Aigbodion, G.B. Nyior, and F. Asuke, J. King Saud Univ. 28[2] (2016) 222-229.
-
- 37. K.K. AlanemeaΨ and A.O. Alukob, The West Indian Journal of Engineering 34[1] (2012) 2.
- 38. K.K. Alaneme amd T.M. Adewale, Tribology in Industry 35 (2013) 163-172.
- 39. A.M. Usman, A. Raji, N.H. Waziri, and M.A Hassan, IOSR J. Mech. Civil Eng. 11[4] (2014) 38-44.
-
- 40. M. Cao, X. Jin, L. Chen, L. Dong, B. Li, and X. Zhangn, J. Ceram. Process. Res. 22[4] (2021) 377-385.
-
- 41. S.D. Saravanan and M. Senthilkumar, Int. J. Eng. Technol. 5[6] (2014) 4834-4840.
- 42. H. Singh, G. Singh, and A. Aggarwal, Int. J. Res. Mech. Eng. Technol. 4 (2014) 143-145.
- 43. N.F. Mohd Joharudin, N. Abdul Latif, M.S. Mustapa, M.N. Mansor, W.A. Siswanto, J. Murugesan, and F. Yusof, Materialwiss. Werkstofftech. 50[3] (2019) 283-8.
-
- 44. N. Kawin, D. Jagadeesh, G. Saravanan, and K. Periasamy, Mater. Today: Proceedings 21 (2020) 474-476.
-
- 45. L. Venkatesh, T.V. Arjunan, and K. Ravikumar, J. Brazilian Soc. Mech. Sci. Eng. 41[7] (2019) 1-13.
-
- 46. S. Shamim, H. Singh, C. Sasikumar, and D.K. Yadav, Mater. Today: Proceedings 4[2] (2017) 2887-2892.
-
- 47. R.S.S. Raju, M.K. Panigrahi, R.I. Ganguly, and G.S. Rao, Tribology International 129 (2019) 55-66.
-
- 48. L. Natrayan, V. Sivaprakash, and M.S. Santhosh, Int. J. Eng. Adv. Technol. 8 (2018) 366-371.
- 49. A.M. Hamzah, S.K. Zakaria, S.Z. Salleh, A.H. Yusoff, A. Ali, M. Mohamad, M.N. Masri, S.A. Sobri, M.A.A. Taib, F. Budiman, and P.T. Teo, J. Ceram. Process. Res. 22 (2021) 200-207.
-
- 50. D.Q. Minh, T.V. Khai, H.N. Minh, N.V.U. Nhi, and K.D.T. Kien, J. Ceram. Process. Res. 22[2] (2021) 246-251.
-
- 51. T. Nithyanandhan and R. Ramamoorthi, J. Ceram. Process. Res. 22[4] (2021) 369-376.
-
- 52. K. Ravikumar, K. Kiran, and V.S. Sreebalaji, Measurement 102 (2017) 142-149.
-
- 53. S.R. Prabhu, A.K. Shettigar, M.A. Herbert, and S.S. Rao, Trans. Nonferrous Met. Soc. China 29[11] (2019) 2229-2236.
-
- 54. P. Dong, H. Zhao, F. Chen, and J. Li, Trans. Nonferrous Met. Soc. China 23[8] (2013) 2222-2228.
-
- 55. B.A. Kumar and N. Murugan, Mater. Des. 40 (2012) 52-58.
-
- 56. L. Zhong, Y. Zhao, S. Zhang, G. Chen, S. Chen, and Y. Liu, Trans. Nonferrous Met. Soc. China 23[9] (2013) 2502-2508.
-
- 57. X. Li, G. Zu, and P. Wang, Trans. Nonferrous Met. Soc. China 25[1] (2015) 36-45.
-
- 58. I. Balasubramanian and R. Maheswaran, Mater. Des. 65 (2015) 511-520.
-
- 59. A.F. Boostani, S. Tahamtan, Z.Y. Jiang, D. Wei, S. Yazdani, R.A. Khosroshahi, R.T. Mousavian, J. Xu, X. Zhang, and D. Gong, Comp. Part A 68 (2015) 155-163.
-
- 60. T.H. Nam, G. Requena, and P. Degischer, Comp. Part A 39[5] (2008) 856-865.
-
- 61. A. Baradeswaran, S.C. Vettivel, A.E. Perumal, N. Selvakumar, and R.F. Issac, Mater. Des. 63 (2014) 620-632.
-
- 62. M.A. Maleque, A.A. Adebisi, and N. Izzati, Mater. Sci. Eng. 184[1] (2017) 012031.
-
- 63. V. Constantin, L. Scheed, and J. Masounave, J. Tribol. 121 (1999) 787-794.
-
- 64. P.K. Rohatgi, Y. Liu, and T.L. Barr, Metallurgical Transactions A 22[6] (1991) 1435-1441.
-
- 65. S.C. Tjong, S.Q Wu, and H.C Liao, Comp. Sci. Technol. 57[12] (1998) 1551-1558.
-
- 66. A. Urena, J. Rams, M. Campo, and M. Sanchez, Wear 266[11] (2009) 1128-1136.
-
- 67. R.F. Gunst, Technometrics, 38 (1996) 284-286.
-
- 68. A.J. Sedriks and T.O. Mulhearn, Wear 6[6] (1963) 457-466.
-
- 69. R.T. Loto and P. Babalola, Cogent Engineering 4[1] (2017) 1422229.
-
- 70. A.C. Cuevas, E.B. Becerril, M.S. Martinez, and J.L. Ruiz, Metal Matrix Composites (2018.) 227-271.
-
 This Article
-
2022; 23(4): 511-522
Published on Aug 31, 2022
- 10.36410/jcpr.2022.23.4.511
- Received on Feb 12, 2022
- Revised on Mar 18, 2022
- Accepted on Apr 2, 2022
Services
- Abstract
introduction
experimental procedure
results and discussion
conclusions
- Conflict of Interest
- Funding
- References
- Full Text PDF
Shared
Correspondence to
- B. Varun
-
Assistant Professor, Department of Mechanical Engineering, Sri Ramakrishna Institute of Technology, Coimbatore 641 010, Tamil Nadu, India
Tel : +91-97876 08011 - E-mail: bvarun.me@gmail.com
Clean-Energy Research Institute(CRI), Hanyang University, 222, Wangsimni-ro, Seongdong-gu, Seoul, 04763, Korea
E-mail: jcpr@hanyang.ac.kr