


- Effect of Ni and Si addition on electrical, tribological and corrosion behavior of novel Cu-Zn alloy
Saravanan. Ra,*, Suresh. Pb, Prabu. Mc and Bagyalakshmi. Pd
aAssistant Professor, Kumaraguru College of Technology, Tamilnadu, India
bProfessor, Sona College of Technology, Tamilnadu, India
cAssociate Professor, K.S.R College of Engineering, Tamilnadu, India
dAssistant Professor, Nehru Institute of Engineering and Technology, Tamilnadu, IndiaThis article is an open access article distributed under the terms of the Creative Commons Attribution Non-Commercial License (http://creativecommons.org/licenses/by-nc/4.0) which permits unrestricted non-commercial use, distribution, and reproduction in any medium, provided the original work is properly cited.
The goal of this research is to evaluate the electrical, dry sliding wear and corrosion behaviour of copper-zinc alloy reinforced with Ni and Si through Powder Metallurgy (P/M) technique. Six different wt. % of novel copper-zinc alloy are considered for this research study namely 90Cu-10Zn, 88.16Cu-10Zn-1.5Ni-0.34Si, 85Cu-15Zn, 83.16Cu-15Zn-1.5Ni-0.34Si, 80Cu-20Zn and 78.16Cu-20Zn-1.5Ni-0.34Si. The fabricated composites were characterized by using Scanning Electron Microscope (SEM) with Energy Dispersive Spectroscopy (EDS) line mapping. The electrical, wear and corrosion behaviour of the fabricated composites was assessed. The hardness of the fabricated composites was evaluated using Vickers Hardness Tester. The electrical conductivity was assessed using four-point probe tester. The result shows a significant improvement on electrical and tribological properties by increasing the wt.% of Zn, Ni and Si led of the composites. The research results concludes that 78.16Cu-20Zn-1.5Ni-0.34Si composite possessed better hardness about 287 HV and the electrical conductivity about 121% IACS. The investigation result shows that Zn acts as a vital role to enhance the properties in all aspects. Also, the experimentation results portrays that Cu-20Zn-1.5Ni-0.34Si composite possessed better specific wear rate and coefficient of friction such as 1.85 * 10-5 mm3/N-m and 0.29 respectively
Keywords: Cu-Zn-Ni-Si, SEM, Wear, Electrical and Corrosion
Copper is one of the lightest materials in the earth, because of its sole nature. It is very light in nature compare to steel and cast-iron. Therefore, it is a very good substitute applicant for automotive applications in specific of electronic and household industries [1]. However, Cu-Zn alloys are mainly used in various industries because of its following properties like nonmagnetic and better machinability [2]. Due to its high strength-to-density ratio, a copper-zinc alloy provides good formability, stress corrosion and provides better resistance to fatigue. Recently, it has found that Zn act as a highly potential material for fast age-hardening and it provides strength to the Cu alloy. Increasing the Zn content will lead to increase the volume fraction of η precipitates because of aging [3-6]. Addition of Zn in the cu would affect the nucleation growth of grain boundary significantly. However, increasing the Zn content creates grain boundary precipitates and width of precipitate-free zones (PFZs). It act as heterogeneous nucleation and provides fast diffusion rate of solute atoms in the cu matrix. In general, dislocation always resulted that the coarse precipitate formation, which depreciate the mechanical properties. But the Cu atoms create fine precipitates in heterogeneous nucleation and limited to the diffusivity and create minimal solid solubility of Cu atoms.
The unique nature of copper is suitable for electrical applications because of its excellent electrical conduc- tivity property. Henceforth, copper alloys were used in all electrical goods and train pantograph [7-10]. Consi- dering to the properties of copper, it has good hardness but it exhibits moderate wear and corrosion resistance which is limiting their suitability for structural and trans- mission components. However, copper IUDs (Intrauterine device), presence of body fluid, it creates high wear rate and resulted to produce huge wear debris. It led to create an improper functioning of copper IUDs implantation [11-12]. Wear behaviour of the alloys are mostly dependent on some explicit criteria such as reinforcing material and sintering environment during experimentation. In specific, choice of reinforcement is a significant role for improving the properties. Therefore, more efforts are made by various researchers in-order to develop copper matrix hybrid composites for various applications. Particle reinforced metal matrix composites shows enriched mechanical and tribological properties when compared to parent material [13]. Researchers are developed copper composites through various techniques such as Casting, Powder Metallurgy (P/M) and infiltration. Owing to that powder metallurgy is better one for ease to fabricate the composites, less material wastage and also to get a net clear shape [14-16]. During sintering, Ni and Si was formed as precipitate of Ni2Si. It creates better strengthening effect between the matrix and reinforcement. Subsequently Zn, Ni and Si provide better mechanical and tribological properties to the Cu when compared to other ceramic particles [17]. One of the researcher studied the influence of alloy composition in Al–Zn–Mg–Cu alloys during heat treatment and the results directs that increasing the Zn content will lead to increase the MgZn2 precipitates and thereby increase the mechanical properties [18].
The current trend of research work given significant importance on fabrication of copper hybrid composites since the copper based applications was increased. Copper based alloys are used for heavy load applica- tions like heat exchangers, electrical motors, condensers, evaporators, containers for holding corrosive mediums and valves. Hence, the current study is focused on fabrication of copper hybrid metal matrix composites reinforced with Zn, Ni and Si. The composites were fabricated using P/M technique. The fabricated com- posites were characterized by Scanning Electron Micro- scope (SEM) with Energy Dispersive Spectroscopy (EDS) line mapping. The hardness, wear and corrosion behaviour of the composites were assessed using Vickers Micro hardness, pin-on disc wear apparatus and Electro chemical workstation.
The raw material such as copper, Zinc, Nickel and Silicon were purchased from M/S. sigma Aldrich, Germany with the purity of 99.9%. Powder metallurgy (P/M) technique is adopted for fabricate the six different composites namely 90Cu-10Zn, 88.16Cu-10Zn-1.5Ni-0.34Si, 85Cu-15Zn, 83.16Cu-15Zn-1.5Ni-0.34Si, 80Cu-20Zn and 78.16Cu-20Zn-1.5Ni-0.34Si. Initially, the raw powders were mixed by ball milling for 1 h to acquire homogenous mixture. The green compacts of the powders were fabricated using compression testing machine. Furthermore, the green compacts were sintered for 850 oC using muffle furnace. The sintered samples were polished using various grit size papers such as 400, 800 and 1000 microns. Moreover, the homogeneity of the composites is evaluated using SEM with EDS line mapping and it is displayed in Figs. 1(a-b) and 2(a-b). Fig. 1(a) and 2(a) shows the scanning electron micrograph (SEM) with energy-Dispersive Spectroscopy (EDS) analysis with line mapping of 80Cu-20Zn alloy. Two different colour shades were represented namely orange and blue for cu and Zn. It will correlate with EDS analysis also. The intensity of the cu is high when compared to Zn. It exemplifies that the presence of copper is high in the fabricated composites when compared to zinc. Fig. 1(b) and 2(b) shows the 78.16Cu-20Zn-1.5Ni-0.34Si composite. Four distinguish colours shades were represented namely orange, blue, violet and green for Cu, Zn, Ni and Si. It correlates with EDS analysis. Here also the intensity of the copper is high, it shows that the presence of copper is high in the com- posites. After that the required quantity of Zn, Ni and Si is reinforced in the composites. Optical microscope images of the fabricated composites were shown in Figs. 3(a-f). From the Fig. 3, it illustrates that the grains are in faced in elongated direction and laves phases are also identified in the radial direction.
The wear behaviour of the composites is assessed using Pin-on-disc apparatus. In this study, applied load was varied from 5 N to 20 N and sliding velocity was also varied from 0.5 m/s to 2 m/s with the increment of 5 N and 0.5 m/s. For this experimentation, sliding distance was kept constant for 1000 m. After experi- mentation was performed the volume loss was calculated. Based upon this volume loss the specific wear rate was evaluated. Another output parameter such as coefficient of friction was calculated by using frictional force which is acquired during experimentation. Specific wear rate and Coefficient of friction was calculated based upon the following Eqs. (1) and (2).
Where,
SWR = Specific wear rate
Vl = Volume loss
L = Applied load
CoF = Coefficient of friction
D = Sliding distance
By using, four-point probe tester in a nitrogen atmosphere the electrical conductivity of the samples is evaluated.
|
Fig. 1 SEM with EDS Line mapping of (a) 80Cu-20Zn and (b) 78.16Cu-20Zn-1.5Ni-0.34Si. |
|
Fig. 2 EDS of (a) 80Cu-20Zn and (b) 78.16Cu-20Zn-1.5Ni-0.34Si. |
|
Fig. 3 Optical Microscope Image of (a) 90Cu-10Zn, (b) 88.16Cu-10Zn-1.5Ni-0.34Si, (c) 85Cu-15Zn, (d) 83.16Cu-15Zn-1.5Ni-0.34Si, (e) 80Cu-20Zn and (f) 78.16Cu-20Zn-1.5Ni-0.34Si. |
Hardness and Electrical Conductivity Measurement
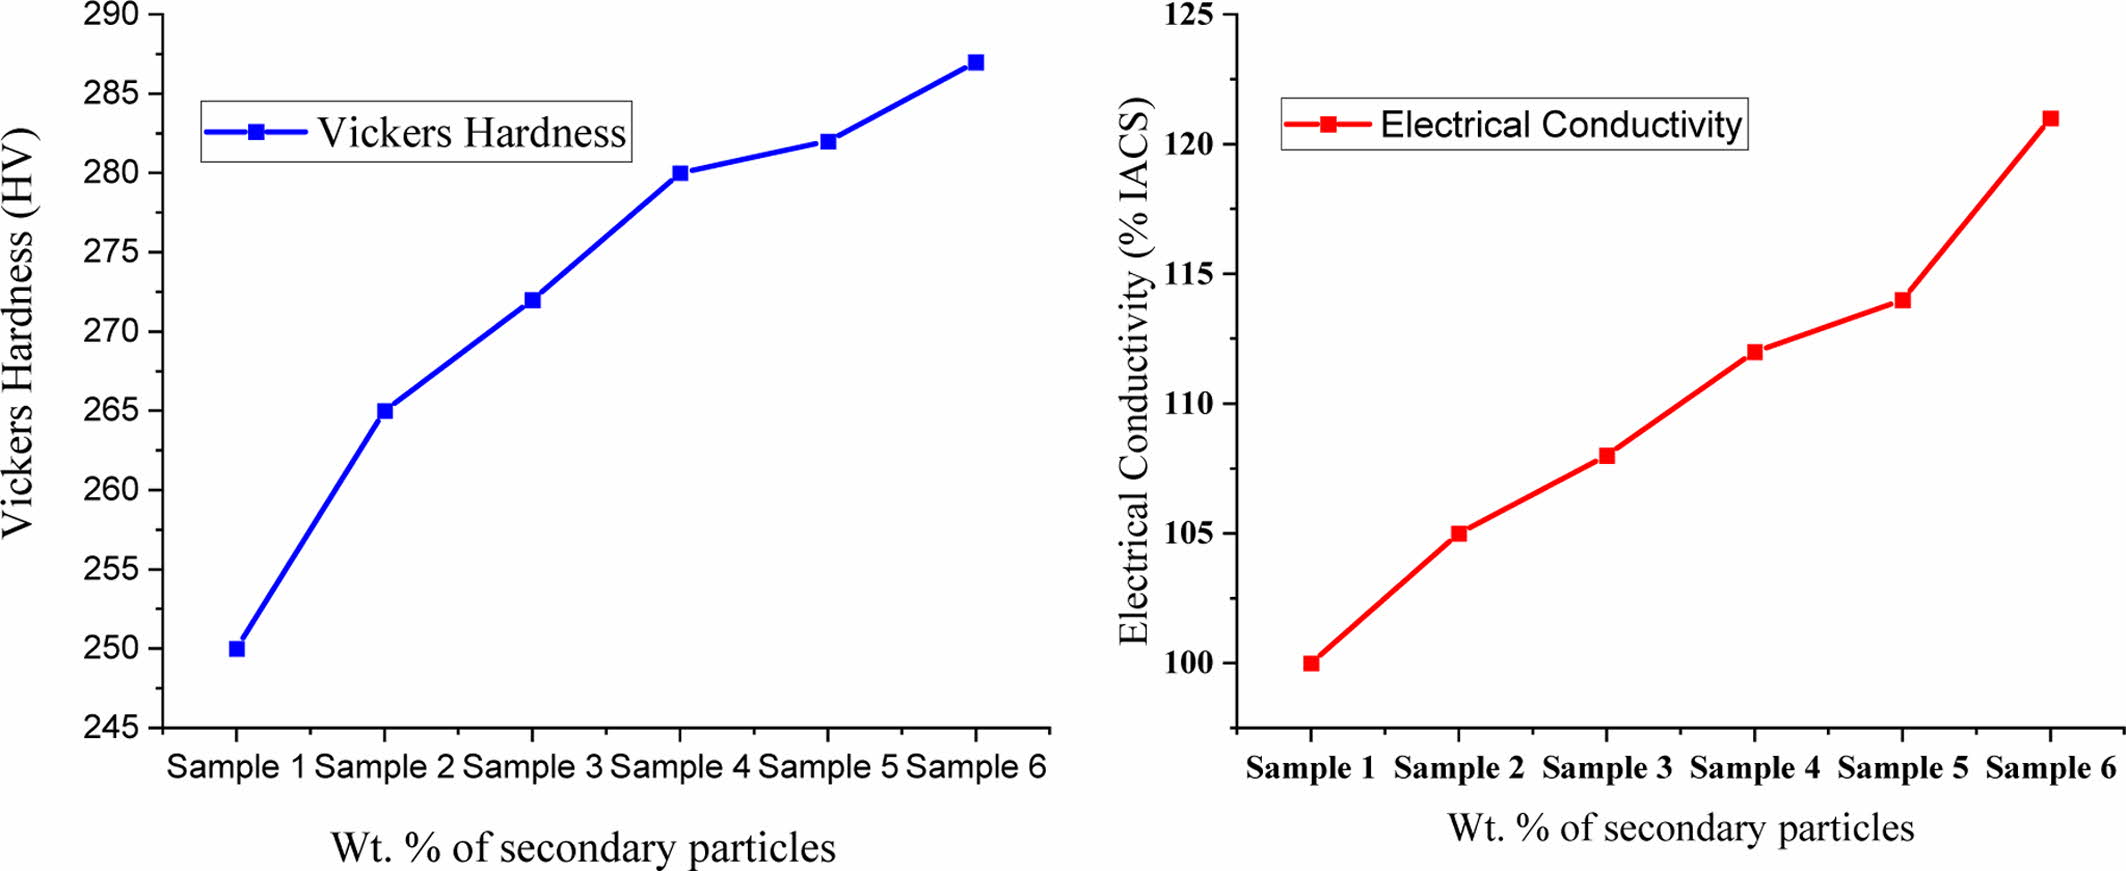
Fig. 4(a) shows the variation of Vickers hardness of Cu-Zn alloy. It illustrates that constant development was perceived in the fabricated composites because of the reinforcing agent. The improvement of hardness would be dependent on how the secondary particle was distributed in the matrix [10]. The hybrid composite 78.16Cu-20Zn-1.5Ni-0.34Si possessed better hardness having in the range of 287 HV. It has been observed from preliminary research work that relative density would be the maximum influencing for better hardness. This research fabricated samples attains with 90% of relative density. The relative density is directly proportional to the porosity There forth, the porosity of the hybrid composites is very minimal is less than 10%. For the convenience, the graph (Refer Fig. 4(a) and (b)) X-axis was plotted based on the sample numbers. Sample -1: 90Cu-10Zn, Sample 2: 88.16Cu-10Zn-1.5Ni-0.34Si, Sample 3: 85Cu-15Zn, Sample 4: 83.16Cu-15Zn-1.5Ni-0.34Si, Sample 5: 80Cu-20Zn and Sample 6: 78.16Cu-20Zn-1.5Ni-0.34Si.
Fig. 4(b) shows the electrical conductivity of the composites with gradual improvement while reinforcing the secondary particles [18]. Electrical conductivity is mainly linked with the mechanical integrity. Therefore, the hardness and density are playing a key indications in-order to improve the electrical conductivity. In general Cu is act as a good conductor, but alloying of Zn, Ni and Si will enhance the electrical conductivity of the Cu. From the Fig. 4b, it illustrates that % IACS for 90Cu-10Zn possessed 100% IACS. There was a steady rise was detected while reinforcing the alloying element and the maximum was obtained for 78.16Cu-20Zn-1.5Ni-0.34Si as 121% IACS. This was happening because of the Ni2Si precipices are formed in the Cu-Zn alloy during solid state sintering.
Difference of specific wear rate with respect to applied load and sliding velocity
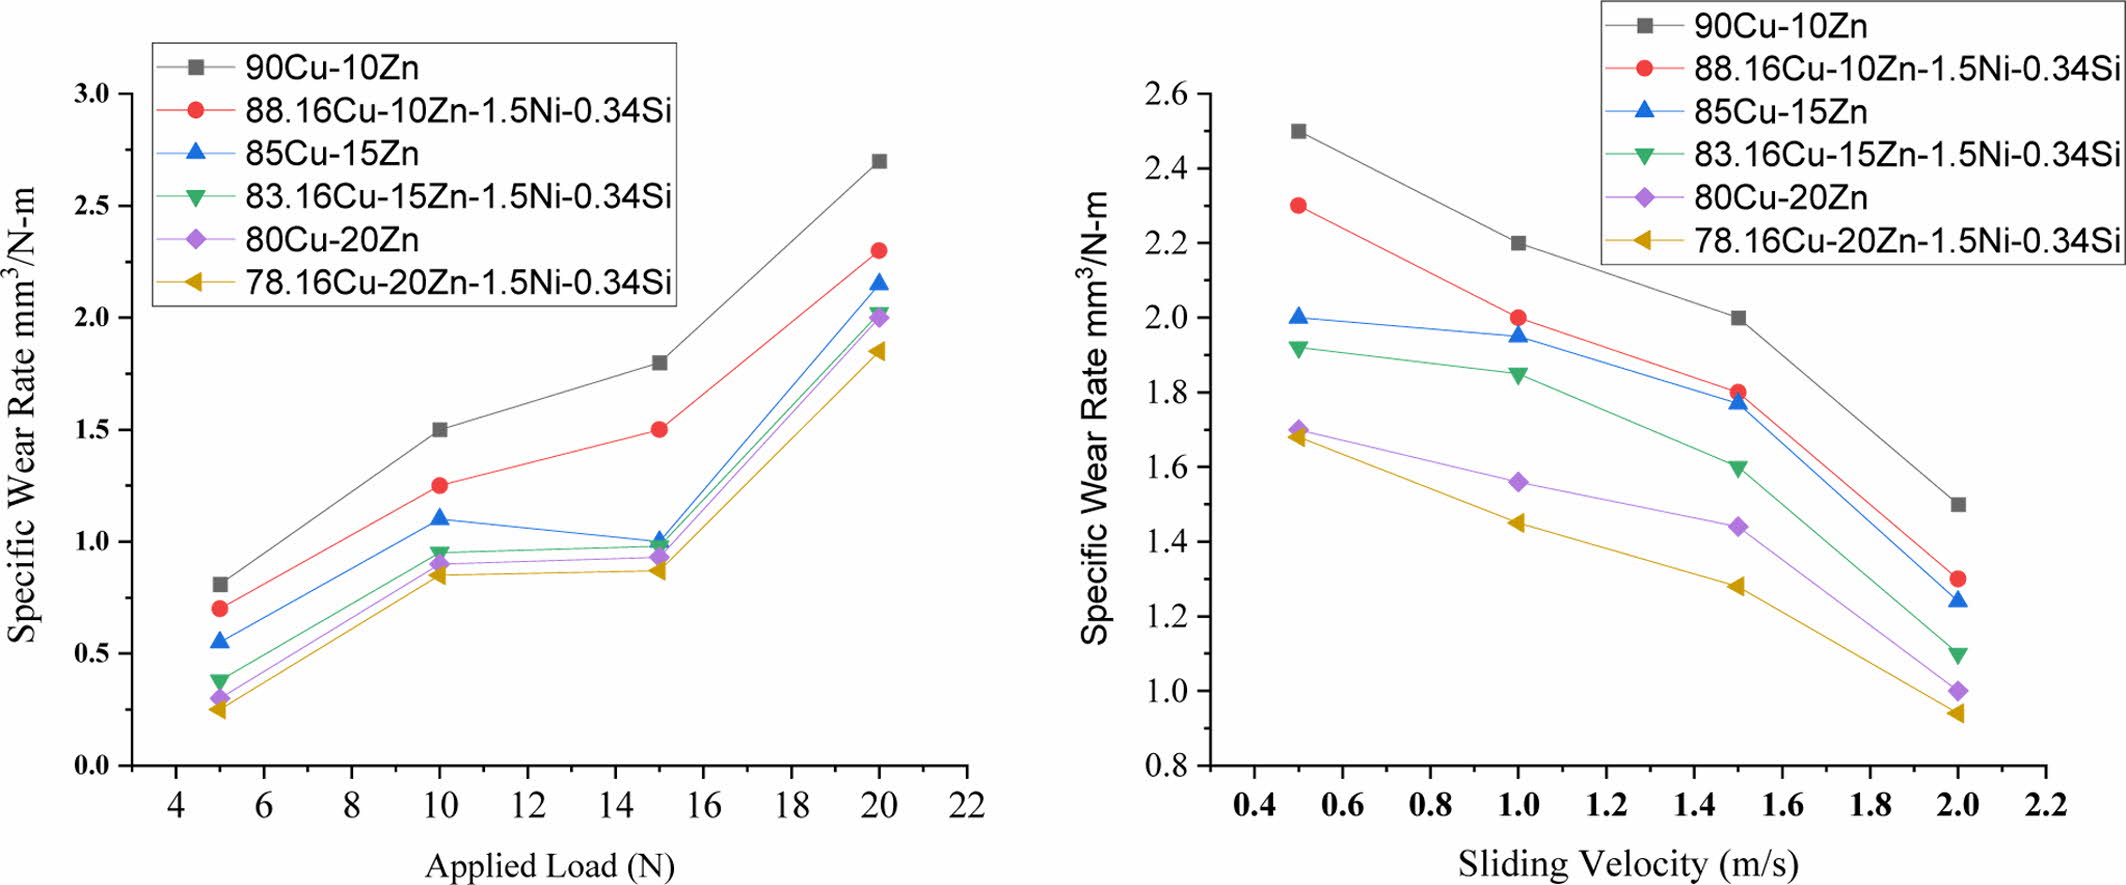
Specific wear rate difference was calculated based upon the Eq. (1) and it displayed in Fig. 5(a) and 5b. The graph clearly shows that increasing the load would lead to increase the specific wear rate irrespective of the composites. But, the alloying elements such as Ni and Si particles act a significant role in the fabricated composites and tern to reduce the specific wear rate. It was happening, because of solid state reaction was happened during sintering and Ni2Si precipitates were formed and it’s fashioned to improved solidification effect between the matrix and reinforcement. Initially, the specific wear rate was high for all the composites, because of the metal contact. While the time get extent, Ni2Si precipitates, creates protective layer between the composites and counter surface. It reduces the specific wear rate, irrespective of the wt.% of the hard ceramic particles. The hybrid composite 78.16Cu-20Zn-1.5Ni-0.34Si possessed better wear resistance property compare to other composites. Fig. 5(a), shows the variation of specific wear rate with respect to sliding velocity. The opposite phenomenon was observed in this case, increasing the sliding velocity led to reduce the specific wear rate [19-20]. It was occurred because of not proper contact between the samples and the counterpart during high sliding velocity and thus decrement of specific wear rate was acquired.
Coefficient of friction with respect to applied load and sliding velocity
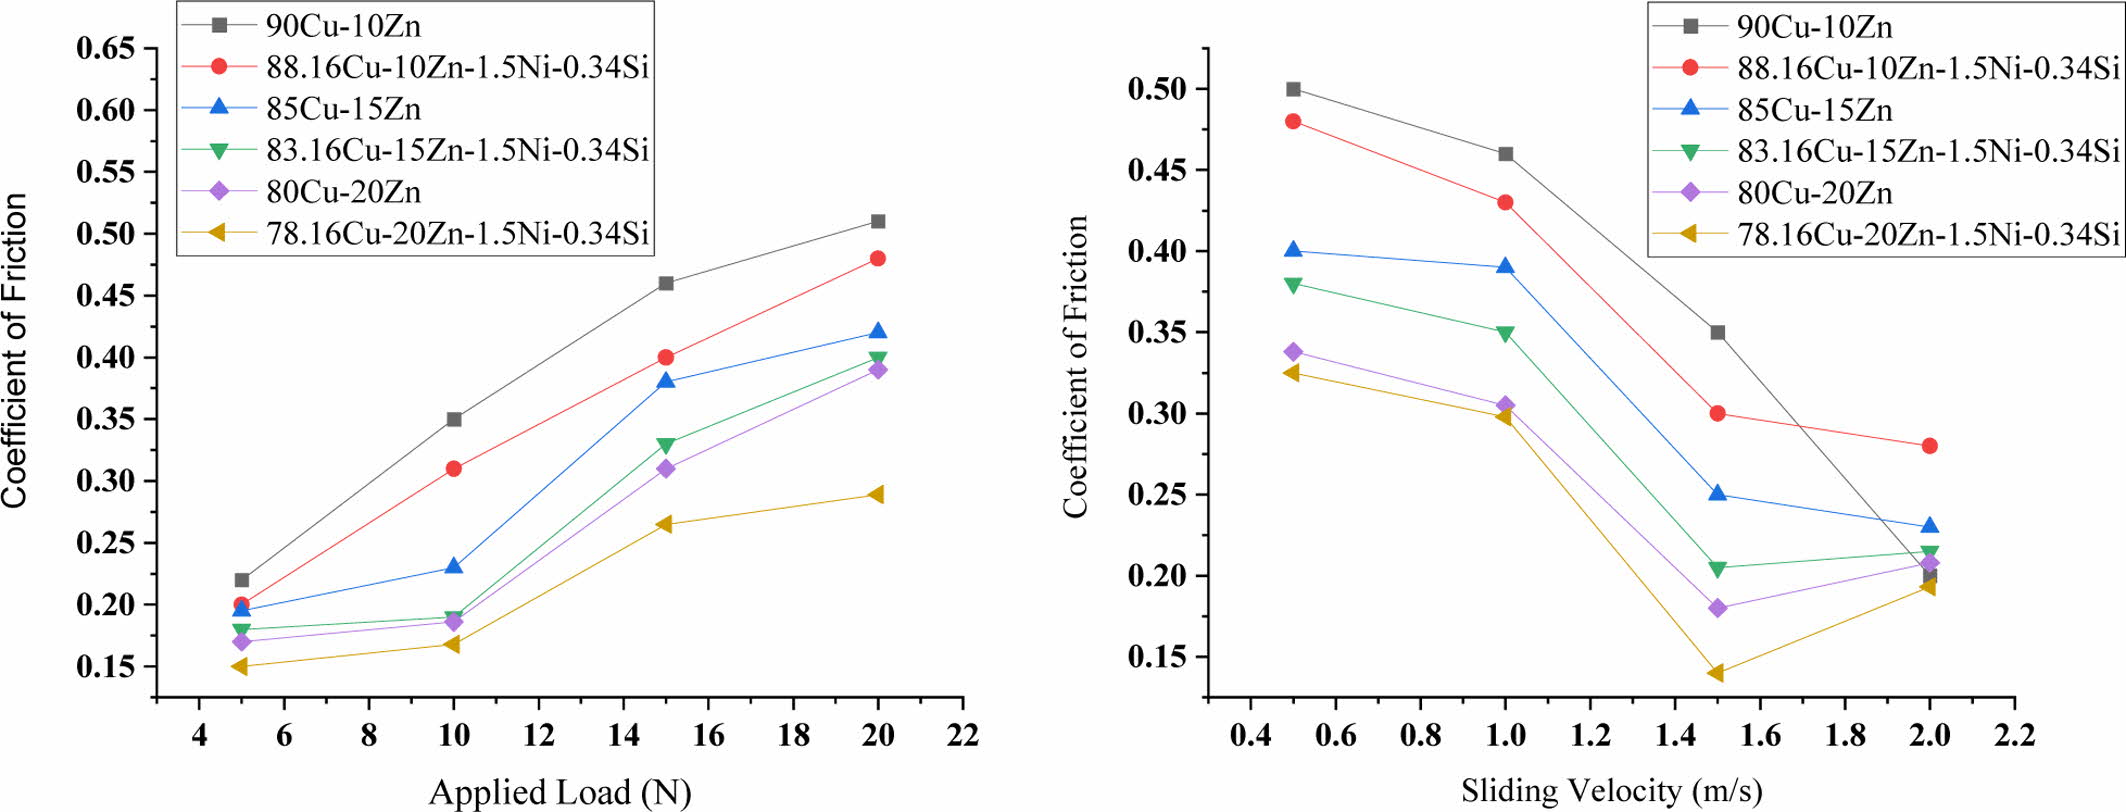
Variation of coefficient of friction with respect to applied load and sliding velocity are shown in Figs. 6(a)-6(b). The graph clearly deliberated that increasing the load would lead to increase the coefficient of friction to the irrespective of composites. But, the alloying elements such as Ni and Si particles act a significant role in the fabricated composites and tern to reduce the coefficient of friction. It was happening, because of during sintering Ni2Si precipitates were formed and it’s created better strengthening effect between the matrix and reinforcement and its tern to reduce the coefficient of friction. The increment of load creates more pressure on the samples. The applied load directly influences the friction between the samples and counterpart. Simultaneously, the working temperature is also increased between the composites and counterpart. It leads to increase the coefficient of friction. However, the alloying element act as defending layer on coefficient of friction and further to enhance increment of friction. In other hand, during experimentation due to the environmental conditions the oxides were formed between the sample surfaces. The formation of oxide was propagated and formed a layer on the sample surface and protects the samples from friction [19-20]. The results shows that the hybrid composite 78.16Cu-20Zn-1.5Ni-0.34Si possessed less coefficient of friction compare to other composites. Fig. 5(a) shows the variation of coefficient of friction with respect to sliding velocity. The opposite phenomenon was observed, increasing the sliding velocity led to reduce the friction. This was happening because of not proper contact was acquired between the samples and the counterpart and thus decrement of coefficient of friction was attained.
Worn surface analysis
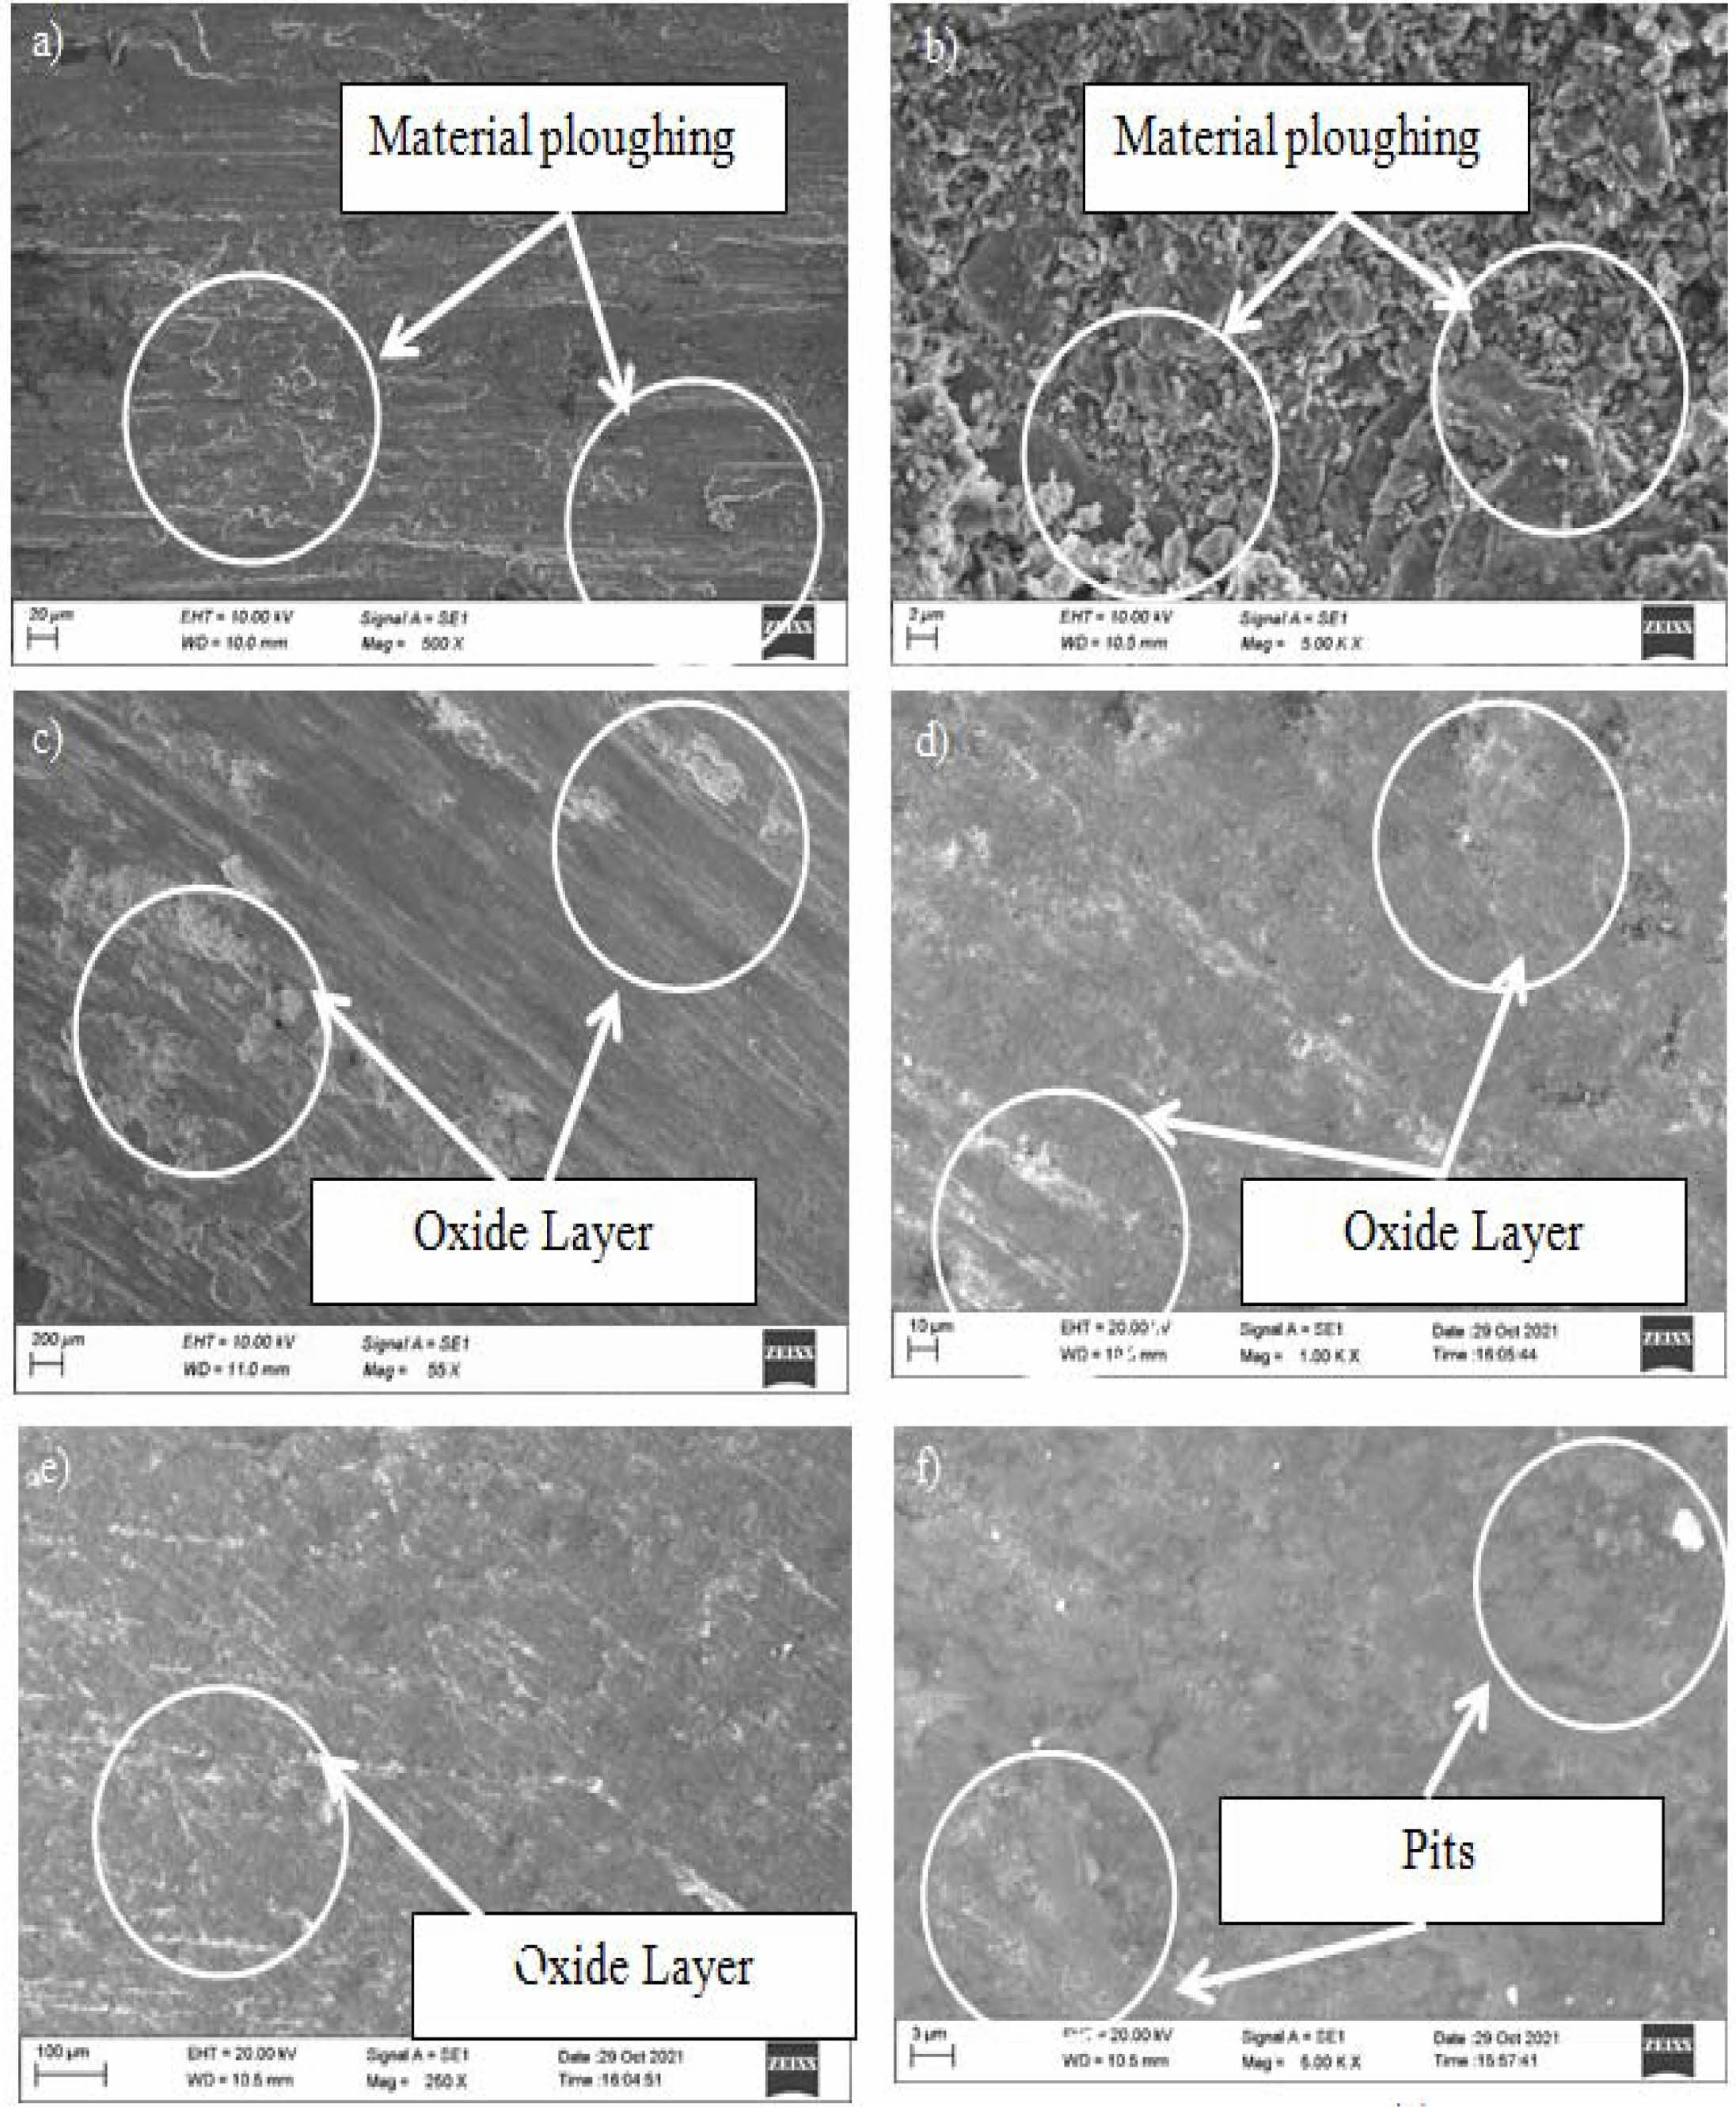
SE micrograph of worn surface was evaluated after experimentation and deliberated in Figs. 7(a) - 7(f). From the Fig. 7, it reveals that adhesion mechanism is acquired for 90Cu-10Zn composites. It creates severe plastic deformation and many materials ploughings was observed on the specimen surface. It increases the wear and it closely correlate with Figs. 5(a) and 5(b). Increasing the alloying element such as Ni and Si leads to increase the wear behaviour of the composites. Few craters and pits [21] were viewed on the sample surface of 88.16Cu-10Zn-1.5Ni-0.34Si and it displayed in Fig. 7(b). Ni and Si create Ni2Si precipitates and thus forms oxide layer on the sample surface. It clearly seen in Fig. 7(c) & (d) and thus reduces wear. Fig. 7(c, d and e) shows the surface morphology 85Cu-15Zn, 83.16Cu-15Zn-1.5Ni-0.34Si and 80Cu-20Zn composites. Some of the clusters and pits are seen in the surface [22-23]. It also reduces the friction and wear. Fig. 7f shows that bulky pits and delamination wear was also observed on 78.16Cu-20Zn-1.5Ni-0.34Si surfaces. It reduces the plastic deformation following to that reduction of the specific wear rate and coefficient of friction.
Corrosion behaviour
The corrosion resistance of the fabricated samples was analysed using polarization technique. Standard 3.5 wt.% NaCl solution was used for this study. In this study Cu-Zn which is having more active in nature and it takes as counter electrode and Ag/AgCl is taken as reference electrode and electrolyte is as NaCl [24]. During electrolysis process Cu-Zn act as anode and Ag/AgCl is act as cathode. Since it is more active in nature, the oxidation process is taken place on anodic side and reduction was taken place on cathodic side.
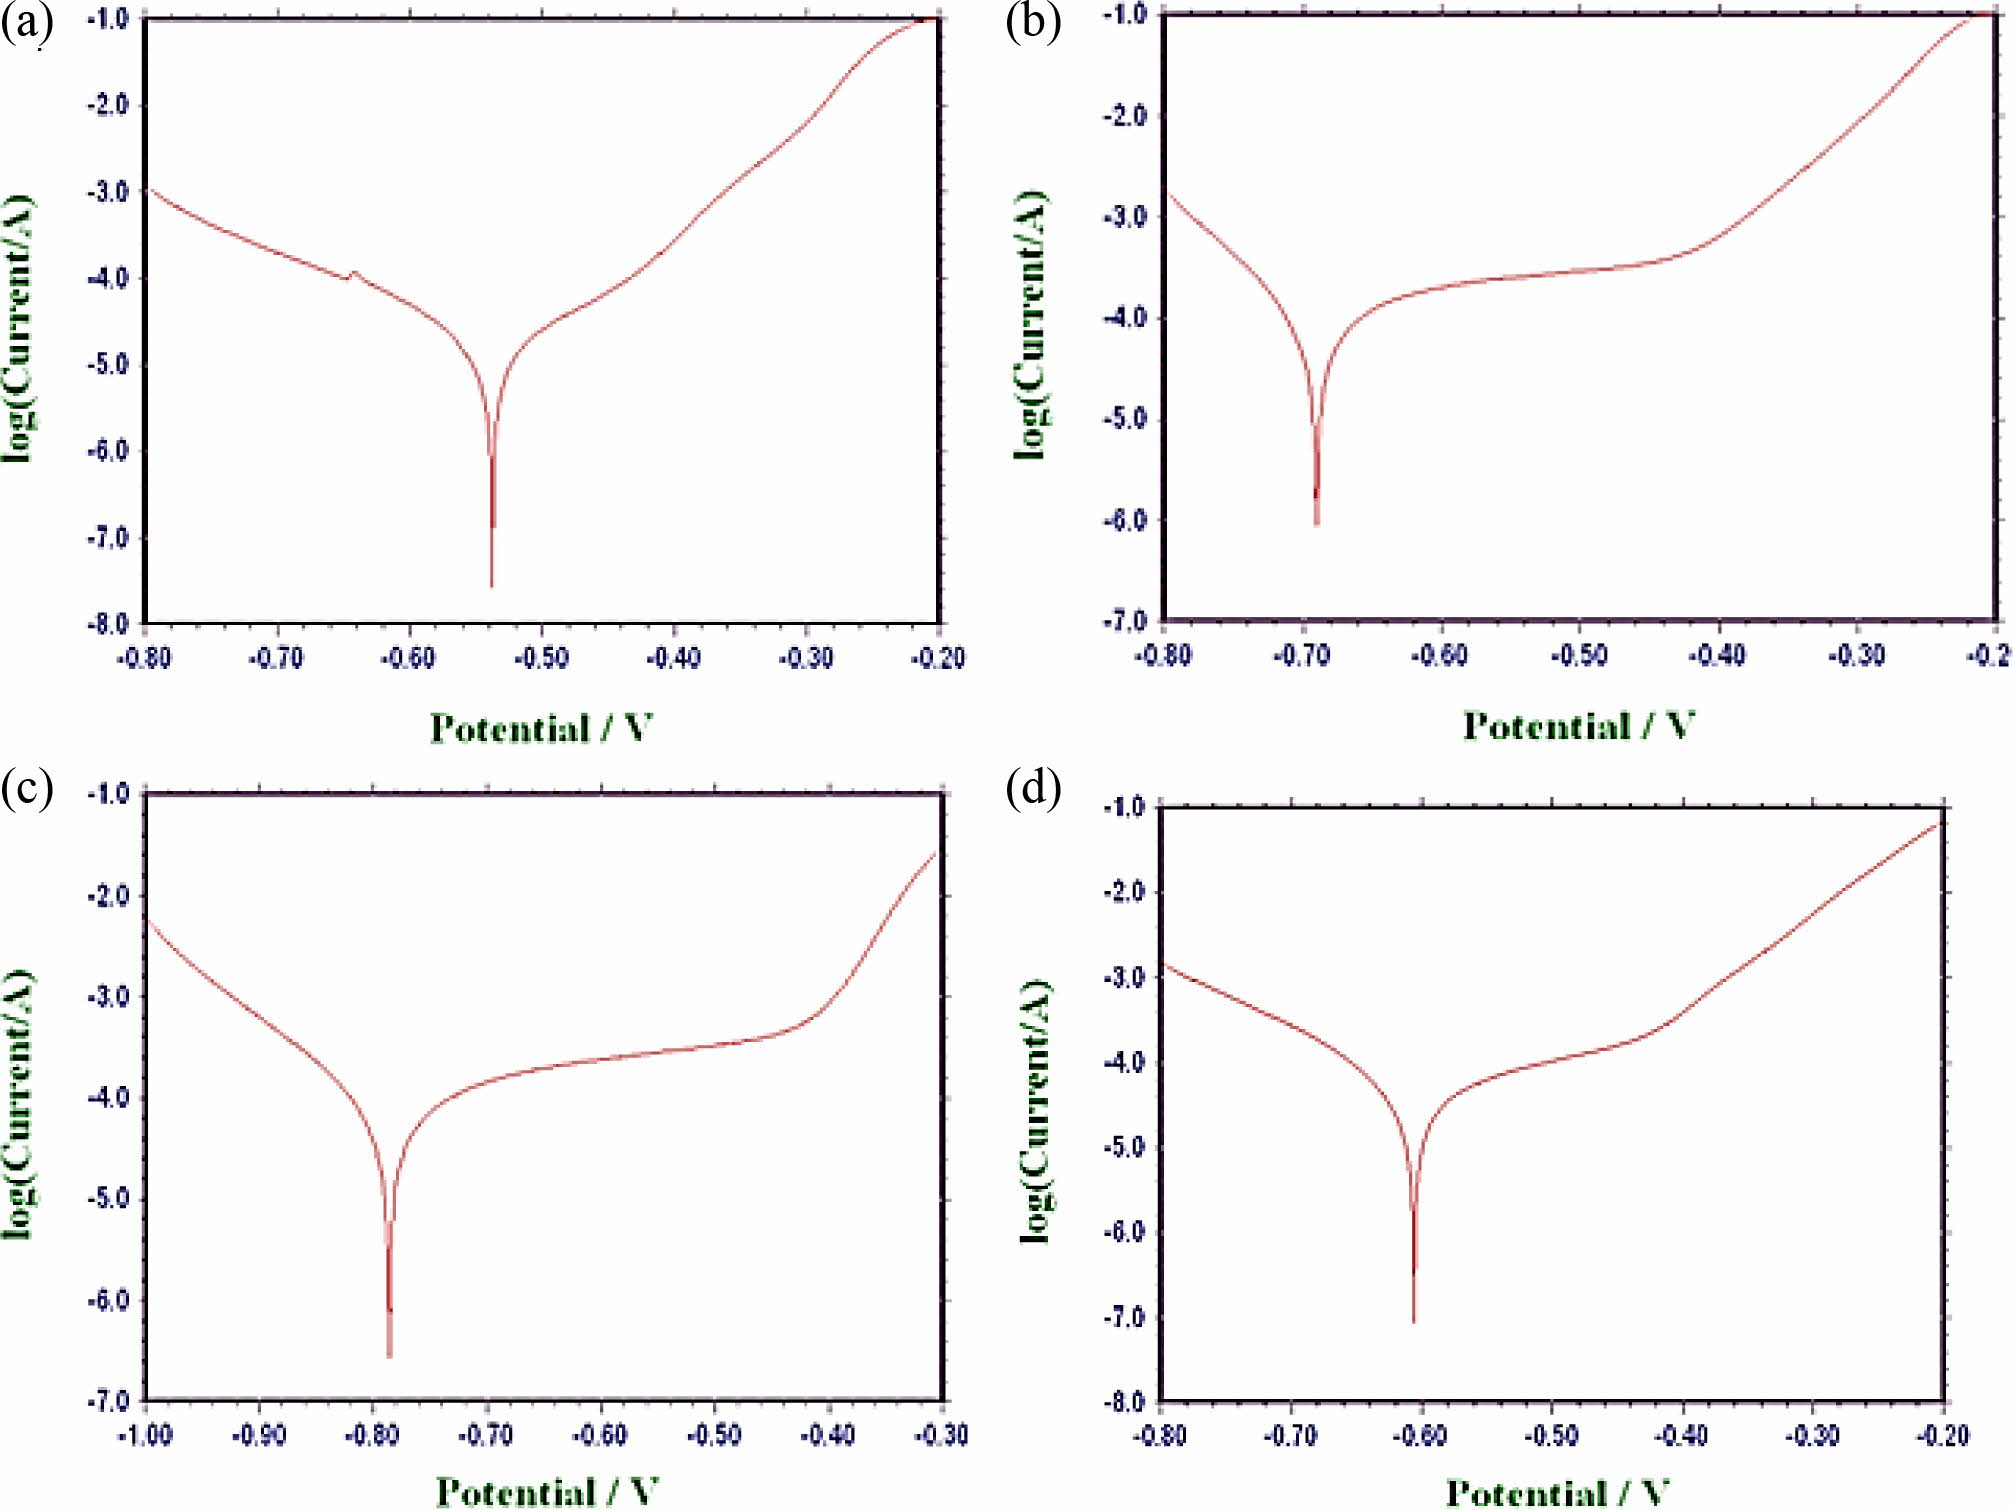
According to the mixed potential theory, corrosion potential Ecorr is high for 83.16Cu-15Zn-1.5Ni-0.34Si (0.75 V). Following to that corrosion current density Icorr is low (1.458e-004) for the above sample. It confirms that the corrosion resistance is high for 78.16Cu-20Zn-1.5Ni-0.34Si composites (1.658e-004) than other samples.
Figs. 8(a-d) shows the TAFEL exploration of various samples and it clearly illustrates that for Cu-Zn alloy possessed low corrosion resistance and it had huge amount of corrosion potential, and subsequent that 78.16Cu-20Zn-1.5Ni-0.34Si composites displays low corrosion potential and corrosion current density. It is clearly evident that provides less corrosion potential.
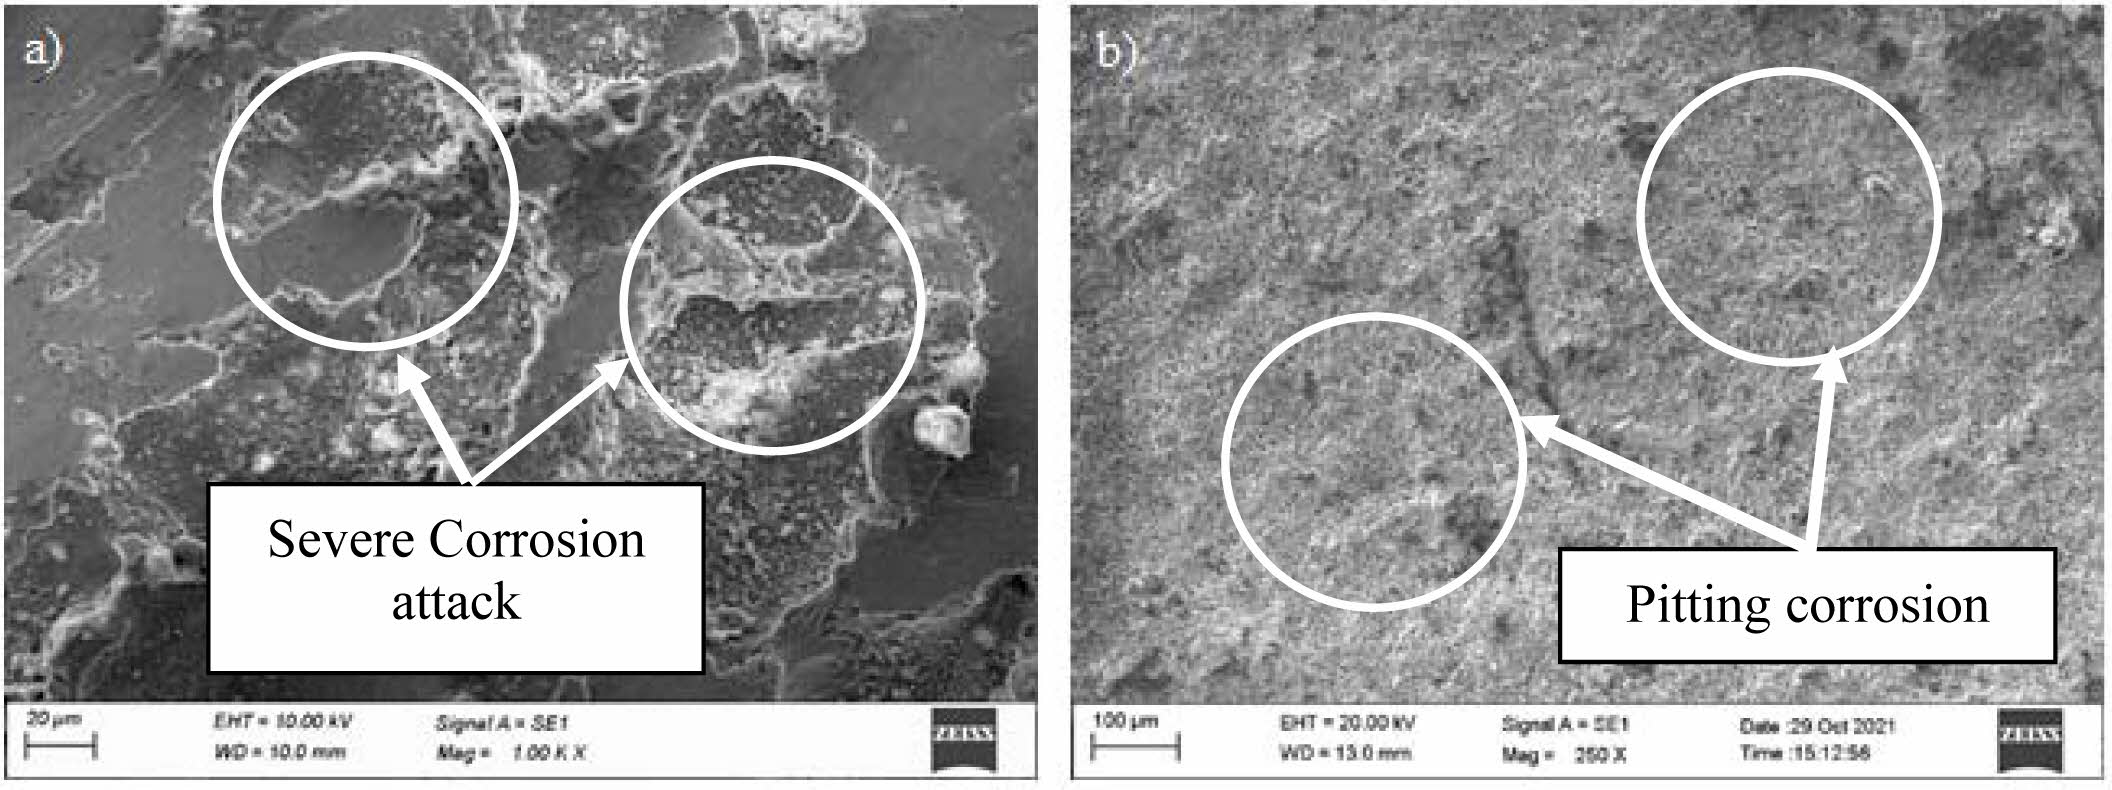
Further, the fabricated samples were analysed in the terms of morphological characterization after corrosion experimentation, also it is displayed in Fig. 9(a-b). Fig. 9(a) shows the 88.16Cu-10Zn-1.5Ni-0.34Si alloy surface. Severe corrosion attack was taken place on the samples and more amount of pitting was also viewed on the sample surfaces [12-13]. It leads to decrease the corrosion resistance. Minor pitting was observed on 88.16Cu-10Zn-1.5Ni-0.34Si, 85Cu-15Zn, 83.16Cu-15Zn-1.5Ni-0.34Si and 80Cu-20Zn composite surfaces. Very few pitting and not severe attack by solution was taken place, on 78.16Cu-20Zn-1.5Ni-0.34Si composites and displayed in Fig. 9(b). It provides better corrosion resistance. It also confirms by the tafel exploration [24].
|
Fig. 4 (a) Variation of hardness of Cu-Zn composites and (b) Variation of electrical conductivity of Cu-Zn composites. |
|
Fig. 5 Variation of specific wear rate over to (a) applied load and (b) sliding velocity. |
|
Fig. 6 Variation of coefficient of friction over to (a) applied load and (b) sliding velocity. |
|
Fig. 7 Worn surface SEM micrograph (a) 90Cu-10Zn, (b) 88.16Cu-10Zn-1.5Ni-0.34Si, (c) 85Cu-15Zn, (d) 83.16Cu-15Zn-1.5Ni-0.34Si, (e) 80Cu-20Zn and (f) 78.16Cu-20Zn-1.5Ni-0.34Si. |
|
Fig. 8 (a-d) Tafel Exploration plot for (a) 88.16Cu-10Zn-1.5Ni-0.34Si, (b) 83.16Cu-15Zn-1.5Ni-0.34Si, (c) 80Cu-20Zn and (d) 78.16Cu20Zn-1.5Ni-0.34Si. |
|
Fig. 9 Corroded surface morphology (a) 88.16Cu-10Zn-1.5Ni-0.34Si and (b) 78.16Cu-20Zn-1.5Ni-0.34Si. |
Increasing the load will led to increase the specific wear rate irrespective of the composites. But, the alloying elements such as Ni and Si particles act an important role for fabricated composites and tern to reduce the specific wear rate and Coefficient of friction.
According to sliding velocity as concern, increasing the sliding velocity will leads to decrease the specific wear rate and coefficient of friction irrespective of the composites.
However, 78.16Cu-20Zn-1.5Ni-0.34Si perceived min- imum coefficient of friction over to other composites.
Maximum electrical conductivity was obtained for 78.16Cu-20Zn-1.5Ni-0.34Si composites at the rate of 121% IACS.
Bulky pits and delamination wear were also observed on 78.16Cu-20Zn-1.5Ni-0.34Si composite surfaces. It causes the plastic deformation which reduces the specific wear rate and coefficient of friction simultaneously.
There is no evident of severe crack on corroded surface of 78.16Cu-20Zn-1.5Ni-0.34Si composite, thus provides better corrosion resistance.
- 1. W. Chen, Y. Jia, J. Yi, M. Wang, B. Derby, and Q. Lei, J. Mater. Res. 32 (2017) 3137-3145.
-

- 2. Z. Zheng, P. Guo, J. Li, T. Yang, Z. Song, C. Xu, and M. Zhou, J. Alloys Comp. 831 (2020) 154842.
-
- 3. L. Zhu, M. Guo, and J. Zhang, Mater. Sci. Eng. A 826 (2021) 142013.
-
- 4. B. Yuan, G. Li, M. Guo, and L. Zhuang, J Mater. Res. Technol. 1[5] (2021) 5059-5077.
-
- 5. Q. Yang, Q. liu, X. Liu, Y. Lei, Y. Jiang, J. Xie, Z. Li, J. Alloys Comp. 893 (2022) 162302.
-
- 6. Y.V. Gamin, J.A.M. Bolanos, A.S. Aleschenko, A.A. Komissarov, N.S. Bunits, D.A. Nikolaev, A.V. Fomin, and V.V. Cheverikin, Mater. Sci. Eng. A 822 (2021) 141676.
-
- 7. H. Wei, Y. Chen, Y. Zhao, W. Yu, L. Su, and D. Tang, Mater. Sci. Eng. A 814 (2021) 141239.
-
- 8. F. Liu, X. Zhu, and S. Ji, J. Alloys Comp. 821(2020) 153458.
-
- 9. J.K. Odusote, A.A. Adeleke, S.A. Muraina, P.P. Ikubanni, and I.M.B. Omiogbemi, Mater. Today: Proceed. 46 (2021) 5914-5921.
-
- 10. Z. Yu, T. Yuan, M. Xu, H. Zhang, X. Jiang, and S. Chen, J. Manuf. Process. 62 (2021) 430-439.
-
- 11. Z. Peng, T. Zhou, Y. Li, Z. Cui, Z. Wu, and J. Yan, Mater. Des. 197 (2021) 109218.
-
- 12. X. Chen, D. Xia, J. Zhang, G. Huang, K. Liu, A. Tang, B. Jiang, and F. Pan, J. Alloys Comp. 846 (2020) 156306.
-
- 13. N.J. Li, X.N. Li, Z.M. Li, Q.X. Yu, Y.H. Zheng, Y.L. Hu, Q. Wang, C. Dong, Y.X. Jiang, and X.W. Zhang, Intermetallics 125 (2020) 106894.
-
- 14. H.C. Alexander Chee, R.S.K. Singh, and K.Y. Sara Lee, J. Ceram. Process. Res. 21 (2020) 495-500.
-
- 15. P.-H. Uk, T.-J. Chung, and H. Lee, J. Ceram. Process. Res. 18 (2017) 440-444.
- 16. J.-I. Lee, J. Hwang, C.W. Hong, and J.H. Ryu, J. Ceram. Process. Res. 16 (2015) 428-431.
- 17. B. Jarulertwathana, Thapanee Sarakonsria, J. Ceram. Process. Res. 15 (2014) 389-392.
- 18. T. Marlaud, A. Deschamps, F. Bley, W. Lefebvre, and B. Baroux, Acta Materialia 58 (2010) 248-260.
-
- 19. A. Nakao, Y. Shimotsuma, M. Nishia, K. Miura, and K. Hirao, J. Ceram. Process. Res. 9 (2008) 425-429.
- 20. K. Murai, Y. Watanabe, Y. Saito, T. Nakayama, H. Suematsu, W. Jianga, K. Yatsui, K.B. Shim, and K. Niihara, J. Ceram. Process. Res. 8 (2007) 114-118.
- 21. M. Qi, Y. Xu, J. Li, Y. Kang, and Z. Wulabieke, Corrosion Sci. 180 (2021) 109180.
-
- 22. R. Zhao, W. Zhu, J. Zhang, L. Zhang, J. Zhang, and C. Xu, Mater. Sci. Eng. A 788 (2020) 139594.
-
- 23. S.P. Dwivedi, A.K. Mishra, and V.R. Mishra, J. Ceram. Process. Res. 20 (2019) 632-642.
-
- 24. S.-H. Ahna and K.-W. Nam, J. Ceram. Process. Res. 18 (2017) 646-658.
 This Article
-
2022; 23(4): 490-497
Published on Aug 31, 2022
- 10.36410/jcpr.2022.23.4.490
- Received on Jan 21, 2022
- Revised on Mar 22, 2022
- Accepted on Mar 22, 2022
Services
Shared
Correspondence to
- Saravanan. R
-
Assistant Professor, Kumaraguru College of Technology, Tamilnadu, India
Tel : +919003926788 Fax: +919003926788 - E-mail: sowmiyap2110research@gmail.com
Clean-Energy Research Institute(CRI), Hanyang University, 222, Wangsimni-ro, Seongdong-gu, Seoul, 04763, Korea
E-mail: jcpr@hanyang.ac.kr