


- Multiobjective optimization process of Ti6Al4V alloy using MWCNTs dispersed cutting fluid in turning operation
Senthil Kumar La,*, Savadamuthu Lb and Manivel Cc
aSNS College of Engineering, Coimbatore, Tamilnadu, India 641 107
bSNS College of Technology, Coimbatore, Tamilnadu, India 641 035
cNehru Institute of Engineering and Technology, Coimbatore, Tamilnadu, India 641 105This article is an open access article distributed under the terms of the Creative Commons Attribution Non-Commercial License (http://creativecommons.org/licenses/by-nc/4.0) which permits unrestricted non-commercial use, distribution, and reproduction in any medium, provided the original work is properly cited.
Turning is one of the precise machining processes, which are widely used at present for many industrial applications. Titanium alloy Ti6Al4V is widely implemented in the field of aerospace, structural, automotive and biomedical applications. In this study, the most significant factor of Cutting Force, Cutting Temperature and Material Removal Rate is considered the most responsible for determining the desirable input factors to the titanium Ti6Al4V alloy in the turning process. Initially, the design of the experiment was conducted for speed, cutting feed, axial depth of cut and the environmental eco-friendly coolant oil concentration of Multi-Walled Carbon Nanotubes nano-fluid are input parameters of machining process were studied in turning of titanium Ti6Al4V alloy to achieve sustainable production. Desirability Function Analysis was used to predict the mathematical model and ANOVA was used to analyze the contribution percentages of the machining parameters. Since the influence of the machining parameters of the Cutting Force, Tool Temperature and Material Removal Rate are conflicting in nature; the problem was considered a Multi-objective evaluator algorithm-based analysis of the problem. Hence, Desirability Function Analysis was adapted to predict the optimal set of input parameters. The interactive plots reveal that MWCNT’s nanofluid improves the result in terms of the maximum rate of removed material with minimum cutting force and cutting temperature. Based on multi-objective optimizations of RSM based DFA the optimal results confirm that 1% of MWCNT’s concentration reduces the cutting temperature and improves the removal of material when MWCNTs are used as cutting fluid
Keywords: Ti-6Al-4V, MWCNT, RSM, MRR, DFA, ANOVA etc
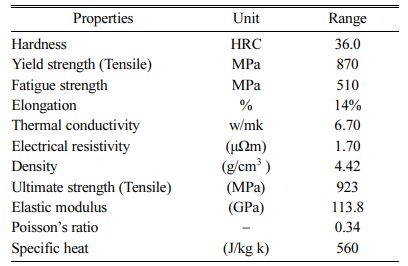
Titanium and its alloys have a huge variety of immense properties together with temperature resistance, light- weight, high strength to weight ratio and corrosion resistance [1, 2]. Due to its special and large properties compare to different materials, atomic number 22 alloys are abundantly utilized in many industrial applications like automotive, aero and medical. Ti-6Al-4V is an alloy (α + β) that is the most generally used titanium alloy, with the α part stabilizing 6% metallic element and β phase stabilizing 4% vanadium [2, 3]. Ti-6Al-4V is the most essential used material, particularly within the medical and aerospace industry. Although, Ti-6Al-4V machining is incredibly tough because of heat resistance, inherent chemical properties and impulsive and dispensation time interval is high and production costs are huge while exploitation typical strategies to machine it [4]. It is suitable for use in an exceedingly kind of applications and conditions. It had been noted that causing of reduced tool yield strength by high machining temperature together with continuous tool surface result the pressure would guide to extend the tool wear. Cutting of Titanium alloys and their Machining are a complicated process, time challenging and expensive [5].
Titanium alloys are tremendously hard and incredible heat generation materials, which resulted in increased tool wear [4, 5]. To improve the production rate and good quality of the product needs a special cooling system. This also helps to enhance tool life and to reduce the tool life [6]. The variation in microstructure and or phase transition causing deterioration of mechanical properties was observed in heat generated between the tool and work material of Titanium and its alloy material because of its particular material properties [7]. Turning is among the most preferable machining process due to its precision in cutting, better surface finish and closure tolerance [8]. A dry machining situation is one technique of machining that even though environmentally pleasant because no agent is used, regularly affects problems because of the greater generated warmness in the device or work piece interface. With the purpose to minimize the greater generated temperature in the machining system, coolant utilization is normally required. In general, during dry machining of harder materials like titanium, a huge amount of heat was produced and dissipated at the edge of tool. Due to this observed heat tool gets depreciation or bluntness [9]. Even though flood coolant carries a noticeable ability to lower the warm temperature in the reducing zone, its poor environmental effect and consequently the cost of the quantity of reducing fluid used to construct it is an unsustainable cooling approach. Therefore, a minimal amount of lubrication (MQL) is taken into consideration as an ability one of a kind cooling approach to traditional flood cooling. As producers forever and ever get to lower production expenses and material waste and enhance fitness and safety, this MQL technique has come to be a variety of desirable. Instead of victimization MQL performance, nanoparticles may be accessorial to nano primarily based on totally reducing fluid to help use up warmness generated at some stage in the machining system [10]. Due to their excellent properties, nanoparticles provide the next heat conduction load compared to inferior cooling lubricants. The choice of machining process parameters is incredibly difficult to solve with a mix of newer materials and cutting tools, in this case, the method planner. Researchers have to do several test runs to find the most favourable machining parameters and their optimal level, which leads to a high value and takes more time. Improvements are needed to limit time and cost in selecting process parameters for intelligent materials processing. The process can be a widely used machining process in recent days in the field of automotive, biomedical, die and mould, and aerospace industries [11].
The development of chips produced curled or buckled shapes during the high-speed machining process due to physical effects. Therefore, here the cooling system and fluid supply study were necessary part take in the machining process, which can significantly improve the productivity of machining operation, quality product and surface finish of work along with enhancement of tool life. In addition, it is preventing the cutting edges and machine tools from heat dissipation. Due to continuous usage of the lubricant, that tends to lose its properties and hence it needs a change and maintenance to sustain its properties for longer life. The nanoparticles added to standard lubricant act as a solid lubricant, because of their viscosity and thermal conductivity [12].
In the view of work objectives, the experimental investigation and analysis were carried out for deriving effective interactive combination output from different parametric inputs. Moreover, the referred literature provides information on Ti6Al4V alloys most suitable for emerging applications like medical and space in- dustries due to their mechanical and chemical properties.
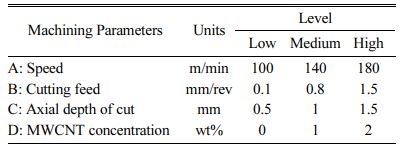
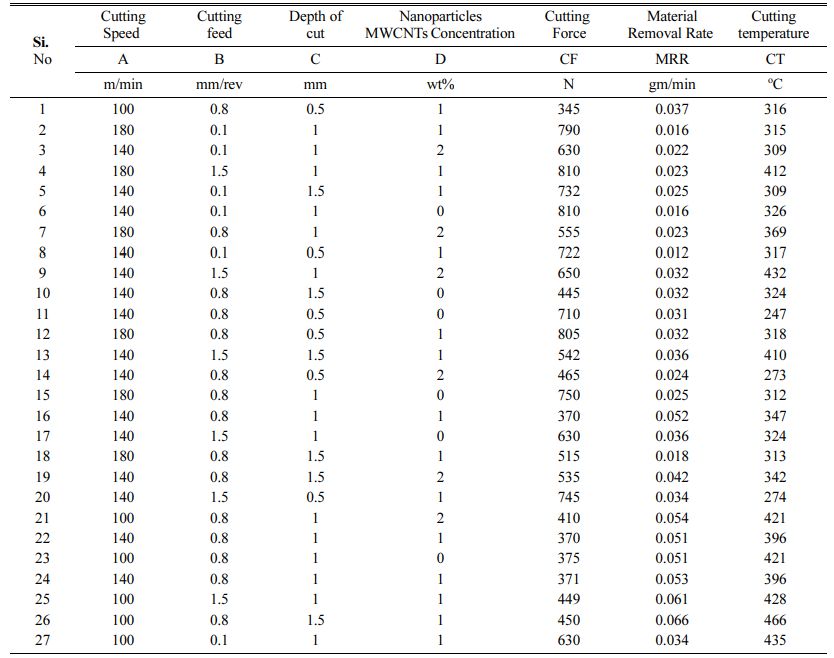
Present work carried out for cutting speed, cutting feed, axial depth of cut and Nanoparticles MWCNTs concentration was taken into the consideration because the control parameter and cutting temperature, cutting force and material removal rate as the output responses. To reduce the variety of experimentation, experiments were deliberate primarily based on the design of ex- periments (DOE). Box-Behiken design with 27 experi- ments was tabulated. Table 1 shows the process parameter variable values taken from DOE software state-ease version 12. The independent quadratic design factors Box-Behnken design matrix was considered to develop an experimental table. The CNC Turning centre was used to conduct experimentations.
Nanofluid characterization
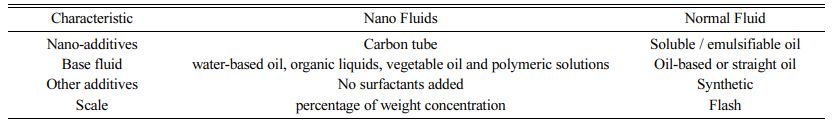
Nanofluid, which resulted from the suspension of nano-concentration into the base fluid, may be expressed through the usage of four basic design parameters, which are Nano-particles, base fluid, nano additives and scale size etc., the nanoparticles categories are metal particles, non-metal particles and carbon tubes or graphene [11]. The Base fluid categories are water-based oil, natural liquids, vegetable oil, and polymeric solutions. Other nanoparticle additives are surfactants, anti-wear or corrosion particles and fungicides. The scale size is the percent of weight or extent concentration. During the nano-fluid production process, those outlined design parameters are decided on the desired thermal, tribo-chemical, physical and rheological properties, which want to be met with inside the resultant nano-fluid for the reason that practical necessities for every nanofluid type are different [12]. Dispersion of nanoparticles into the base fluid is taken into consideration as a difficult process because of the sturdy Van Der Waals interactions, which bring about nanoparticles agglomeration, clogging, and sedimentation. Consequently, the usage of physical or chemical treatments, including surfactants is advised with the purpose to obtain effective forces at the clustered nano-particles that make certain enough dispersion and reap a few upgrades in thermal conductivity and a viscosity [11, 12]. Two ideas had been studied with the purpose to set up an excessive suspension first for nano-particles into the base oil, namely; diffusion and zeta capability. The former guarantees the Nano-particles are nicely scattered and dispersed into the liquid medium. The latter is specifically centred on accomplishing a better zeta capability value, which produces a repulsive pressure on a number of the Nano-particles.
Nanoparticle dispersion into the base fluid is a significant concentration that influences the thermal conductivity in addition to the viscosity of the resultant nano-sized fluid. Dispersion of nanoparticles into the base fluid may be done with the usage of an ultrasonic device observed with the aid of using a stirring process that measures the usage of a magnetic stirrer to make the complete desperation of nano-particles. Furthermore, the processing time of every step relies upon the weight fraction (wt.%) of the nano-particles. The Nano-additive weight concentration in the base fluid may be decided by the usage of equation (1). Alternate methods to the dispersion of Nano-particles powder into the base fluid had been obtained through chemical precipitation or natural reduction [13].
Preparation of nanofluid
Nanofluid samples were prepared by adding base oil, deionized water and percentage concentration of multi-wall nano carbon tube (MWCNTs) additive. In this work, Indian oil ‘S’ Servo cut oil was selected as a base oil for dispersing with MWCNT. It was utilized with a size of less than hundred-nanometer nanotubes as powder and the base fluid is prepared with a mixture of base oil plus deionized water known as Metal Working Fluid standards (MWF) [13, 14]. The sample of 100 ml MWCNT diffused cutting fluid consists of 95ml of deionized water and 5ml of ‘S’ Servo cut oil shown in Table 3. In this study, three different samples of cutting fluid (refer to Table 3) were used with normal cutting fluid, 1 wt% of MWCNT diffused with cutting fluid and 2 wt% of MWCNT diffused concentration.
The effective cooling performance by nanoparticles and cutting fluids was not done properly without their cohesiveness hence, therefore to get a uniform colloidal suspension of nanofluid was stirred up by utilizing a stirrer kit for thirty minutes and subsequently ultrasonicated by a vibrator which generate a pulse of 40 kHz and 80Watts for one hour to carry out the
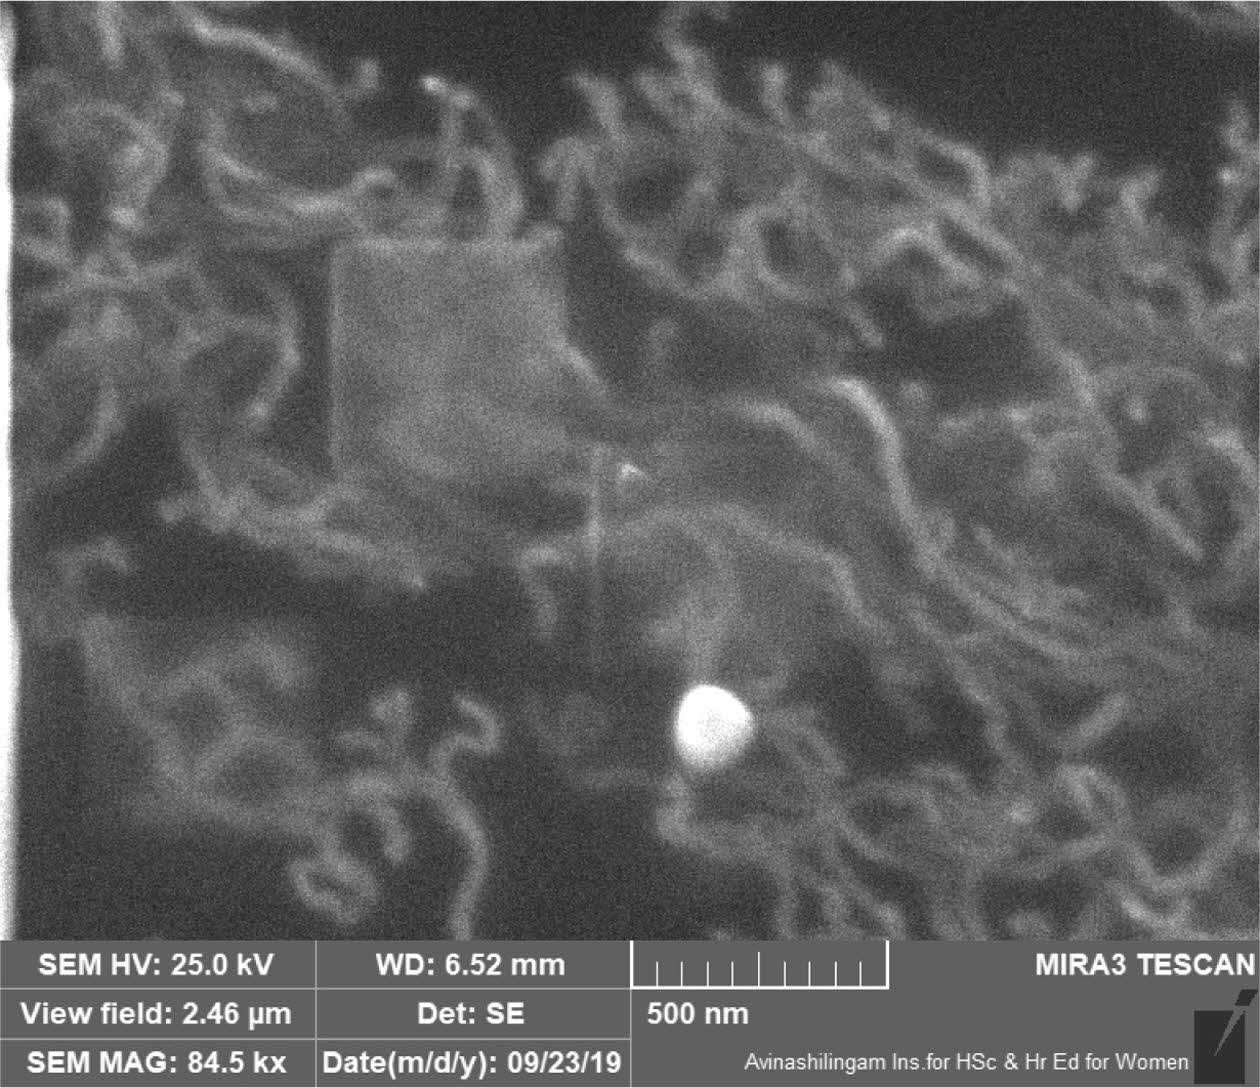
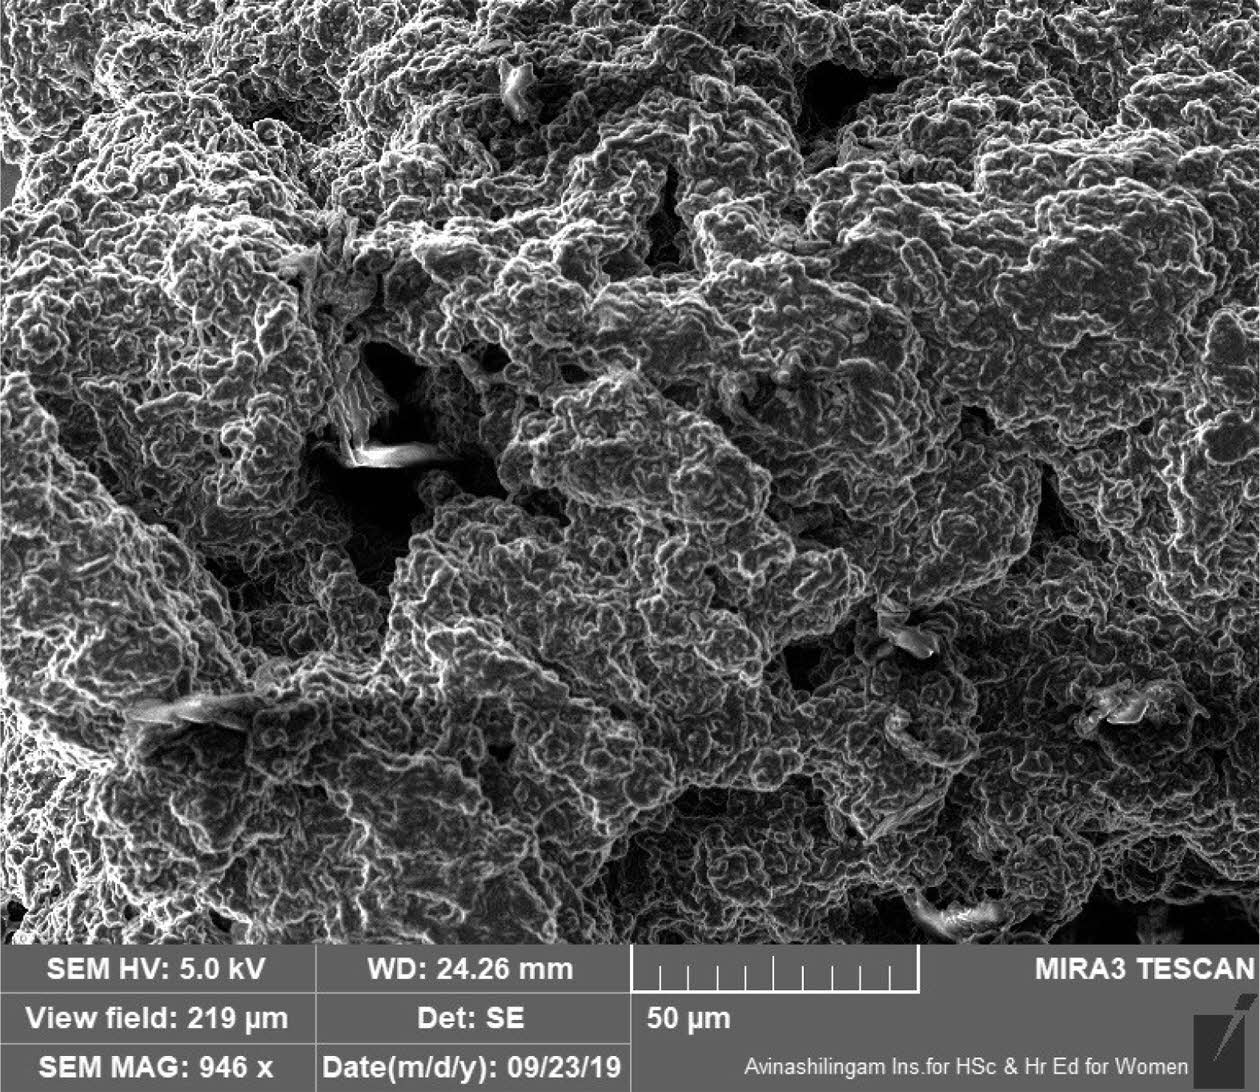
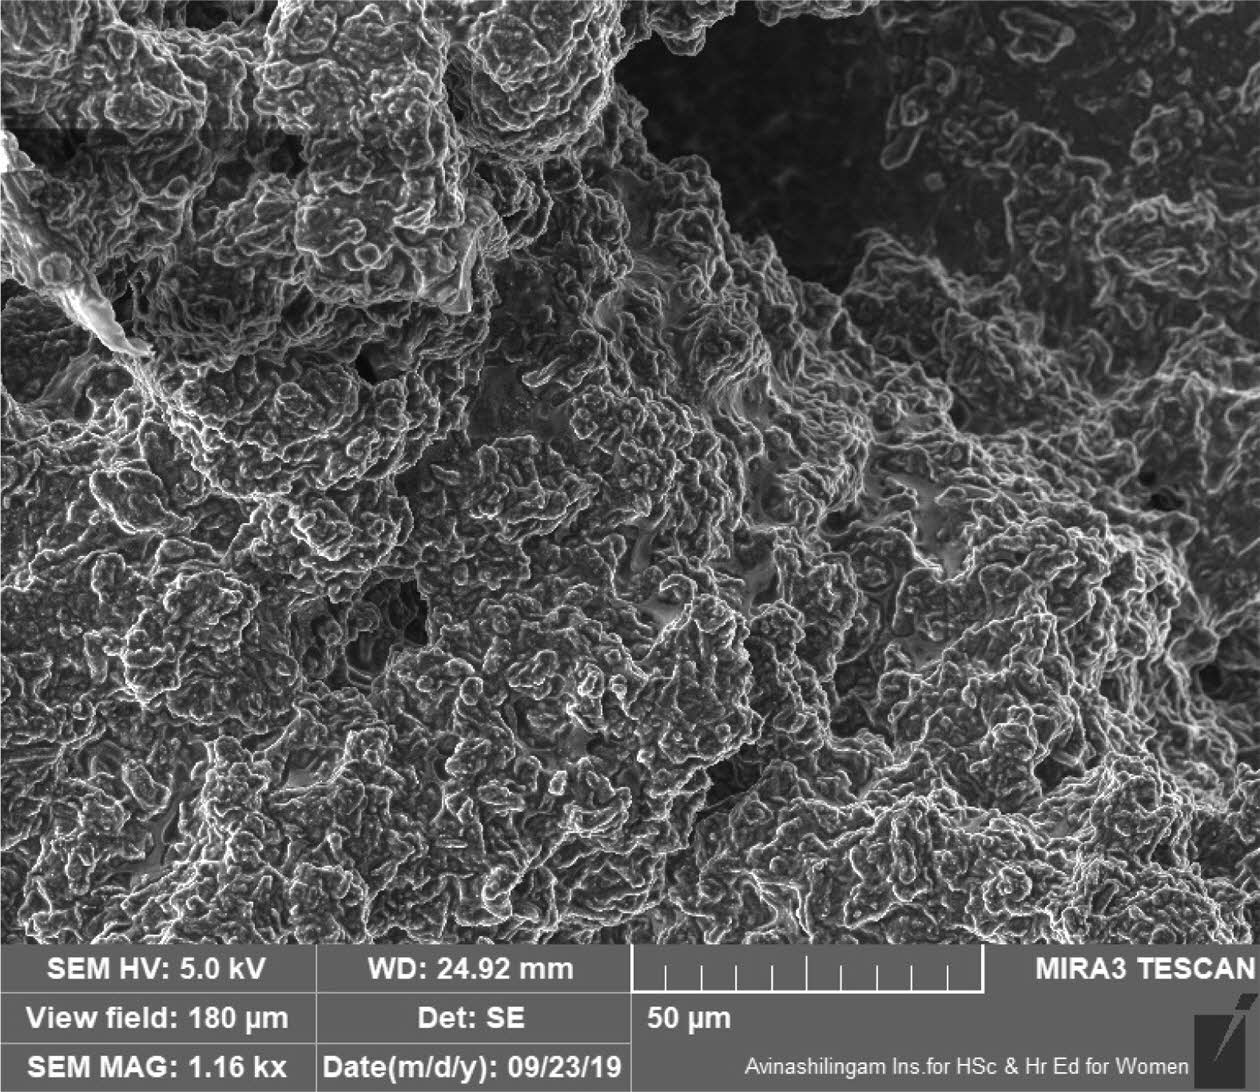
Diffusion process [11, 13]. This was continued until the ‘S’ servo cut oil was diffused with MWCNT nano- particles uniformly. The scanning electron microscopy (SEM) analysis of three samples (refer to Fig. 2-4) nano MWCNTs mixed with the based fluid of 0%, 1% and 2% correspondingly. Fig. 1 Fig. 3 Fig. 5 Table 2 Table 4 Table 5 Table 8
Machining Operation
The titanium Ti6AlV alloy round rod/work piece length of 100 mm, a diameter of 12 mm was selected to conduct the turning operation and the operation was performed using insert S205, which was a new Chemical Vapour Deposition (CVD) grade [14]. The turning insert is used to prominent productivity without compromising on tolerances and surface conformity. The Benefits of the turning Insert S205 grade are 30-50% higher cutting speeds than the other inserts without compromising on tool life, higher cutting speed translates to improved productivity and excellent resistance to flank and adhesive wear resulting in longer tool life [15].
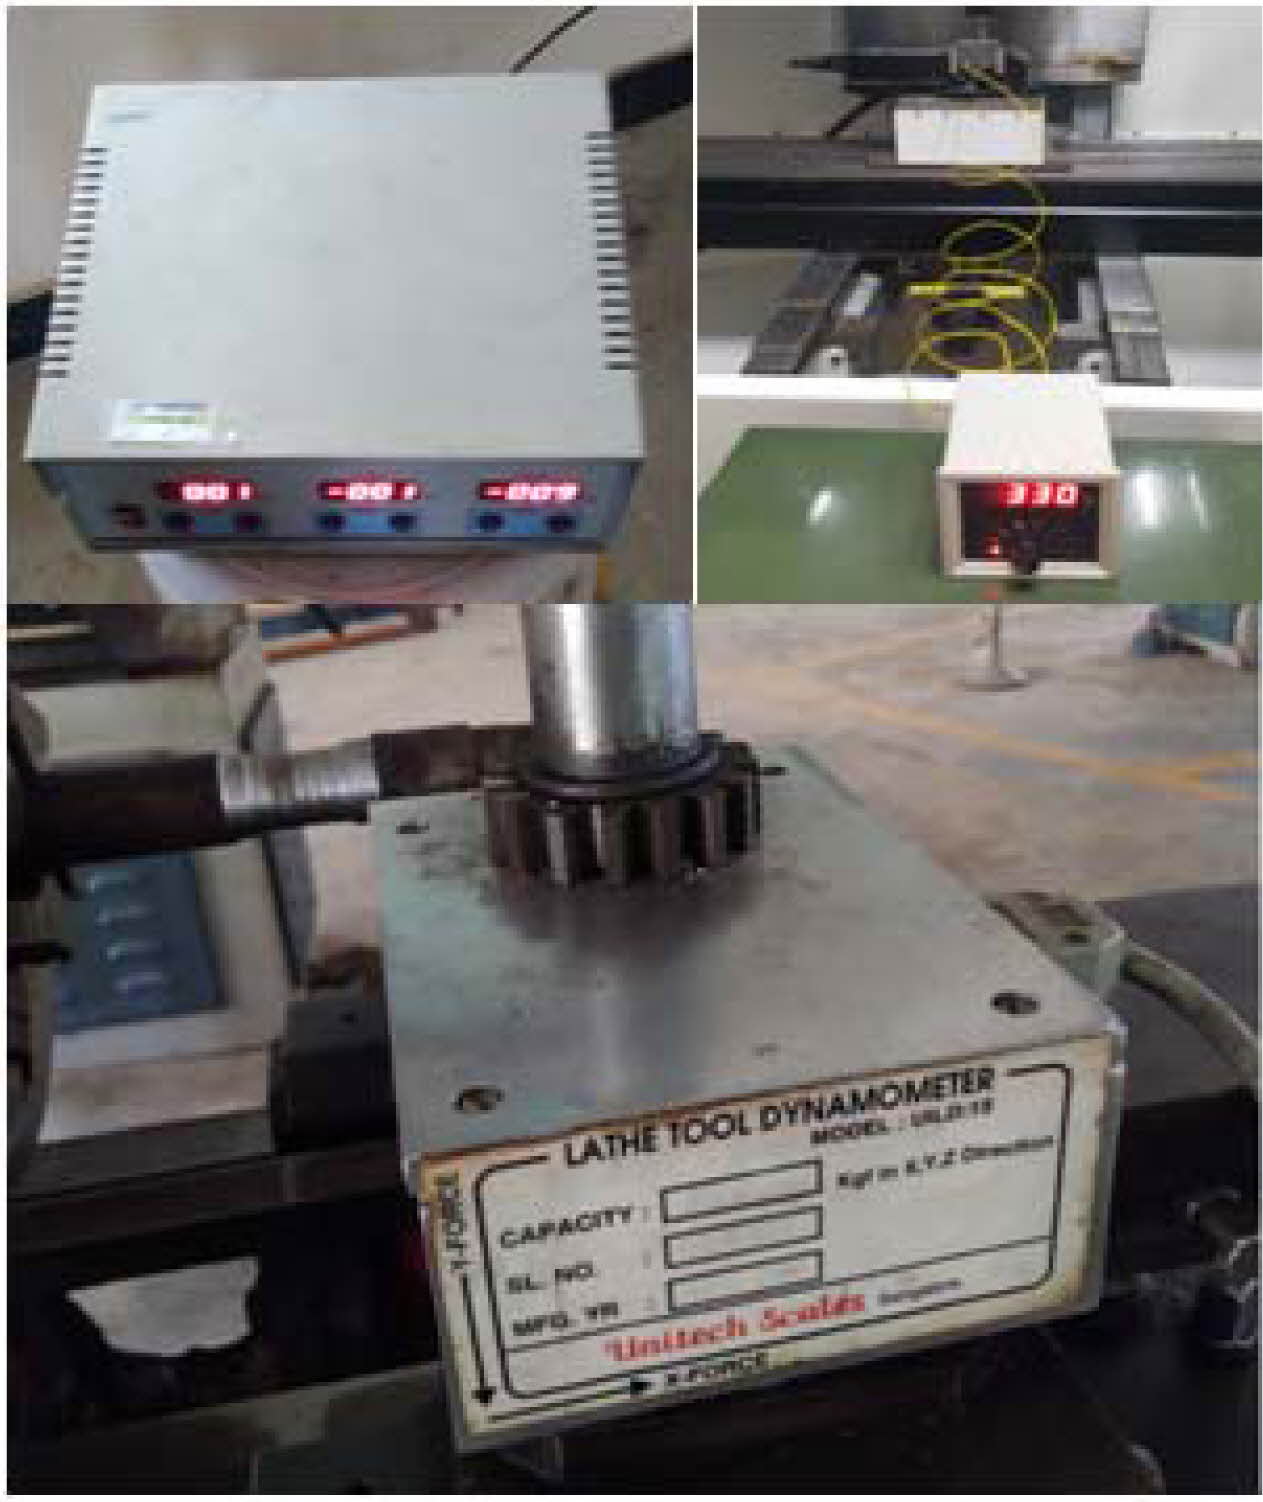
The turning process was carried out in 27 trials experimental on DX200 series CNC turning centre. The two-component lathe tool dynamometer, Unitech scales Bangalore was used to measure the cutting forces. The TEL96-9001-k-type thermocouple is used to measure the cutting temperature. The minimum amount of nanofluid was supplied conventionally with pressure in flood conditions. Though the atmosphere affair that cutting fluid usages are minimized [18].
The material removal rate values were measured for twenty-seven experimentations with the support of a digital weighing scale setup. The material rate is direct proportionality to productivity. The machined sample (Sm) and non-machined sample (Snm) weights were measured to calculate the estimated material removal rate readings. Archimedes' principle was used to calculate the density of the material and found density is 4.5 g/cm3 for Ti-6Al-4V alloy. The equation is used to measure the material removal rate in cc/min.[19]
Mathematical Model Development
A statistical method surface response methodology is a modelling and analyzing process that is recommended to examine effective responses [20]. It also examines the relationship between the input and output of effective variables, which are not feasible in a traditional experi- mental design. Further, few experimental studies or a region of the factor are the benefits of this method of design. Developing mathematical models are another benefit of this method of design [21]. In this study, a central composite design was used to build a second-order model to determine the optimal parameter for the machining speed, feed rate, and axial depth of cut with nano-particles MWCNTs concentration [13]. The re- gression equation was developed from the experimental results given in the equations. The regression equations 3, 4 and 5 were helped to understand the relationship between the control and response factor is as well used to predict the optimal parameters.
Cutting force (CF):
+370.33 +130.50 * Speed -40.67 * Feed -47.75
* depth of cut -39.58 * MWCNTs +50.25 * speed
* feed -98.75 * speed * depth of cut -57.50 * speed
* MWCNTs -53.25 * feed * depth of cut +50.00
* feed * MWCNTs +83.75 *depth of cut * MWCNTs
+ 71.17 * speed2 +228.17 * feed2 +87.04 *
depth of cut2 +81.29 * MWCNTs2
(3)
MRR:
+0.0523 -0.0138 * speed +0.008 * Feed +0.0041
* depth of cut +0.0006 * MWCNTs -0.0053 * speed
* Feed -0.0106 * speed * depth of cut-0.0009
* speed * MWCNTs -0.0028 * feed * depth of cut
-0.0024 *feed * MWCNTs +0.0043 * depth of cut
* MWCNTs -0.0034 * speed2 -0.0151 * feed2 (4)
Cutting Temperature (CT):
+379.67 -37.33 * speed +22.42 * feed +34.94
* depth of cut +16 * MWCNTs +26 * speed * feed
-38.75 * speed * depth of cut +14.25 * speed
* MWCNTs +36 * feed * depth of cut +31.25 * feed
* MWCNTs -2 * depth of cut * MWCNTs +25.37
* speed2 -4 * feed2 -51.75 * depth of cut2 -27.87
* MWCNTs2 (5)
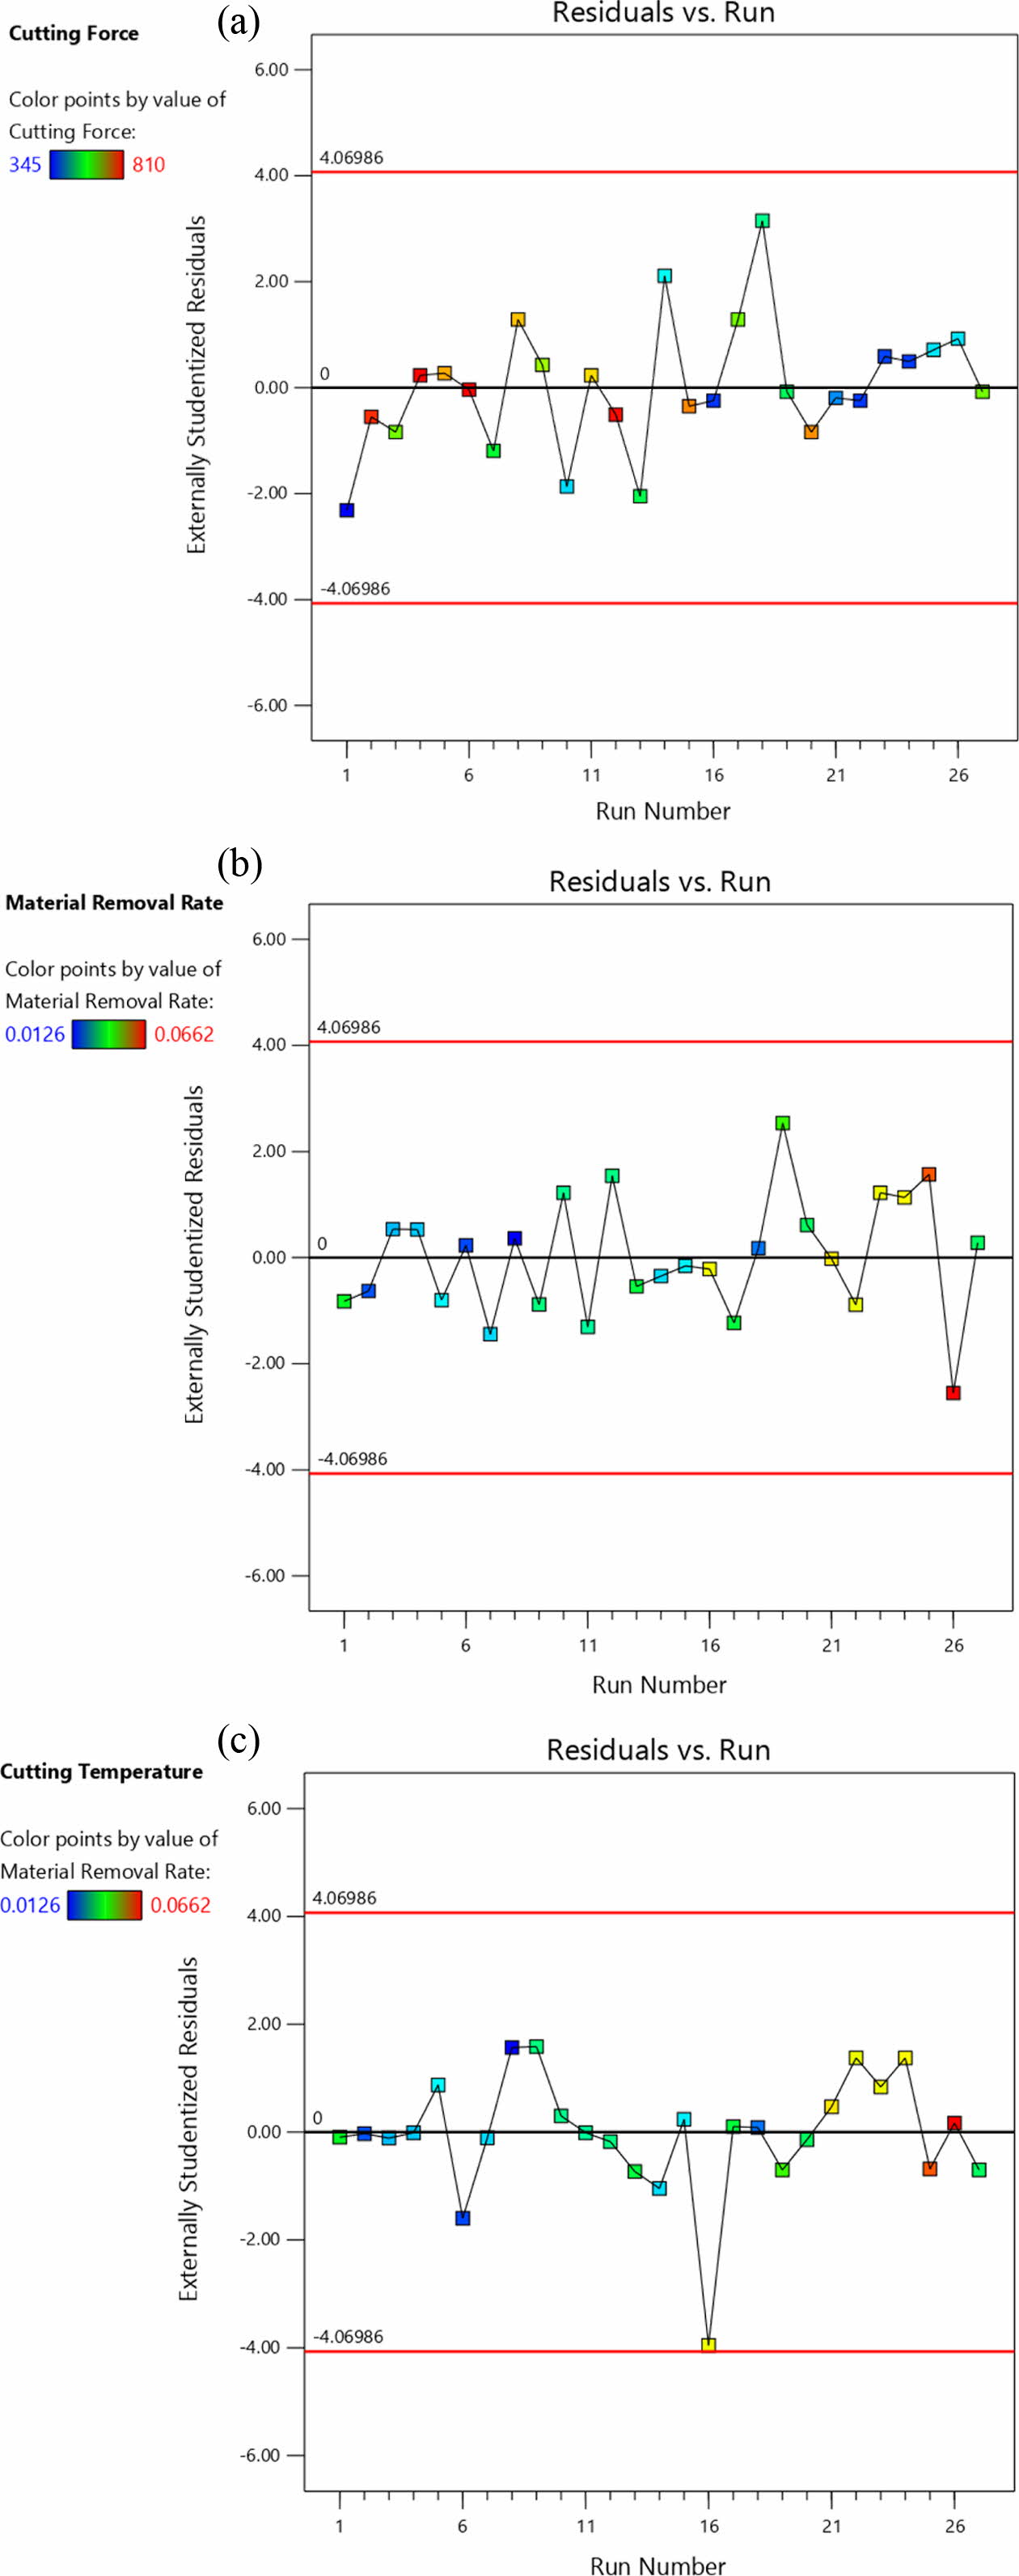
The independency of data was checked from residual plots. Fig. 6(a-c) depicts that there was no predictable pattern present because all the residuals lie between acceptable levels.
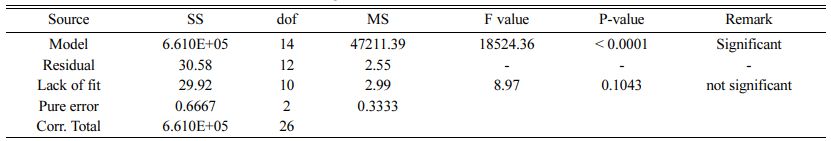
ANOVA for Cutting force
The statistical tool ANOVA was used to predict the data systematic influence factor with the random set. This splits as two parts of collected data with estimated procedure an aggregately [22]. The P-value shown in table 6 was “0.0001” which means that the effect of the model second-order derivative control factor response was significant. The P values of control parameters [22, 23]. This shows that the presence of a regression model of all control parameters was significant since all input parameters' P values were less than 0.05. If the P values were greater than 0.05 meant that the quadratic model was suitable. The lack of fit value was 0.1043 so that test was insignificant.
The cutting speed is the most significant factor compared to the other process parameter. The difference between the percentage level for Predicted R2 and adjusted R2 is 0.2%. So that the model has a greater agreement with curve fitting. The model has an adequate signal since the signal to noise ratio was 389.104.
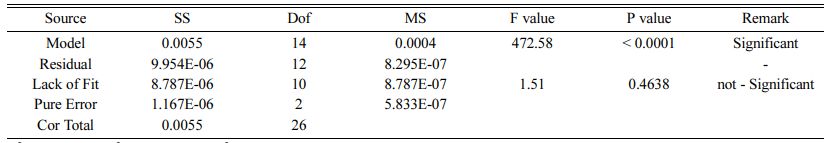
ANOVA for Material Removal Rate
The P-value shown in Table 7 was “0.0001” which means that the effect of the model second-order derivative control factor response was significant. The P values of control parameters [22, 23]. This shows that the presence of a regression model of all control parameters was significant since all input parameters' P values were less than 0.05. If the P values were greater than 0.05 meant that the quadratic model was suitable. The lack of fit value was 0.4638 so that test was insignificant.
The cutting speed is the most significant factor compared to the other process parameter. The difference between the percentage level for Predicted R2 and adjusted R2 is 0.2%. So that the model has a greater agreement with curve fitting. The model has an adequate signal since the signal to noise ratio was 81.11
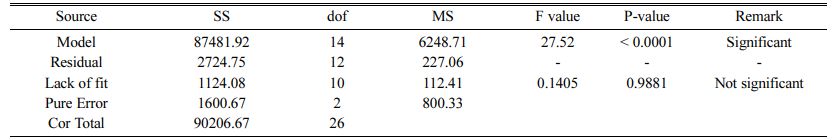
ANOVA for Cutting Temperature
The P-value shown in the table was “0.0001” which means that the effect of the model second-order derivative control factor response was significant. The P values of control parameters [22, 23]. This shows that the presence of a regression model of all control parameters was significant since all input parameters' P values were less than 0.05. If the P values were greater than 0.05 meant that the quadratic model was suitable. The lack of fit value was 0.9881 so that test was insignificant.
The cutting speed is the most significant factor compared to the other process parameter. The difference between the percentage level for Predicted R2 and adjusted R2 is 0.2%. So that the model has a greater agreement with curve fitting. The model has an adequate signal since the signal to noise ratio was 19.336.
|
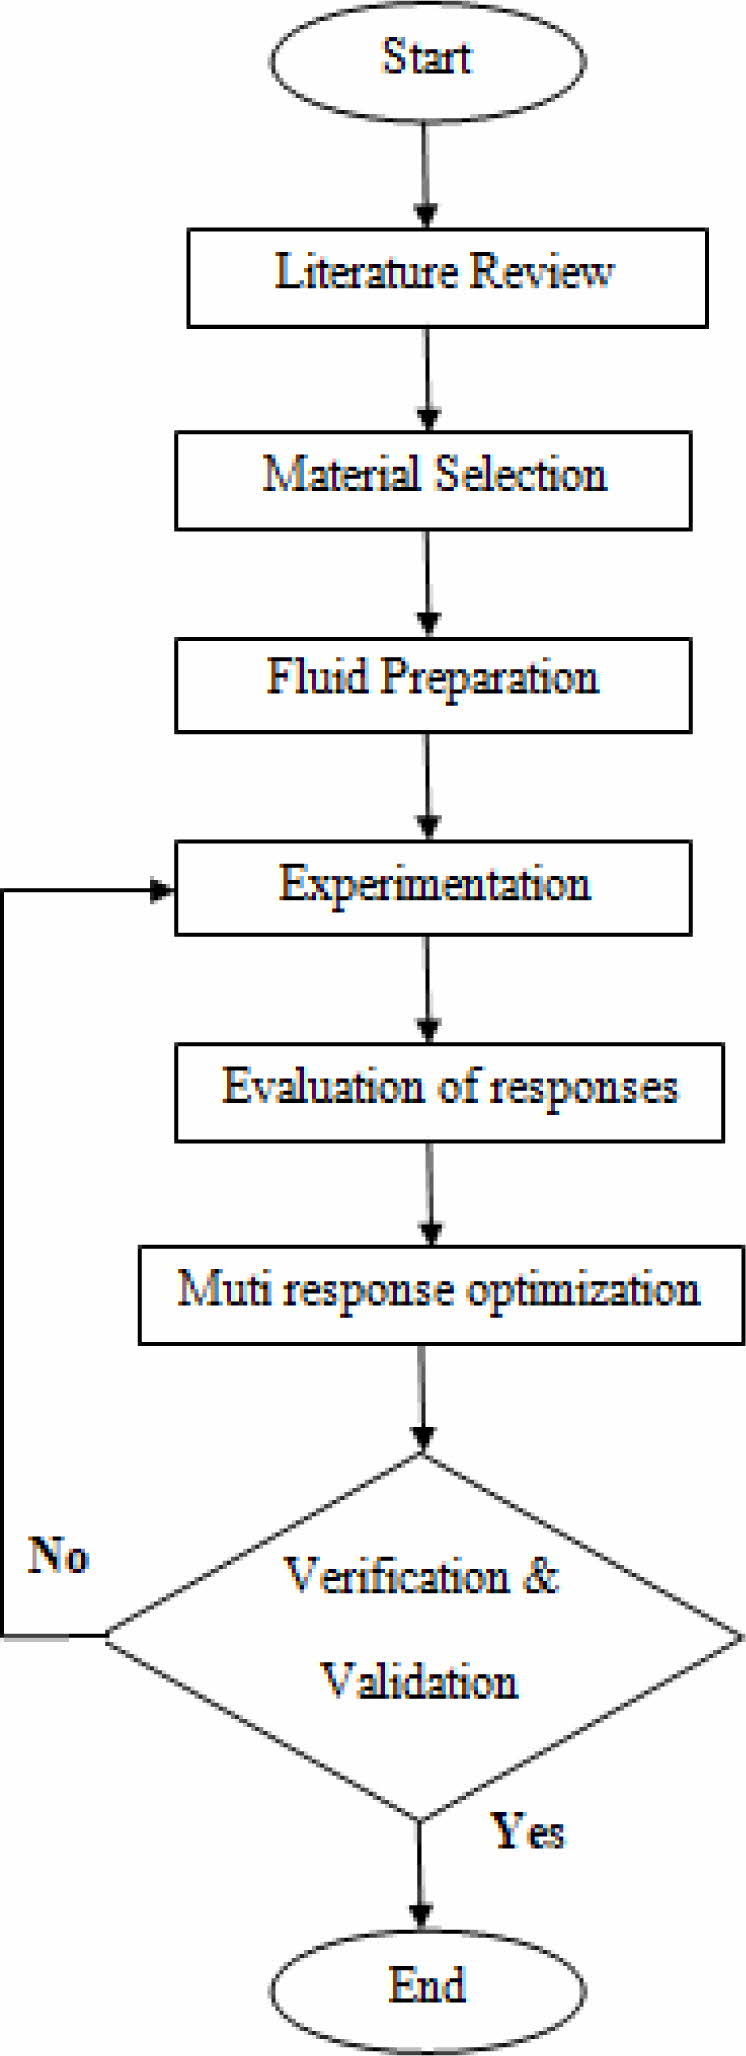
Fig. 1 Work flow chart |
|
Fig. 2 SEM for Normal Cutting fluid. |
|
Fig. 3 SEM for 1 wt% of MWNCT diffused with cutting fluid |
|
Fig. 4 SEM for 2 wt% of MWNCT diffused with cutting fluid. |
|
Fig. 5 Experimental setup – Lathe Tool Dynamometer, Thermocouple arrangement. |
|
Fig. 6 (a-c) Residual plots of cutting force, material removal rate |

Response Surface Methodology
Response Surface Methodology (RSM) tool is used to examine the effective parameters in a response. The RSM method is an efficient method for determining the RMS factor. This method is a statistics-based approach; It also examines the correlations between actual variables that are not feasible in a traditional experimental design. Also, some experimental studies are the advantages of this design method [24]. Data analysis is carried out using visual methods, examining all layer combinations than the conventional experimental design with one variable at a time (OVAT) [25]. Improving mathematical models is another benefit of this design method. In this investigation, an RSM-based Central Composite Face Design (CCD) was used to determine the optimal con- ditions for the rate of feed, cutting feed, cutting depth, and MWCNT concentration of nanoparticles. The regression equation was developed from the experimental measure- ments given in the equations. The regression equation is used to understand the relationship between the input and output data and was also used to predict the optimal parameters [26].
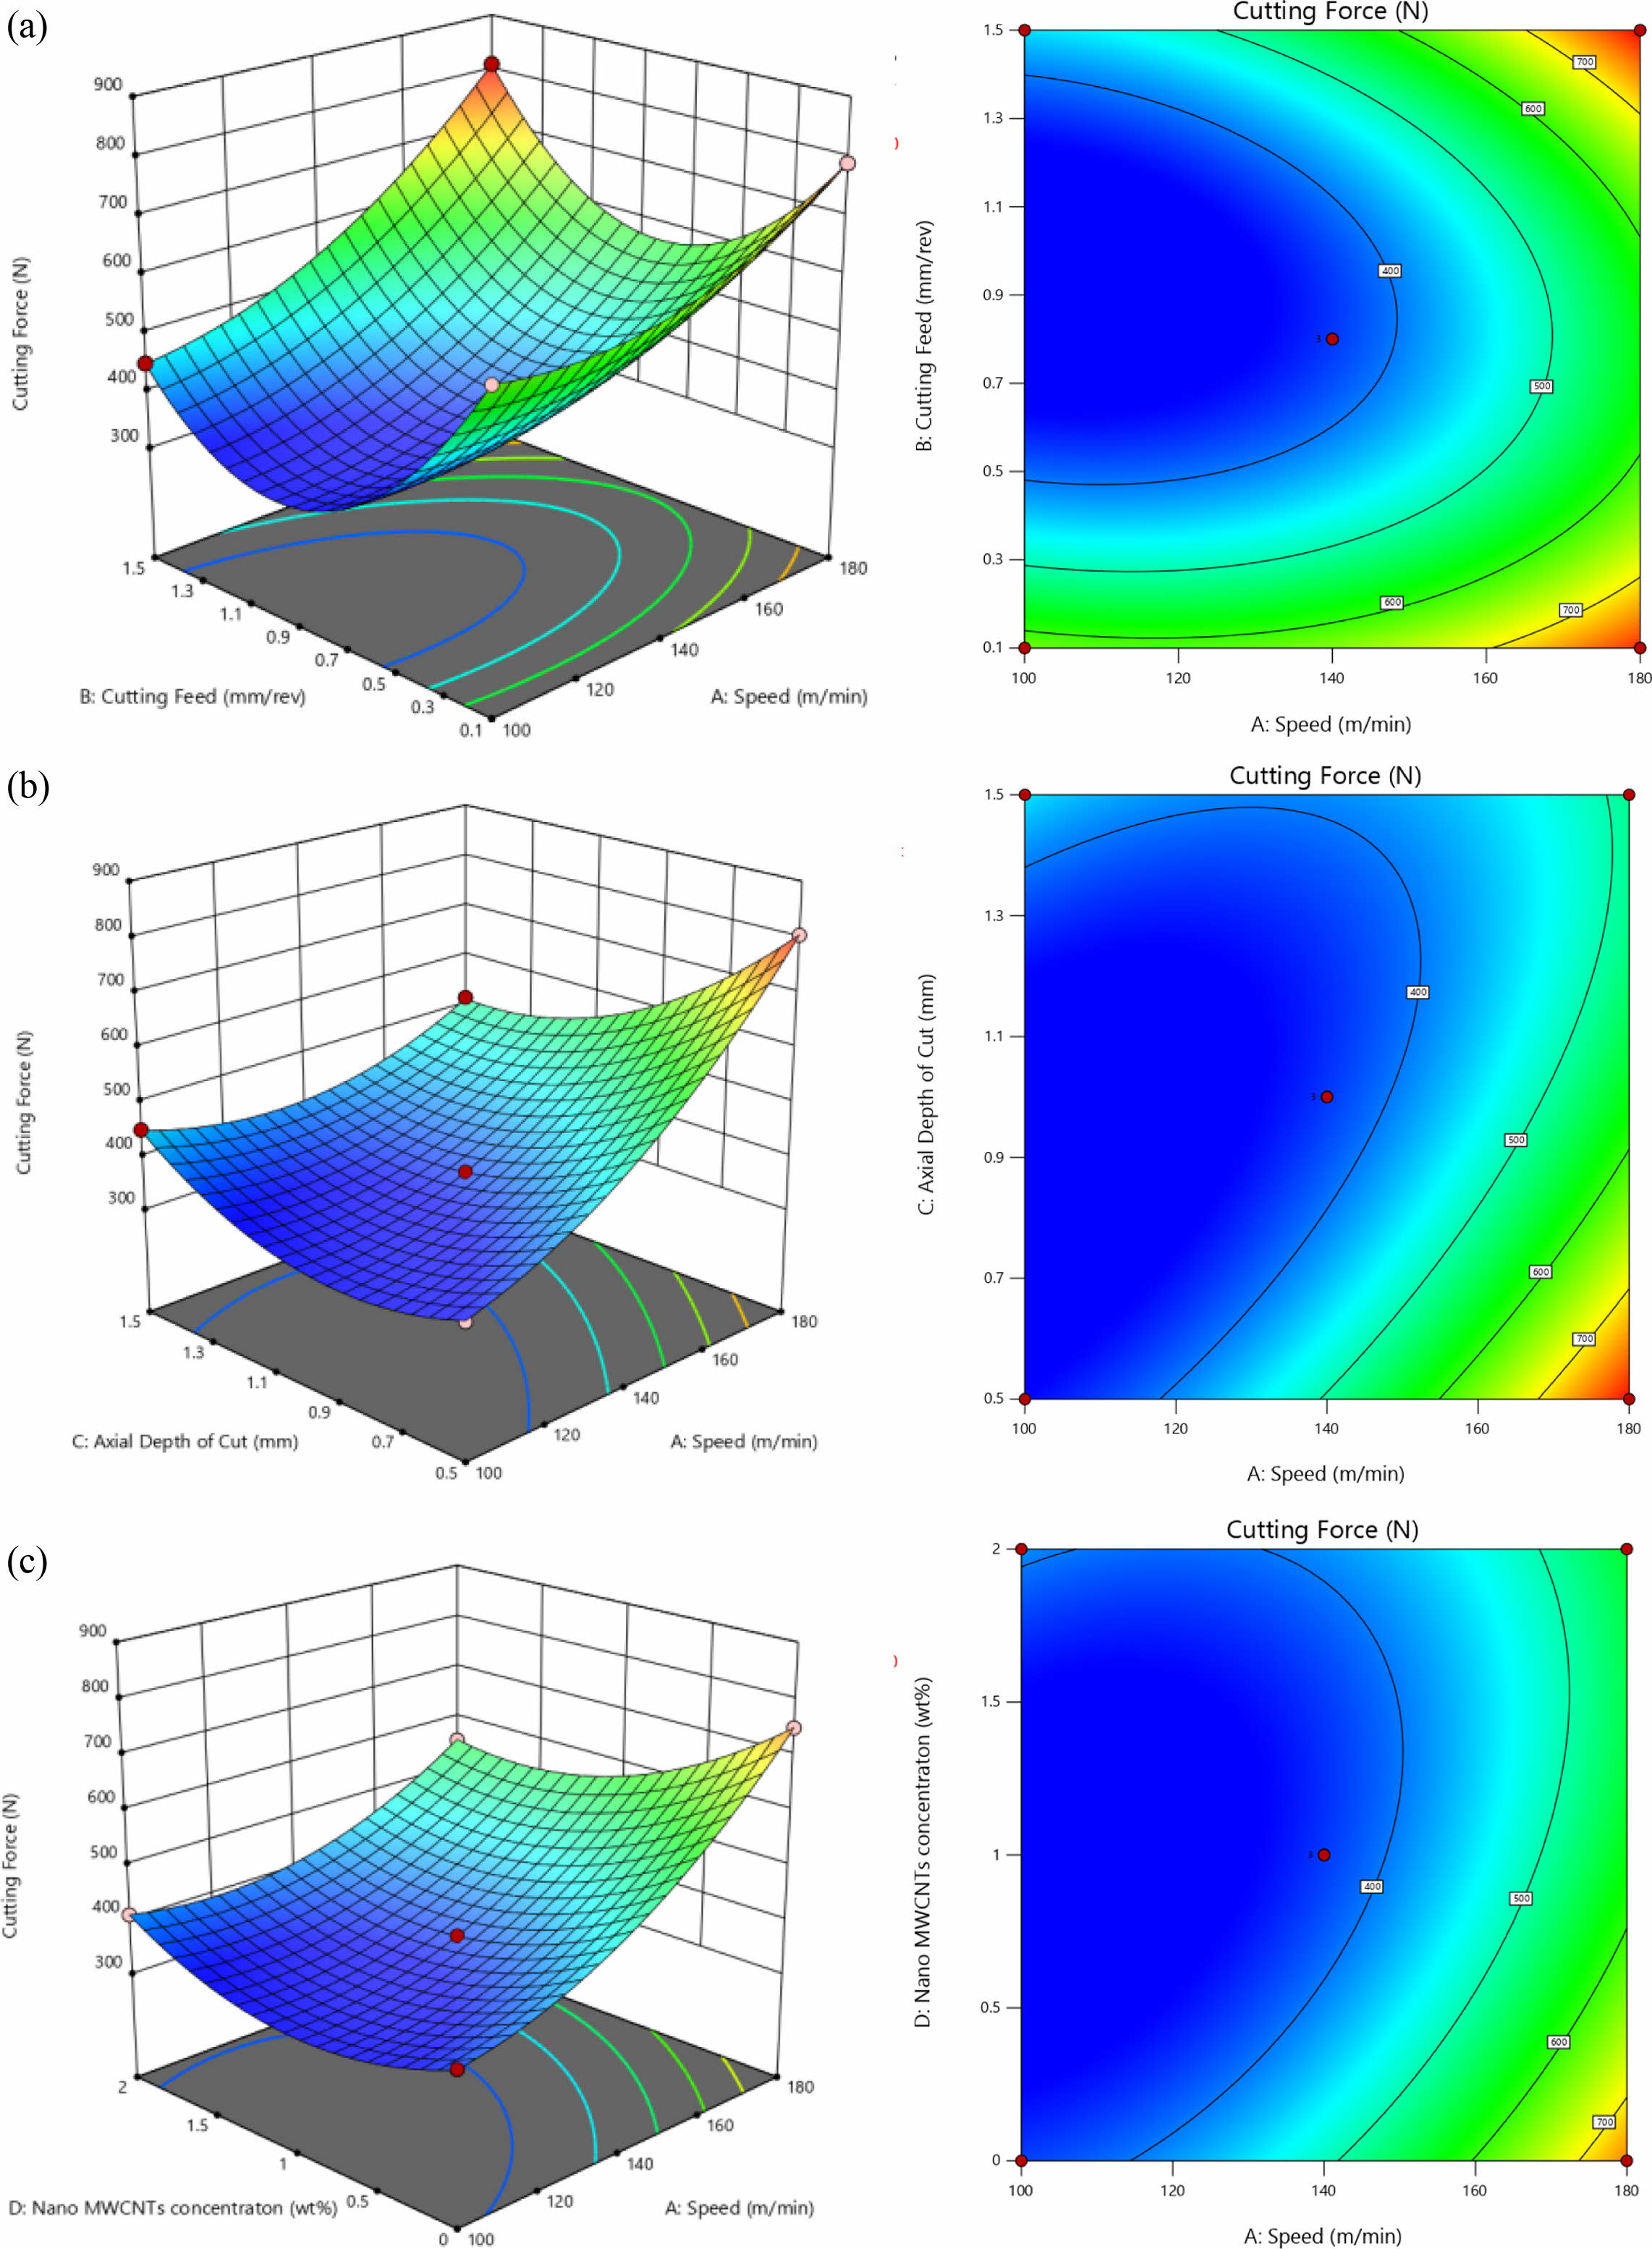
The output model three dimensional images shows the interactive and influences curve between output parameters and input parameters in Fig. 7(a-c). This depicts that the machining speed was mainly influenced by other factors for cutting force. An increase in the rate of machining speed and rate of feed directly increases the temperature of the cutting zone. The quality of the machining surface would reduce due to the poor thermal conductivity of the work piece. Hence controlling the cutting temperature becomes a necessity during the machining process. The higher cutting temperature directly affects the surface quality of the final product; this owing to the reason that the selection of the higher level of rate of machining speed and rate of feed directly increases the heat friction between the work material and tool material [13].
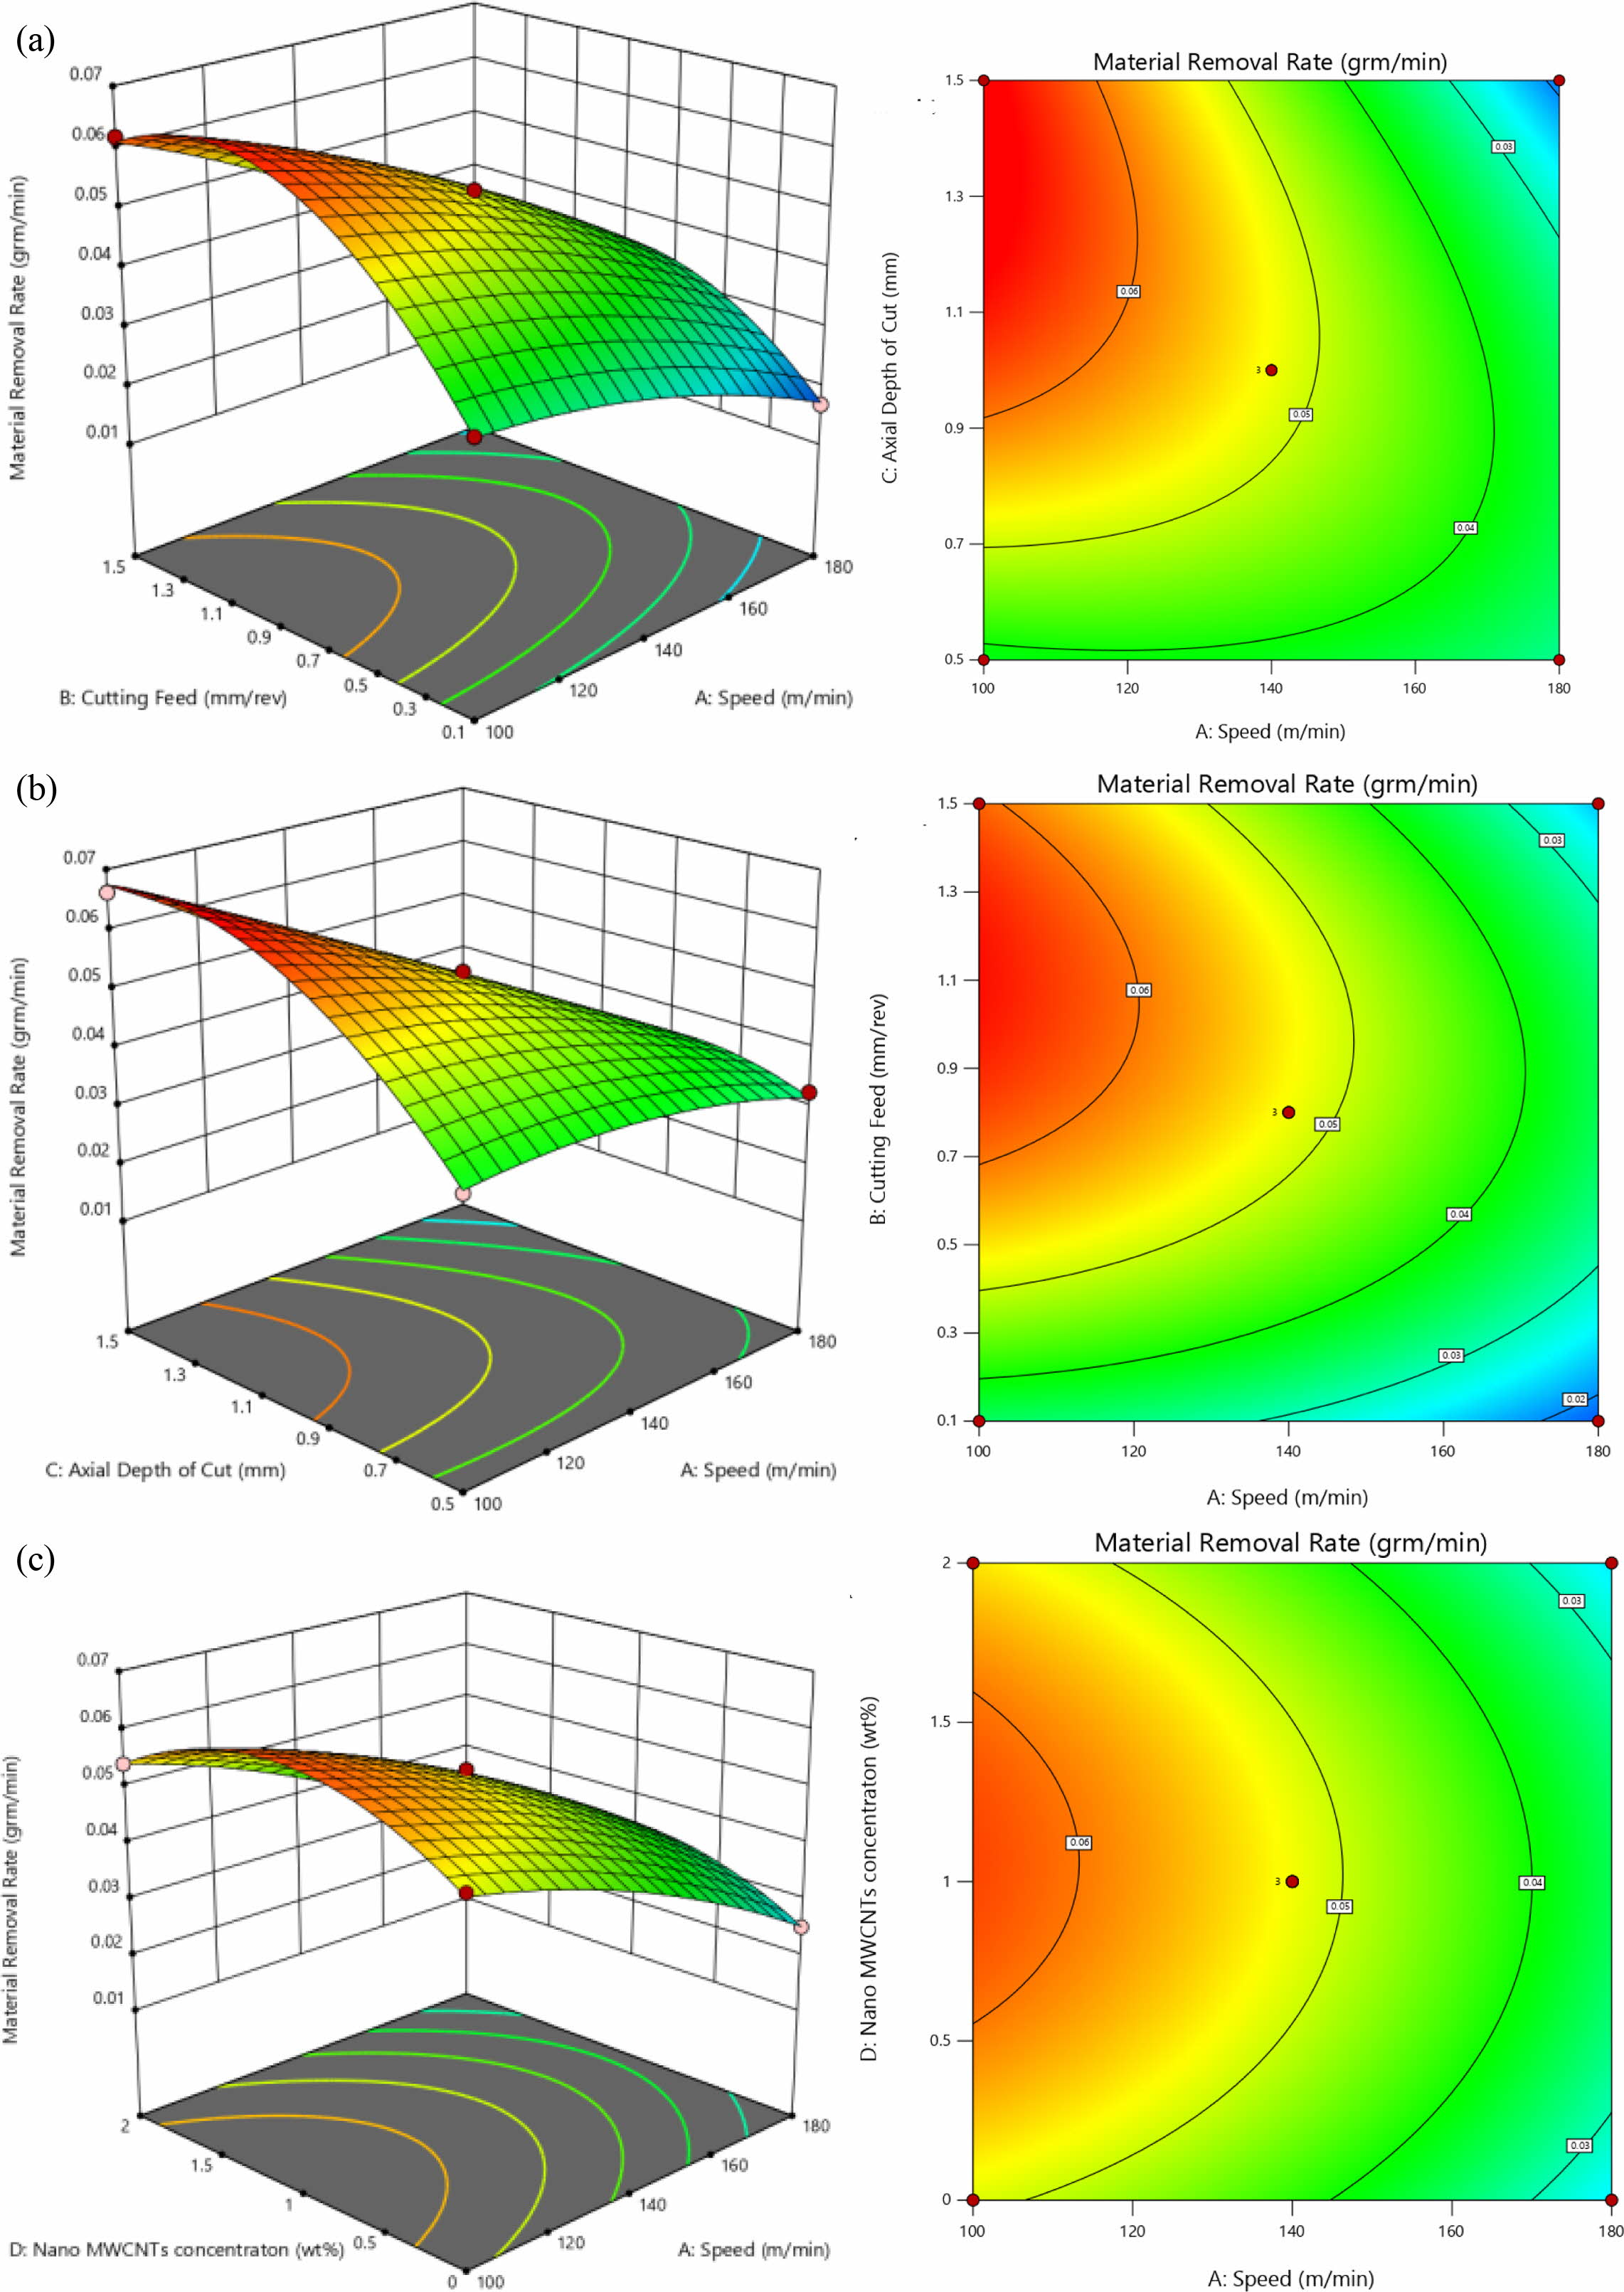
The response surface 3D plot shows the interactive effect between Input parameters and output responses in Fig. 8(a-c). The figure depicts that the machining speed was an important parameter with other factors for Material Removal Rate. It also reveals that a suitable selection of depth of cut 0.5 to 0.7 positively increases material removal rate and hence productivity was improved.
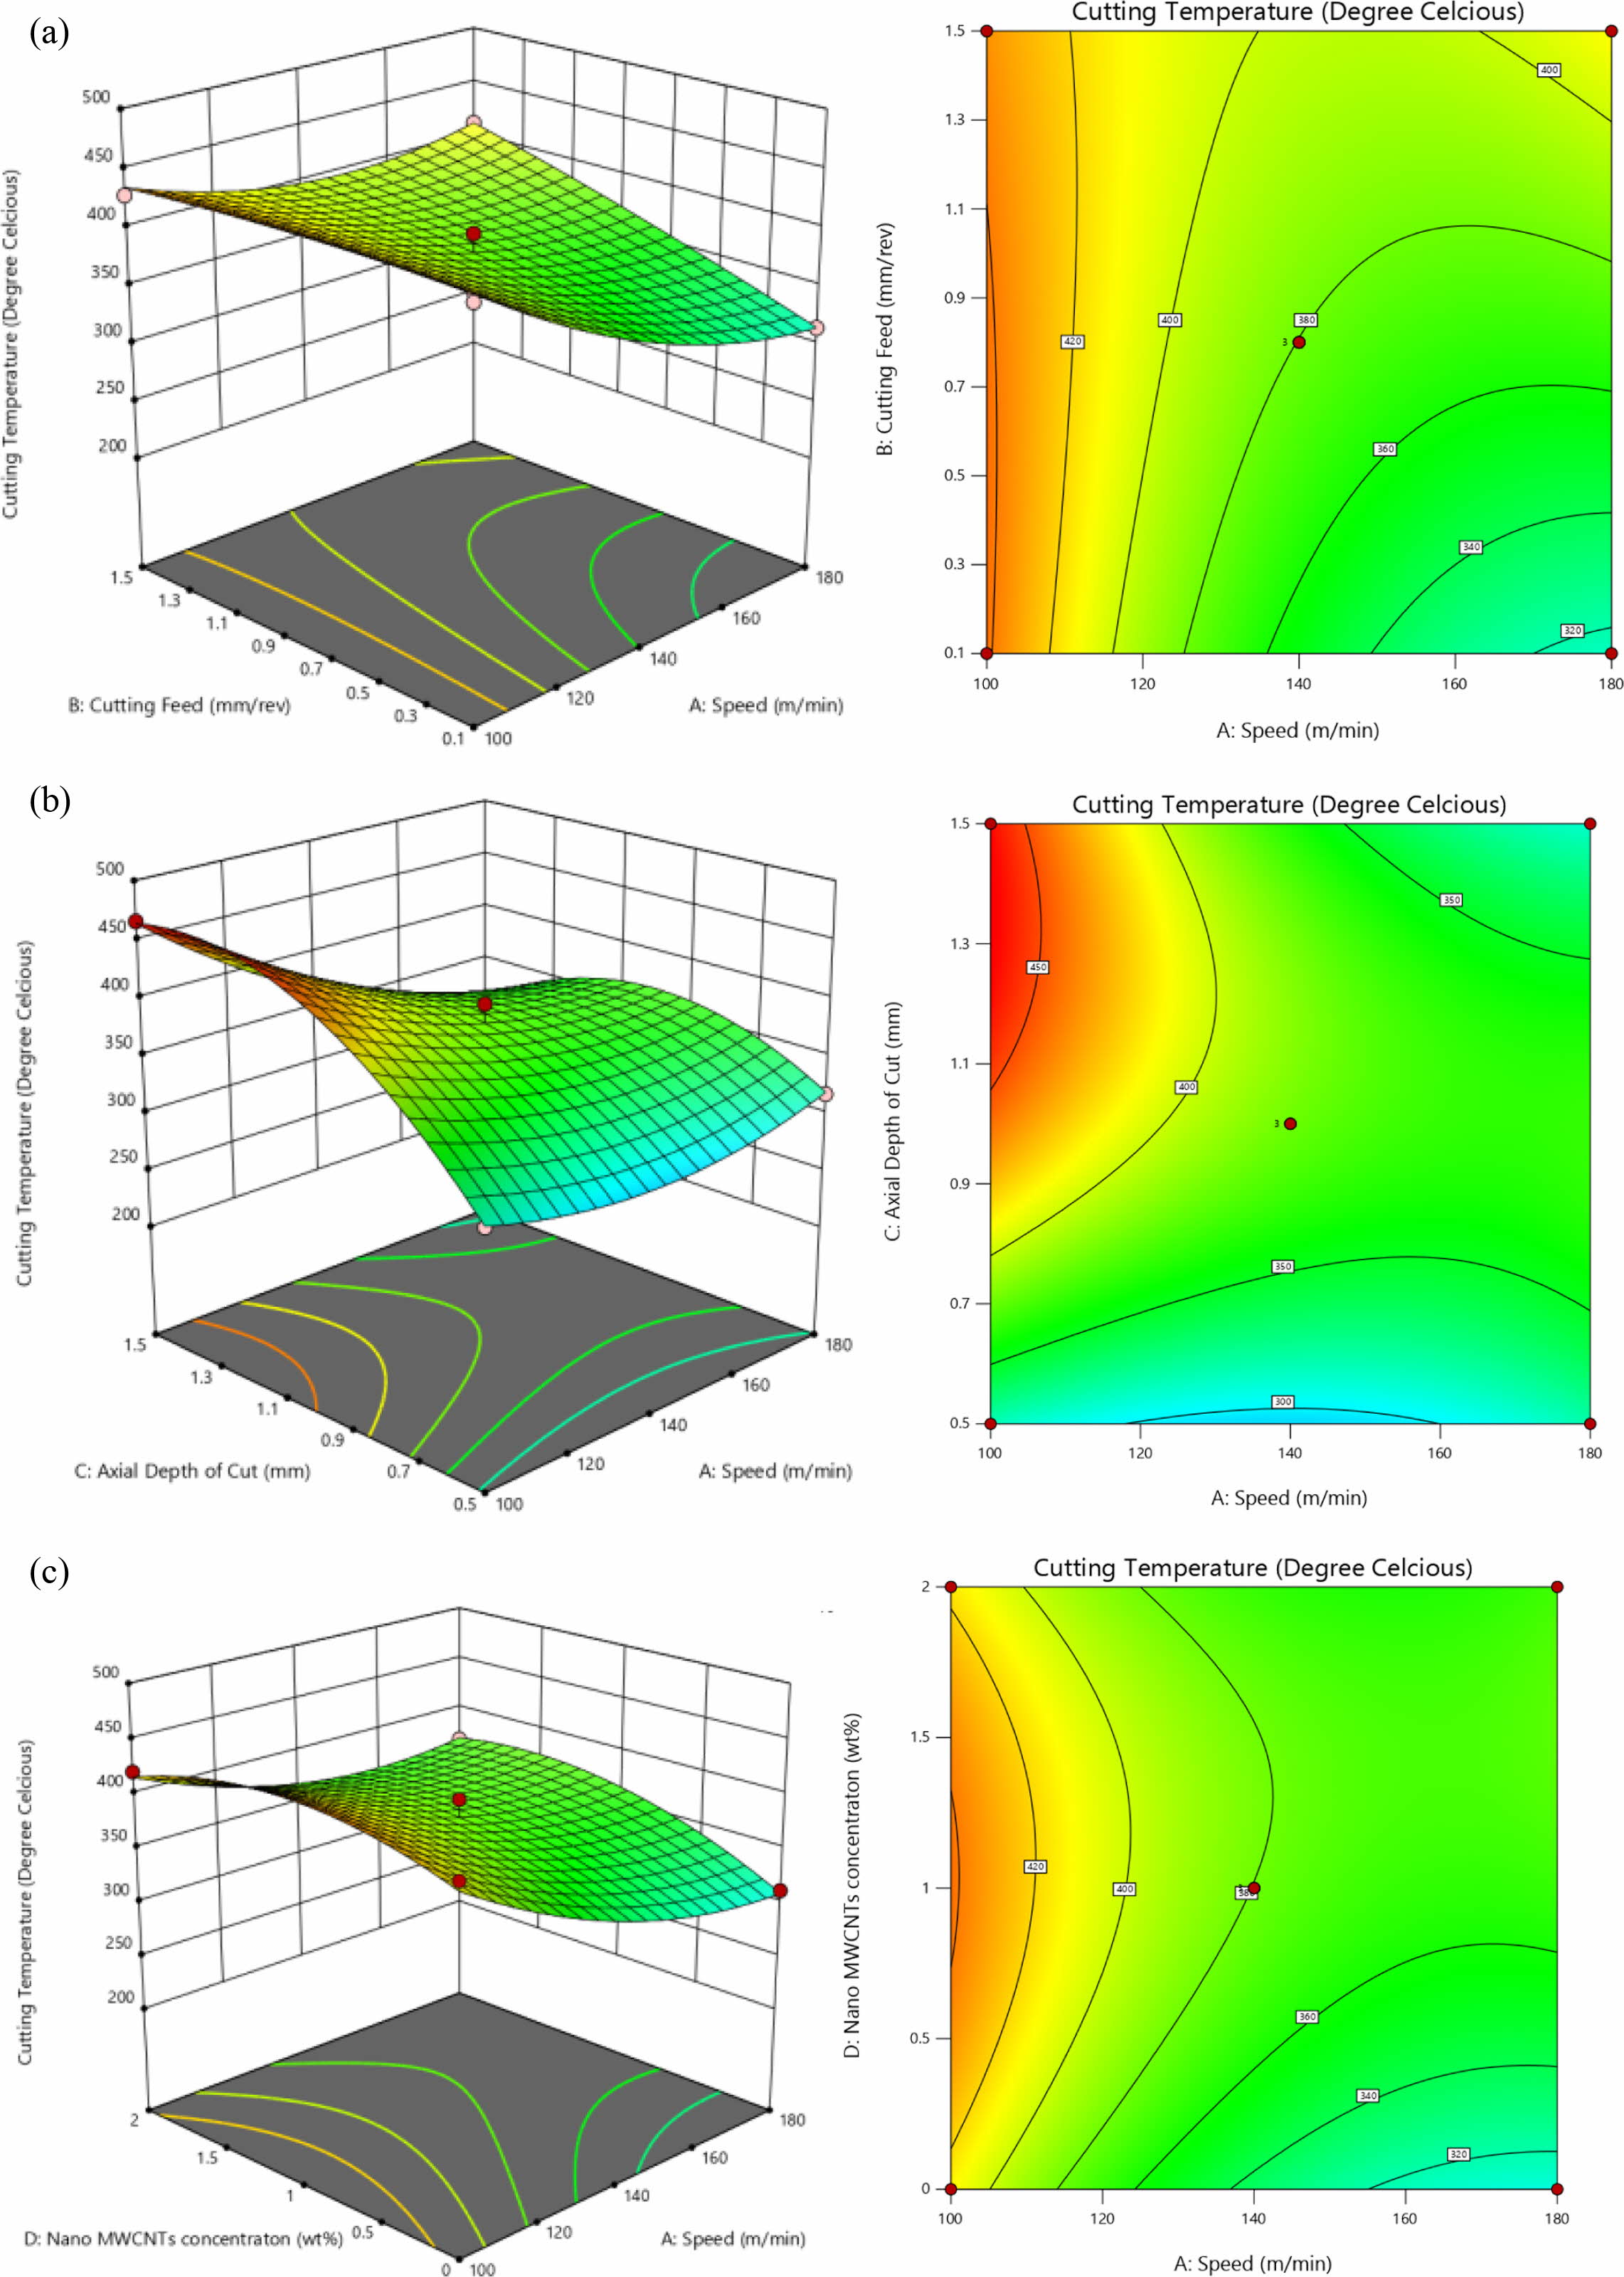
The response surface 3D plot depicts the correlation between the output parameter and input control parameter shown in Fig. 9(a-c). The figure depicts that the speed was one of the considerable parameters compared with other parameters for cutting temperature. Also reveal that introducing the hybrid nano cutting fluid i.e. Nano MWCNT diffused cutting fluid drastically reduces the cutting temperature compare to the conventional cutting fluid. Owing to the reason that Ti6Al4V alloy has poor conductivity of thermal. It was that appropriate selection of nano MWCNT diffused cutting fluid ranges between 1% and 1.5 % positively improves the cooling action and increases the efficiency of heat transfer in the machining zone, hence controlling the higher cutting temperature between the cutting tool and work piece [13].
Multi-objective optimization of DFA analysis
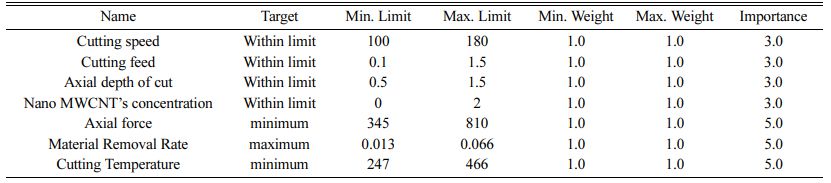
For Multi-objective optimization, DFA is one of the foremost widely used strategies in engineering appl- ications. In the DFA method, every expected response determined performance characteristics are regenerated into a fascinating dimensionless value. The performance values are between zero and one [27]. The Function value of di will increase because the resulting answer becomes a lot of desirable. During this study, a Smaller-the-better quality characteristic was chosen to rework the value of reducing the temperature and minimum cutting force. Hence, eq. (6) was used. Here the function value of the target is denoted as T of the ith response, yi, Weight is denoted as W, the higher limit of acceptable value is denoted as U, and the lower limit of acceptable value is denoted as L, for this response [28].
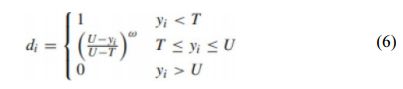
Accordingly, to maximize the material removal rate eq. (6) was modified with the range to attain desired value.
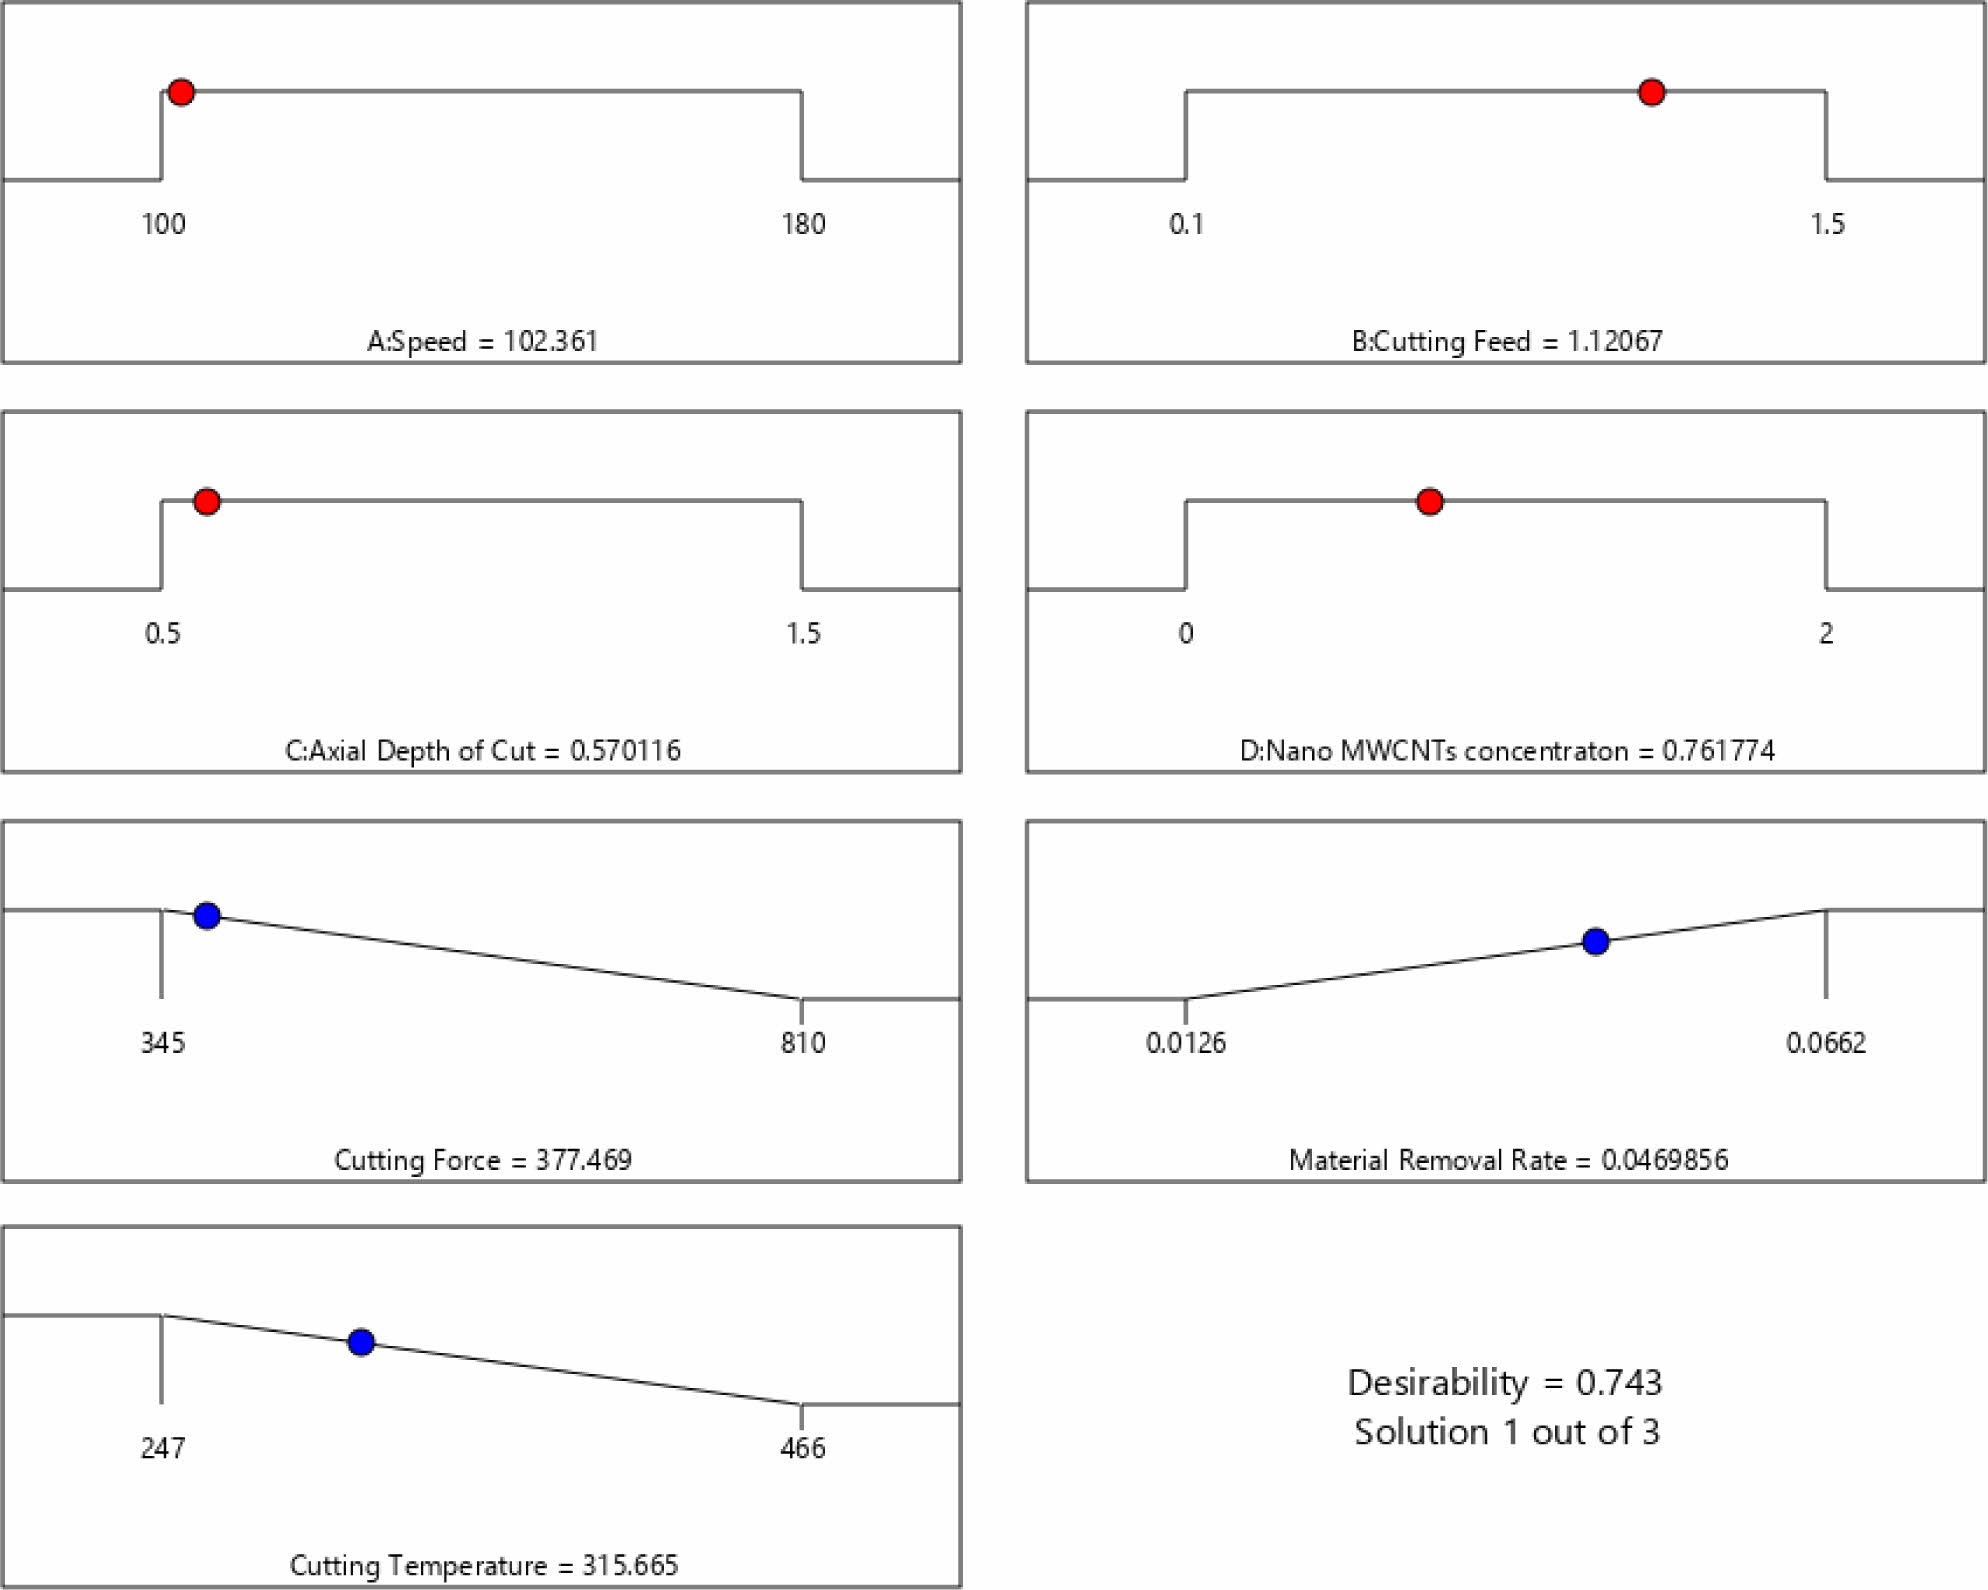
The desirability analysis was done using design expert 12.0 software. Multi-objective optimization of the DFA Analysis approach is one of the simple methods and this method is widely used in most of the industry for the analysis of multi-response optimization techniques [29]. The variability of response is considered stable in this method usually. This newly proposed desirability approach is involved in investigating the posterior pre- ference articulation approach. The desirability approach followed as a fit response model of all responses by conducting the experiments [30, 31]. The individual desirability is determined and then find the overall desirability with respect to the control factors refer to Fig. 10.
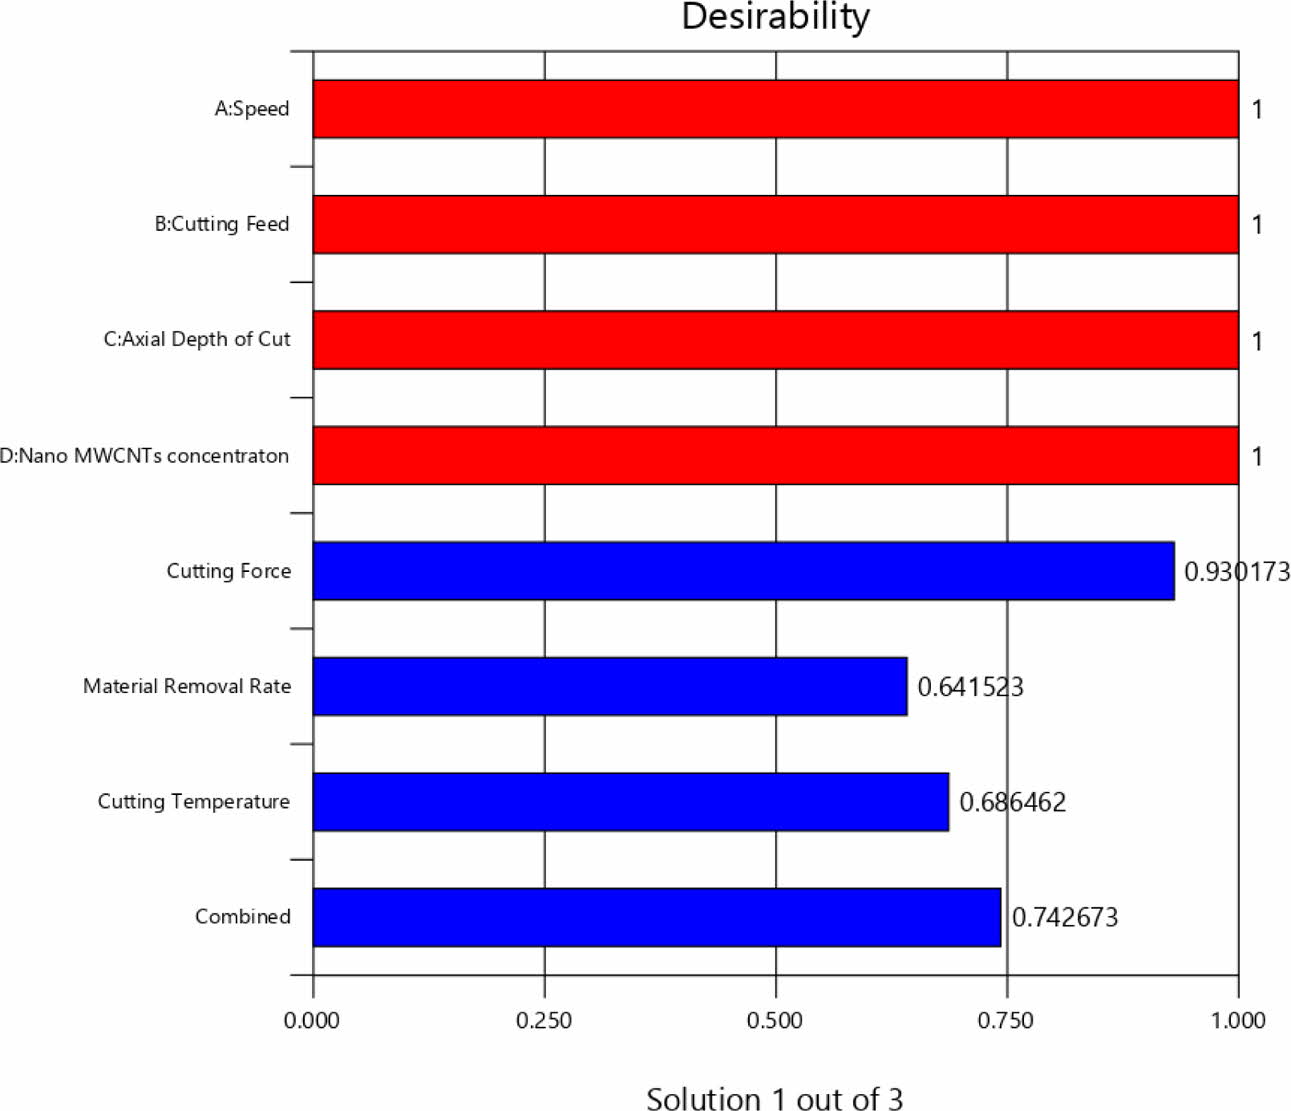
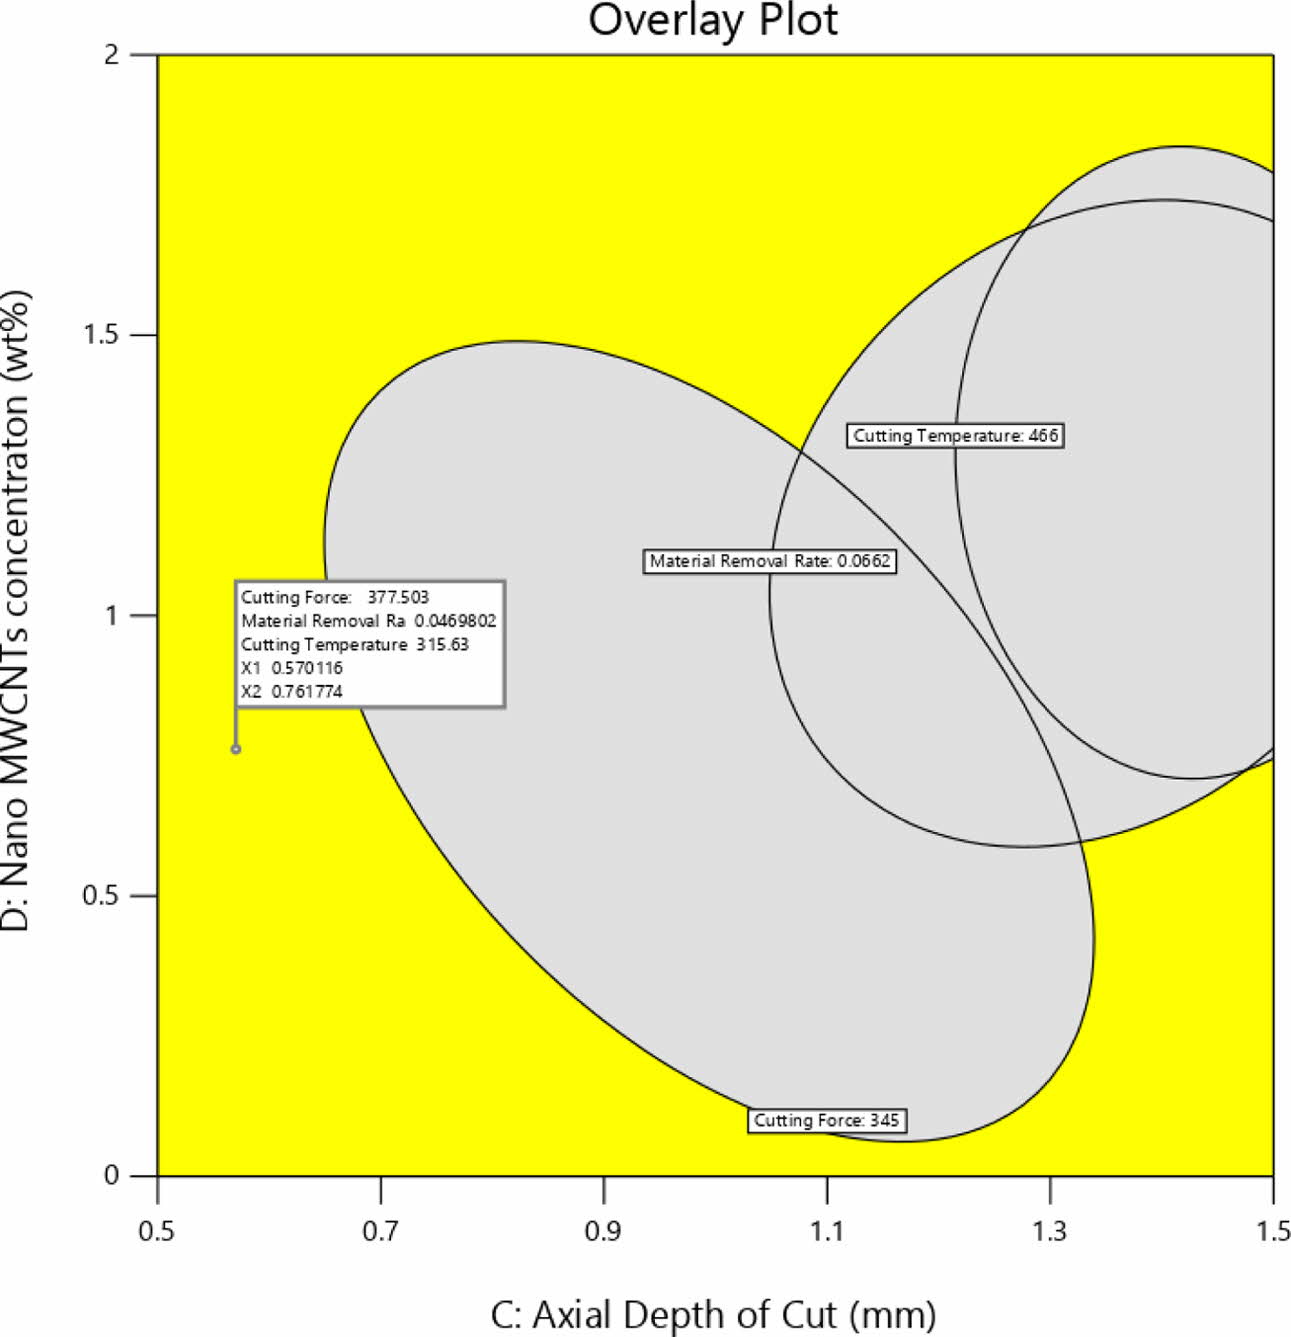
The Fig. 11 desirability bar graph depicts the desir- ability for individual responses and combined effects for the response. The rap graph (Fig. 10) dot depicts a clear picture of the prediction of the output to the input. The analyses were made for 21 experiments with different input parameters. The overlay plot Fig. 12 supports to choice of the highest overall desirability. The general function of desirability has been observed with help of a bar graph for all the responses. Usually, the value between zeros to one is considered for accuracy in DFA [32, 33]
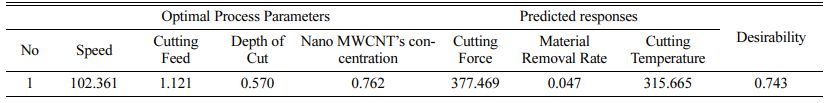
The weights have been assigned based on the importance and quality requirement for responses [34]. The response values predict from the highest desirability values of the input parameters. The predicted optimal values were chosen from the highest desirable value of the input responses [35]. Table 11 shows the weights given for the responses. The maximum weightage (W=5.0) have been assigned for all the output responses i.e., axial force, material removal rate and temperature [36]. The desirability analysis optimum solution of axial force, material removal rate and temperature are 377.496, 0.047, and 315.665 respectively. The table shows that the overall desirability is 0.743 which indicates the closeness of the target values.
Validation
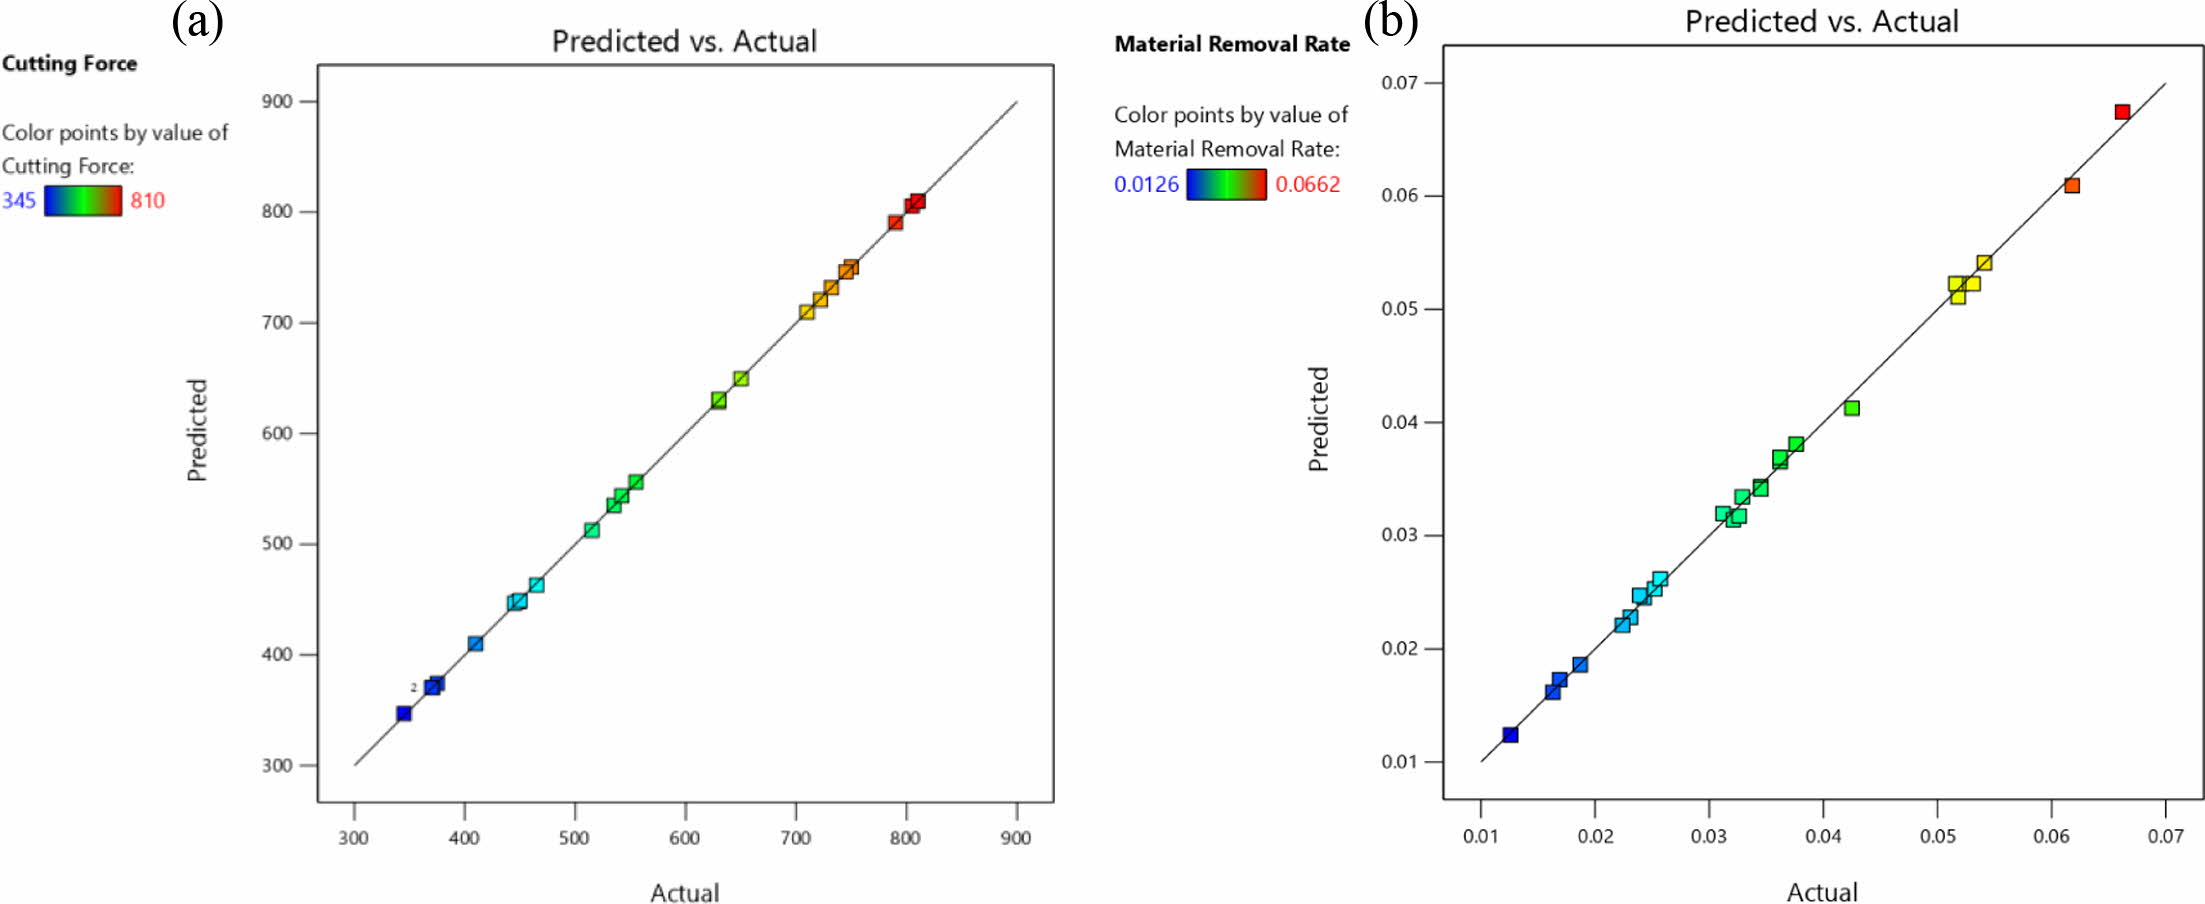
The confirmation experiment was conducted for adequacy checked by regression equation of mathematical models. The predicted and actual responses were measured for confirmation. Fig. 13(a-b) reveals that the actual versus the predicted value of cutting force and material removal rate points were fall closer to the mean line; thus multi-objective optimization results were highly accurate and acceptable.
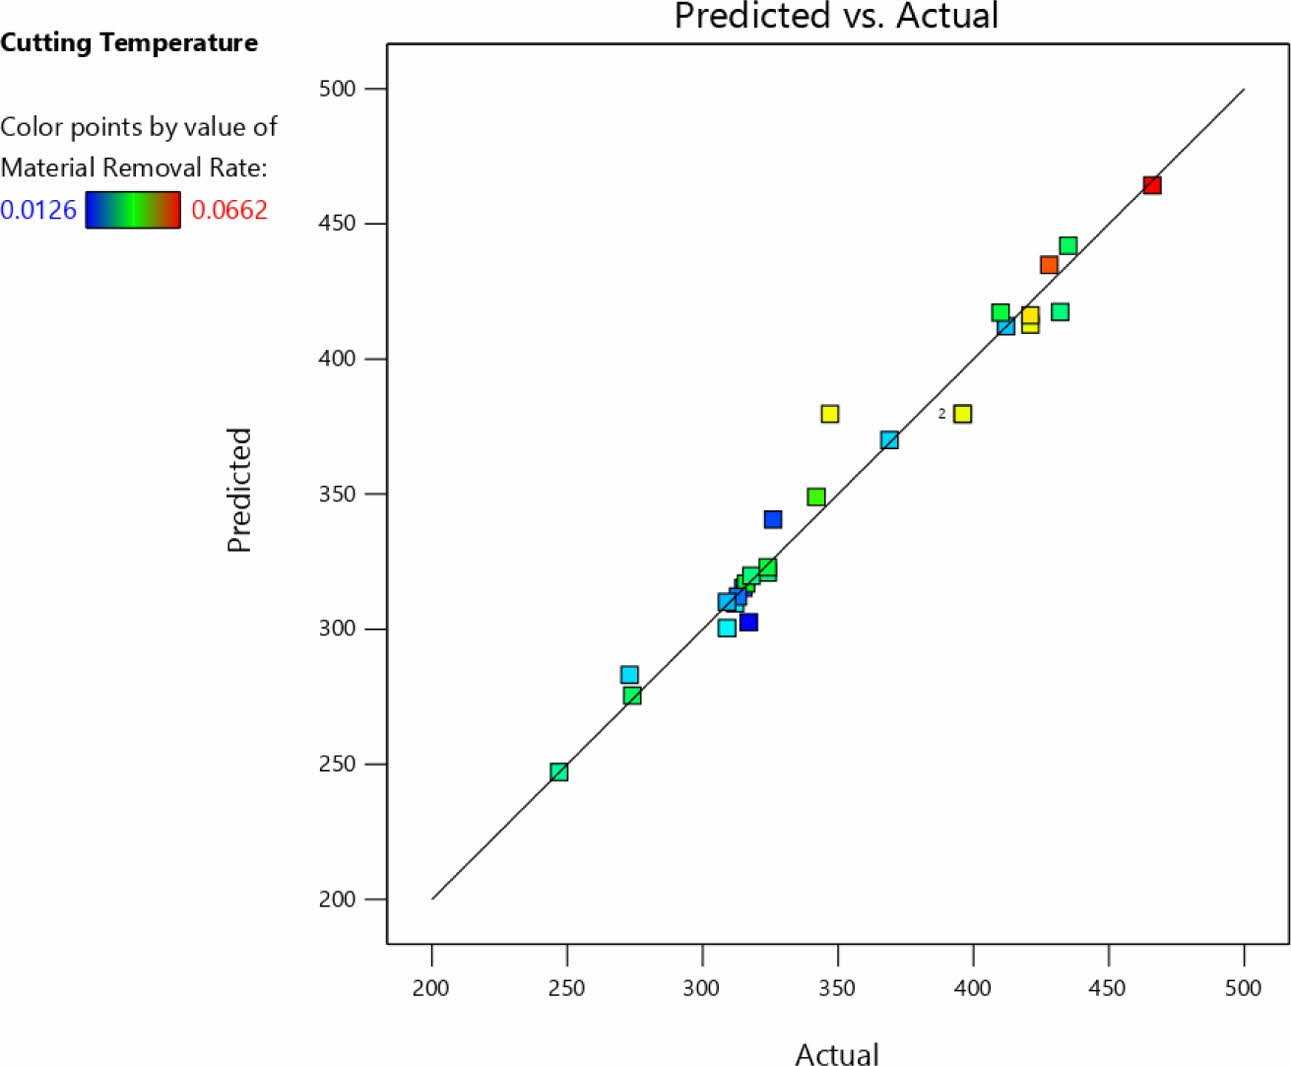
Fig. 14 reveals that the Actual Versus Predicted value of Cutting temperature points fell closer to the mean line; some of the values away from the mean line indicate the causes of temperature rise; thus multi-objective optimization results were highly accurate and acceptable. Table 9 Table 10
|
Fig. 7 (a) 2D & 3D interaction plots for Speed, Feed Vs cutting force, (b) 2D & 3D interaction plots for Speed, Depth of cut Vs cutting force, and (c) 2D & 3D interaction plots for Speed, MWCNTs Vs cutting force. |
|
Fig. 8 (a) 2D & 3D interaction plots for Speed, Feed Vs Material removal rate, (b) 2D & 3D interaction plots for Speed, Depth of cut Vs Material removal rate, (c) 2D & 3D interaction plots for Speed, MWCNTs Vs Material removal rate. |
|
Fig. 9 (a) 2D & 3D interaction plots for Speed, Feed Vs Cutting Temperature, (b) 2D & 3D interaction plots for Speed, Depth of cut Vs Cutting Temperature, and (c) 2D & 3D interaction plots for Speed, MWCNTs Vs Cutting Temperature. |
|
Fig. 10 DFA Solutions Ramp Graph. |
|
Fig. 11 DFA Solutions Bar Graph |
|
Fig. 12 DFA Solutions Overlay plot. |
|
Fig. 13 (a-b) Actual Vs Predicted value of Cutting forces & MRR. |
|
Fig. 14 Actual Vs Predicted value of Cutting Temperature. |
In this work, the turning operation was carried out on a CNC turning centre with the use of different con- centrations of MWCNT nanofluid for various responses of cutting forces, material removal rate and cutting temperature were recorded during the experimentations. The obtained analysis results in the following conclusion have drawn.
The percentage of added nano-fluid is a significant variable in design influencing reduced cutting temperature using ANOVA.
The R2 values for cutting temperature (93%), material removal rate (99%) and cutting force (99%) show a good relationship between the experimental and predicted cutting conditions.
Multiwall carbon nano-tubes cutting fluid has been reported to give better results in terms of cutting temperature related to experiments conducted without nano-additives.
The capability of lubrication of the coolant, which was used with MWCNT machining, compared to without diffusion of MWCNT and lowering cutting temperature was measured in 1% of MWCNT diffused cutting fluids.
DFA Multi-objective optimization results show the better machining performance with the selection of optimum machining condition range was 100 m/min, 1.0 mm/rev, 0.5 mm and 1% of speed, feed, depth of cut and MWCNTs respectively.
The DFA optimal output responses were predicted as the maximum cutting force was equal to 377N, the material removal rate was 0.05 g/min and the minimum temperature was 316 oC at a desirability value of D = 0.743.
- 1. C. Veiga, J.P. Davim, and A.J.R. Loureiro, Rev. Adv. Mater. Sci. 34 (2013) 148-164.
- 2. K.H. Hashmi, G. Zakria, M.B. Raza, and S. Khalil. Int. J. Adv. Manuf. Tech. 85[5-8] (2016) 1847-1856.
-

- 3. R.S. Revuru, J.Z. Zhang, N.R. Posinasetti, and T. Kidd, Int. J. Adv. Manuf. Tech. 95[1-4] (2018) 1451-1463.
-
- 4. S. Pervaiz, S. Anwar, I. Qureshi, and N. Ahmed, Int. J. Pres. Eng. And Manuf. Green tech. 6[1] (2019) 133-145.
-
- 5. A.K. Sharma, R.K. Singh, A.R. Dixit, and A.K. Tiwari,, J. of Manuf. Proc. 30[1] (2017) 467-482.
-
- 6. C. Chanakyan and S. Sivakumar, J. Ceram. Process. Res. 21[6] (2020) 647-655.
-
- 7. S. Lei and W. Liu, Int. J. of Machine Tool & Manuf. 42 (2002) 653-661.
-
- 8. D. Yang and Z. Liu, Int. J. of Ref. Metals and Hard Mat. 51 (2015) 192-200.
-
- 9. R. Thirumalai, J.S. Senthilkumar, P. Selvarani, and S. Ramesh in Proceeding of the Inst. of Mech Eng, Part C: J. of Mech. Eng. Sci. 227[9] (2013) 1889-1897.
-
- 10. P. Bacha, G. Trmalb, P. Zemana, and J. Vanaa, Jan Malya in Procedia on 5th Conference on 2012, (2012) 226-231.
-
- 11. M.k. Gupta, P.K. Sood, and V.S. Sharma, J. of Cleaner Prod. 135 (2016) 1276-1288.
-
- 12. M. Li, T. Yu, L. Yang, H. Li, and R. Zhang, Int. J. of Adv. Manuf. Tech. Springer Verlag Lonton Ltd, Part of Nature, (2017).
-
- 13. C. Manivel, Digest J. of Nanomat. and Biostruc 15[3] (2020) 809-814.
- 14. S. Bruschi, R. Bertolini, A. Bordin, F. Medea, and A. Ghiotti, Tribo. Int. [102] (2016) 133-142.
-
- 15. P. Mutharasu and M. Kathiresan, J. Ceram. Process. Res. 22[6] (2021) 697-704.
-
- 16. S. Pervaiz, S. Anwar, I. Qureshi, and N. Ahmed, Int. J. of Prec. Eng. and Manuf. Green Tech. 6 (2019) 135-145.
-
- 17. W. Wang, J. of Cleaner Prod. (2018) 209.
- 18. N.M. Prabhu, P. Maniiarasan, S. Nalliusamy, and S. Jeevanatham, Int. J. of nono manuf. 16[1] (2020) 61-75.
-
- 19. A.K. Sharma, A.k. Tiwari, and A.R. Dixit , J. of Cleaner Prod. 127 (2016) 1-18.
-
- 20. R. Thirumalai, J.S. Senthilkumar, P. Selvarani, R.M. Arunachalam, and K.M. Senthilkumar, Aus J. of Mech Eng, 10[2] (2012) 157-168.
-
- 21. R.K. Sigh, A.K. Sharma, A.R. Dixit, A. Tiwari, A. Pramanik, and A. Mandal, J. of Cleaner Prod. 162 (2017) 830-845.
-
- 22. T. Pridhar, K. Ravikumar, B. Sureshbabu, R. Srinivasan, and B. Sathiskumar, J. Ceram. Process. Res. 21[2] (2020) 131-142.
-
- 23. R. Dharamalingam, K.K. Sivagnanaprabhu, B. S. Kumar, and R. Thirumalai, Proceedia Eng. 97 (2014) 1434-1441.
-
- 24. R. Thirumalai and J.S. Senthilkumar, J. of Mech. Sci. and Tech. 27[4] (2013) 1109-1116.
-
- 25. D. Tang, H.B. Lim, K.J. Lee, S.J. Ha, K.B. Kim, M.W. Cho, K. Park and W.S. Cho, Int. J. Ceram. Process. Res. 14[5] (2013) 610-615.
- 26. B. Singaravel and T. Selvaraj, J. of Adv. Manuf. Sys. 15[1] (2016) 1-11.
-
- 27. R. Thirumalai, M. Seenivasan, and K. Paneerselvam, Mat. Today Proc. Elsv. 45 (2021) 467-472.
-
- 28. K. Aslantas, E.Ekici, and A. Cicek, Measurement 128 (2018) 419-427.
-
- 29. D. R. Shah and S.N. Bhavsar, Int. J. of Data Network Sci. 3 (2019) 291-304.
-
- 30. M. Srinivasan, S. Ramesh, S. Sundaram, and R. Viswanathan, Int. J. Ceram. Process. Res. 22[3] (2021) 345-355.
-
- 31. J. Kumar and T. Soota, Mat. Today: Proc. 21 (2019) 1544-1550.
-
- 32. L. Tang and Y.T. Du, Mat. and Manuf. Proc. 29[5] (2014) 507-513.
-
- 33. K.M. Senthil Kumar, T. Ramanathan, S. Murugasan, and V. Thangamuthu, Int. J. Ceram. Process. Res. 22[6] (2021) 731-738.
-
- 34. N. Li, Y. Chen, and D. Kong, Adv. Manuf. 7 (2019) 142-154.
-
- 35. G. Liu, C. Li, Y. Zhang, M. Yang, D. Jia, X. Zhang, S. Guo, R. Li, R. Li, and H. Zhai, Mat. and Manuf. Proc. 33 (2018) 950-963.
-
- 36. L. Shakeel Ahamed, Int. Proceeding of the ASME 2016, International Mechanical Engineering Congress and Ex- position IMECE-2016, [11-17] (2016), Phoenix, Arizonaa, USA.
- 37. B. Suresh Babu, G. Chandramohan, C. Boopathi, T. Prithar, and R. Srinivasan, Int. J. Cerm. Process. Res. 19[1] (2018) 69-74.
 This Article
-
2022; 23(4): 476-489
Published on Aug 31, 2022
- 10.36410/jcpr.2022.23.4.476
- Received on Jan 22, 2022
- Revised on Apr 8, 2022
- Accepted on Apr 19, 2022
Services
Shared
Correspondence to
- Senthil Kumar L
-
SNS College of Engineering, Coimbatore, Tamilnadu, India 641 107
Tel : +91-9789648980 - E-mail: kls.senthillogu@gmail.com
Clean-Energy Research Institute(CRI), Hanyang University, 222, Wangsimni-ro, Seongdong-gu, Seoul, 04763, Korea
E-mail: jcpr@hanyang.ac.kr