


- Comparison of microwave and conventional processing stainless steelmaking dust to prepare black ceramic pigments
Zhiqiao Lia, Xiang Zhanga,*, Guojun Maa, Rodrigue Armel Muvunyib and Dingli Zhengb
aThe State Key Laboratory of Refractories and Metallurgy, Wuhan University of Science and Technology, Wuhan, 430081, P.R. China
bKey Laboratory for Ferrous Metallurgy and Resources Utilization of Ministry of Education, Wuhan University of Science and Technology, Wuhan 430081, P.R. ChinaThis article is an open access article distributed under the terms of the Creative Commons Attribution Non-Commercial License (http://creativecommons.org/licenses/by-nc/4.0) which permits unrestricted non-commercial use, distribution, and reproduction in any medium, provided the original work is properly cited.
Using stainless steelmaking dust (SSD) for the preparation of black ceramic pigments can not only reduce pollution, but also have more considerable economic, environmental and social value. Black ceramic pigments with the mixed spinel-type were prepared from SSD by microwave and conventional processing, respectively. The properties of black ceramic pigments were studied by X-ray diffraction, Fourier transform infrared spectroscopy, Scanning electron microscope and Colorimeter. The results show that the main phase compositions of pigment sample synthesised by microwave processing are Fe3O4, FeCr2O4, NiFe2O4 and NiMn0.5Cr1.5O4. Compared with conventional processing, microwave processing can significantly reduce the required temperature of spinel formation reaction and promote the reaction. Moreover, the pigment sample prepared by microwave processing (PSM) is blacker and has a lower band gap than that prepared by conventional processing (PSC). The microstructure of PSM is regular polyhedral, and the crystal size of it is significantly larger than the PSC. In addition, the preparation process of PSM is more efficient and has a better application prospect compared with PSC
Keywords: microwave processing, stainless steelmaking dust, black ceramic pigments, transition metal element, spinels
SSD has been classified as a hazardous waste by several countries because it fails the toxicity leaching test for Cr and other heavy metal elements [1, 2]. At the moment, the utilization ratio of SSD is low, and a large amount of SSD is simply stockpiled or landfilled, potentially polluting the soil or underwater as a result of heavy metal leaching. To recycle the valuable metal elements in SSD, the researchers developed the direct reduction or melting reduction process, such as Inmetco Process, Scan Dust AB [3]. However, the development of these methods is hampered by high energy con- sumption, complex procedures, secondary contamination, Cr recovery rate instability, and other issues [4]. Thus, how to address the aforementioned issues and produce high-value-added products has attracted the attention of many researchers [5-8].
Every year, a large number of ceramic pigments are consumed in the ceramic decoration material industry, with black ceramic pigments accounting for 25% of total consumption [9]. Co2O3 is generally added to the traditional production process of black ceramic pigments to ensure that the pigments are pure black, although it is well known that Co2O3 is quite expensive [8]. Thus, cobalt-free black ceramic pigments were developed, which can be classified as eskolaite-hematite (Cr,Fe)2O3 solid solution type and complex spinel-type in the Cr-Fe-Mn-Ni-(Cu-V) system [10]. The most popular black ceramic pigments are based on spinel structure, such as (Ni,Fe)(Fe,Cr)2O4 and (Fe,Mn)(Fe,Mn)2O4, etc. [11-13], due to the poor stability of eskolaite-hematite pigments in molten glazes at high temperature than that of spinel pigments [14, 15]. Moreover, the majority of black ceramic pigments are synthesised using the solid-phase reaction method in conjunction with conventional heating processing at present [6]. This method, however, has some drawbacks, such as high energy consumption and a long reaction time. Therefore, it is necessary to develop a cost-effective and simple method of producing black ceramic pigments.
SSD can be used to prepare black ceramic pigments due to the relatively high content of transition metal elements in it, such as Fe, Cr, Mn, and so on. Nonethe- less, in a previous study on the synthesis of black ceramic pigments form SSD using conventional processing [6, 8], only the molar ratio of Fe and Cr elements in the raw material mixture was taken into account, resulting in pigments of the eskolaite-hematite solid solution type, while the synthesis temperature is high and the synthesis time is long. In order to obtain better black ceramic pigments with complex spinel system, SSD can be used by adding appropriate chemical reagents to adjust the proportion of Fe, Cr, Ni and Mn in the mixture of raw materials. The issue of need to add expensive ingredient Co2O3 during the traditional black ceramic pigments production process can also be soloved in the above method.
On the other hand, microwave processing, as an environmentally friendly and controllable approach, can effectively overcome the problem of “cold core” in conventional heating processing, allowing the material to be heated fast and evenly, and it is widely used in the field of ceramic research [16-19]. In addition, many studies indicate that microwave processing can improve the thermodynamic conditions for the reaction, lower the reaction temperature, promote the reaction and accelerate ion diffusion [20-22]. Calbo et al. [23] and Khttab et al. [24] applied microwave radiation technology to synthesise CoFe2O4 black ceramic pigment, ZrSiO4: Fe2O3 coral red ceramic pigment and CoxMg1-xAl2O4 nano-spinel pigment, separately, and the obtained pigments have excellent properties. Blosi et al. [25] adopted a two-step synthesis process, in which raw materials were preheated in a conventional electric furnace and then quickly transferred to a microwave muffle furnace for roasting, and found that microwave processing can significantly shorten the synthesis time of ceramic pigments. Therefore, microwave processing may be a promising method for the synthesis of black ceramic pigments. To summarize, the preparation of black ceramic pigments from SSD by microwave processing can not only realize the harmless treatment of SSD, but also recover valuable metal elements in SSD and achieve the goal of effectively converting SSD into complex spinel type black ceramic pigments, which is with superior stability than the eskolaite-hematite solid solution type pigments.
In this study, SSD was used as the primary raw material to prepare black ceramic pigments using microwave processing and conventional processing, respectively, in order to develop a new method for utilizing it and to validate the feasibility of the micro- wave processing method for the preparation of black ceramic pigments from it.
Sample preparations
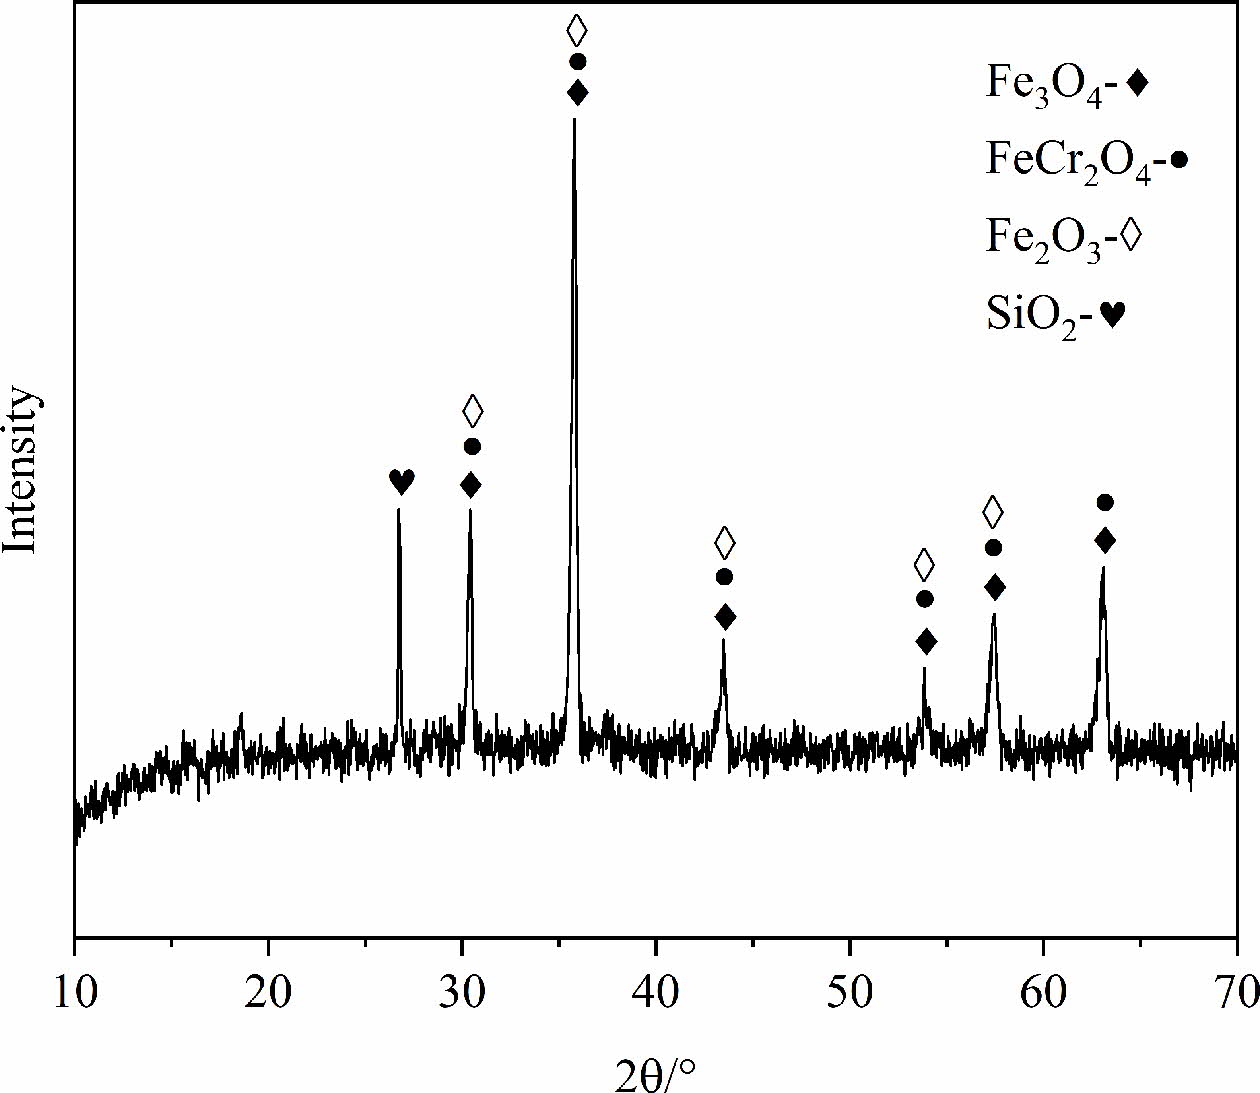
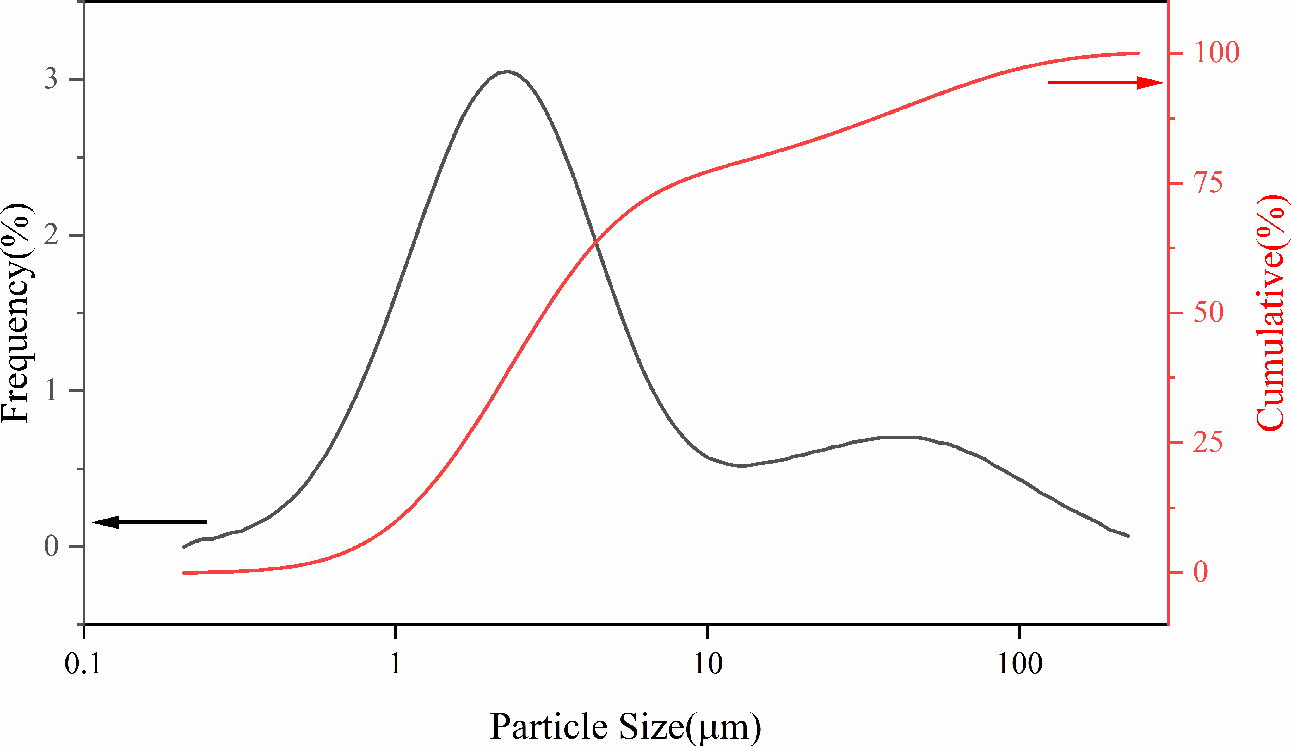
The SSD used in this experiment was collected by a stainless steel plant in the southwest of China, of which the main composition is shown in Table 1. It can be found that the contents of Fe2O3, Cr2O3, MnO and NiO in the SSD are high. Fig. 1 is the XRD patterns of SSD and shows that the main phases of it are Fe3O4, FeCr2O4, Fe2O3 and SiO2. The particle size distribution of SSD (as shown in Fig. 2) indicates the dust particles are fine and the particle size can be roughly divided into smaller particles 1~10 mm and larger particles 10~100 mm. The high contents of transient elements and small particle size of SSD manifest that it can be used as a good raw material to prepare black ceramic pigments.
After being dried at 120 oC for 48 h, the SSD is mixed homogeneously with three kinds of chemical reagents Cr2O3, NiO and MnO (all are AR) according to the molar ratio of Fe: Cr: Ni: Mn is 4: 4: 2: 1. Then, two samples of the mixtures (each one of weighing 30 g) were heated from room temperature to 900 oC in the microwave power of 2000 W and a muffle furnace (heating rate of 8 oC/min) and held for 45 min respec- tively. Finally, the prepared pigment samples were cooled to room temperature by air cooling.
Characterization
The thermal behavior of the mixture of SSD and chemical agents was carried out by thermogravimetric and differential scanning calorimetry (TG-DSC, SEA449C) at room temperature to 1200 oC in an air atmosphere. The crystal structure of the pigment samples was analyzed by X-ray diffractometer (XRD, X'Pert PRO), and the Scherrer formula Eq. (1) was used to calculate the crystal size of the pigment sample according to the XRD result [26]:
where D is the crystal size (nm), λ is the wavelength of the X-ray (Cu Kα, 1.4954 Å), B is the full width at half maximum (FWHM) and θ is the Bragg diffraction angle.
The infrared reflection spectra of the pigment samples were analyzed by Fourier transform infrared spectrometer (FT-IR, Nicolet iS50) with the test wave number range of 400~1400 cm-1. Moreover, the diffuse reflectance spectra of them were measured by UV-vis spectro- photometer (Shimadzu UV-2600) at the wavelength of 380~780 nm, and thereafter, the Kubelka-Munk (K-M) formula F(R)can be used to calculate their band gaps (Eg) [27], as shown in Eq. (2):
where R represents the reflectance of the pigment sample at a certain wavelength. Then the plot of [F(R)hv]1/2 vs hv (h- Planck constant, v-the frequency of light) can be obtained. The linear parts of the curves were extra- polated to F(R) = 0 and the values of x-intercept indicate the band gaps of the pigment samples [28].
The surface morphologies and element mapping of the pigment samples were measured using a scanning electron microscope (SEM, Nova NanoSEM400) and energy dispersive spectrometry (EDS, 350 PentaFETX-3), respectively.
The chromaticity values, including L*, a* and b*, of the pigment samples were measured with the portable colorimeter (3nh TS7010). L*, a* and b* are color models developed by the International Commission on Illumination (CIE). In this system, L* represents the lightness and darkness of the color, which is a scale from white (L*=100) to black (L*=0). a* and b* represent the scales of green (-a*) to red (+a*) and blue (-b*) to yellow (+b*), respectively. The color saturation (C*) is calculated using a* and b* values from Eq. (3). The closer all of the L*, a*, b* and C* values are to 0, the purer the pigment’s black and the better the color rendering performance of it [29].
|
Fig. 1 XRD pattern of the SSD. |
|
Fig. 2 Particle size distribution of the SSD. |

TG-DSC analysis of the mixture for pigment pre- paration
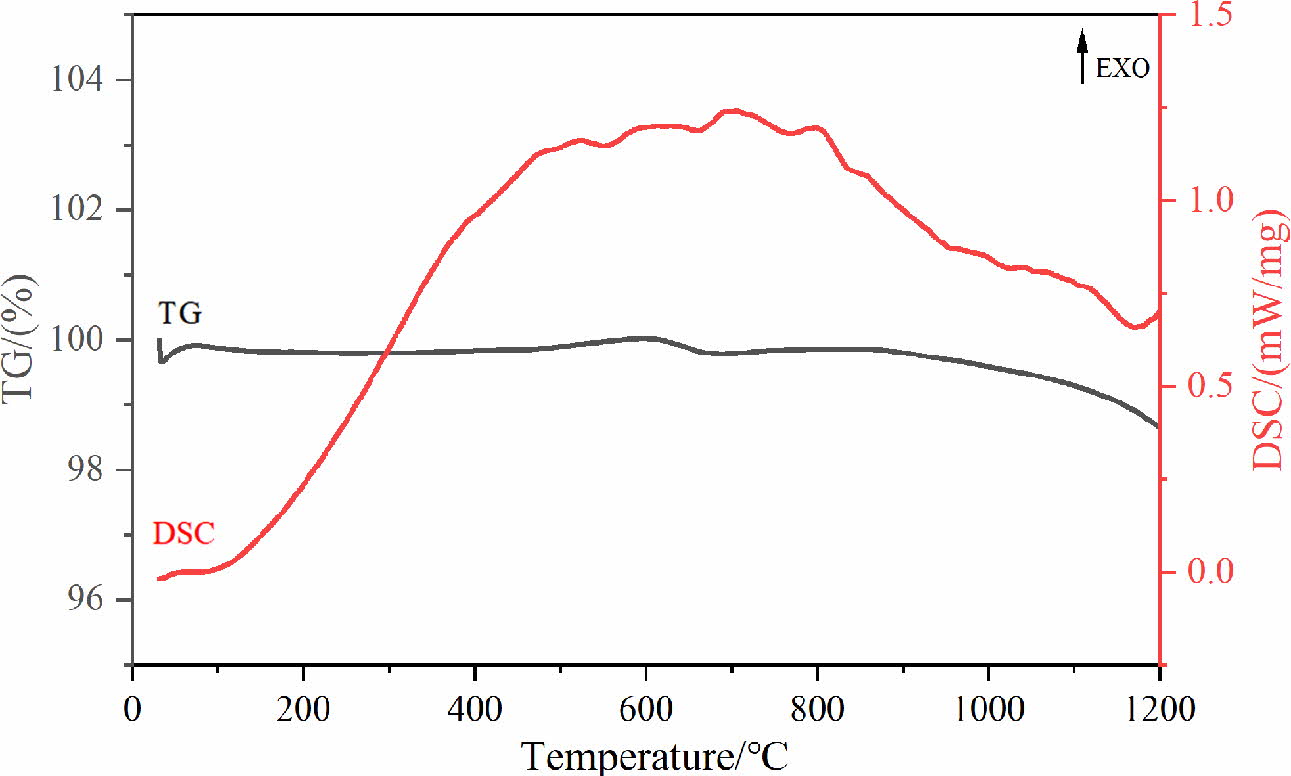
Fig. 3 is the TG-DSC result of the mixture for pigment preparation. It can be found from Fig. 3 that the process of pigment synthesis can be divided into several different stages. At first, NiO and MnO in the raw material will be oxidised to Ni2O3 and Mn2O3 respectively, which corresponds to the mass increase and exothermic peak of the curve at 100~600 oC. Sub- sequently, the mass loss of TG curve at 600 oC attribute to that Ni2O3 decomposes into NiO and releases oxygen [30]. When the temperature rises to 700 oC, the exothermic peak drops significantly, indicating that the solid-phase synthesis reactions of spinel occur [31]. When the temperature rises about 1100 oC, the mass loss result from the decomposition of spinel phases (such as Cr-containing spinel and Mn-containing spinel) and the release of a small amount of oxygen [12, 32]. Therefore, the calcined temperature of 900 oC can not only satisfy the occurrence of solid-phase reactions but also prevent the decomposition of spinel phases.
XRD and crystal structure analysis of the prepared pigments
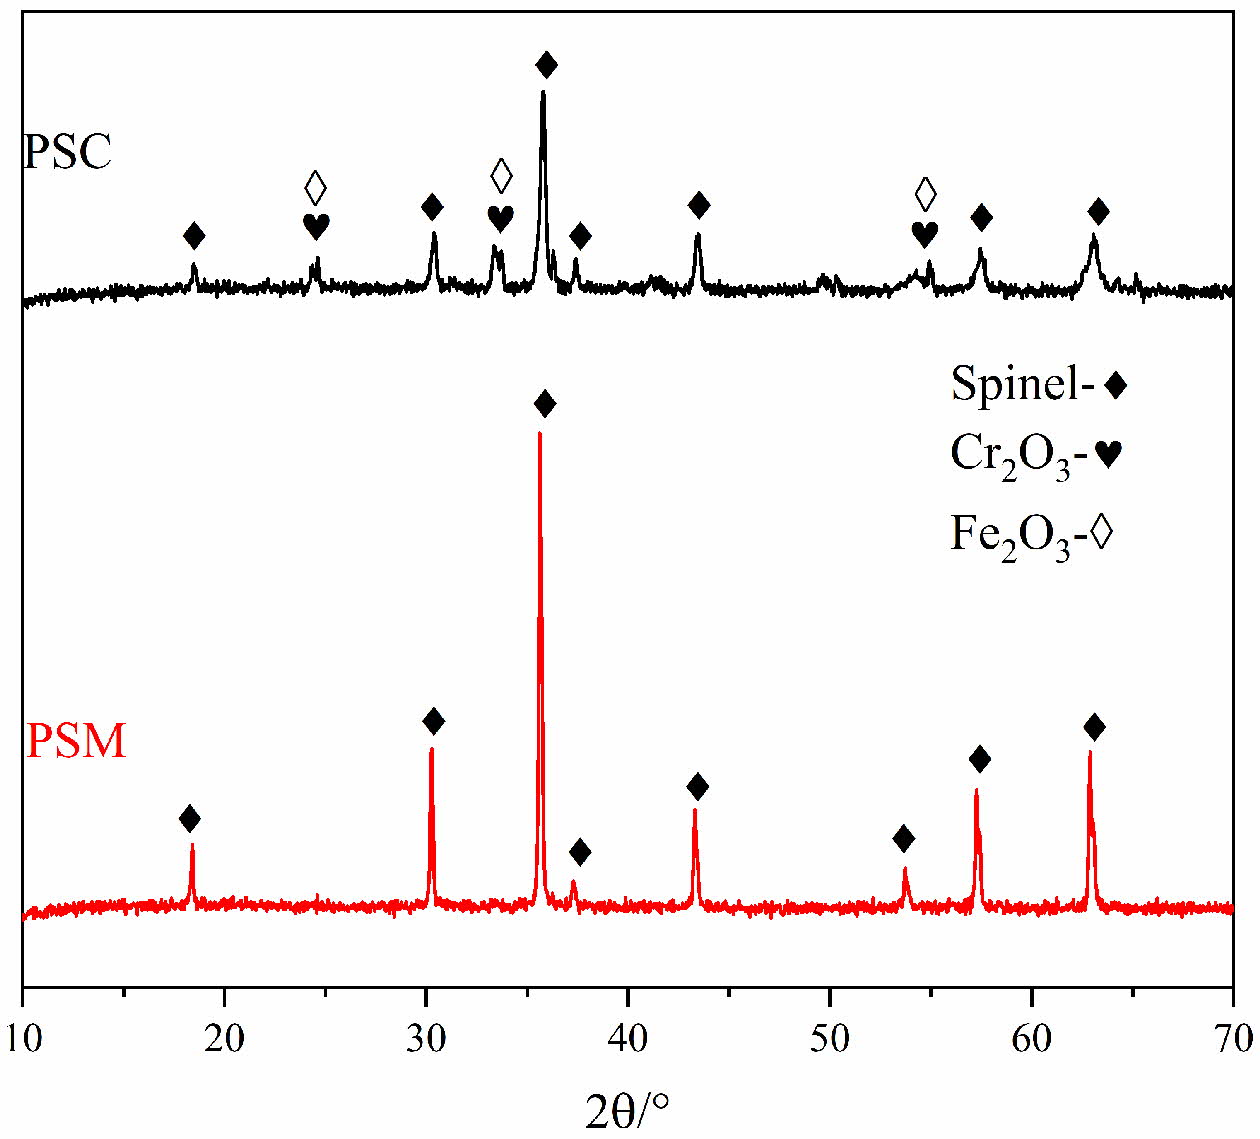
The XRD patterns of pigments under different pro- cessing methods are shown in Fig. 4. It can be found from Fig. 4 that the main phases in PSC are spinels, Fe2O3 and Cr2O3, whereas there are only spinel phases in PSW. The spinel phases in both two pigment samples consist of Fe3O4, FeCr2O4, NiFe2O4 and NiMn0.5Cr1.5O4, and the above spinel phases have excellent crystal structure with black perfermance [33]. In addition, the diffraction peak intensity of spinel phases is higher and sharper when microwave processing is adopted, which indicates that the crystallinity of spinels in the pigment sample is improved. The results obtained by Zhang et al. [6] and Chen et al. [10] indicate that the firing temperature of black ceramic pigments prepared by industrial waste under conventional heating method is generally 1100~1200 oC. Therefore, microwave radiation heating could effectively reduce the temperature required for the synthesis reaction and promote the reaction.
The crystal structure of pigment samples was further analyzed by XRD data. For the maximum diffraction peak (3 1 1) corresponding to spinel, Scherrer and Bragg’s formulas were used to calculate the crystal size and lattice parameters of pigment samples, and the results are shown in Table 2. As shown in Table 2, the FWHM of PSM is significantly less than that of con- ventional processing, indicating higher crystallinity and a more complete solid-phase synthesis reaction. Although the PSM has similar lattice constants with the PSC, the average particle size of the former one is much larger. There are many reasons for the above results, on one hand, the selectivity heating of microwave could lead to the heat energy being more concentrated in the reaction between transition metal elements. What’s more, the microparticles are activated by microwave, which reduces the activation energy needed by lattice diffusion and crystal boundary diffusion and further intensifies them.
FT-IR analysis of the prepared pigments
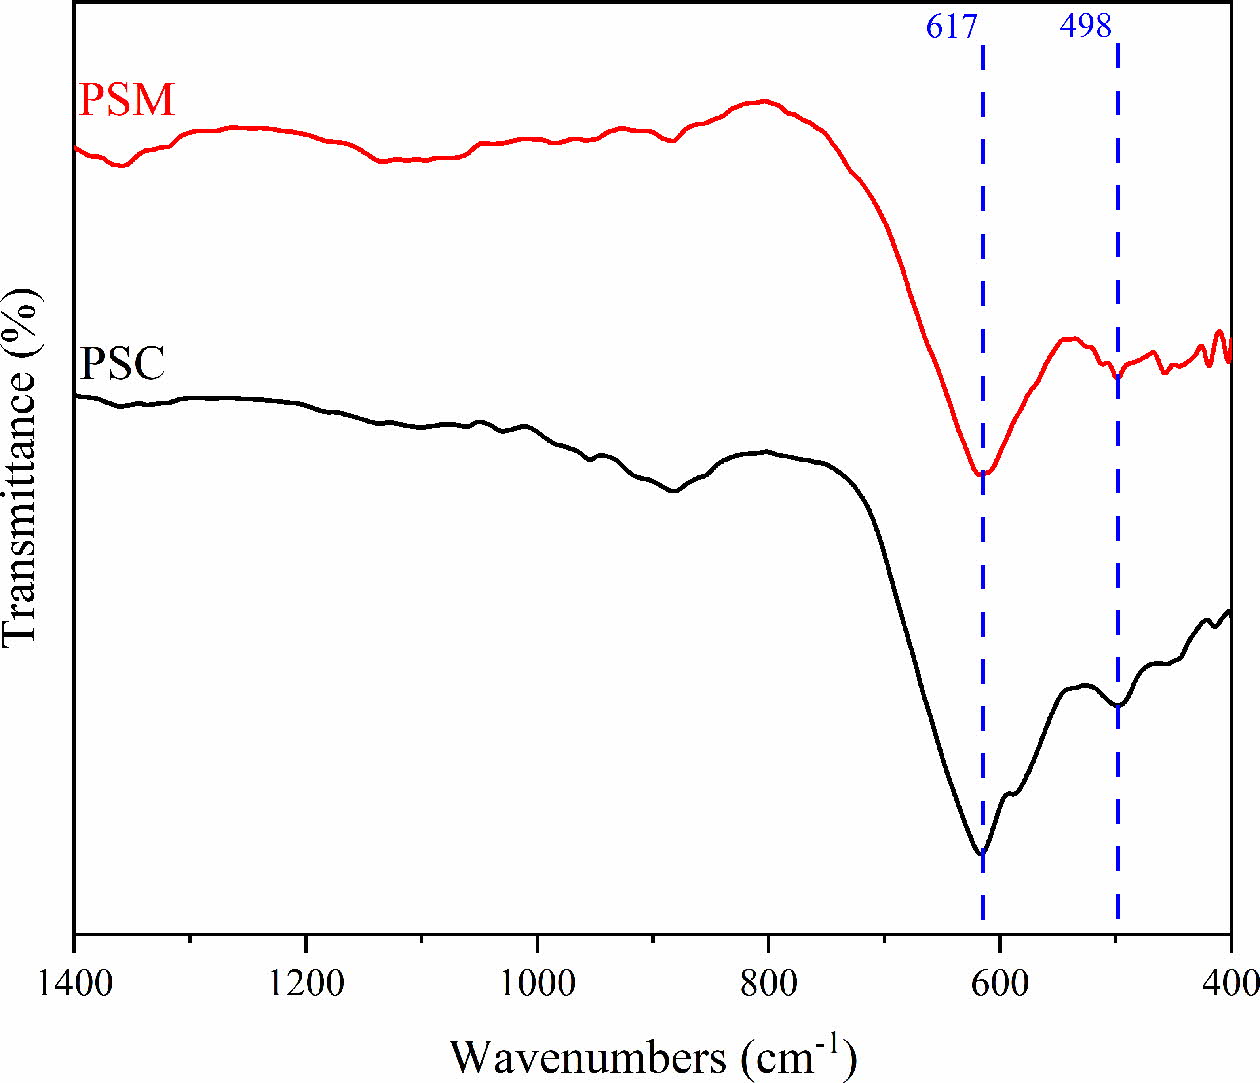
FT-IR analysis was performed to verify the phase structure of the prepared pigment samples. Fig. 5 shows the FT-IR spectra of pigments under different preparation processes. As shown in Fig. 5, there are two peaks near 617 cm-1 and 498 cm-1, among which the peak of 617 cm-1 belongs to the stretching vibration of spinel octahedral position, and 498 cm-1 corresponds to the stretching vibration of spinel tetrahedron [34]. Therefore, it can be seen that the stretching vibration peaks of spinels in PSM are wider and deeper than PSC, and this demonstrates that the content of spinel phases in PSM is more. The above result is consistent with the XRD analysis.
Color performance and micromorphology analysis of the prepared pigments
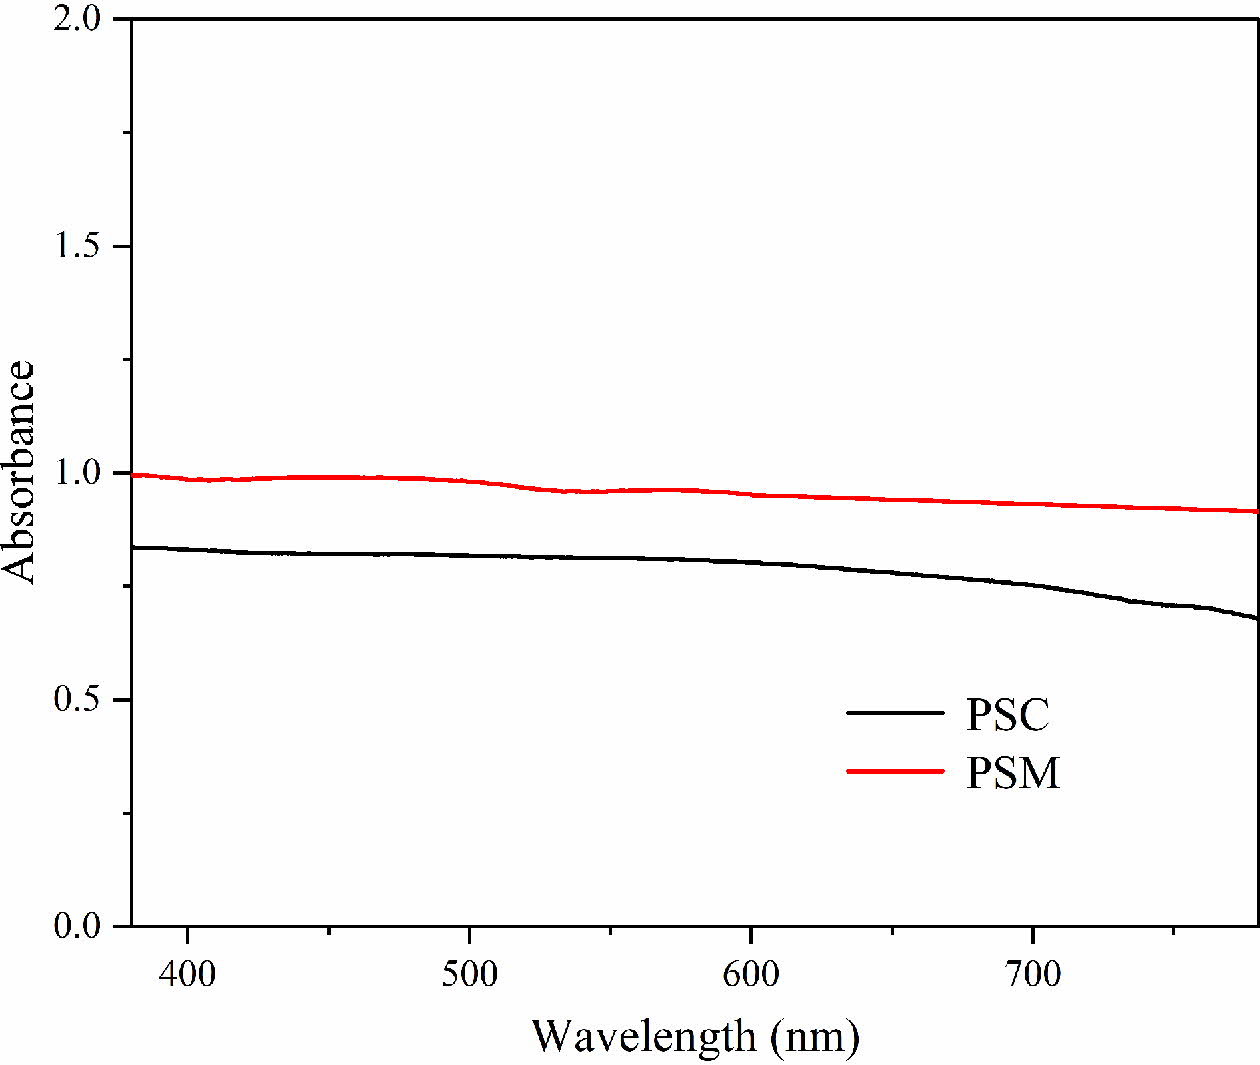
For comparing the color performance difference between the PSM and the PSC, the UV-vis spectra of the two kinds of samples are shown in Fig. 6. It can be found from Fig. 6 that the curve of PSM is almost horizontal, and this indicates the absorbance abilities of PSM for each wavelength of light are nearly the same. However, the absorbance of PSC decreases obviously in the red range of visible light from 622 nm to 780 nm, and this is due to the presence of Fe2O3 in the PSC according to the XRD analysis result. Moreover, the absorbance of PSM is significantly higher than the PSC, resulting in the greater ability of PSM to absorb light and its purer black color.
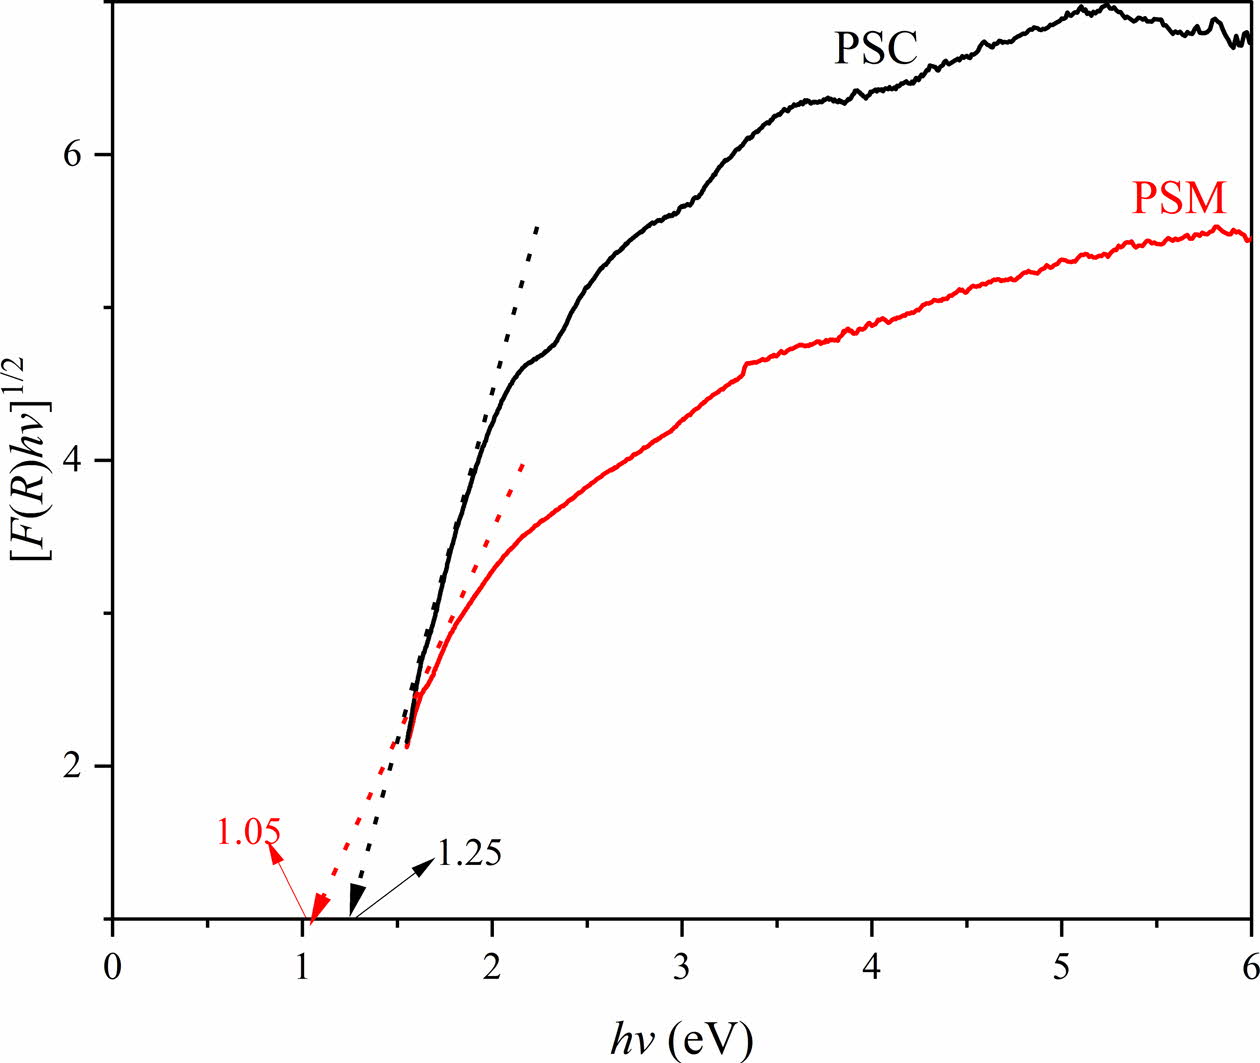
To better understand the color formation mechanism of PSM and PSC, the band gap of them are calculated and the results are as shown in Fig. 7. It shows that the band gaps of PSM and PSC are 1.05 eV and 1.25 eV, respectively. This is due to the higher spinel content in the PSM leading to the improvement of the orbital hybridization effect [35]. Furthermore, the color change of pigment is caused by charge transfer between 4d conduction band and valence band (hybrid orbital composed of B-position element and O 2P) in the outer layer of transition metal elements, and the minimum energy required for transition is the band gap. The smaller band gap can make the pigment sample blacker. In other words, the color of PSM is blacker than the PSC.
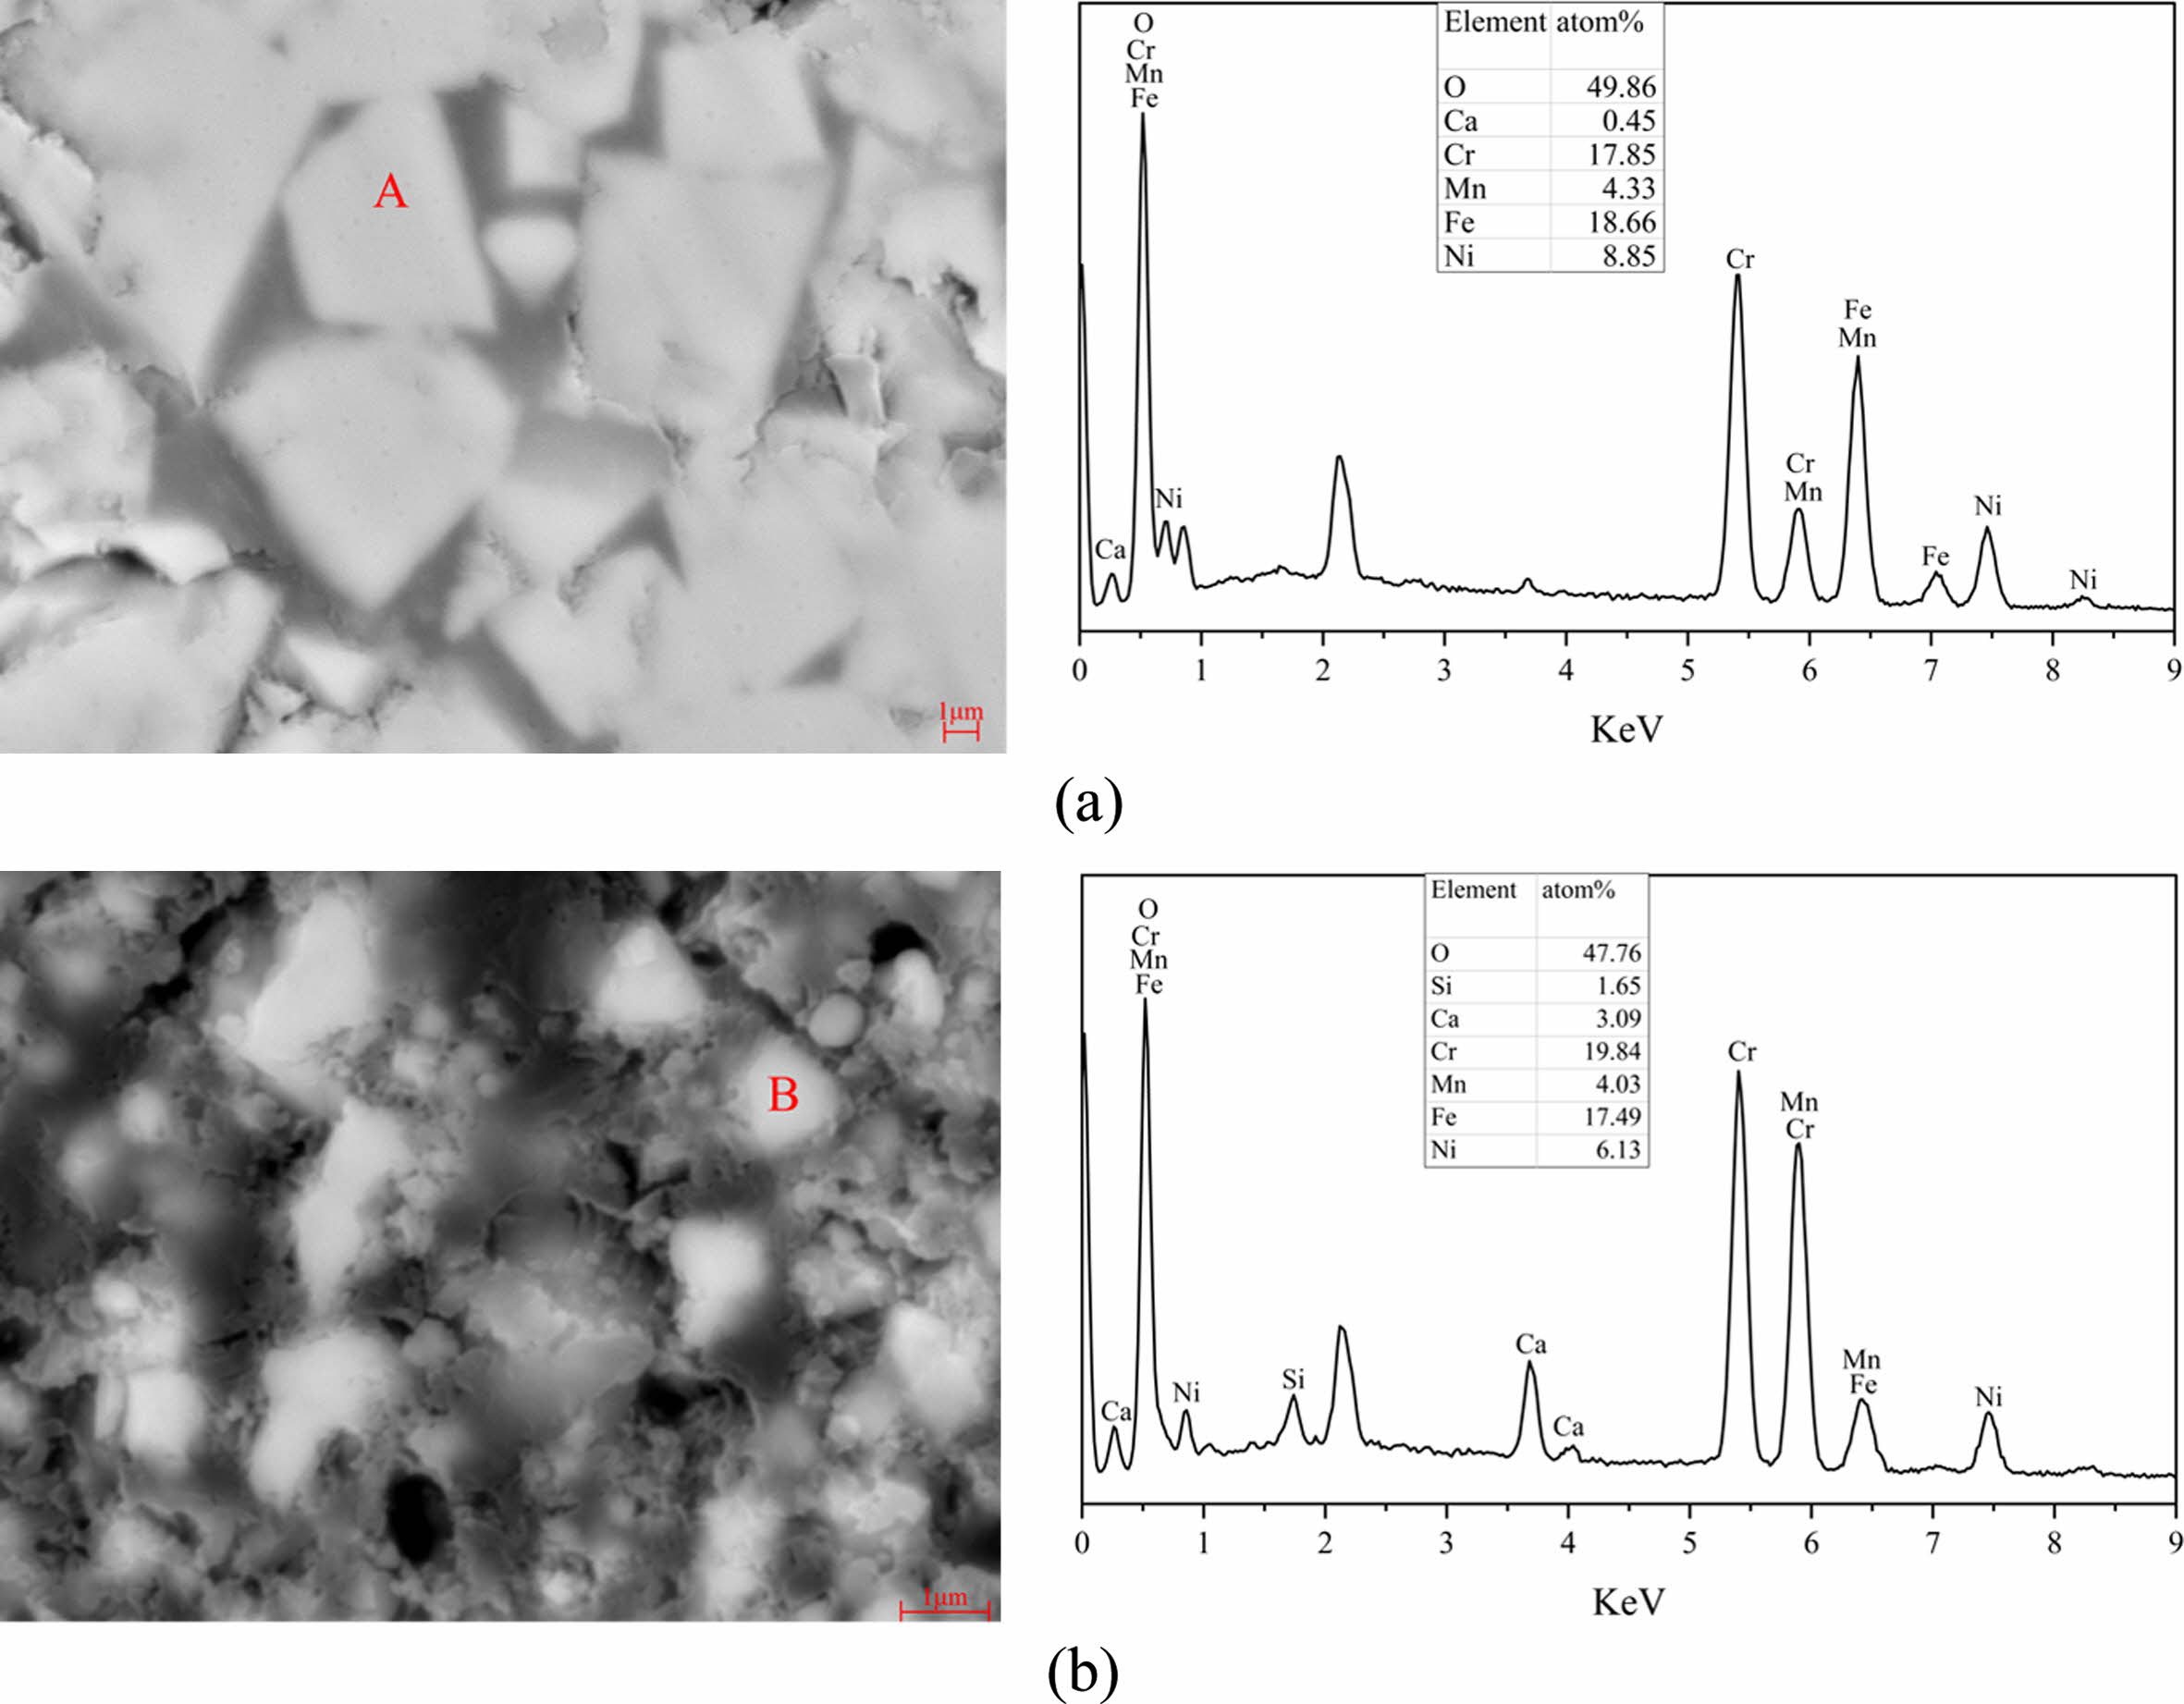
The comparison of micromorphology between the PSM and PSC is shown in Fig. 8. From the Fig. 8, the PSM shows typical spinel micromorphology (regular polyhedron), while the PSC shows an obvious irregular shape. In addition, the average particle size of PSM is larger than the PSC. The EDS analysis results at points A and B in Fig. 8 show that the pigment samples main content is the mixed spinel phase composed by Fe, Cr, Ni and Mn, and also contain a small number of impurity elements brought in by the SSD.
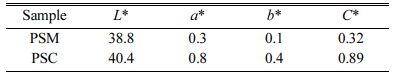
Colorimetric measurement was carried out on pigment samples prepared under different processes, and the colorimetric values L*, a* and b* of them are shown in Table 3. Compared with the PSC, the L*, a* and b* values of PSM are lower, which indicates that the color of PSM is blacker.
|
Fig. 3 TG-DSC curve of the mixture for pigment preparation. |
|
Fig. 4 XRD patterns of the PSM and the PSC. |
|
Fig. 5 FT-IR spectra of the PSM and the PSC. |
|
Fig. 6 UV–vis diffuse absorbance spectra of the PSM and the PSC. |
|
Fig. 7 Band gaps of the PSM and the PSC. |
|
Fig. 8 Morphology of the PSM (a) and the PSC (b). |

Using SSD as raw material, the mixed spinel-type black ceramic pigment can be prepared at the molar ratio of Fe: Cr: Ni: Mn to 4: 4: 2: 1 by microwave pro- cessing at 900 oC for 45 min. The results show that the solid-phase reaction of pigment spinel is complete by microwave processing, and the main phase composition of PSM is Fe3O4, FeCr2O4, NiFe2O4 and NiMn0.5Cr1.5O4, while there are a lot of Fe2O3 and Cr2O3 in the PSC. In addition, the PSM has larger crystal size but smaller band gap than the PSC. In terms of color performance, L*, a* and b* values of PSM are significantly better than the PSC. Therefore, microwave-assisted preparation of black ceramic pigments from SSD can not only reduce the temperature required for solid-phase synthesis reactions of spinels, but also promote the reactions and shorten the synthesis time.
This work was financially supported by the National Natural Science Foundation of China under Grant [No: 51904212].
- 1. G. Laforest and J. Duchesne, J. Hazard. Mater. 135[1-3] (2006) 156-164.
-

- 2. M.-T. Tang, J. Peng, B. Peng, D. Yu and C.-B. Tang, T. Nonferr. Metal. Soc. 18[1] (2008) 202-206.
-
- 3. Y. Hara, N. Ishiwata, H. Itaya and T. Matsumoto, ISIJ Int. 40[3] (2000) 231-237.
-
- 4. H. Zhang and X. Hong, Resour. Conserv. Recy. 55[8] (2011) 745-754.
-
- 5. S.A. Mikhail, A.M. Turcotte and J. Aota, Thermochim. Acta. 287[1] (1996) 71-79.
-
- 6. X. Zhang, G. Ma, Y. Jin and P. Cheng, Ceram. Int. 40[7] (2014) 9693-9700.
-
- 7. M. Pelino, A. Karamanov, P. Pisciella, S. Crisucci and D. Zonetti, Waste Manage. 22[8] (2002) 945-949.
-
- 8. R. Zhu, G. Ma, Y. Cai, Y. Chen, T. Yang, B. Duan and Z. Xue, J. Air Waste Manage. 66[4] (2016) 402-411.
-
- 9. J. Calbo, S. Sorlí, M. Llusar, M.A. Tena and G. Monrós, Brit. Ceram. T. 103[1] (2004) 3-9.
-
- 10. Z. Chen, Y. Du, Z. Li, D. Sun and C. Zhu, Ceram. Int. 41[8] (2015) 9455-9460.
-
- 11. C. Gargori, S.R. Prim, M. LLusar, M.V. Folgueras and G. Monrós, Mater. Lett. 218 (2018) 341-345.
-
- 12. B. Tanisan and S. Turan, J. Ceram. Process Res. 12[4] (2011) 462-467.
- 13. L. Shen, Y. Qiao, Y. Guo and J. Tan, J. Hazard. Mater. 177[1-3] (2010) 495-500.
-
- 14. N. Gurbuz, E. Coskun and E. Ozel, J. Ceram. Process Res. 11[2] (2010) 184-190.
- 15. M. Du, Y. Du, Z. Chen, Z. Li, K. Yang, X. Lv and Y. Feng, Appl. Phys. A. 123[9] (2017) 575.
-
- 16. C. Sun, X. Lu, Y. Chen, L. Zuo and Y. Li, J. Ceram. Process Res. 22[3] (2021) 340-344.
-
- 17. S. Das, A.K. Mukhopadhyay, S. Datta and D. Basu, B. Mater. Sci. 32[1] (2009) 1-13.
-
- 18. J. Liu, B. Liang, Y. Ai, J. Zhang, F. He, W. He and Z. Liu, J. Ceram. Process Res. 22[3] (2021) 296-300.
-
- 19. V.G. Karayannisa, A.K. Moutsatsoub and E.L. Katsikab, J. Ceram. Process Res. 14[1] (2013) 45-50.
- 20. C.Y. Cha and D.S. Kim, Carbon. 39[8] (2001) 1159-1166.
-
- 21. E. Kim, S. Cho and J. Lee, Met. Mater. Int. 15[6] (2009) 1033-1037.
-
- 22. G. Ren, X. Wang, Z. Zhang, B. Zhong, L. Yang and X. Yang, Dyes Pigments. 147 (2017) 24-30.
-
- 23. J. Calbo, C. Gargori, S. Sorli, J. Badenes, M. Tena and G. Monros, Bol. Soc. Esp. Ceram. V. 46[1] (2007) 14-20.
-
- 24. R.M. Khattab, H.E.H. Sadek and A.A. Gaber, Ceram. Int. 43[1] (2017) 234-243.
-
- 25. M. Blosi, M. Dondi, S. Albonetti, G. Baldi, A. Barzanti and C. Zanelli, J. Eur. Ceram. Soc. 29[14] (2009) 2951-2957.
-
- 26. L. Yuan, A. Han, M. Ye, X. Chen, L. Yao and C. Ding, Dyes Pigments. 148 (2018) 137-146.
-
- 27. J. Shen, Y. Li, and J.-H. He, Dyes Pigment.127 (2016) 187-188.
-
- 28. Y. Shi, M. Zhong, Z. Zhang and D. Wang, Ceram. Int. 43[8] (2017) 5979-5983.
-
- 29. V. Rives, M.E. Pérez-Bernal, R.J. Ruano-Casero and I. Nebot-Díaz, J. Eur. Ceram. Soc. 32[5] (2012) 975-987.
-
- 30. S.-P. Lin, K. Fung, Y.-M. Hon and M.-H. Hon, J. Ceram. Soc. Jap. 110[1288] (2002) 1038-1043.
-
- 31. C. Păcurariu, I. Lazău, Z. Ecsedi, R. Lazău, P. Barvinschi and G. Mărginean , J. Eur. Ceram. Soc. 27[2] (2007) 707-710.
-
- 32. G.D. Györgyfalva and I.M. Reaney, J. Mater. Res. 18[6] (2003) 1301-1308.
-
- 33. M. Dondi, C. Zanelli, M. Ardit, G. Cruciani, L. Mantovani, M. Tribaudino and G.B. Andreozzi, Ceram. Int. 39[8] (2013) 9533-9547.
-
- 34. B. Tanisan and M. Dondi, J. Sol-Gel Sci. Techn. 83[3] (2017) 590-595.
-
- 35. S.R. Prim, M.V. Folgueras, M.A. Lima and D. Hotza, J. Hazard. Mater. 192[3] (2011) 1307-1313.
-
 This Article
-
2022; 23(3): 344-349
Published on Jun 30, 2022
- 10.36410/jcpr.2022.23.3.344
- Received on Dec 30, 2021
- Revised on Jan 15, 2022
- Accepted on Jan 25, 2022
Services
- Abstract
introduction
experimental
results and discussion
conclusions
- Acknowledgements
- References
- Full Text PDF
Shared
Correspondence to
- Xiang Zhang
-
he State Key Laboratory of Refractories and Metallurgy, Wuhan University of Science and Technology, Wuhan, 430081, P.R. China
Tel : +86-158-2718-1426 Fax: +86-027-68862529 - E-mail: zx91@wust.edu.cn
Clean-Energy Research Institute(CRI), Hanyang University, 222, Wangsimni-ro, Seongdong-gu, Seoul, 04763, Korea
E-mail: jcpr@hanyang.ac.kr