


- Effect of calcium addition on microstructure and electrical properties of lead zirconate titanate ceramic compositions near MPB
Anupama Sachdevaa,*, Aarushib, Jagneet Kaur Ananda and R. P. Tandonc
aKeshav Mahavidyalaya, University of Delhi, Delhi 110034, India
bDepartment of Electrical Engineering, Texas A&M University, College Station, Texas 77840, USA
cDepartment of Physics and Astrophysics, University of Delhi, Delhi 110007, IndiaThis article is an open access article distributed under the terms of the Creative Commons Attribution Non-Commercial License (http://creativecommons.org/licenses/by-nc/4.0) which permits unrestricted non-commercial use, distribution, and reproduction in any medium, provided the original work is properly cited.
Calcium modified lead zirconate titanate ceramic compositions Pb(1-x)CaxZr0.52Ti0.48O3, where x=0, 0.02, 0.04, 0.06, 0.08, 0.1, have been prepared by solid state reaction method using wet milling. Scanning Electron Microscopy (SEM) studies have been carried out to see the variation in the grain size with calcium addition. A correlation of the dielectric constant and dielectric loss with grain size effect is presented in this paper. A monotonic decrease in the transition temperature along with more diffuseness in paraelectric-ferroelectric phase transition is observed with increasing calcium content. The values of activation energy (Ea) for the samples, calculated for ferroelectric region near phase transition temperature, are found to be in the range of approximately 0.6-1.0 eV which reflects that the main charge carriers responsible for conduction at higher temperatures are oxygen ion vacancies
Keywords: PZT, Perovskite, SEM, Solid state reaction
Lead zirconate titanate (PZT) with general formula PbZrxTi1-xO3 is a promising ceramic material for vast number of commercial applications viz. transducers, actuators, FeRAMs, sensors etc. in its bulk as well as thin and thick film forms because of its excellent dielectric, piezoelectric and ferroelectric properties [1-4]. It belongs to the family of perovskites with ABO3 structure. Being a solid solution of lead zirconate (PbZrO3) and lead titanate (PbTiO3), different Zr/Ti ratios result into different compositions of PZT having different structural and electrical properties. It is reported [5] to have ferroelectric phases: tetragonal phase in Ti-rich side and rhombohedral phase in Zr-rich side of the binary system. The boundary between these two phases is called morphotropic phase boundary (MPB). PZT compositions specifically near MPB have always kept researchers motivated (Zr/Ti=52/48) to perform more studies due to their extraordinary dielectric and electro- mechanical properties [5-7].
Besides altering Zr/Ti ratio, the properties of PZT ceramics can also be tailored by using various modifiers. Modified PZT composition are widely being studied and used for specific applications. Acceptor, donor and isovalent additives have been in use as modifiers which can replace the atoms at A- or B-sites of ABO3 structure resulting in new compositions [8, 9]. The materials called hard PZT materials can be obtained by using acceptor additives such as Na+ or K+ which replace Pb+2, or Fe+3 that substitutes for Zr+4. Donor additives with the cations such as Nd+3 or La+3 substituting for Pb+2, or Nb+5 replacing Zr+4 in PZT perovskite structure produce compositions called soft PZT materials. Isovalent additives with substituting ions e.g., Ba+2, Ca+2, Mg+2 or Sr+2 having same valency as that of Pb+2 or Sn+4 which is isovalent to Zr+4 are being used for producing materials with specific properties. Modification using Ca+2 or Sr+2 has been reported to enhance dielectric and electromechanical response in PZT-based ceramics [8-12].
According to various research papers available on the effect of calcium addition in lead titanate ceramics, the addition of calcium has shown improved electrical properties of the resulting material [13-15]. In view of comparatively lesser number similar reports on calcium modified PZT compositions specifically near MPB, we have carried out the present work. We are studying the effect of calcium addition on microstructure and elec- trical properties of PZT ceramic compositions with Zr/Ti=52/48 prepared via solid state reaction method using wet milling. Scanning Electron Microscopy (SEM), dielectric and ac conductivity studies have been performed on the prepared samples. A correlation of dielectric properties of the samples with their microstructure and grain size effect is observed and presented.
Synthesis by solid state reaction method
Synthesis of Pb(1-x)CaxZr0.52Ti0.48O3 ceramic composi- tions (where x=0, 0.02, 0.04, 0.06, 0.08, 0.1) with titular representation as APC0 (unmodified or pure PZT composition), APC2, APC4, APC6, APC8 and APC10 respectively was done by solid state reaction method using wet milling, the detailed process has been communicated elsewhere. Briefly, high purity lead (II) oxide (PbO) with 5 mol% extra PbO, zirconium (IV) oxide (ZrO2), titanium (IV) oxide (TiO2) and calcium carbonate (CaCO3) were weighed accurately as per stoichiometry requirements for the respective com- positions and were mixed thoroughly. The mixture was ball milled in a high energy ball mill for 5 h using isopropanol as a wet milling agent. Oven dried ball milled powders were calcined at 850 ⁰C and 900 ⁰C in continuation for two hours each. Calcined powders of each composition were mixed with polyvinyl alcohol (PVA) binder and were uniaxially cold pressed into pellets by applying pressure of ~40 MPa. Sintering of pellets was done for two hours at 1250 ⁰C in enclosed alumina crucibles.
Characterization
Density of the samples has been measured using Archemedes principle at room temperature taking water as the medium. Density values of all the samples are found to be more than 95% of the reported density (~7.95 g/cm3) of pure PZT [16]. X-ray powder diffrac- tometer (Philips, PW 1830 generator) with CuKα radia- tion (λ = 1.5405 Å) in the range of Bragg angles 2θ (20⁰ ≤ 2θ ≤ 70⁰) was used to carry out phase formation in calcined powders.
The surface morphology of sintered and gold coated samples was studied at room temperature using scanning electron microscopy (SEM) (ZEISS Model-MA 15).
For electrical characterization, both sides of the sintered pellets were gold sputtered using Desk ΙΙ TSC Cold Sputter/ Etch Unit for making the electrodes. Precision Impedence Analyzer (Wayne Kerr-6500B Series) was used to study the frequency and tempera- ture dependence of dielectric constant (at different frequencies ranging from 100 Hz to 1 MHz).
X-Ray diffraction studies
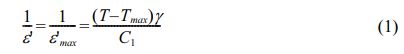
The XRD patterns of calcined powders of pure and calcium modified compositions as shown in Fig. 1, are found to be sharp with distinct single diffraction peaks which indicates homogeneity and good crystallization of the calcined powders. These samples have perovskite phase without any secondary or pyrochlore phase. This shows the complete diffusion of calcium into PZT lattice for each studied composition.
SEM analysis
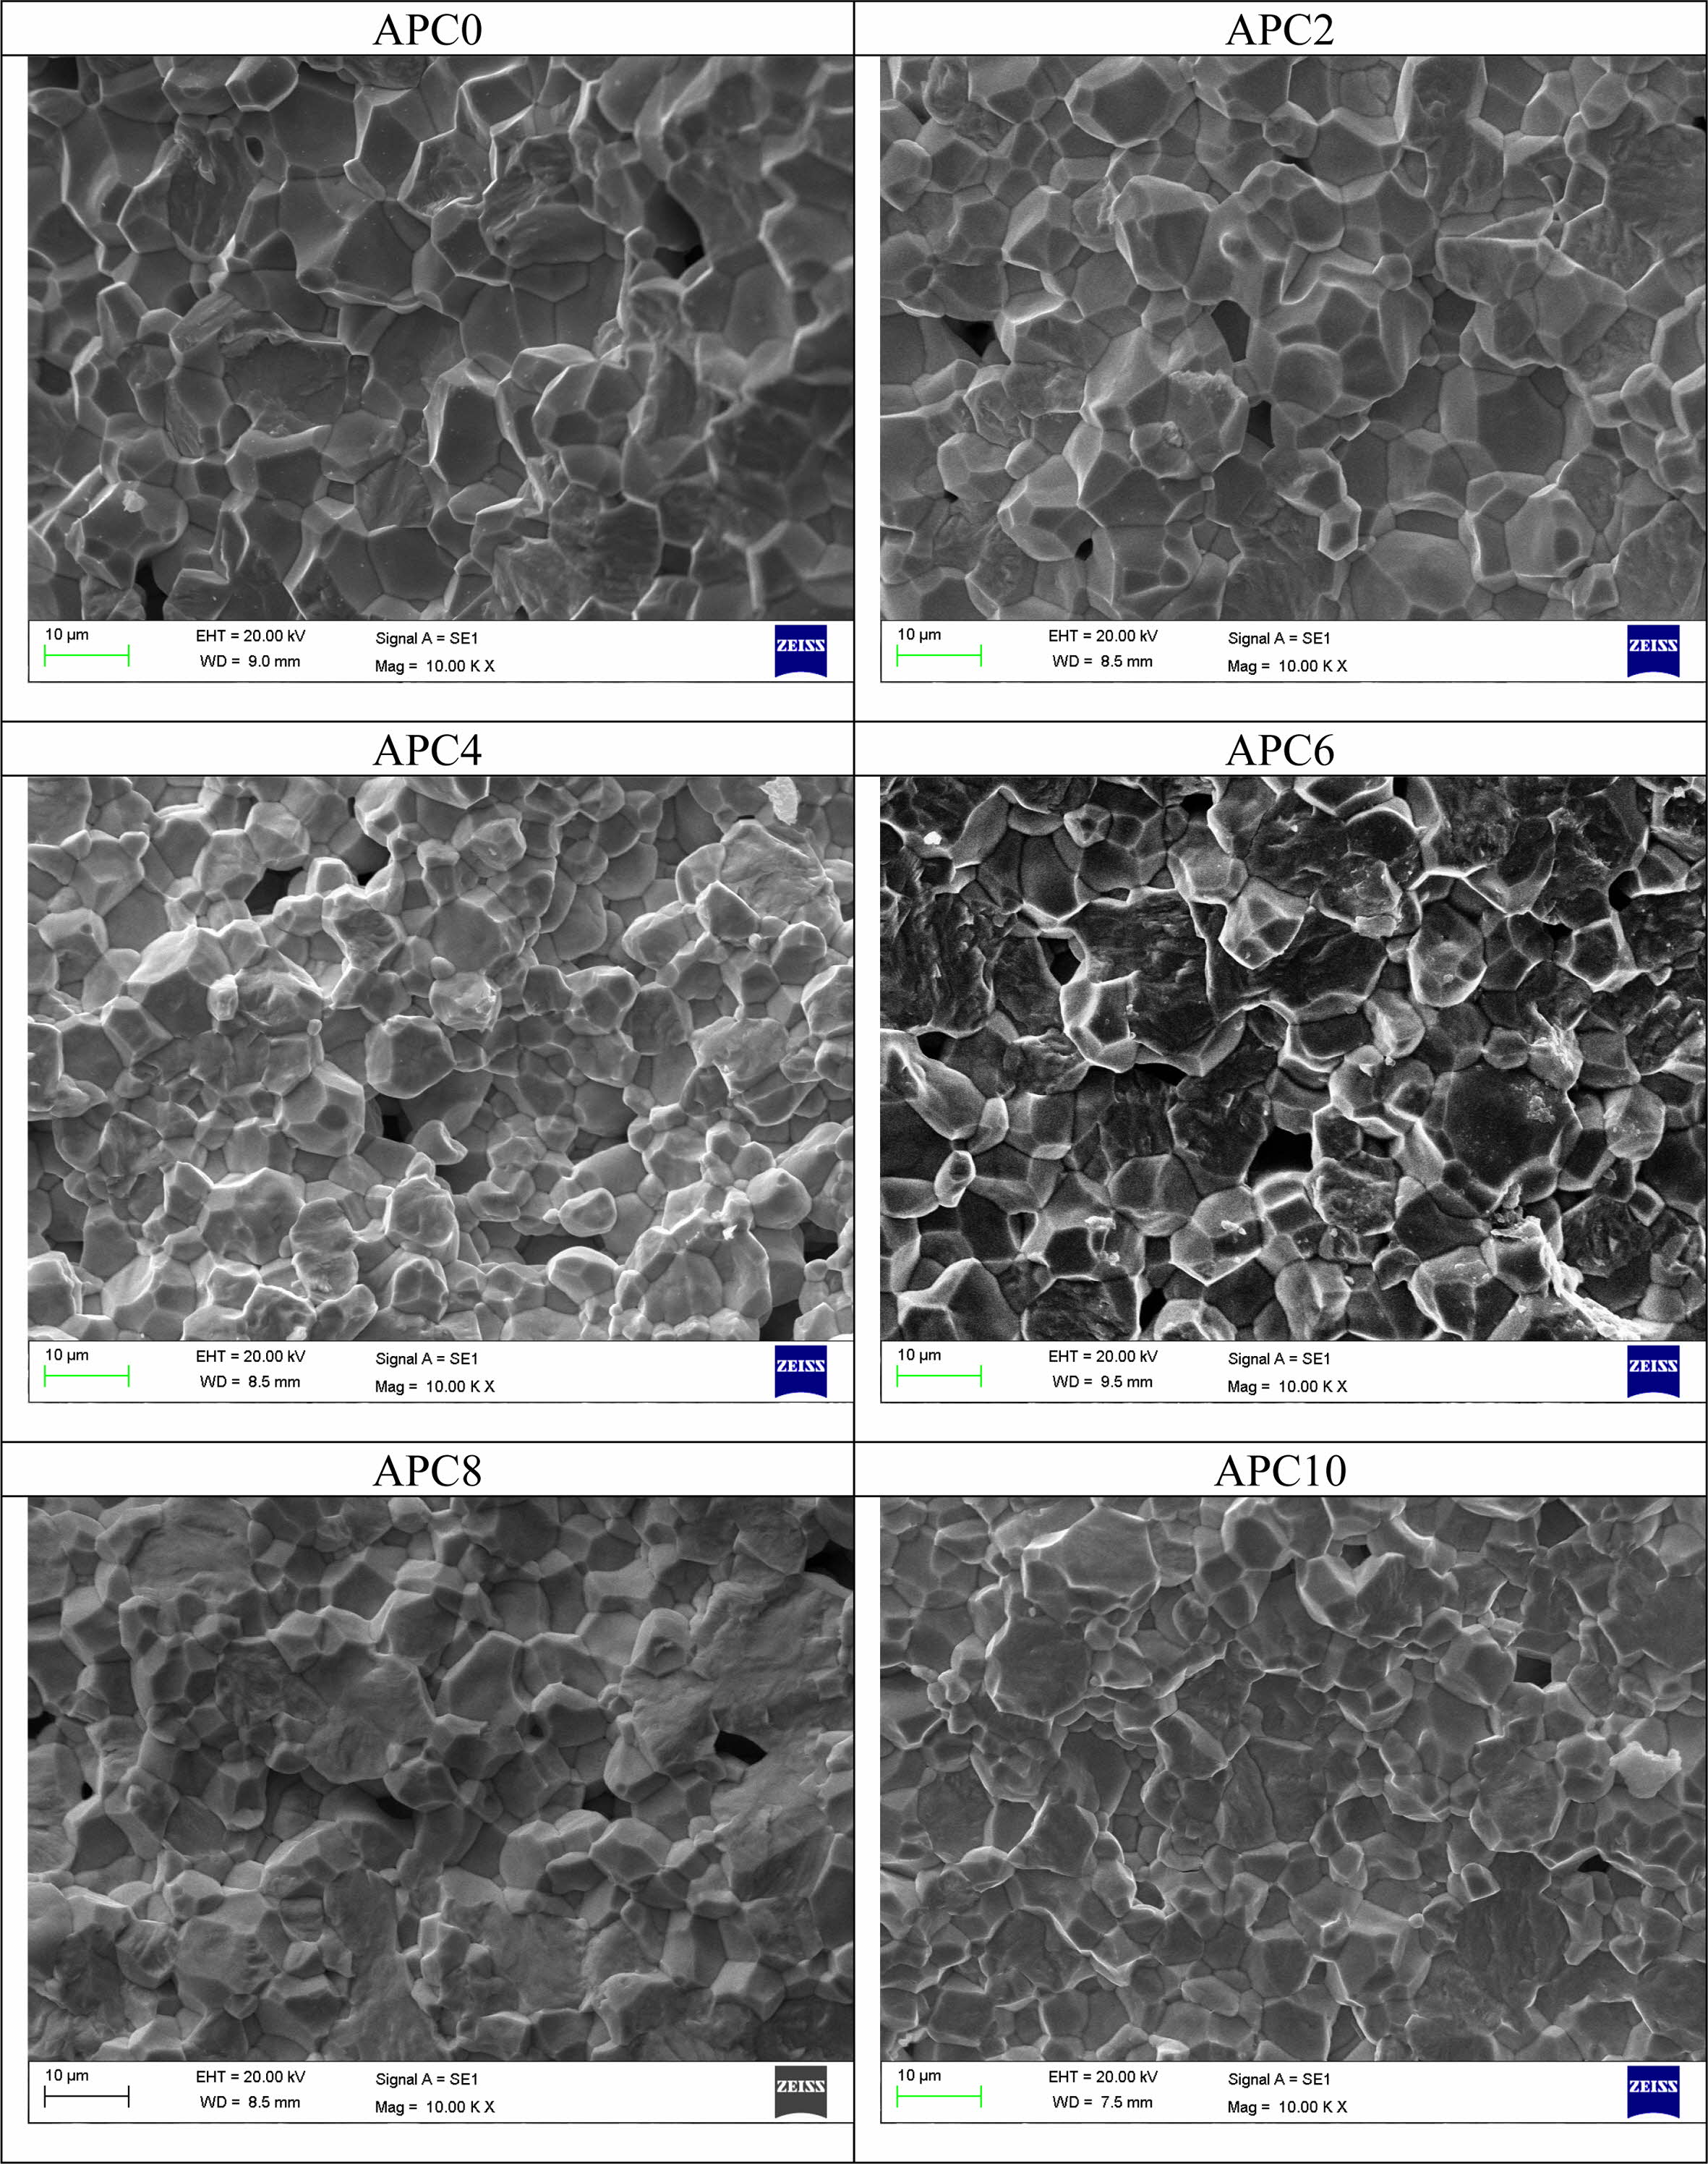
The SEM micrographs of pure and calcium modified PZT are shown in Fig. 2. A comparative study has been carried out by keeping the magnification the same. Most of the grains are in honeycomb shape and are compactly arranged through the entire surface of the samples. The size of the grains is measured using ‘ImageJ’ software.
The effect of calcium content on microstructure of PZT ceramics is summarized as follows:
• Grain size decreases from 10-15 µm for unmodified sample (APC0) to 5-11 µm for 10 mol% calcium modified (APC10) sample. Table 1 lists the size range of the grains for all the samples of APC series.
The reason for the overall decreasing trend of grain size with increasing calcium content can be attributed to segregation of calcium at the grain boundaries [12].
• Variation in the grain size increases with increasing calcium content.
• The porosity is seen to increase with increasing calcium content up to 6 mol% while the microstruc- ture seems to be denser for the samples with 8 mol% and 10 mol% calcium concentrations.
• Diffusion of grains is seen for the samples APC6, APC8 and APC10.
Electrical Characterization
Dielectric properties
The effect of calcium substitution on dielectric properties of the samples along with the possible explanations is summarized as follows:
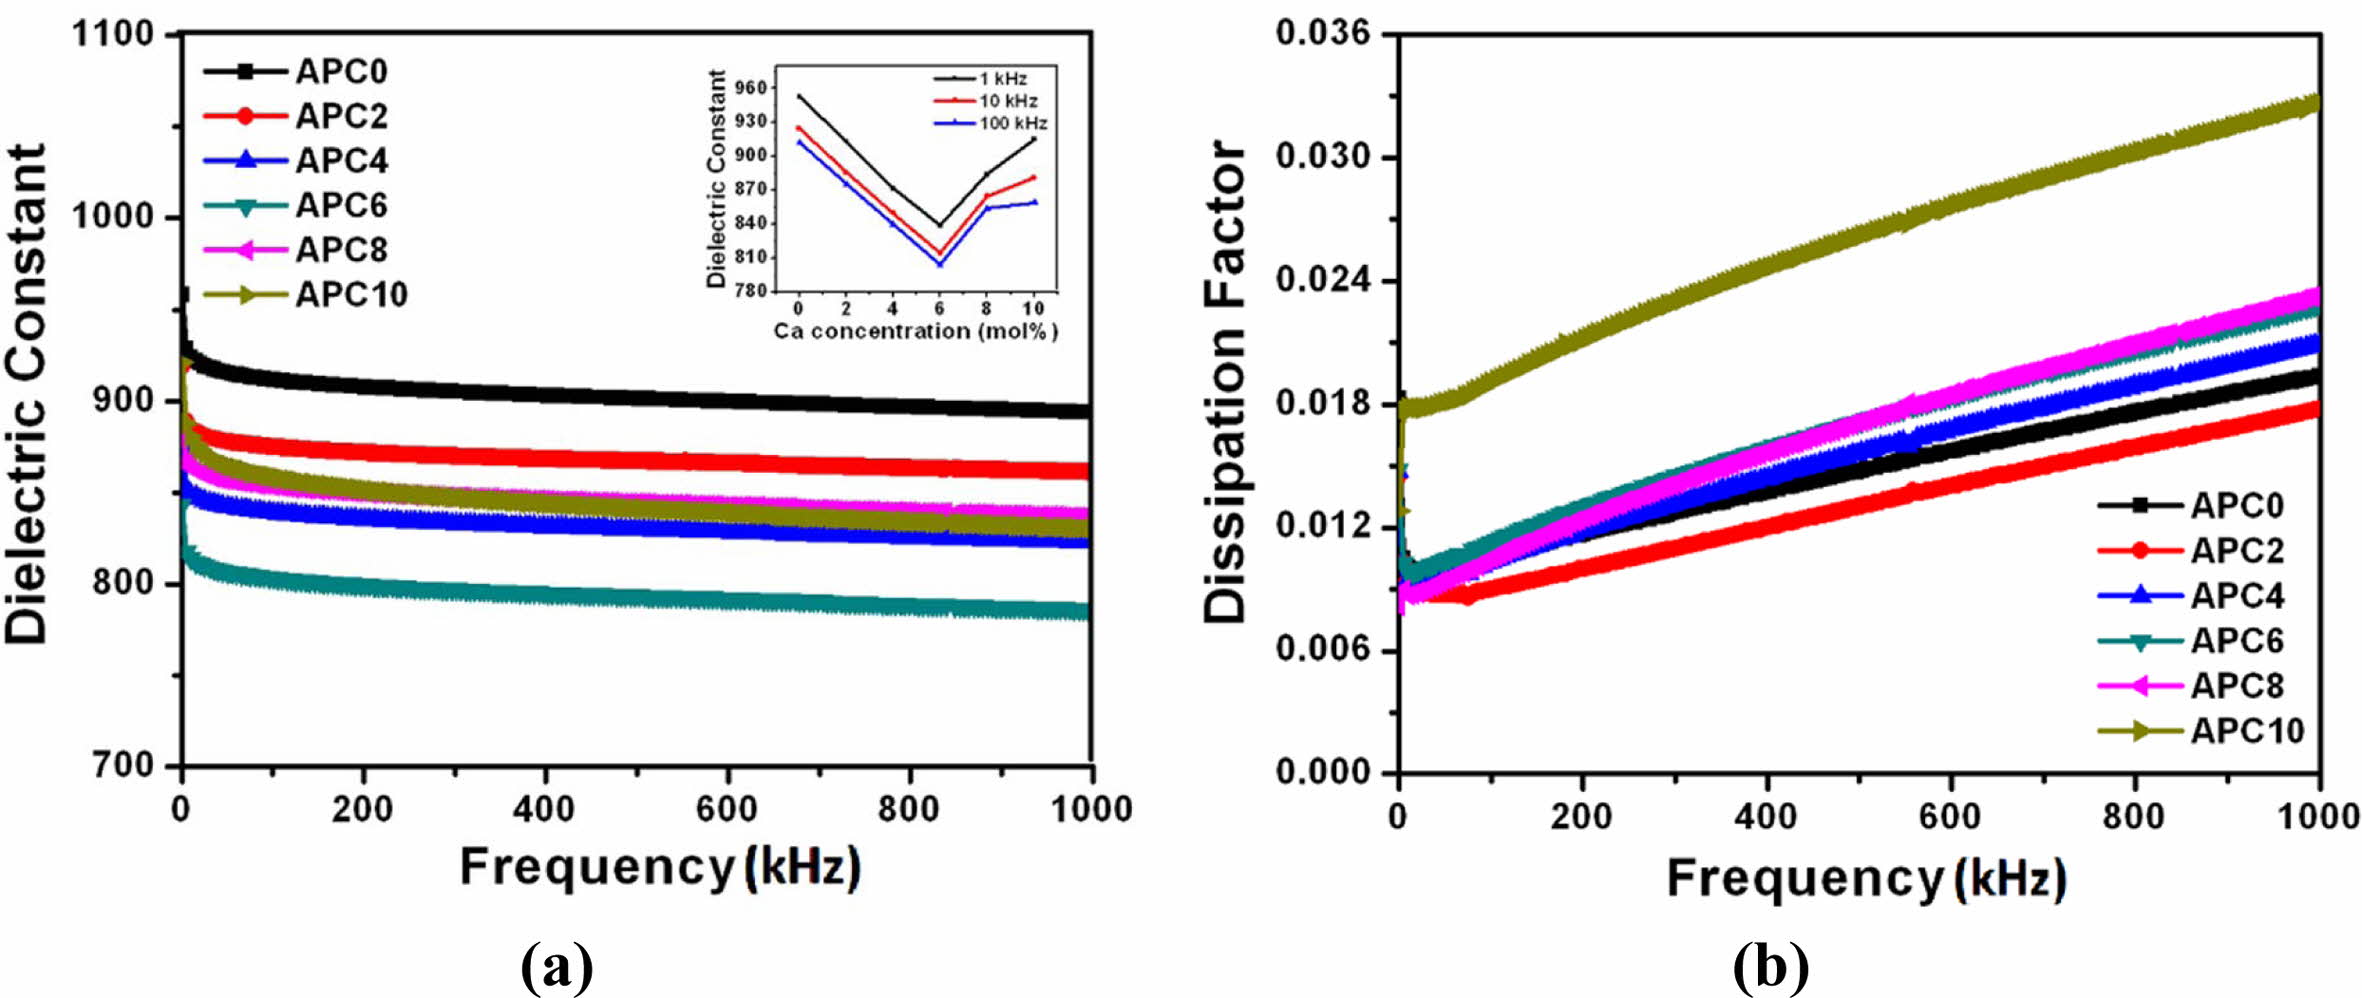
• The variation of dielectric constant (ε′) and dielectric loss tangent or dissipation factor (tand) at room temperature with frequency for pure and calcium modified PZT ceramics are shown in Figs. 3 (a) and (b).
It may be noted that in all the samples there is a decrease in the dielectric constant with increasing frequency. This frequency dispersion behavior of dielectric constant is characteristic of ferroelectric materials [17].
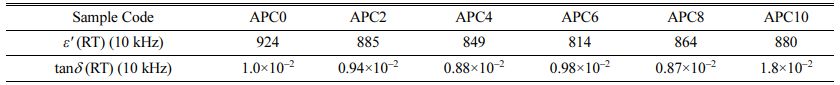
• The values of ε′ and tand corresponding to frequency 10 kHz for the samples at room temperature are given in Table 2. The value of ε′ decreases with increasing calcium content up to 6 mol % and then increases for the samples with 8 and 10 mol% calcium concentrations as also depicted in the inset of Fig. 3(a).
This may broadly be explained by scanning electron micrographs (Fig. 2) which show that with increasing calcium content up to 6 mol%, porosity increases while with further increase of calcium content the samples exhibit denser microstructure.
Also, in bulk ferroelectric ceramics, the room tem- perature dielectric response is reported to be due to an interplay of intrinsic (i.e., lattice linked response) and extrinsic contributions (which originate from domain wall motion, phase boundary and space charge etc.) [17, 18]. In PZT based ceramics both intrinsic and extrinsic contributions are influenced by the grain size variations [17-21]. In small grains, the intrinsic effects become more pronounced because of internal stresses and the depolarizing field, while the extrinsic effects get reduced due to decrease in domain wall density. In large grains, extrinsic contributions become more significant than intrinsic contributions because in larger grains the internal stresses and depolarizing fields are compensated by the formation of domain wall structures [21]. As the domain formation is suppressed in small grain size ceramics, the remaining stress increases with decreasing grain size and hence leads to the deformation of the crystal structure [21, 22].
So, the addition of calcium clearly has following impacts:
- Reduction of grain size
- Shifting of phase boundary by changing the unit cell structure
- Increase in defect density
For unmodified sample, most of the grains are large in size as shown in Fig. 2. Therefore, they contain large number of domains and hence large number of domain walls. Large number of domains are responsible for large dielectric constant while dielectric loss is because of the motion of domain walls. For the observed trend in the values of ε′ for our samples at room temperature, we suggest that the extrinsic contributions are more pronounced in the samples with calcium content up to 6 mol%. With further decrease in the grain size, i.e., in case of APC8 and APC10 samples, the effect of internal stress becomes more marked over domain wall motion which causes an increase in the value of the room temperature dielectric constant. As far as the observed trend in the values of tand at room temperature for our samples is concerned, it can be explained on the basis of two factors viz. reduced domain wall density and increased defect density as a result of increasing calcium content. As the calcium concentration is increasing in the samples, although domain wall density reduces while the interaction between the defects and domain walls which constrains the domain wall motion, i.e., ‘pinning’ increases. This results in the reduction of tand for the samples up to 4 mol% calcium concentrations. Beyond this composition, i.e., for APC6. APC8 and APC10 compositions, there is significant reduction in domain wall density such that not many domain wall structures are available for interaction with defects, i.e., pinning gets reduced drastically in these compositions thereby increasing the dielectric loss in the samples.
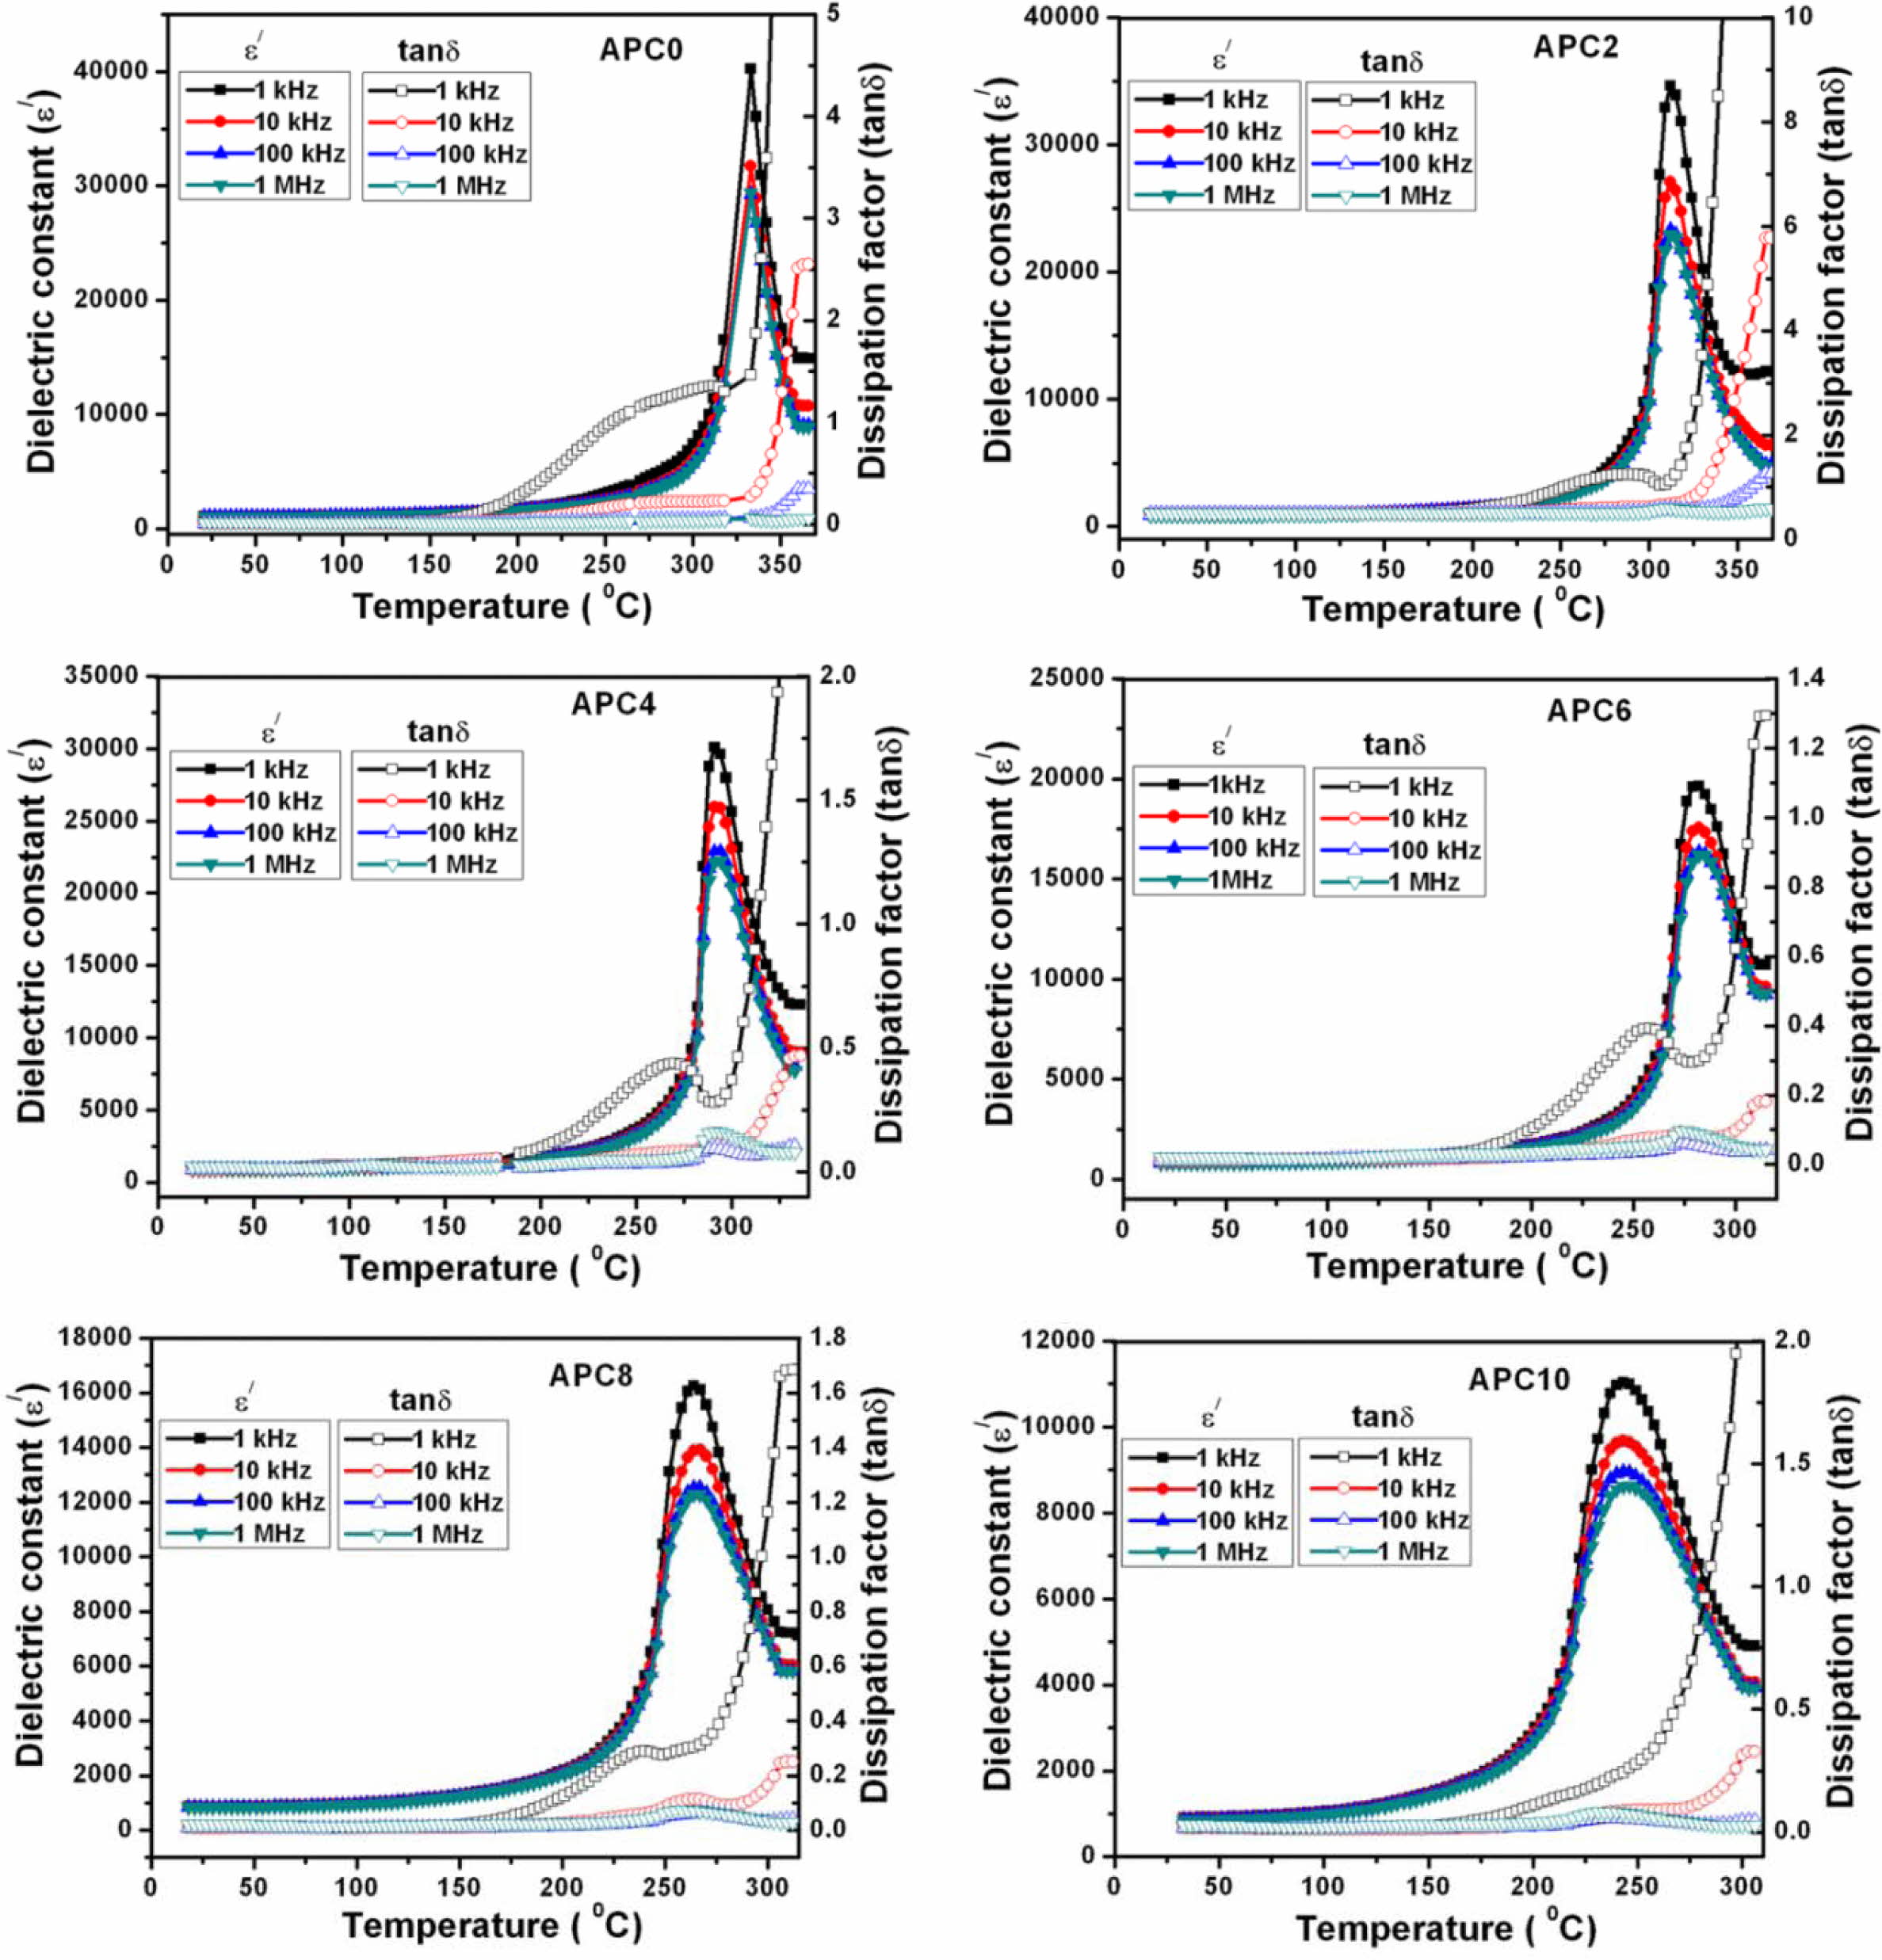
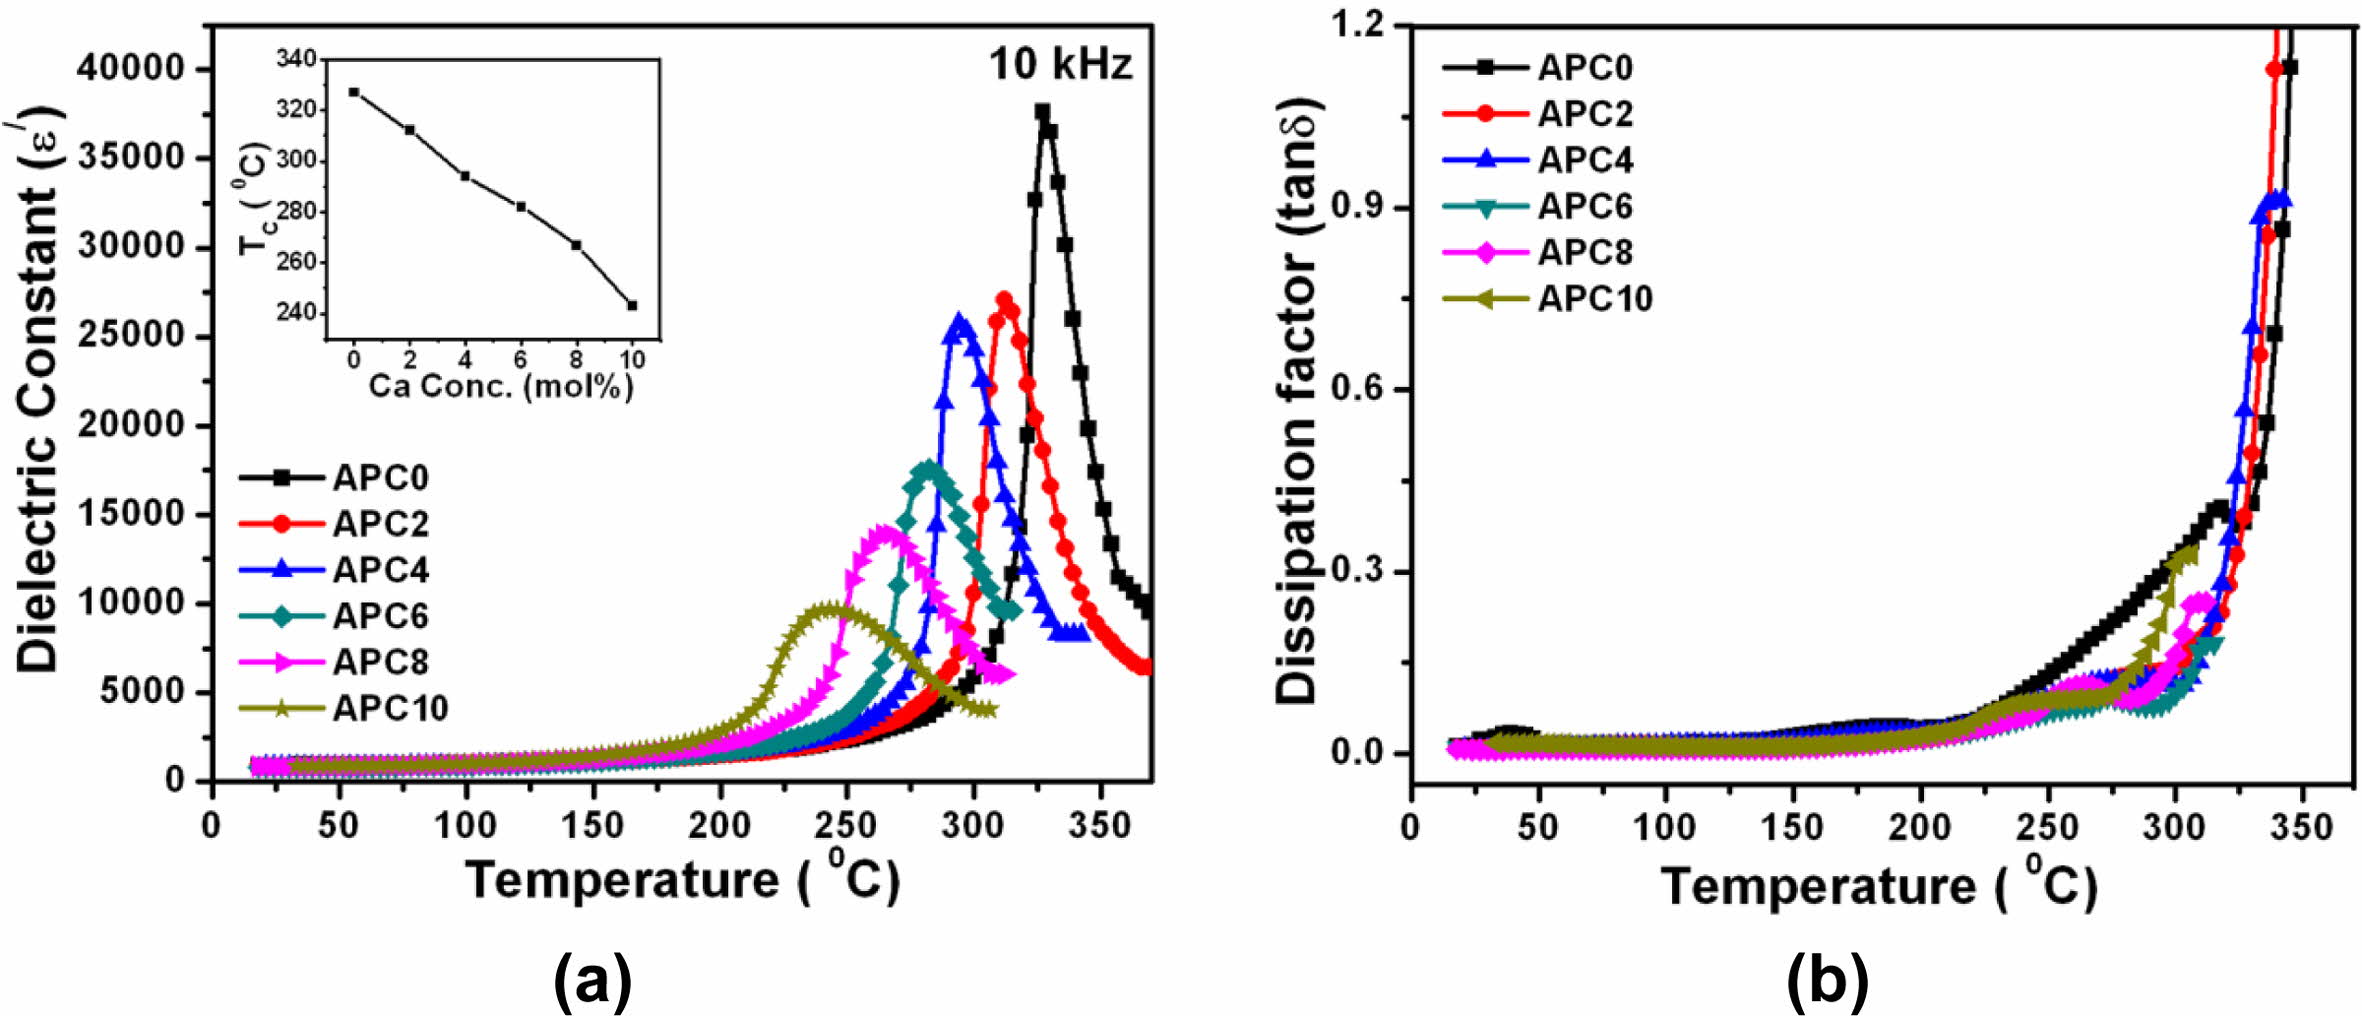
Fig. 4 shows the variation of ε' and tand with tem- perature at different frequencies for all the compositions. The dielectric constant maxima corresponding to ferro- electric-paraelectric phase transition gets broadened with increasing calcium. This indicates that the ferroelectric-paraelectric phase transition for calcium modified ceramics is of diffuse-type. The observed broadening or diffuseness in dielectric constant vs. temperature plot can be ascribed to the distribution of transition temperature for individual grains [23-26].
The degree of diffuseness in the observed variation of dielectric constant called diffusivity (g) can be estimated using modified Curie-Weiss relation [27, 28]:
where C1 and Tmax are the Curie-Weiss-like constant and the temperature corresponding to the dielectric maximum respectively. The mean value of g is assessed from ln(1⁄ε ' - 1⁄ε 'max) versus ln(T - Tmax) plot (depicted in Fig. 5 for frequency 10 kHz).
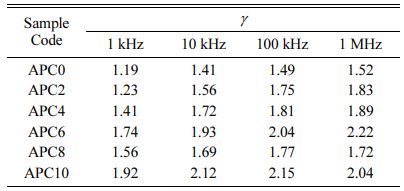
Although for diffuse phase transitions, no sharp transition temperature is observed, but for convenience, the term TC will be used in place of Tmax for further discussion. The limiting value of g is (a) 1 for normal ferroelectrics which reduces the equation (1) to Curie-Weiss law and (b) 2 for an ideal relaxor ferroelectric [27]. Also, its value is reported to increase with decreasing grain size and increasing frequency [29]. The value of g for all prepared compositions, calculated at various frequencies and listed in Table 3, shows an increasing trend with increasing calcium content.
A careful examination of the data also shows that TC is insensitive to the change in frequency for the samples APC0 (unmodified) and APC2 which indicates that these samples have no relaxor properties. The samples APC4, APC6, APC8 and APC10 however, show sensitivity of TC with frequency i.e., TC tends to shift right to slightly higher value with increasing frequency. So, the compositions APC4, APC6, APC8 and APC10 show weak relaxor behavior. We can therefore, infer that there is a transition from normal ferroelectric (FE) to relaxor ferroelectric (RFE) behavior from APC2 to APC4. Also, we observe that APC6 sample exhibits the strongest relaxor behavior in the studied composition and frequency range. This can also be confirmed by the diffusivity values given in Table 3. The diffusivity at a given frequency increases with calcium content up to 6 mol%, then decreases for APC8 and again increases for APC10. The possible explanation for this in our samples is that there is onset of relaxor behavior at 4 mol% calcium content which becomes stronger for APC6 and goes weaker for APC8 and APC10 compositions. The higher value of g for APC10 composition may be because of the large variation in the grain sizes. The detailed study is, however, required to confirm this on PZT compositions with intermediate as well as higher calcium contents.
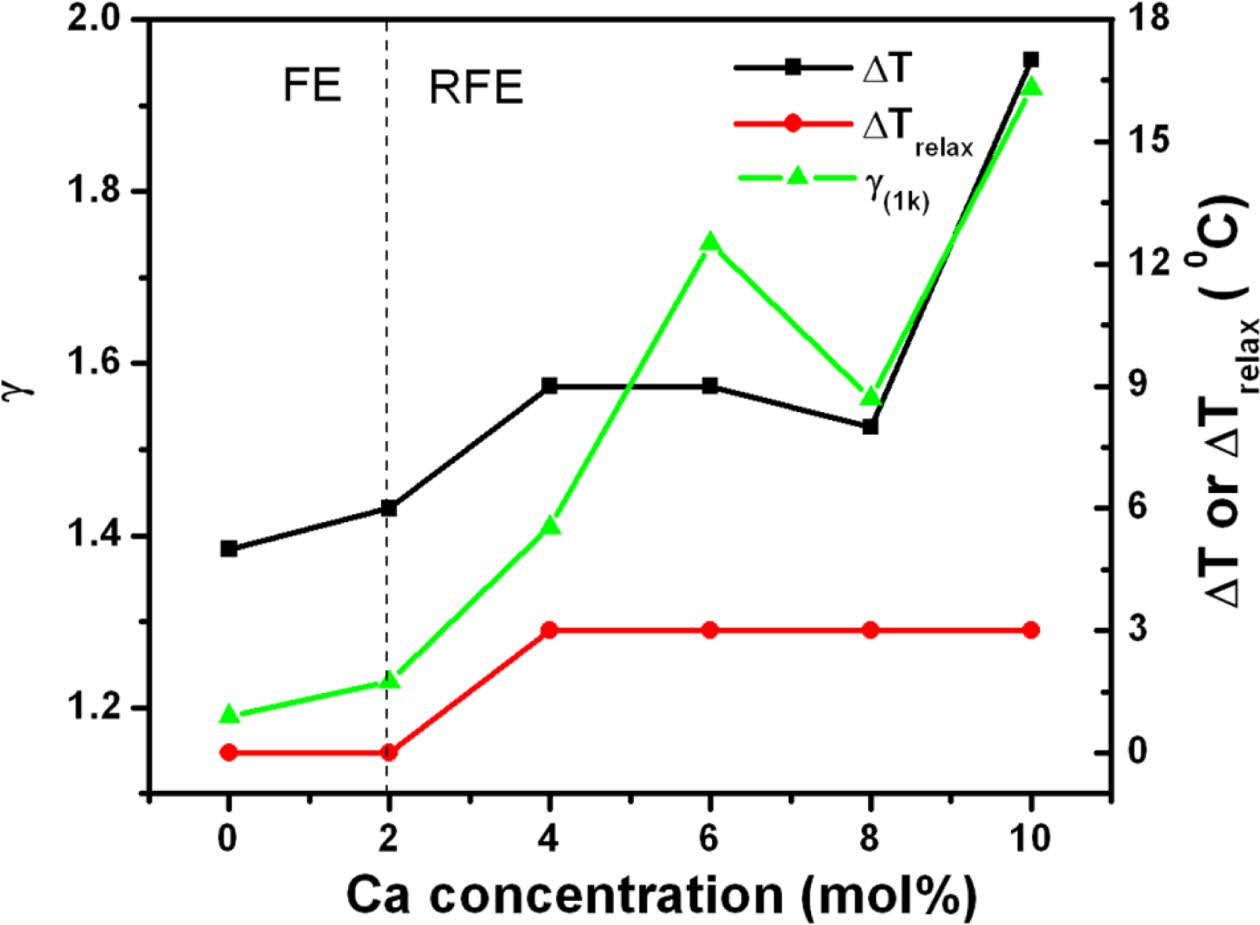
Equations (2) and (3) respectively relate the diffuse- ness of phase transition to the temperature width ∆T and the degree of relaxation behavior to ∆Trelax [30, 31]:
where ε 'max and T0.9ε' (max) are the maximum ε ' and temperature corresponding to90% of ε 'max for T > Tmax, respectively. Using equations (1-3), the variation of g, ∆T and ∆Trelax vs. calcium concentration has been plotted in Fig. 6.
Fig. 7(a) displays the temperature dependence of ε′ at 10 kHz for all the compositions studied in the present paper.
The transition temperature (TC) decreases monotoni- cally with increasing calcium content and is shown in the inset of Fig. 7(a). The decline in the TC value may also be attributed to the rising internal stress with decreasing grain size due to increasing calcium content [21].
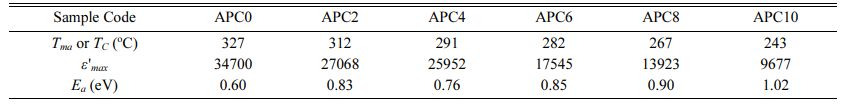
The temperature dependence of tand for all the prepared samples at 10 kHz depicted in Fig. 7(b) indicate that the values of tand and its variation with temperature are small for the temperatures below TC. Beyond TC, its values display a significant increase which is attributed to the existence of space charge polarization in the materials [25, 26]. However, with increasing frequency, the increase in the value of tand near TC becomes less prominent for the given materials. Table 4 provides the values of Tc and ε 'max at 10 kHz.
AC conductivity studies
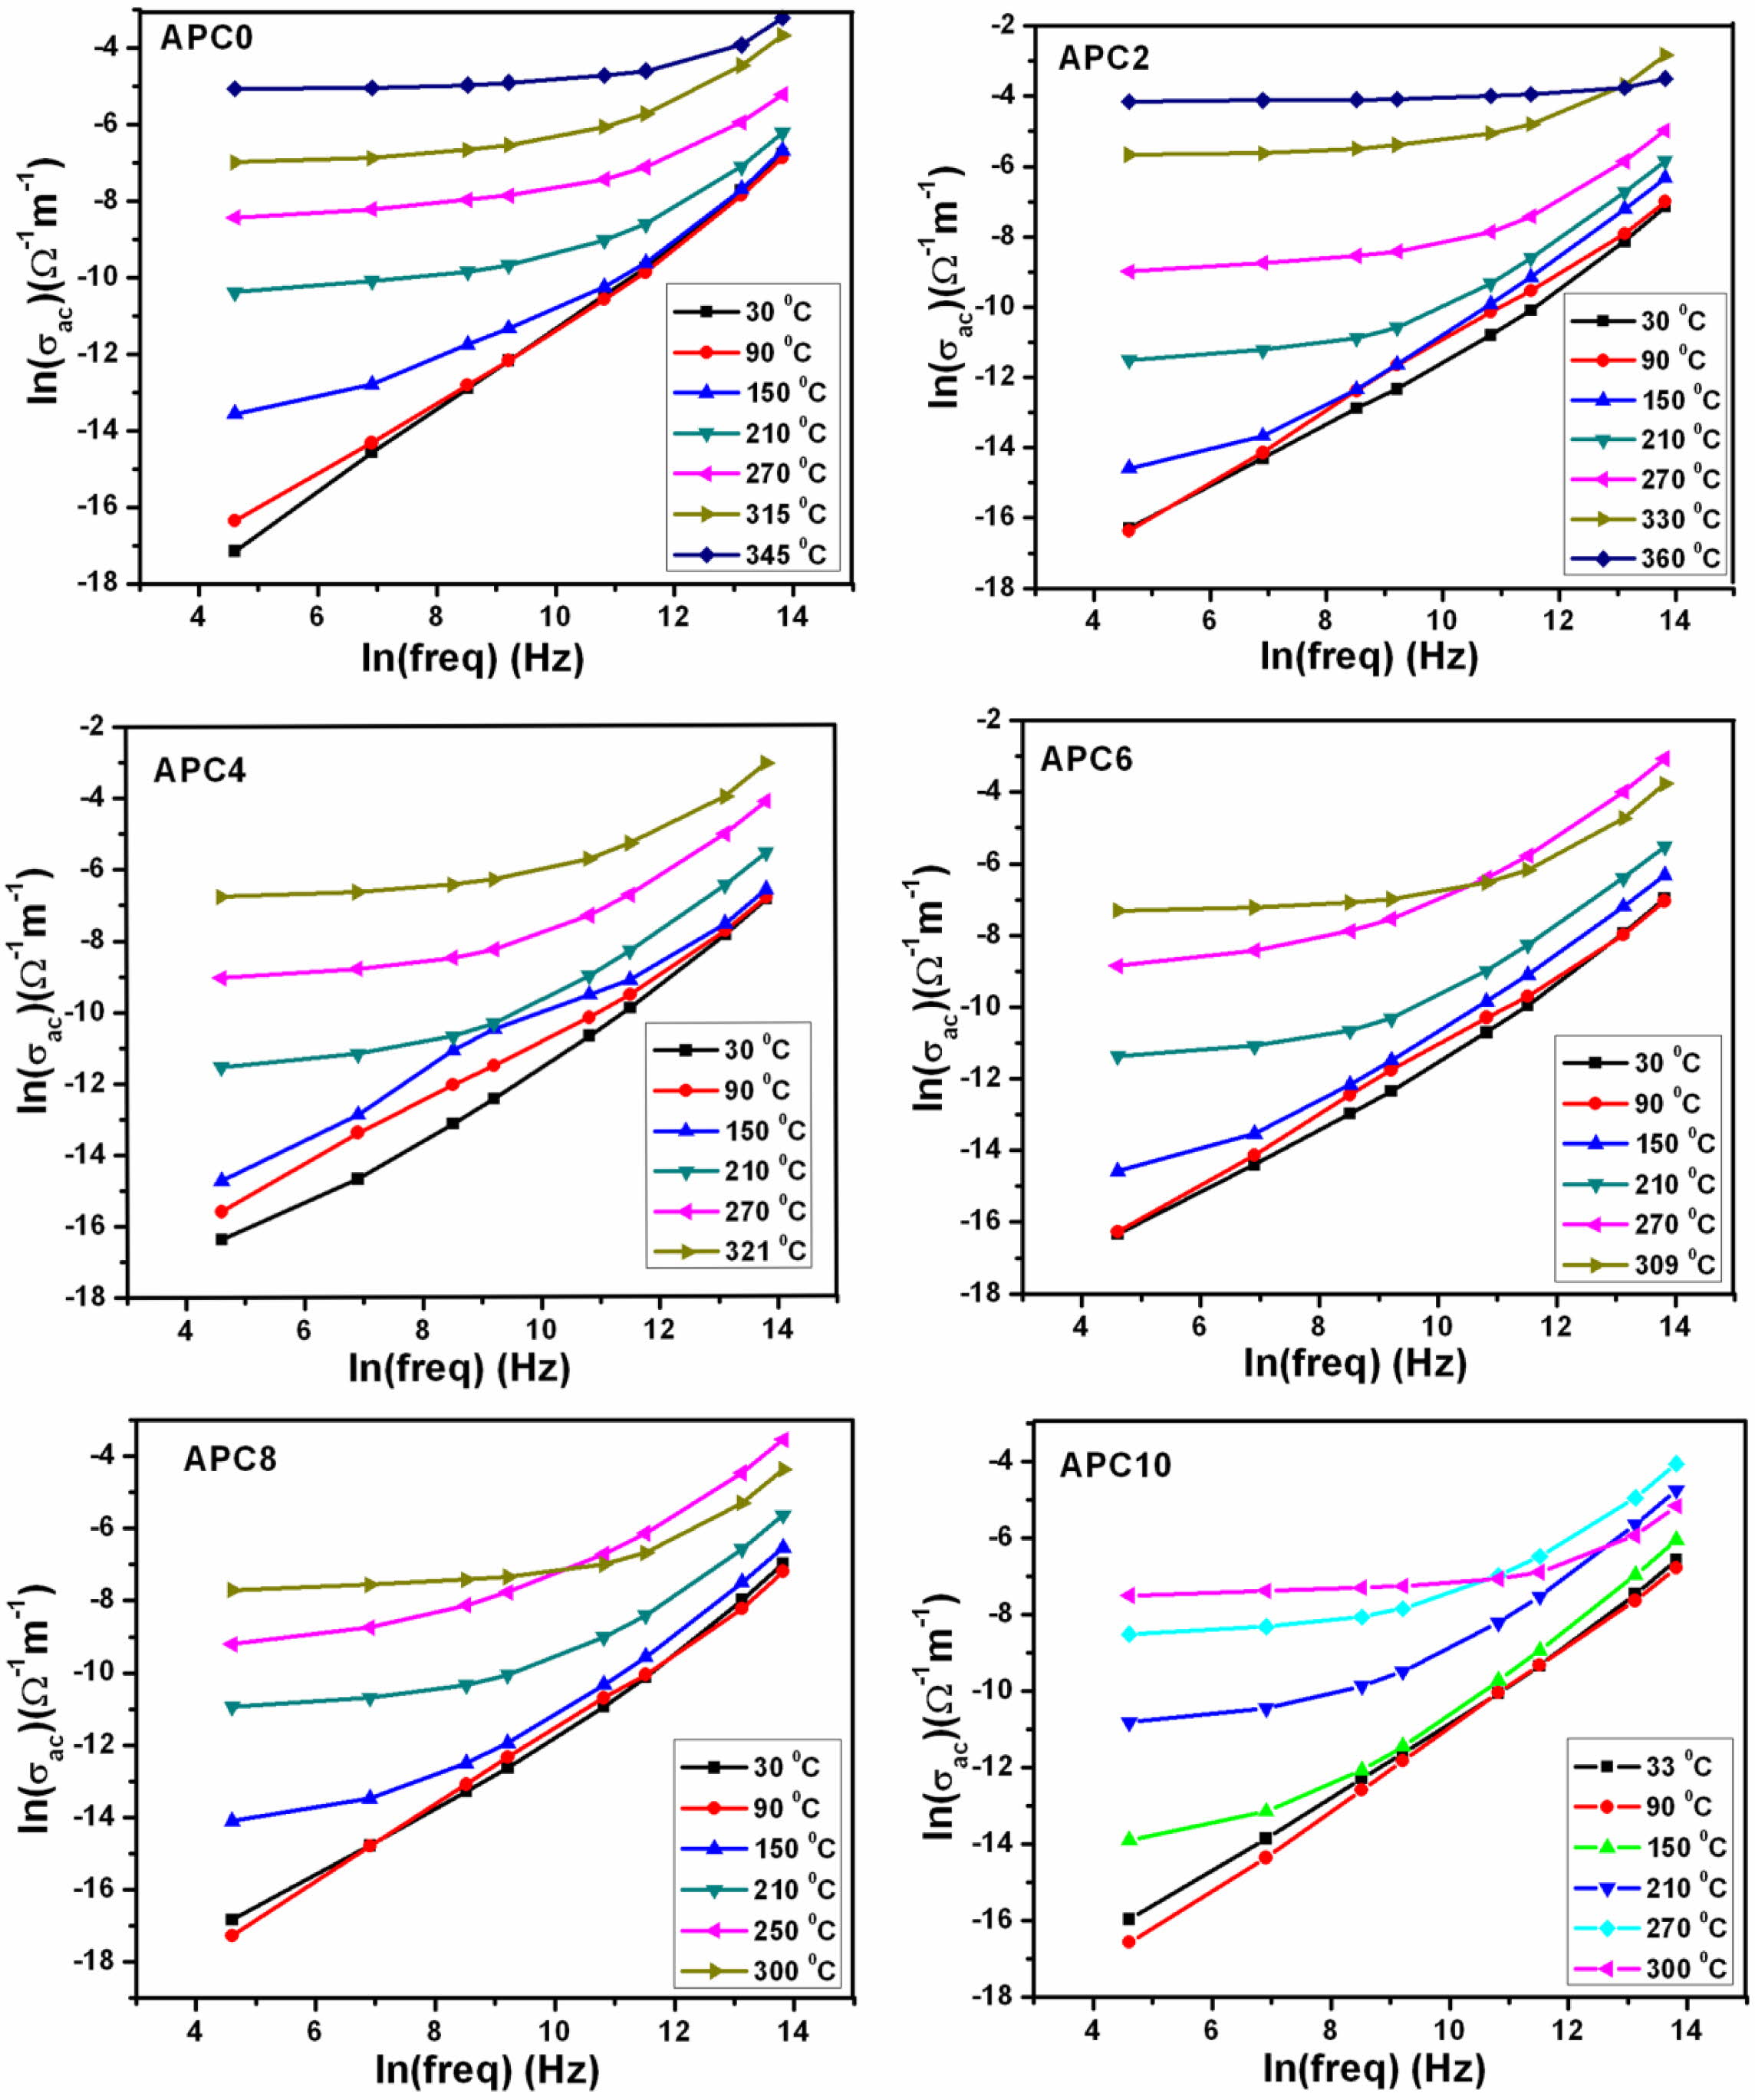
Fig. 8 depicts the frequency dependence of ac con- ductivity (σac) of ceramics of APC series at different temperatures. For a given temperature, frequency de- pendence behavior of ac conductivity can be explained by the Jonscher power law:

where σac is the dc (or very low frequency) conductivity, A is a constant for given temperature and the exponent n is reported to lie in the range 0 < n < 1 [32]. With increase in temperature, the increase in σac for all the samples is noted. At higher temperatures, conductivity spectrum displays a frequency independent or plateau region at lower frequencies and dispersive region at higher frequencies. The plateau region of ac conductivity that broadens with rise in temperatures suggests that the dc conduction process is becoming more dominant with increasing temperature. This also implies that con- ductivity at higher temperatures is primarily activated by increasing the temperature itself [33].
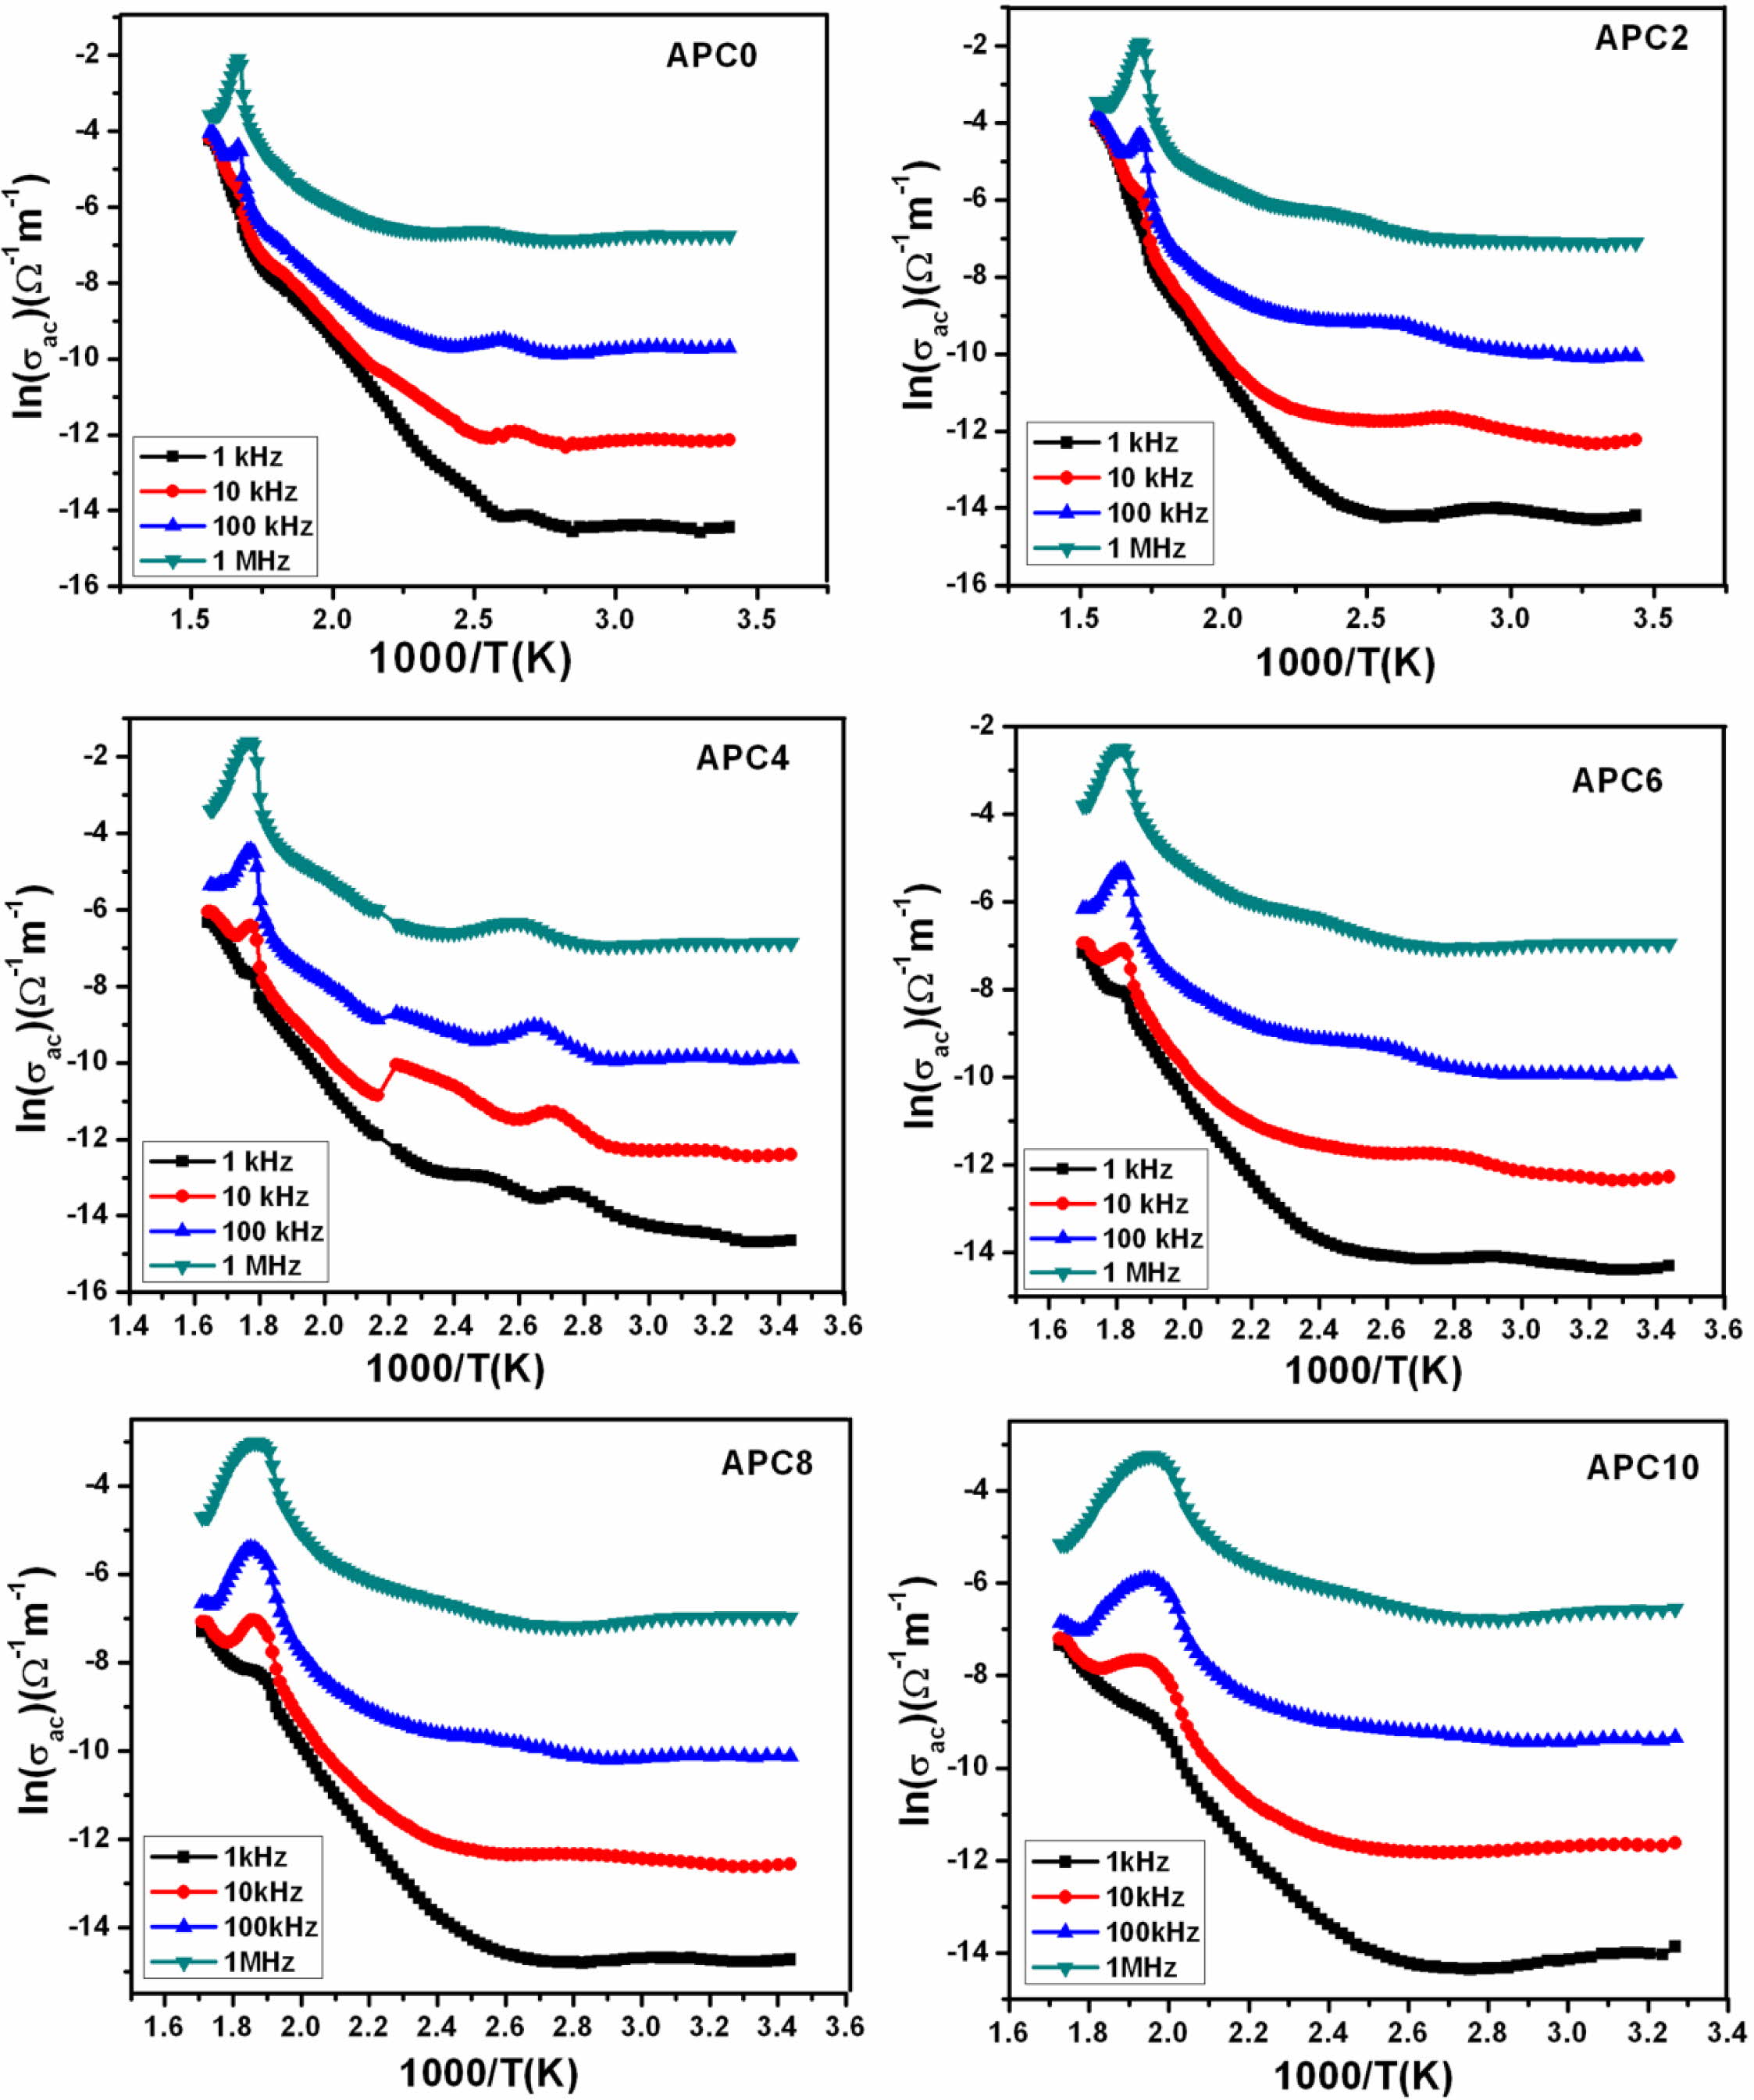
The temperature dependence of ac conductivity can be explained by Arrhenius formula:
where Ea and k are the activation energy and the Boltzmann constant respectively. Lower values of acti- vation energy imply higher conductivity. For dielectric materials higher conductivity is detrimental to its dielec- tric properties. In case of Pb-based ferroelectrics, in the high temperature regions, the reasons for conduction process have been linked to the electro-migration of singly and doubly ionized oxygen vacancies and hopping electrons between Ti+4 and Ti+3 ions which are the two localized states of titanium [34,3 5]. The Ea values associated with singly ionized oxygen vacancies are reported to be in the range 0.3 eV-0.4 eV and with doubly ionized oxygen vacancies in the range 0.6 eV-1.2 eV [35, 36]. Also, low value of Ea has been attributed to high concentration of oxygen vacancies and vice versa [37].
Fig. 9 shows the curves plotted between ln(σac) and 1000/T for all the studied compositions.
The Ea values are calculated for all the prepared compositions from the slope of ln(σac) vs. 1000/T curves near transition temperature in the ferroelectric region for the frequency 10 kHz and are listed in Table 4. The values are observed to lie in the range 0.6 eV-1.02 eV which are consistent with the reported values associated with the movement of doubly ionized oxygen vacancies. We therefore, infer that the main cause for conductivity, for our samples in the mentioned tem- perature zone, is the electro-migration of doubly ionized oxygen vacancies.
The values of Ea calculated at 10 kHz for modified samples are greater than that for unmodified i.e., APC0 sample in studied temperature range. In general, this increase in Ea with increasing calcium addition has been attributed to the reduction in grain size. The decrease in grain size impedes the short-range hopping of oxygen vacancies and hence enhances Ea [38, 39]. Regarding higher value of Ea for APC2 than that for APC4, we relate the observed trend of Ea with transition of normal FE to RFE from APC2 to APC4. It is reported in literature that the ferroelectric materials showing relaxor behavior possess higher degree of structural disorder and lattice defects which promote the formation of polar nano regions [39-42]. At higher temperatures, these defects contribute to increased conductivity and hence lower Ea [38, 40]. In APC2 sample that shows normal FE behavior, at higher tem- perature, grain size effect seems to determine Ea. While in the case of samples with calcium content higher than 2 mol% which show weak relaxor behavior, the observed trend in Ea can be explained on the basis of the combined effect of (a) decreased grain size and hence decreased concentration of oxygen vacancies leading to higher Ea and (b) greater structural disorder and lattice defects which tend to increase the conductivity at higher temperature and hence decreases Ea. Also, since the samples APC4, APC6, APC8 and APC10 show weak relaxor behavior, the main charge carriers responsible for conduction at higher temperatures are oxygen ion vacancies.
|
Fig. 1 XRD patterns of pure and calcium modified PZT (Pb(1- x)CaxZr0.52Ti0.48O3) calcined powders (calcined at 850 ⁰C and 900 ⁰C in continuation for two hours each). |
|
Fig. 2 SEM micrographs of ceramics of APC Series |
|
Fig. 3 (a) Frequency dependence of ε' at room temperature for the ceramics of APC Series (Inset Fig. 3(a): Variation of ε′ with calcium concentration at various frequencies) (b) Frequency dependence of tan at room temperature for the samples of APC Series. |
|
Fig. 4 Temperature dependence of ε' and tanδ at various frequencies for the ceramic compositions of APC series |

|
Fig. 5 Linear fit plots of modified Curie-Weiss Law for pure and calcium modified PZT ceramics. |
|
Fig. 6 Variation of ΔT, ΔTrelax and γ vs. calcium concentration. |
|
Fig. 7 (a) Temperature dependence of ε'for the samples of APC series at 10 kHz (Inset Fig. 7 (a): Variation of transition temperature with calcium concentration at 10 kHz) (b) Temperature dependence of tanδ for the samples of APC series at 10 kHz |
|
Fig. 8 Frequency dependence of ac conductivity at various temperatures for the samples of APC Series. |
|
Fig. 9 Temperature dependence of ac conductivity for the samples of APC series at different frequencies. |

|
Table 2 Values of ε′ and tanδ at 10 kHz for the samples of APC series at room temperature |
RT- Room Temperature |
|
Table 3 Values of γ for pure and calcium modified PZT ceramics at various frequencies |
|
Table 4 Values of Tmax or TC, ε'max, Ea at 10 kHz for unmodified and calcium modified PZT ceramics |
Increasing calcium addition in the studied Pb(1-x) CaxZr0.52Ti0.48O3 ceramic compositions results in the reduction of grain size. An interplay of intrinsic and extrinsic contributions which are influenced by grain size variations is responsible for the observed trend in the values of dielectric constant at room temperature. With increasing calcium concentration, the ferroelectric-paraelectric phase transition becomes more diffused for the samples and a monotonic decrease in TC is noted which is attributed to increasing internal stress. Weak relaxor properties are observed in the samples with calcium content more than 2 mol% in the studied composition and frequency range. From the ac conduc- tivity studies, the value of activation energy, calculated for the ferroelectric region near phase transition tem- perature at the frequency 10 kHz, is greater for calcium modified samples than that for unmodified sample. This is due to decrease in grain size that results into decreased concentration of oxygen ion vacancies. For the samples with calcium content higher than 2 mol%, in addition to grain size effect, higher degree of disorder and lattice defects are also responsible for determining the value of Ea.
One of the authors (Anupama Sachdeva) is grateful to Dr. Vandna Luthra, Associate Professor, Gargi College, University of Delhi for her guidance in experimental work. We are also thankful to Dr. N. C. Mehra for his valuable support in facilitating Scanning Electron Micro- scopy studies
The authors declare no conflict of interest.
- 1. G.H. Haertling, J. Am. Ceram. Soc. 82[4] (1999) 797-818.
-

- 2. K. Kim, and S. Lee, J. Appl. Phys. 100[5] (2006) 51604(1-11).
-
- 3. A. Presas, Y. Luo, Z. Wang, D. Valentin, and M. Egusquiza, Sensors. 18[7] (2018) 2251(1-21).
-
- 4. B. Tiwari, T. Babu, and R.N.P. Choudhary, in Materials Today: Proceedings of the 1st International Conference on Energy, Material Sciences and Mechanical Engineering, Oct 31-Nov 1, 2020, edited by H. Kumar, P. Jain, and V. Pandey (Elsevier Ltd., 2021) p. 407.
-
- 5. B. Jaffe, W.R. Cook, and H. Jaffe, in “Piezoelectric Ceramics” (Academic Press, 1971).
- 6. Y. Xu, in “Ferroelectric Materials and Their Applications” (Elsevier Science, 2013).
- 7. A.S. Bhalla, R. Guo, and E.F. Alberta, Mater. Lett. 54[4] (2002) 264-268.
-
- 8. R.C. Buchanan, in “Ceramic Materials for Electronics” (Boca Raton: CRC, 2018).
- 9. B. Cherdhirunkorn, B. Pidthong, P. Jeamwutthisak, D.A. Hall, M. Shuaib, and T. Tunkasiri, J. Ceram. Process. Res. 13[2] (2012) s323-s327.A. Sachdeva, V. Luthra, P. Gautam, and R.P. Tandon, Integr. Ferroelectr. 122[1] (2010) 74-82.
- 10. M.S. Silva, A.A. Cavalheiro, M.A. Zaghete, M. Cilense, E. Longo, G.F. Cavenago, R.G. Dias, L.L. Silva, and F.V. Motta, Mater. Sci. Forum. 805 (2015) 298-304.
-
- 11. S. Sen, R.N.P. Choudhary, and P. Pramanik, Physica B. 387 (2007) 56–62.
-
- 12. D. Damjanovic, T.R. Gururaja, and L.E. Cross, Am. Ceram. Soc. Bull. 66[4] (1987) 699–703.
- 13. A. Seifert, L. Sagalowicz, P. Muralt, and N. Setter, J. Mater. Res. 14[5] (1999) 2012-2022.
-
- 14. A.L. Kholkin, M.L. Calzada, P. Ramos, J. Mendiola, and N. Setter, Appl. Phys. Lett. 69[23] (1996) 3602–3604.
-
- 15. P. Duran and C. Moure, J. Mater. Sci. 20[3] (1985) 827-833.
-
- 16. K.C. Kao, in “Dielectric Phenomena in Solids” (Elsevier Academic Press, 2004).
- 17. R. Waser, U. Böttger, and S. Tiedke “Polar Oxides: Properties, Characterization and Imaging” (WILEY-VCH Verlag GmbH & Co. KGaA, Weinheim, 2005).
- 18. B. Tareev, in “Physics of Dielectric Materials” (Mir Publications, 1975).
- 19. W.A. Scchulze, and K. Ogino, Ferroelectrics. 87[1] (1988) 361-377.
-
- 20. T.M. Kamel, and G. de With, J. Euro. Ceram. Soc. 28[4] (2008) 851-861.
-
- 21. S.K. Mishra, and D. Pandey, J. Phys : Condens. Matter. 7[48] (1995) 9287-9303.
-
- 22. R. Tickoo, R.P. Tandon, K.K. Bamzai, and P.N. Kotru, Mater. Sci. Engg. B. 103[2] (2003) 145-151.
-
- 23. S.R. Shannigrahi, F.E.H. Tay, K. Yao, and R.N.P. Choudhary, J. Euro. Ceram. Soc; 24[1] (2004) 163-170.
-
- 24. R. Ranjan, R. Kumar, B. Behera, and R.N.P. Choudhary, Mater. Chem. Phys. 115[1] (2009) 473-477.
-
- 25. M.E. Lines, and A.M. Glass, in “Principles and Applications of Ferroelectrics and Related Materials” (Oxford, Clarendon, 1979).
- 26. K. Uchino, and S. Nomura, Ferroelectrics. 44[1] (1982) 55-61.
-
- 27. S.M. Pilgrim, A.E. Sutherland, and S.R. Winzer, J. Am. Ceram. Soc. 73[10] (1990) 3122-3125.
-
- 28. B.M. Jin, J. Kim, and S.C. Kim, Appl. Phys. A. 65[1] (1997) 53-56.
-
- 29. H.P. Soon, and J. Wang, J. Appl. Phys. 100[12] (2006) 124101(1-7).
-
- 30. C.C. Tsai, S.Y. Chu, J.S. Jiang, C.S. Hong, and Y.F. Chiu, Ceram. Int. 40[8] (2014) 11713- 11725.
-
- 31. A.K. Jonscher, in “Dielectric Relaxation in Solids” (Chelsea Dielectric Press, 1983).
-
- 32. I.W. Kim, C.W. Ahn, J.S. Kima, T.K. Song, J.S. Bae, B.C. Choi, J.H. Jeong, and J.S. Lee, Appl. Phys. Lett. 80[21] (2002) 4006-4008.
-
- 33. D. Fasquelle, and J.C. Carru, J. Euro. Ceram. Soc. 28[10] (2008) 2071-2074.
-
- 34. A. Peláiz-Barranco, J.D.S. Guerra, R. López-Noda, and E.B. Araújo, J. Phys. D: Appl. Phys. 41[21] (2008) 215503 (1-5).
-
- 35. C. Ang, Z. Yu, and L.E. Cross, Phys. Rev. B. 62[1] (2000) 228-236.
-
- 36. G. Deng, G. Li, A. Ding, and Q. Yin, Appl. Phys. Lett. 87[19] (2005) 192905(1-3).
-
- 37. M. Zhou, R. Liang, Z. Zhou, and X. Dong, Inorg. Chem. Front. 6 (2019) 2148-2157.
-
- 38. P. Zhao, B. Tanga, F. Sia, C. Yanga, H. Lic, and S. Zhanga, J. Euro. Ceram. Soc. 40 (2020) 1938–1946.
-
- 39. P. Zhao, B. Tang, F. Si, C. Yang, H. Li, and S. Zhang, IEEE Trans. Dielectr. Electr. Insul. 22(6) (2015) 3668–3675.
-
- 40. C. Elissalde, and J. Ravez, J. Mater. Chem. 11(8) (2001) 1957-1967.
-
- 41. S. Anwar, P.R. Sagdeo, and N. P. Lalla, J. Phys.: Condens. Matter, 18(13) (2006) 3455-3468.
-
 This Article
-
2022; 23(1): 99-108
Published on Feb 28, 2022
- 10.36410/jcpr.2022.23.1.99
- Received on Sep 18, 2021
- Revised on Oct 23, 2021
- Accepted on Oct 30, 2021
Services
- Abstract
introduction
experimental
results and discussion
conclusions
- Acknowledgements
- Conflict of Interest
- References
- Full Text PDF
Shared
Correspondence to
- Anupama Sachdeva
-
Keshav Mahavidyalaya, University of Delhi, Delhi 110034, India
Tel : +91-11-47083152 Fax: +91-11-47083152 - E-mail: anupama_sachdeva@hotmail.com
Clean-Energy Research Institute(CRI), Hanyang University, 222, Wangsimni-ro, Seongdong-gu, Seoul, 04763, Korea
E-mail: jcpr@hanyang.ac.kr