


- Experimental investigation and optimization of pulse electrodeposition parameters for Ni-TiO2 coating on Inconel 617 using TOPSIS technique
D.R. Joshuaa,* and A. Jeganb
aDepartment of Mechanical Engineering, AVS Engineering College, Salem-636003, Tamil Nadu, India.
bDepartment of Mechanical Engineering, Sona College of Technology, Salem-636005, Tamil Nadu, IndiaThis article is an open access article distributed under the terms of the Creative Commons Attribution Non-Commercial License (http://creativecommons.org/licenses/by-nc/4.0) which permits unrestricted non-commercial use, distribution, and reproduction in any medium, provided the original work is properly cited.
The quality of nano coating and its strength are purely influenced by deposition parameters. Pulse electrodeposition is a promising technique for material coating. Inconel 617 is a widely used alloy in high temperature and aerospace applications. Considering wide range of its applications, study of micro hardness and surface roughness of Inconel 617 is essential. This research deals with optimization of coating parameters in pulse electrodeposition of Ni-TiO2 on Inconel 617. Both, single and multi-objective optimization techniques are selected, with input design of L9 orthogonal array. Pulse frequency, duty cycle and current density are the input parameters. Micro hardness and surface roughness were determined from Coated Inconel 617. TOPSIS technique is adopted to improve micro hardness and surface roughness. Based on the experimental results, Micro hardness of 474 Hv and surface roughness of 0.412 µm are achieved with remarkable improvement in closeness coefficient value from 0.4475 to 0.913. SEM analysis is carried out to ensure the surface quality. Moreover EDAX and XRD test to identify the presence of coating material
Keywords: Inconel 617, Ni-TiO2 Coating, Pulse Electrodeposition, Surface roughness, Hardness and TOPSIS
Electroplating is a common economic method adopted for nano-coating of metals. Improved tribological coating behavior is achieved through electro deposition method. In electroplating, rate of deposition is controlled by changing the voltage and current [1-3]. Compared to conventional coating, pulse electroplating offers high quality coating and improved surface structures and properties. Homogeneous material deposition with fine grain size is achieved in pulse electroplating due to high throwing power [4]. Inconel 617, an advanced super alloy, has excellent high temperature properties and finds application in thermal systems such as gas turbines and heat exchangers, where the alloy is subjected to the combined effects of corrosion, mechanical and thermal stresses [5-7]. It is a nickel based alloy which provides corrosion resistance because of chromium content and prevents corrosion at high temperature applications too [8]. Due to such wide range of appli- cations in important areas, surface roughness study and micro hardness study of Inconel 716 needs further investigation for better performance.
Praveen et al. [9] coated Zn-Ni/TiO2 on mild steel by sol-gel technique. Corrosion test was also carried out with 3.5% NaCl and the results showed improvement in micro hardness and corrosion resistance. Natrajan et al. [10] investigated wear behavior of AISI 1022 CS nano coated with Ni-TiO2 by pulse electro deposition method. Based on experimental study, 20 Hz frequency, 0.2 A/cm2 current density and 30% duty cycle were found to provide minimum wear rate on the specimen. ANOVA optimization technique was used for obtaining optimized results of wear resistance. The report revealed that the impact of pulse frequency on wear was 28.48% and that of current density on wear resistance being 29.95%. Shathishkumar et al. [11] performed an ex- periment to find the micro hardness and resistance to corrosion of Ni-SiC & Ni-MWCNT coatings done by pulse electrodepositing method. Experimental results showed improvement in micro hardness of coated specimens. The SiC (Silicon carbide) coating and MWCNT composite (Multi walled carbon Nano tube) coating showed maximum improvements of 91.6% and 168% respectively. Natrajan et al. [12] developed a numerical model to evaluate the characteristics of Ni-Sic nano composite coating on AISI 1022. GRA optimization technique was used to get the optimum parameters. Results revealed, 10 Hz frequency, 10% of duty cycle and 0.2 A/cm2 current density as the optimum electroplating parameters.
Thieming et al. [13] performed an experiment to identify the effects of nickel titanium coating made by electro deposition method. Improved hardness of 390 Hv from 354 Hv was obtained when the current density was varied from 2 to 4 A/dm2 in the nano coating process. At the same time, micro hardness was reduced to 375 Hv for a current density of 8 A/dm2. Praveen et al. [14] performed Ni-TiO2 nano coating on Zinc by Sol-gel method. Experimental results revealed improvement of micro hardness and resistance to corrosion along with achievement of minimum wear loss. Adam khan et al. [15] carried out an experiment on Inconel 617 with plasma sprayed coating of Al2O3-TiO2 and NiCr-Cr2O3 at 1,000 oC exclusively for gas turbine appli- cations. Corrosion test results revealed enhanced corrosion resistance of Inconel 617 after coating. Birlik et al. [16] prepared Ni-TiO2 nano composite coating with electrodeposition method. It was pointed that; size of nano particle and current density of nano coating have a huge impact on corrosion and mechanical pro- perties. Rise in current density and small sized of nano particle significantly impact the mechanical property of the coated specimen. The Pulse electrodeposition of Ni-TiO2 nanocomposite coating provided excellent anti-corrosion performance, higher microhardness and improved wear resistance [17-21.]
Study of past literature shows that, many research works were done on super alloy materials with parti- cular focus on improving corrosion resistance. Given the various applications of Inconel 617 that include thermal and aerospace industry, study to enhance its micro hardness becomes crucial for better performance. Various nickel based nano composite combinations have been used in past work namely Ni-Al2O3, Ni-TiO2 and Ni-ZrO2 [22-26]. It was evident that, Investigation on micro hardness and optimization of electrodeposi- tion parameter for Inconel 617 coating was not done. This paper is focused on identifying the optimum parameters for performing pulse electro deposition of Ni-TiO2 coating on Inconel 617. TOPSIS optimization method is adopted to find the optimal set of coating parameter of pulse electro deposition. Compared to other optimization techniques, TOPSIS is preferred due to its simplicity and quick prediction [27-32].
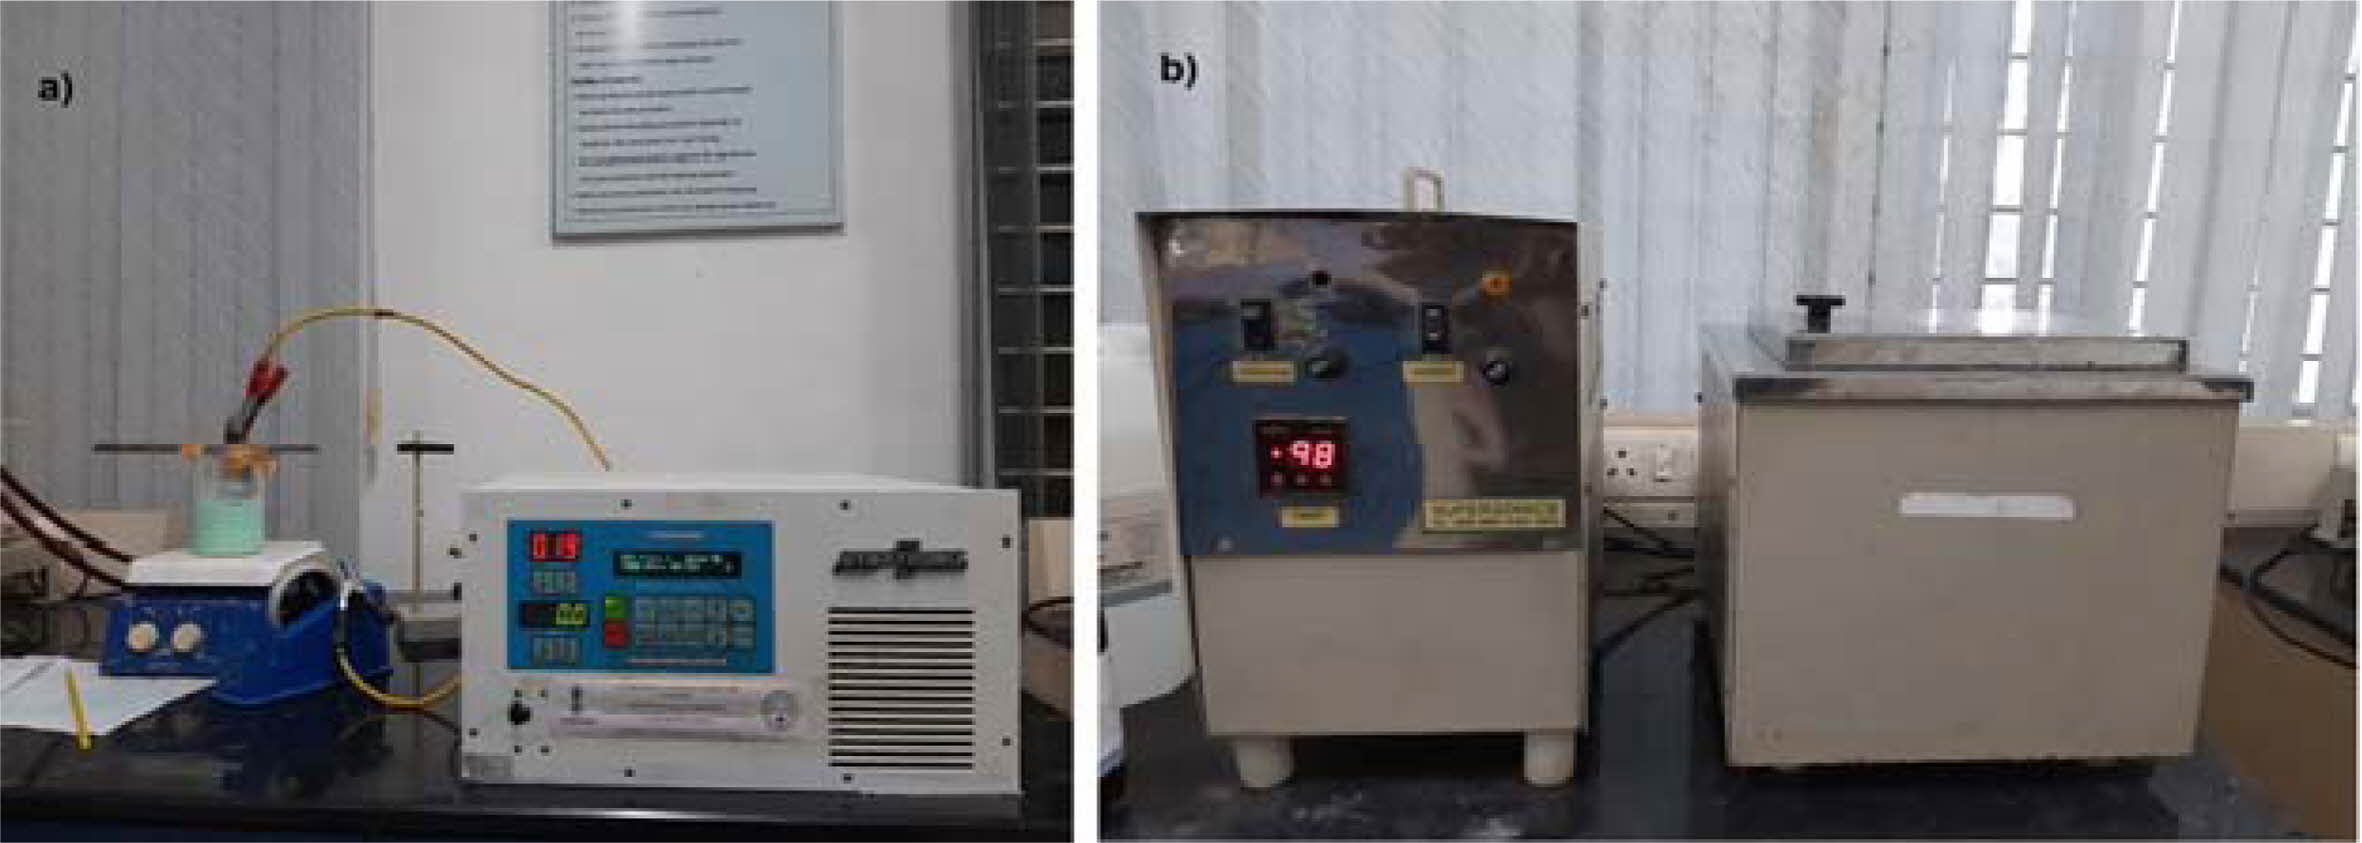
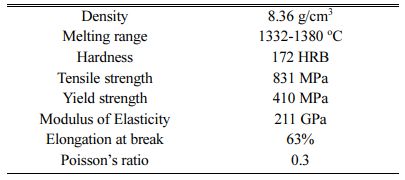
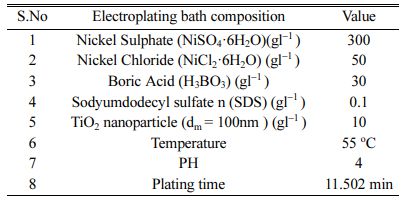
Inconel 617 is used as a test specimen with the composition of Ni 50.85%, Cr 22.7%, Co 10.85%, Mo 9.25%, others 6.35%. The mechanical properties of Inconel 617 are presented in Table 1. For electrode- position, Inconel 617 specimen with dimensions of 10 ´ 10 ´ 30 mm was used. Wire cut EDM was used to cut the specimen. The top surface of the specimen is polished with Abrasive Paper (SiC grade: 80-2500) and also ultrasonic cleaning is carried out for a time duration of 15 min using acetone and finally substrate gets cleaned with distilled water under room tempera- ture. TiO2 particle size of 100 nm is used with concen- tration of 10 gl-1. The electrodeposition of Ni-TiO2 is done from a typical Watts-type electrolyte with coating thickness of 10 Microns. Bath composition details of the electrodeposition is presented in Table 2. The ex- perimental setup is shown in Fig. 1. Dynatronix (USA Make: Micro Star Pulse Series DPR 20-30-100) Pulse generator with input power 110-120 V AC Single Phase 50-60 Hz is used for performing the experiment.
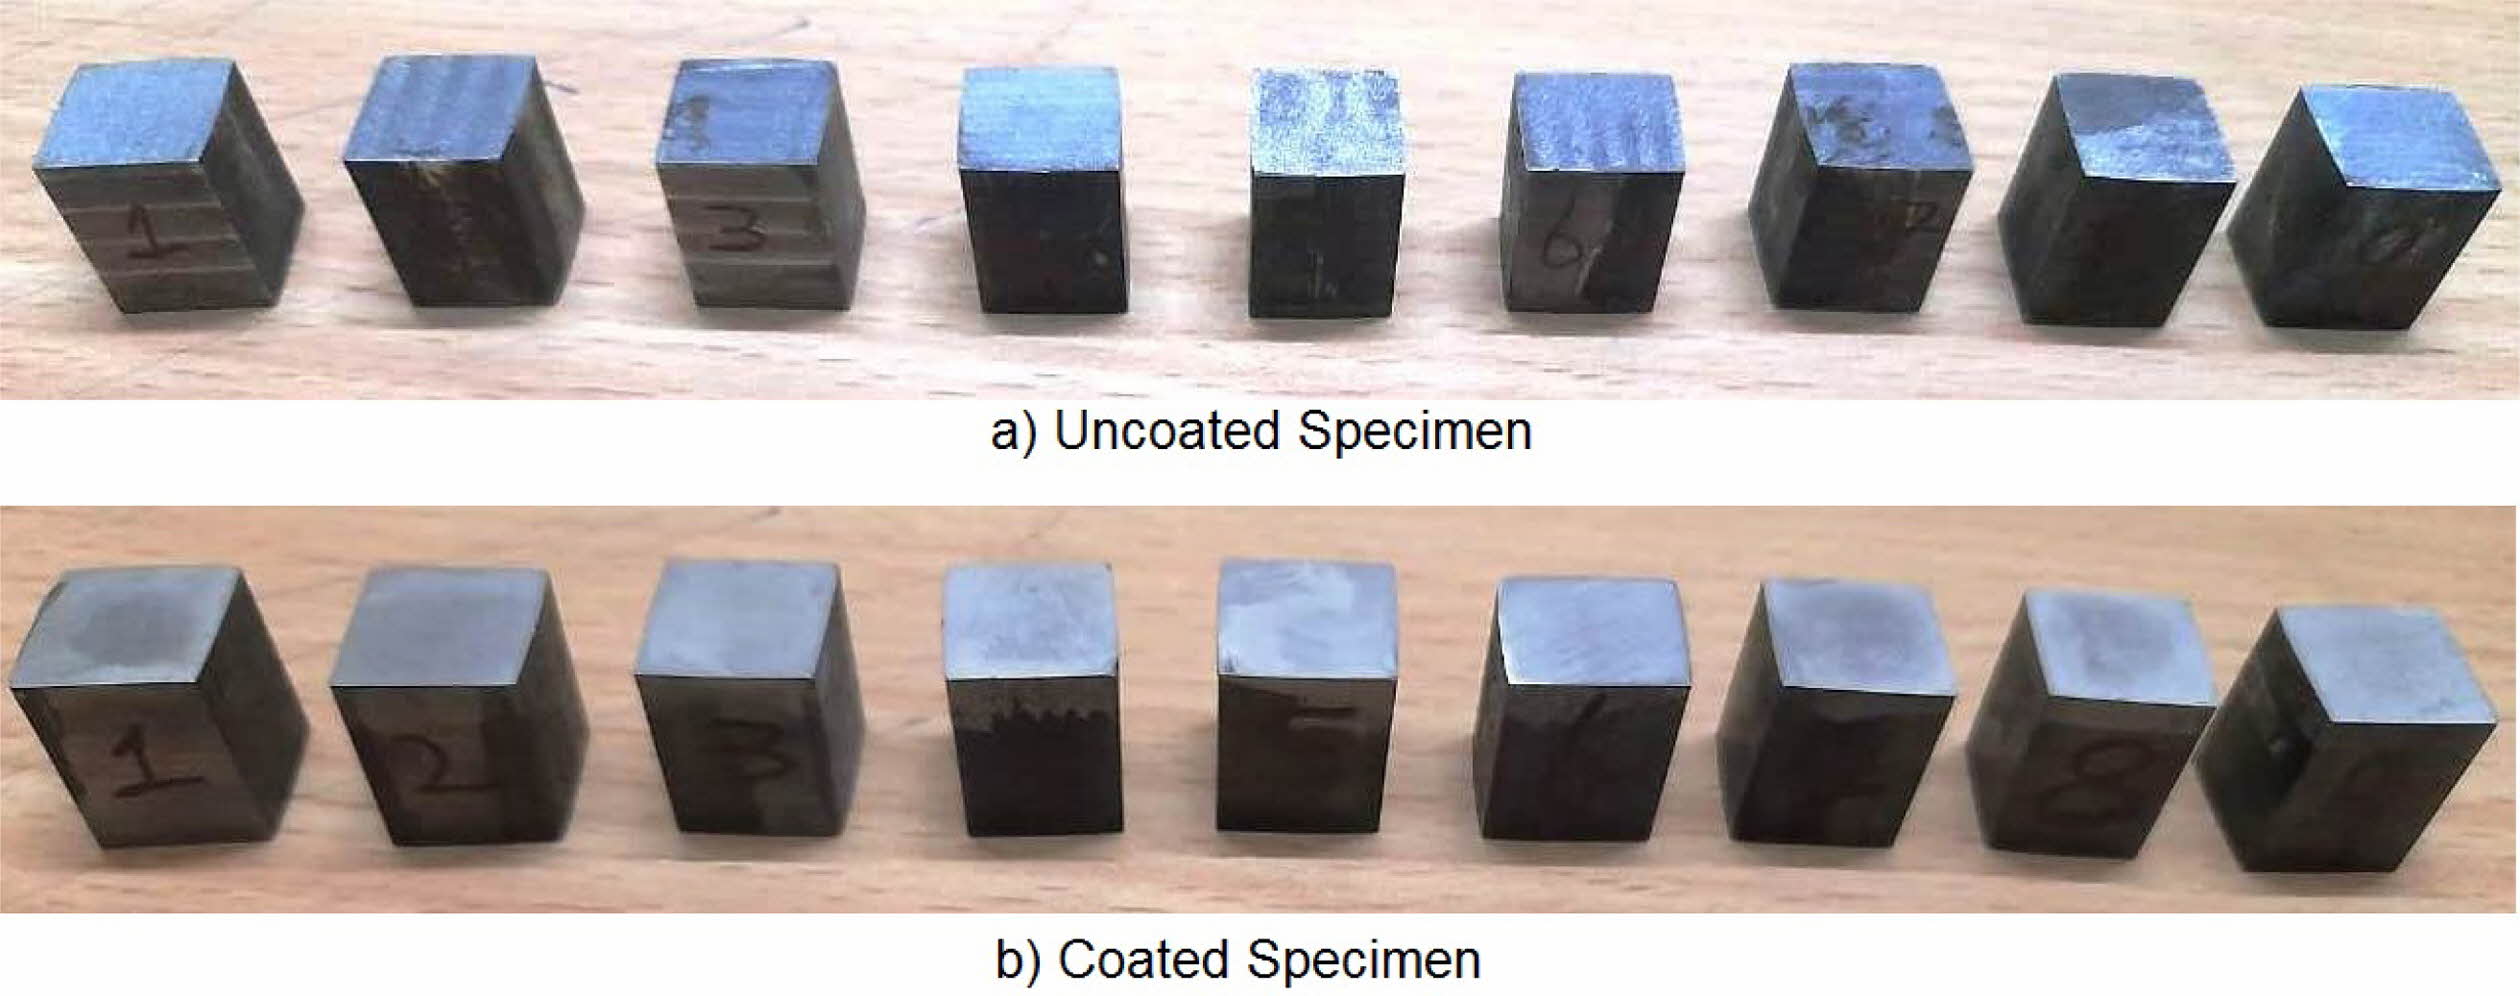
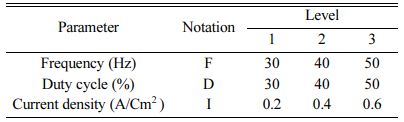
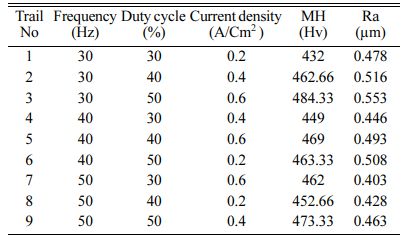
For conducting the experiment Frequency (Hz), Duty cycle (%) and Current density (A/cm2) are used as pro- cess parameters [10, 12, 33]. The experimental para- meter and their notation are given in Table 3. For experimental run, L9 orthogonal array is designated. Surface roughness (Ra) is measured with Mitutoyo-SURFTEST SJ-410 and Micro Vickers Hardness Tester (Make: Shimadzu; Model: HMV-G) with 10 kilogram play load is used to measure the Micro Hardness (MH). The experimental run order and its results are shown in Table 4. The coated specimens are presented in Fig. 2.
|
Fig. 1 Experimental setup a) Pulse rectifier setup and b) Ultrasonic Cleaning setup. |
|
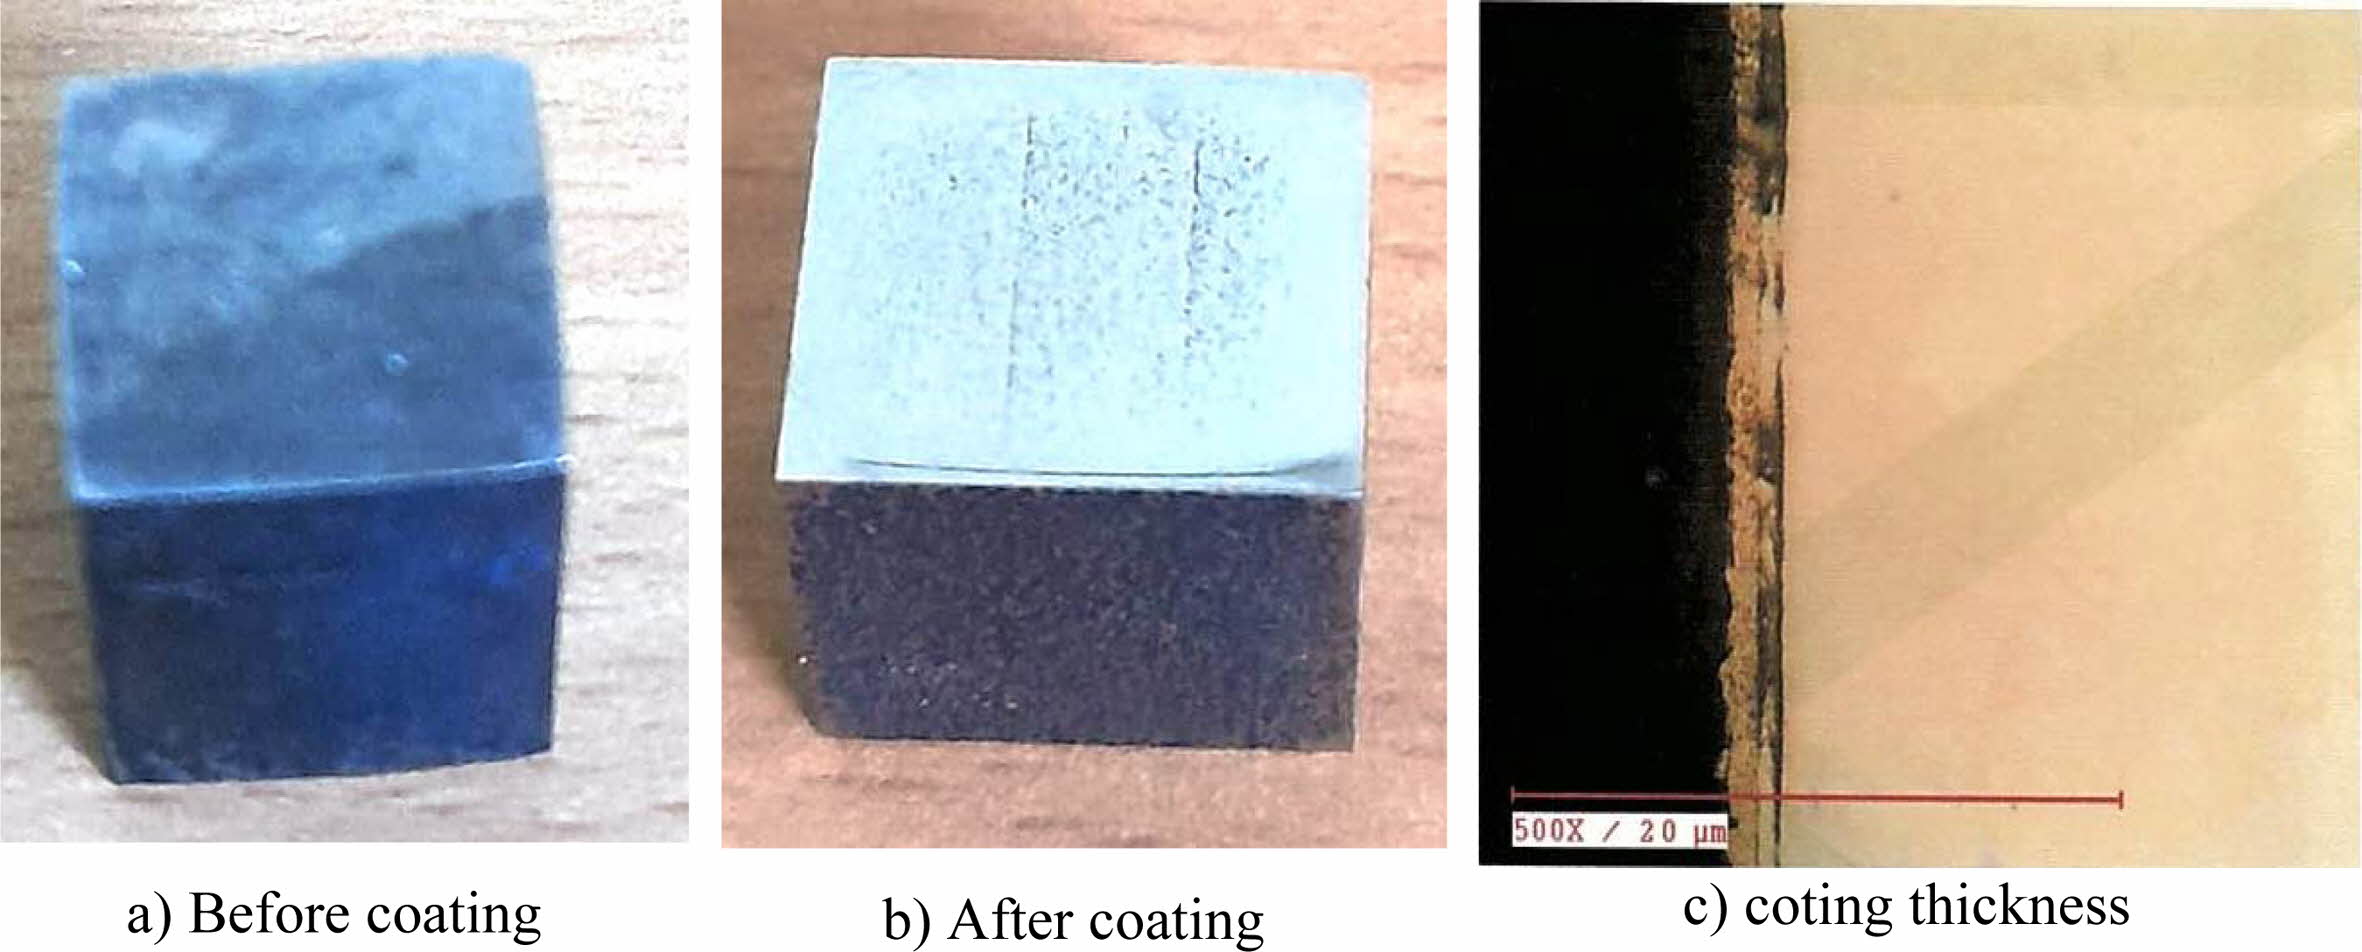
Fig. 2 Inconel 617 specimen a) Before coating and b) After Coating. |
Single objective optimization
S/N Ratio
The aim of this study is to improve the MH and surface finish of a material. Generally, for calculation of S/N Ratio, smaller the better and higher the better are used. In this research hardness of the specimen should be improved and surface roughness reduced. Hence, higher the better is used for material hardness and for surface roughness, smaller the better condition is used. The equation of S/N ratio is given in Equation (1) and (2).
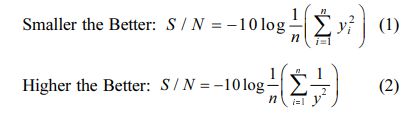
Here, “n” is a total no. of observations and “y” is observed data.
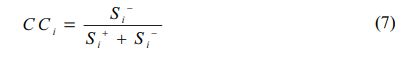
S/N ratio responses and their mean effects plots are done using Minitab19 software. Mean effects plots for MH and Ra are presented in Fig. 3 and 4 respectively.
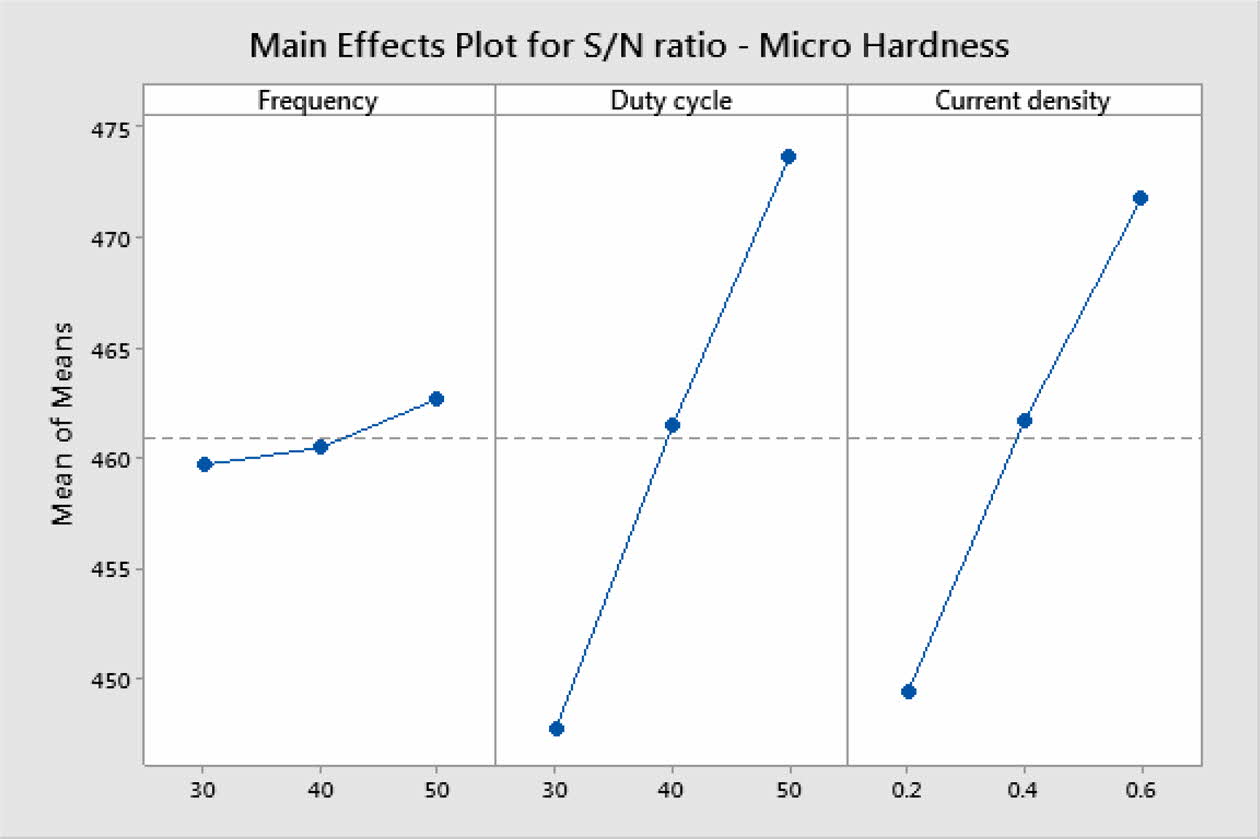
Based on Main effects plot, for obtaining maximum MH, level 3 is the suitable coating condition. From Fig. 3, Frequency 50 Hz, Duty cycle 50% and Current density 0.6 A/Cm2 are identified as optimal parameters. Fig. 4(a)-(c) shows the contour plot of the MH, it shows that microhardness increases, with the increasing trend of frequency, duty cycle and current density because of more deposition of nano particles on the specimen. Fig. 4(a)-(c), also shows that duty cycle is the major influencing factor on microhardness followed by current density, which is in good agreement with Natarajan et al. [12]. The microhardness gradually increases with increase in current density as the coating deposition is embedded with more amount of TiO2 nano particles.
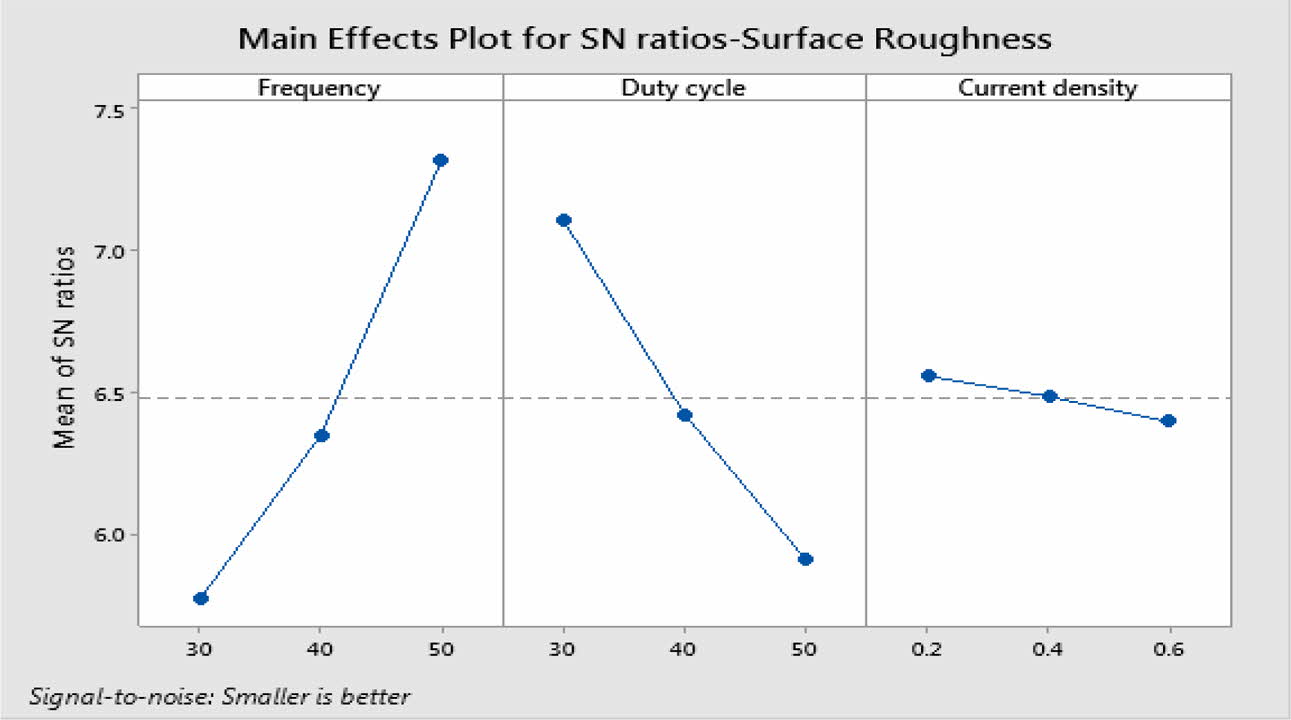
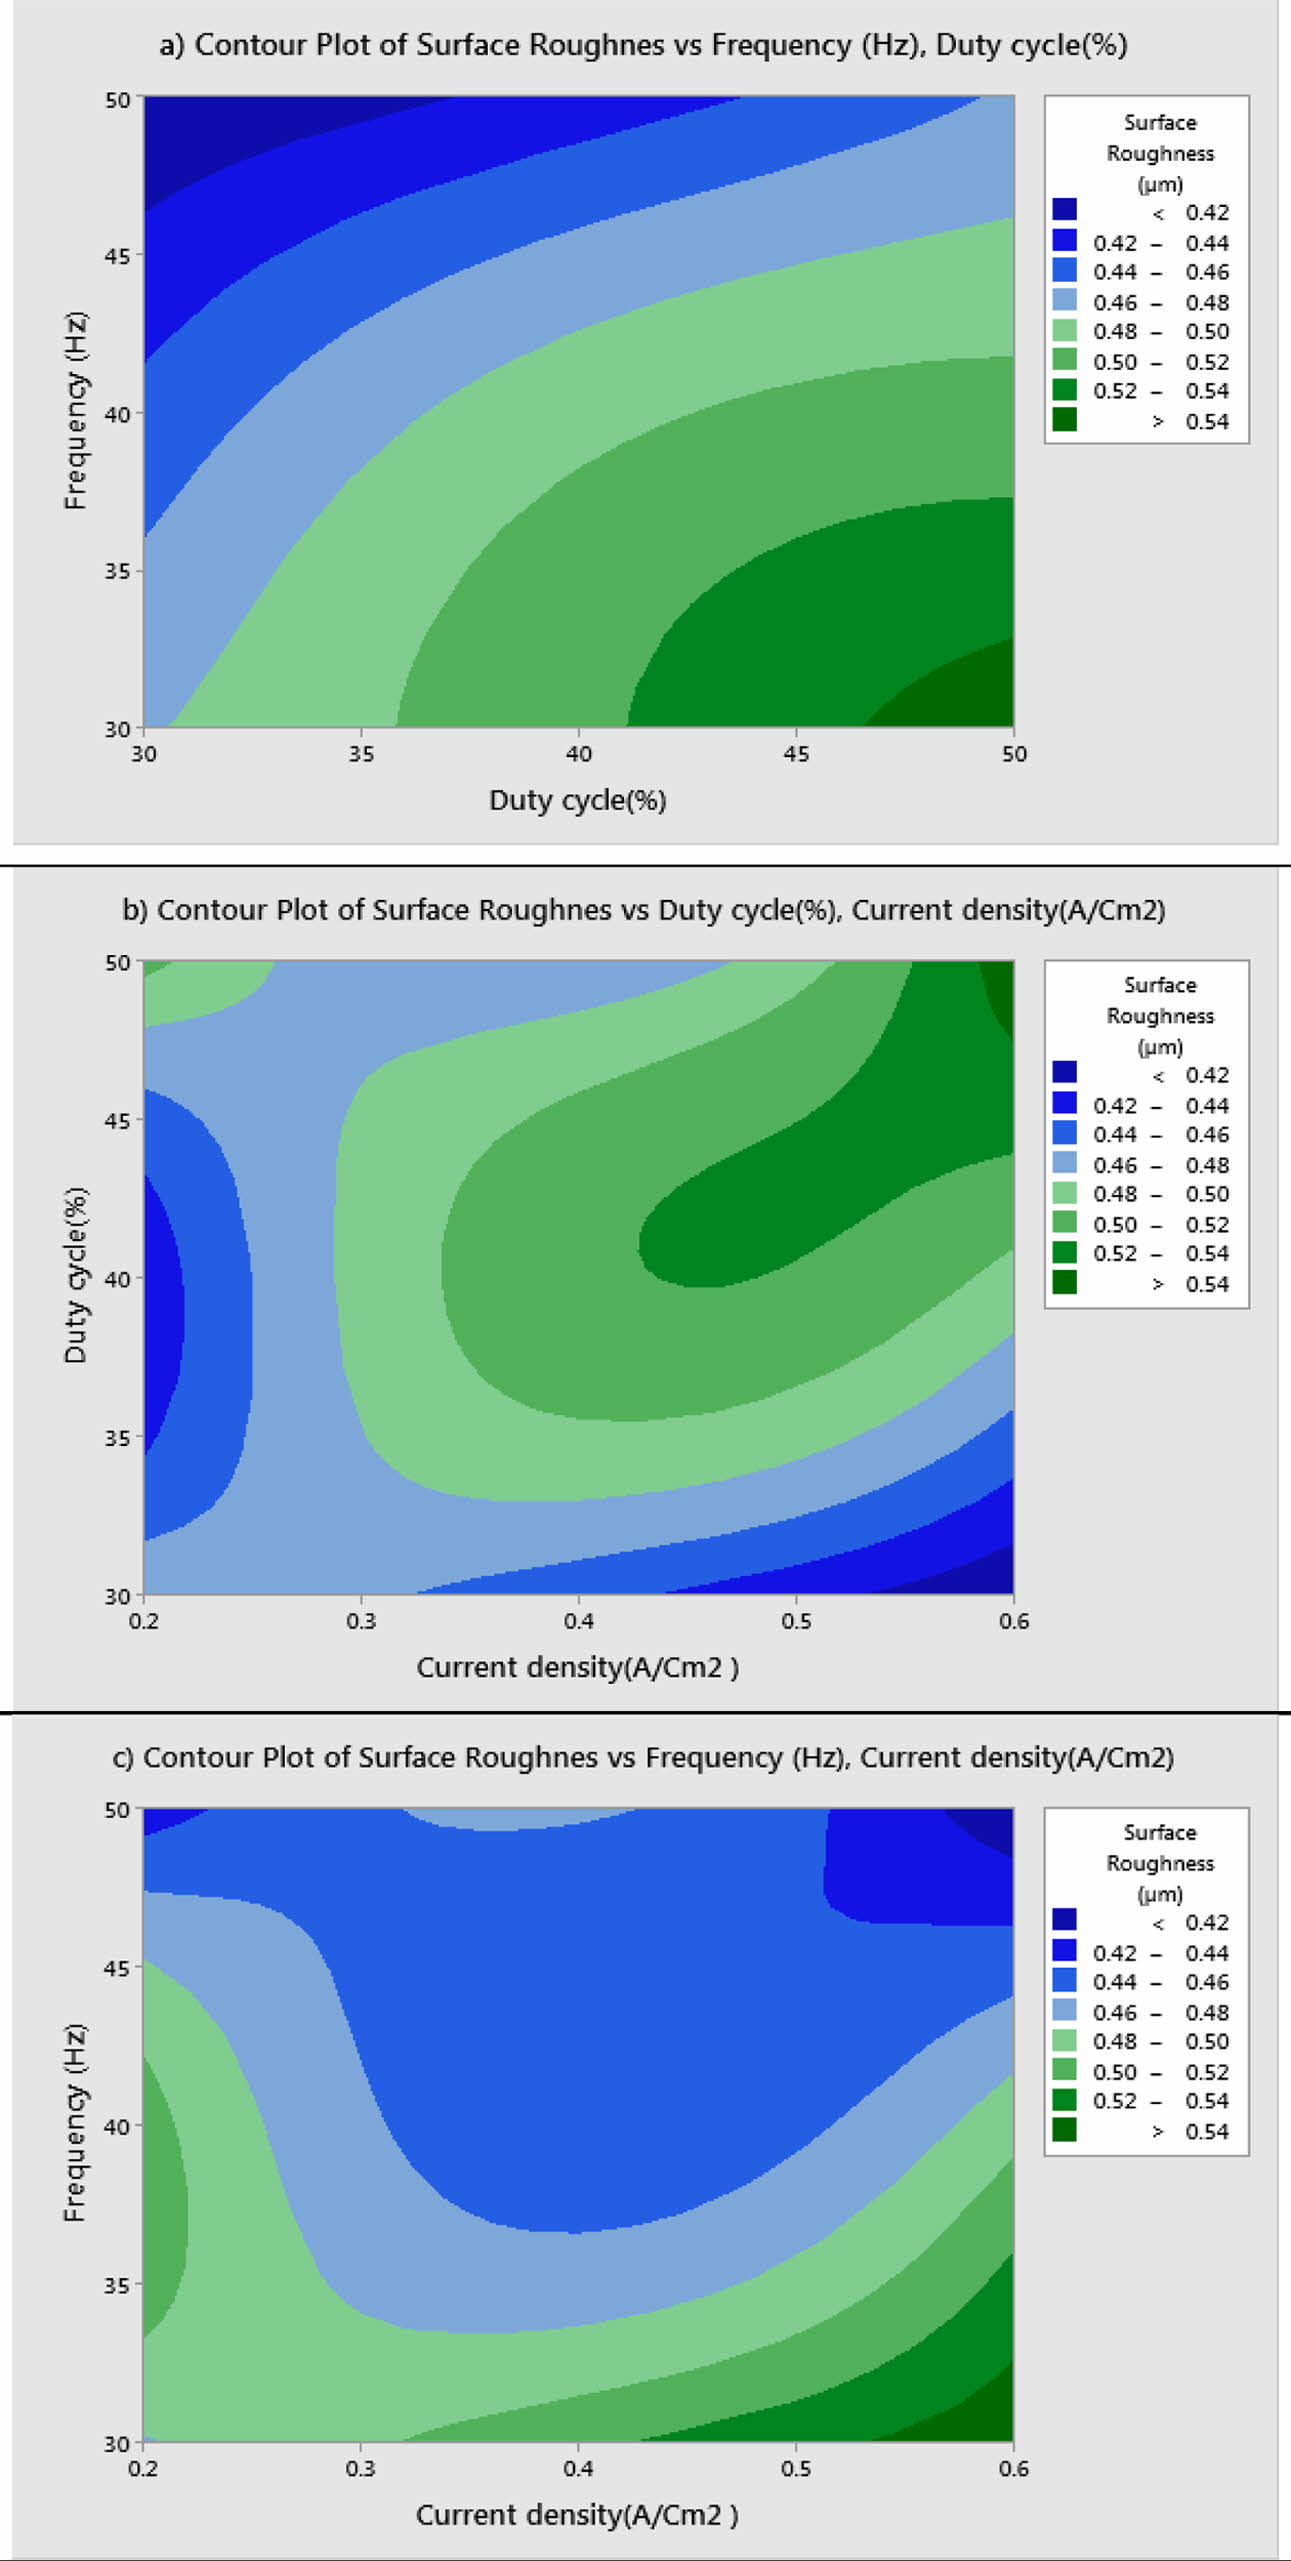
For obtaining reduced Ra, level three of frequency and level 1 of duty cycle and current density are suitable optimum parameters. Fig. 5 indicates, Frequency of 50 Hz, Duty cycle at 30% and Current density of 0.2 A/Cm2 are identified as optimal parameters values. From the experimental results, maximum micro hardness of 484.33 Hv is achieved with the maximum current density of 0.6 A/Cm2. These results are nearly agreeable with that of Thieming et al. [13]. For obtaining better Ra, Maximum frequency and minimum duty cycle are suggested. At maximum current density, the deposition rate is affected and it results in poor surface finish on the surface of the specimen. Fig. 6(a) -(c) shows the contour plots of the Ra. Roughness is directly propor- tional to duty cycle, gradually increases with increase in duty cycle, and inversely proportional to frequency. From contour plots of Figs. 6(a)-(c), it is observed that frequency is the most significant parameter that influence the Ra followed by duty cycle.
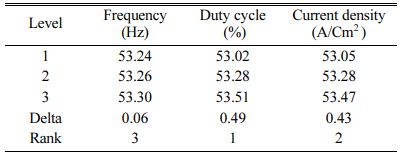
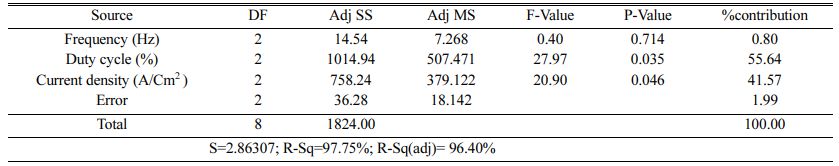
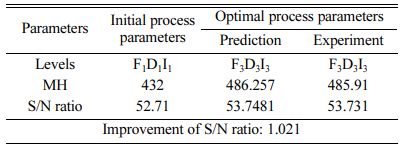
Table 5 represents the Mean S/N ratio for MH. From the table it is clear that, Duty cycle is the dominant factor on hardness compared to Frequency and current density. Increasing and decreasing the duty cycle directly vary the rate of movement of positive ions to reach cathode. It also varies the deposition rate of nano coating on the specimen [30]. ANOVA analysis for micro hardness was performed and the results are plotted in Table 6. From ANOVA analysis of MH, it is revealed that duty cycle is more significant (55.64%) compared to other parameters. This is due to the homogeneous deposition of nano particle on Inconel 617 which depends on variation in the duty cycle. Table 7 represents the confirmation experiment for achieving maximum Micro hardness. Based on the confirmation results, the maximum value of 485.91 Hv is obtained at the optimal conditions of Frequency 50 Hz, Duty cycle 50% and Current density 0.6 A/Cm2 and also the S/N ratio improved by 1.021.
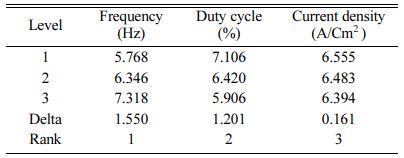
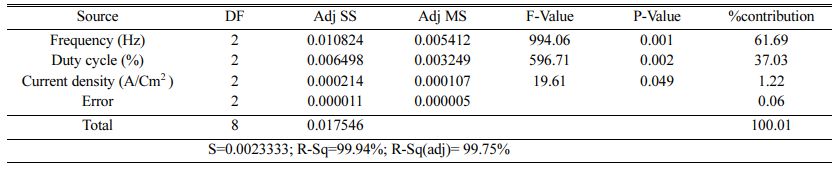
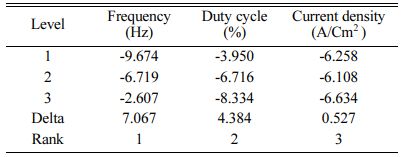
Table 8 represents the S/N ratio for Ra. It is evident that, pulse frequency is the most dominant factor for Ra compared to duty cycle and current density. Generally high pulse frequency and minimum duty cycle increase the homogeneity nano material deposition on the base metal. These results match very well with Yang and Cheng [31]. To identify the most influencing parameter on Ra, ANOVA analysis is performed and plotted in Table 9.
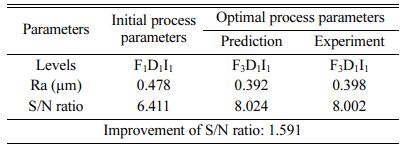
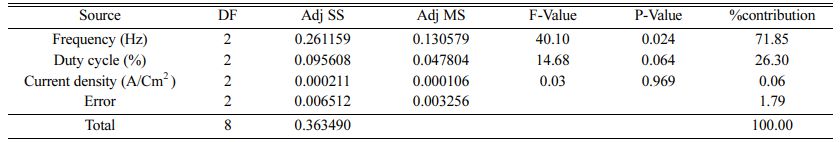
The highest of R2 = 99.75% is achieved in the ANOVA analysis for Ra. Pulse frequency exhibits the most significant contribution (66.9%) on Ra followed by duty cycle and current density shows least effect on Ra. Based on the S/N ratio plot for Ra (Fig. 5), confirmation table was plotted and given in Table 10. From the confirmation results for surface roughness, 0.398 µm is achieved at optimal parameters i.e., Frequency 50 Hz, Duty cycle 30% and Current density 0.2 A/Cm2. Confirmation results shown that Ra value is remarkably improved by 16.73%.
Multi Objective Optimization - TOPSIS study
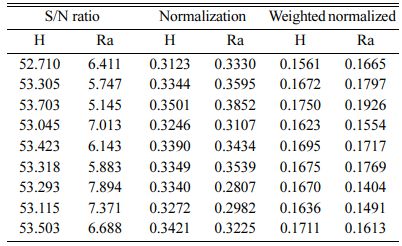
TOPSIS optimization technique is used to get multi objective optimized results. Initial step of TOPSIS study is the identification of decision matrix. It is represented by (rij) and given in Equation (3). Followed by decision matrix, weight of each response should be allocated. Normalized value is defined with the help of decision matrix and preferred weights. Suitable expression is given in Equation (4). (Note: αij is ith value of experimental order ‘j’)
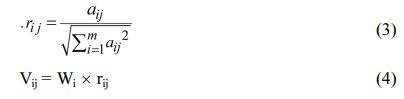
Here wi= weight of ji.
In next step, Positive and negative ideal solution (S+ and S-) is calculated with the help of Equation (5) and (6.)
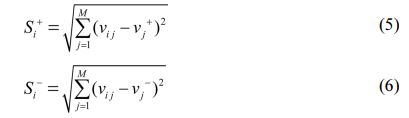
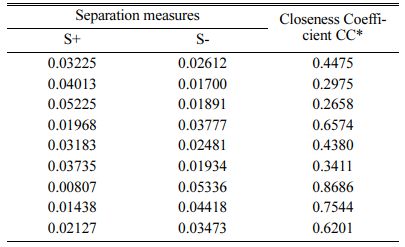
In last step, CC (closeness coefficient) is determined by Equation (7). After evaluating CC, Rank is set with higher value of CC.
Based on TOPSIS study, Table 11 & 12 represent the normalization value of Separation measures & Closeness Coefficient values of MH and Ra. For obtaining the better MH and Ra, all the parameters are considered as having equal weight. From Table.12, it can be noticed that the highest value of CC is achieved in experiment number seven with CC value of 0.8686. The minimum CC value is noted in experiment three. Preferred run order with respect to CC is 7>8>4>9>1>5>6>2>3. From response table (Table 13) Pule Frequency level is found to be the dominant factor followed by duty cycle and current density. It is evident that, for obtaining better surface finish and higher hardness in Ni-TiO2 electrodeposition nano coating on Inconel 617, Pulse frequency is identified as the most influencing process parameter. The results are in good agreement with single objective optimization results [31].
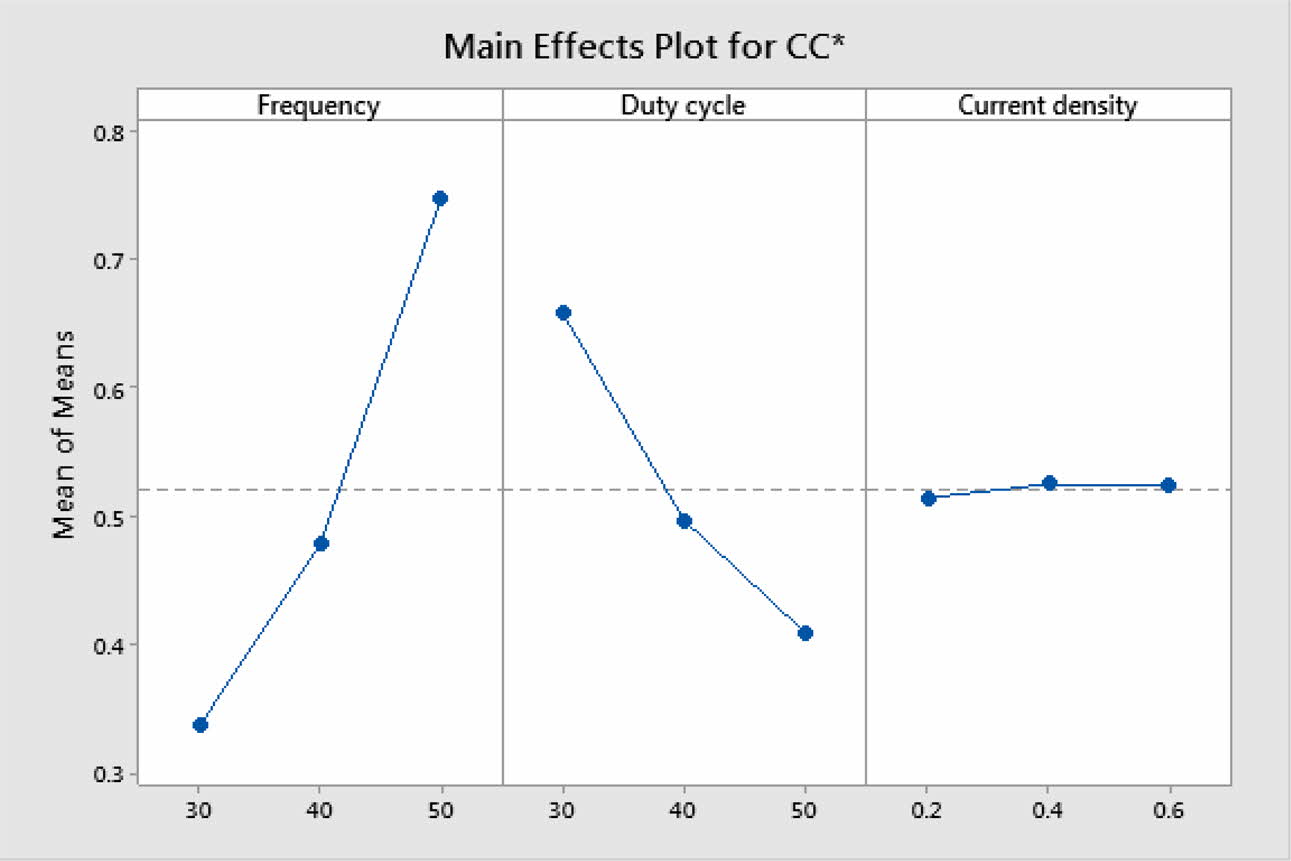
Fig. 7 represents the main effect plot for CC* with respect to process parameters. According to the plotted image, F3D1I2 is the optimal condition. Table 14, shows Frequency dominates highly with 71.85% on MH and Ra. Generally, variation in the current density directly hits the deposition rate. Homogeneous deposition improves the MH and surface finish. This result highly matches with that of Arunsunai Kumar et al. [32].
Confirmation experiment
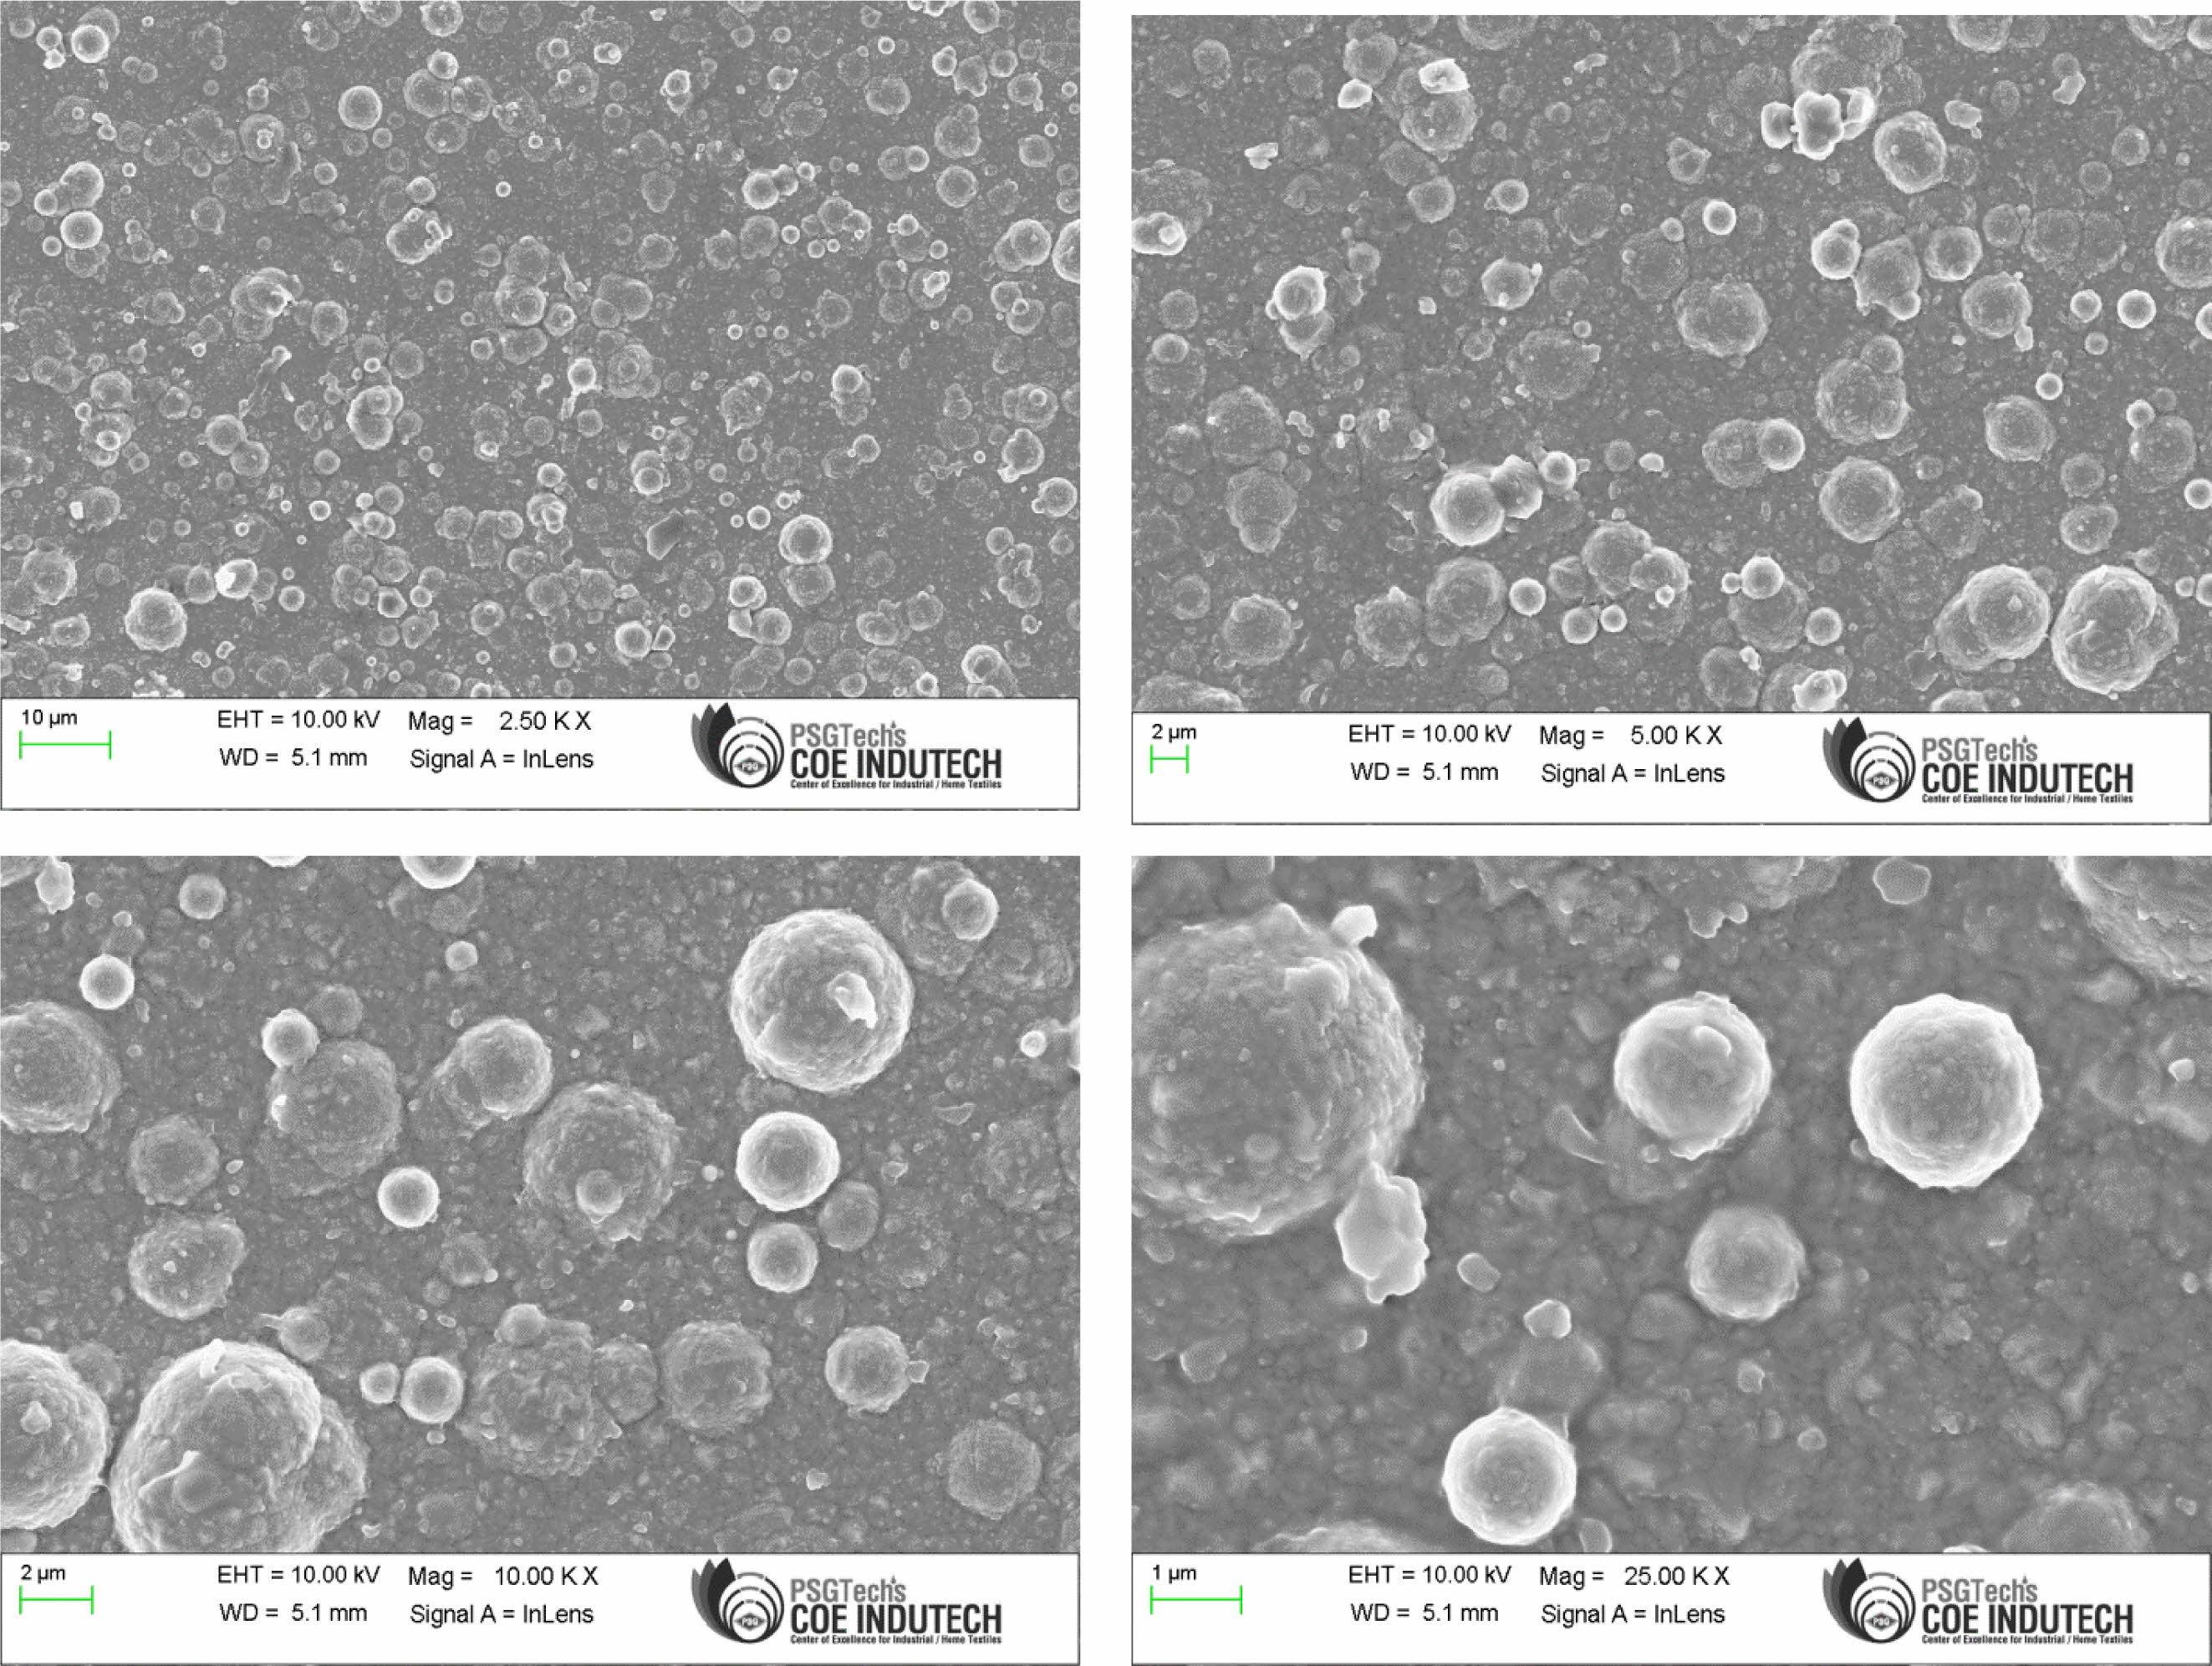
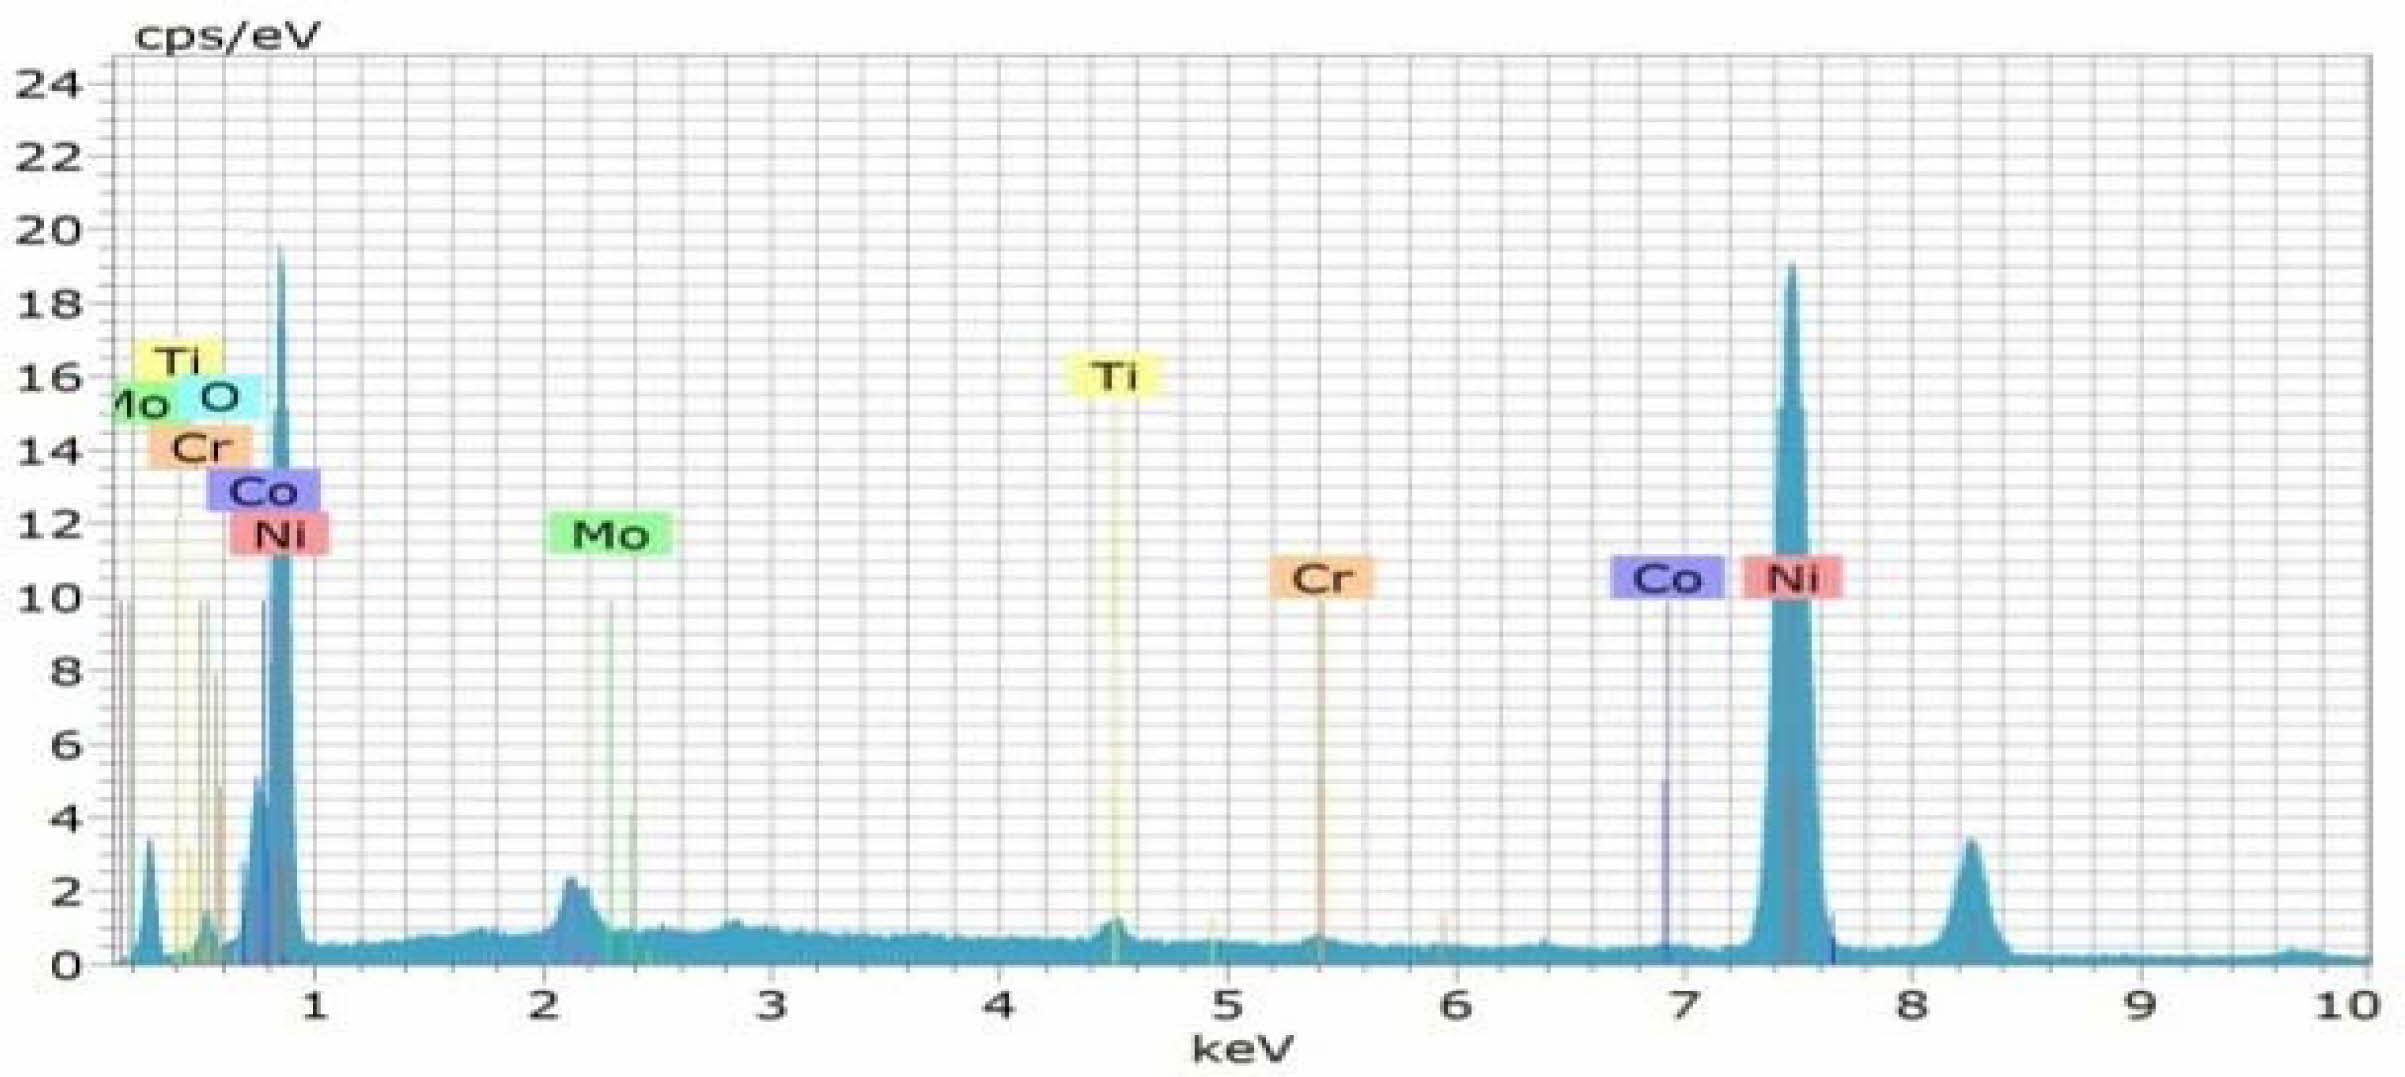
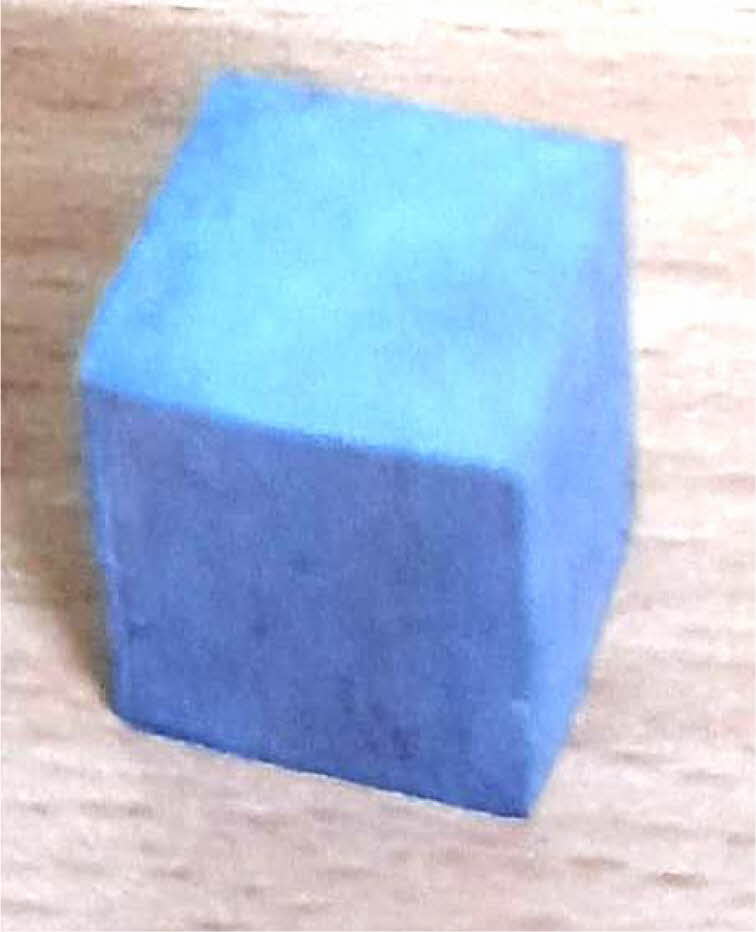
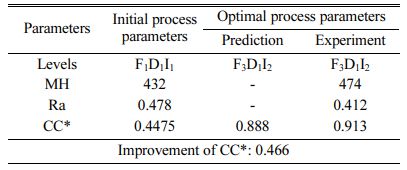
Confirmation experiment is the only way of verifying the optimized results [34]. Table 15 represents the con- firmation experiment parameters. As per the levels indicated in the table, Frequency 50Hz, Duty cycle 30% and Current density 0.4 A/Cm2 are identified as optimal parameters. The confirmation experiment for Ni-TiO2 electrodeposition nano coating on Inconel 617 is conducted with high pulse frequency, minimum duty cycle and moderate current density. Micro hardness of 474 Hv and surface roughness of 0.412 are achieved. Improvement of CC is achieved by 50.98%. Fig. 8 represents the coated Inconel 617. Scanning Electron Macroscopic (SEM) analysis was carried out to ensure the dispersion of particle and surface structures. It is noted that, equal homogeneous deposition was seen and the same is represented in Fig. 9. EDAX analysis is the key to identify the presence of Ni-TiO2 on Inconel 617 surface. EDAX analysis is shown in Fig. 10 and the presence of Ni and other elements are noted. Fig. 11
Corrosion test
Inconel 617 alloy is identified as a most preferable selection of material with good mechanical properties and better temperature phase stability [35-39]. Hot corrosion resistance and the oxidation of nickel based alloys are enhanced by using protective coatings [40-43]. Corrosion test was performed to ensure the improvement in corrosion behaviour of the Inconel 617 specimen under optimized conditions as per ASTM G28-02(RA15) standards. The samples are resized into 1.45 x 1.72 x 1.138 cm resulting in a surface area of 9.37 cm2. For performing corrosion test, 25 gm of ferric sulphate Fe2(SO4)3 is added with 400 mL of distilled water and 236 mL of sulphuric acid to prepare the solution. All the specimens are ground finished using 600 grit and pickled with 20% HNO3 + 5% HF solution at 60o for 5 min before testing. The duration of test is 24 h at the test temperature of 120 oC. Loss of weight was noted in the specimen as 0.2225 gms and rate of corrosion was found to be 2.13 mm/year. Rate of corrosion of uncoated Inconel 617 is stated as 3.75 mm/year [43]. Corrosion rate is decreased by 43% in Ni-TiO2 electrodeposition coating on Inconel 617 carried out under optimized conditions. Coated specimen after corrosion test is given in Fig.12. This test results are in good agreement with Kewther et al. [42].
|
Fig. 3 Mean S/N ratio for Micro Hardness. |
|
Fig. 4 a) Contour Plot for MH vs Frequency, Duty cycle; b) MH vs Duty cycle, current density; c) MH vs Frequency, current density. |
|
Fig. 5 Mean S/N ratio for Ra. |
|
Fig. 6 a) Contour Plot for Ra vs Frequency, Duty cycle, b) Ra vs Duty cycle, current density, and c) Ra vs Frequency, current density. |
|
Fig. 7 Main effect plot for CC*. |
|
Fig. 8 Coated Inconel 617 with coating thickness under optimal conditions. |
|
Fig. 9 SEM Analysis of Coated Inconel 617 with F=50Hz, Duty cycle 30% and Current density 0.4 A/Cm2 at different magnifications. |
|
Fig. 10 EDAX Analysis of Coated Inconel 617 with F=50Hz, Duty cycle 30% and Current density 0.4 A/Cm2 |
|
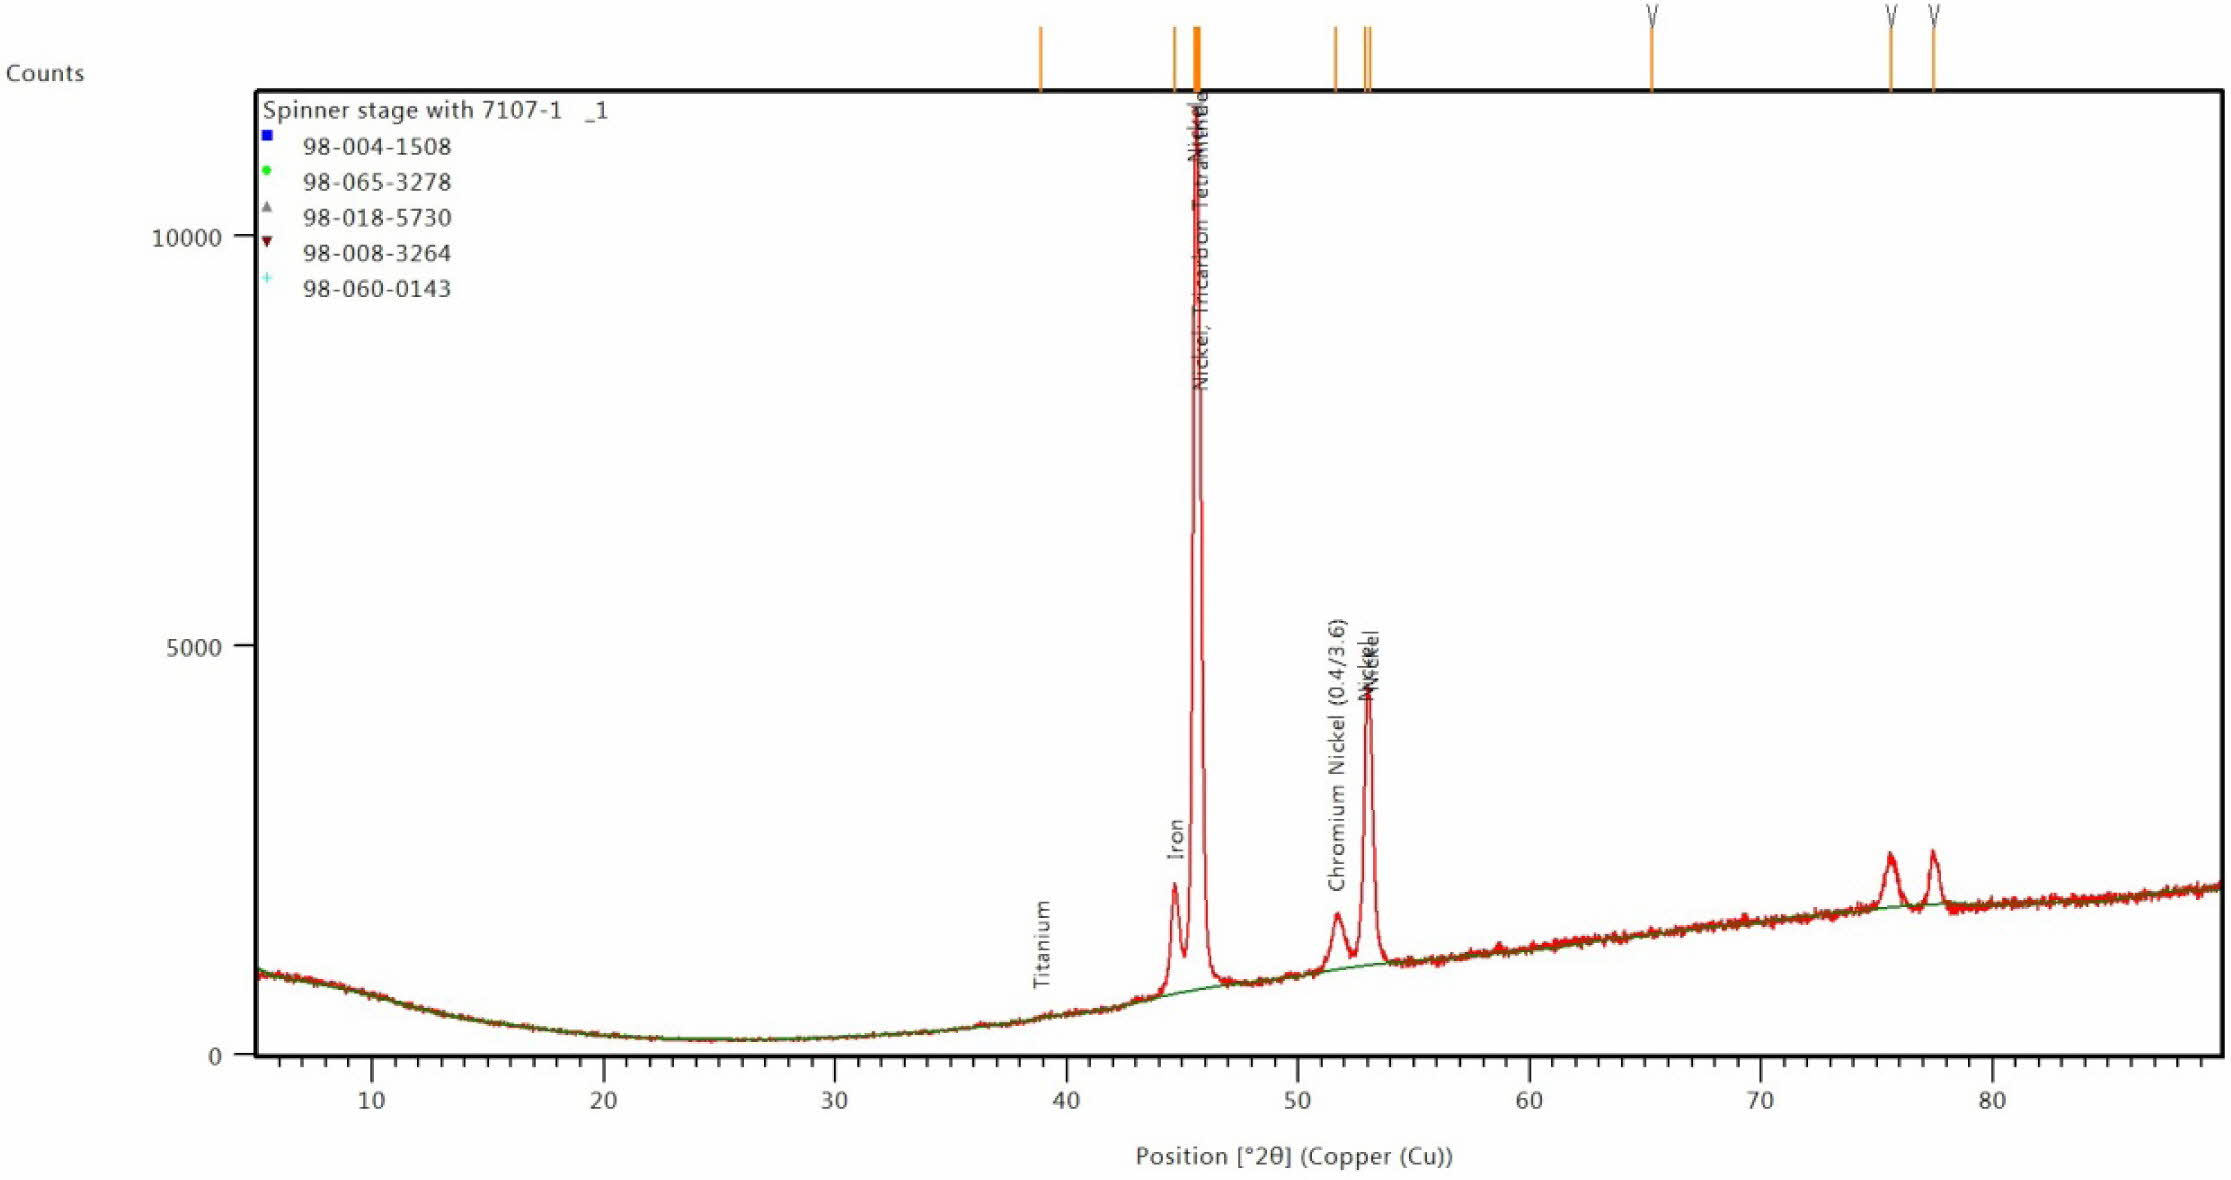
Fig. 11 XRD image for coated Inconel at optimal condition. |
|
Fig. 12 Coated specimen after corrosion test |
This experimental work is carried out to perform Ni-TiO2 electrodeposition coating on Inconel 617 and achieve maximum MH and better Ra. From the analysis of the experimental results, the conclusions are summarized and given below.
Frequency of 50 Hz, Duty cycle at 50% and Current density of 0.6 A/Cm2 are identified as the optimal parameters to achieve the maximum Micro hardness of 485.91 Hv.
For achieving better Ra of 0.398 µm, Frequency of 50 Hz, Duty cycle at 30% and Current density at 0.2 A/Cm2 are identified as optimal parameters.
TOPSIS study reveals that Frequency of 50Hz, Duty cycle at 30% and Current density of 0.4 A/Cm2 are the optimal parameters to achieve maximum MH and better Ra.
Based on TOPSIS and confirmation experiments, MH of 474 Hv and Ra of 0.412 µm are achieved under optimal conditions and also the closeness coefficient value improved remarkably from 0.4475 to 0.913.
SEM analysis was carried out to ensure the surface quality and EDAX test is performed to identify the presence of coating material on base alloy.
Based on corrosion test, rate of corrosion of Ni-TiO2 nano coated Inconel 617 specimen is 2.13 mm/year and the corrosion rate decreased by 43% due to optimal coating conditions.
- 1. W.W. Chen, Y.D. He and W. Gao, Surf. Coat. Technol. 204[15] (2010) 2487-2492.
-

- 2. J. Novakovic, P. Vassiliou, K. Samara and T. Argyropoulos, Surf. Coat. Technol. 201[3-4] (2006) 895-901.
-
- 3. X. Huai, S. Zhao, and W. Li. J. Ceram. Process. Res. 10[5] (2009) 618-620.
- 4. C.F. Malfatti, H.M. Veit, T.L. Menezes, J.Z. Ferreira, J.S. Rodrigues and J.P. Bonino, Surf. Coat. Technol. 201[14] (2007) 6318-6324.
-
- 5. B.W. Lee, Phy. Metal Metallurgy. 115[13] (2014) 1383-1388.
- 6. H. Cho, D.M. Lee, J.H. Lee, H.S. Lee, K.H. Bang and B.W. Lee, J. Ceram. Process. Res. 8[6] (2007) 453-457.
- 7. B.W. Lee, D.W. Kim, J.W. Choi, K.H. Bang, G.H. Lee, and H. Cho, J. Ceram. Process. Res. 9[6] (2008) 672-677.
- 8. J.C. Park, O.G. Jeong, J.K. Kim, Y.H. Yun, T.E. Park, B.W. Lee, and H. Cho, J. Ceram. Process. Res. 15[5] (2014) 315-354.
- 9. B.M. Praveen and T.V. Venkatesha, Int. J. Elec. 4 (2011) 1-4.
-
- 10. P. Natarajan, A. Jegan, and M. Mohanraj, New Mat. Electrochem. Sys. 23[3] (2020) 177-181.
- 11. J.S. ShathishKumar and A. Jegan, Mater. Res. Express. 7 (2020) 055012.
-
- 12. P. Natarajan, A. Jegan and S. Sankar Ganesh, Mater. Res. Express. 6 (2019) 085048.
-
- 13. D. Thiemig, A. Bund, Surf. Coat. Technol. 202[13] [2008] 2976-2984.
-
- 14. B.M. Praveen and T.V. Venkatesha, Appl. Surf. Sci. 254 (2008) 2418-2424.
-
- 15. M. Adam Khan, S. Sundarrajan, and S. Natarajan, Surf. Eng. 30[9] (2014) 656-661.
-
- 16. I. Birlik, N.F. Ak Azem, M. Toparli, E. Celik, T. Koc Delice, S. Yildirim, O. Bardakcioglu, and T. Dikici, Front. Mater. 3 (2016) 46.
-
- 17. G. Yılmaz, G. Hapci and G. Orhan, J. Mater. Eng. Perform. 24 (2015) 709-720.
-
- 18. P. Baghery, M. Farzam, A.B. Mousavi, and M. Hosseini, Surf. Coat. Technol. 204[23] (2010) 3804-3810.
-
- 19. S. Saad, Z. Boumerzoug, A.L. Helbert, F. Brisset, and T. Baudin. Metals. 10[3] (2020) 406.
-
- 20. D. Wang, M. Liu, Y. Zhu, and F. Li, Coatings. 11 (2021) 1068.
-
- 21. Y.P. Zeng, C.L. Lin, H.M. Dai, Y.C. Lin, and J.C. Hung, Processes. 9[9] (2021) 1647.
-
- 22. G.A. El-Awadi, S. Abdel-Samad, and Ezzat S. Elshazly, Appl. Surf. Sci. 378 (2016) 224-230.
-
- 23. A. Encinas-Oropesa1, G.L. Drew, M.C. Hardy, A.J. Leggett, J.R. Nicholls, and N.J. Simms, Minerals, Metals Mater. Soc. 0 (2008) 609-618.
- 24. J. Tong, S. Dalby, J. Byrne, M.B. Henderson, and M.C. Hardy, Int. J. Fatigue 23[10] (2001) 897-902.
-
- 25. N. Sivashankar, R. Viswanathan, K. Periasamy R. Venkatesh, and S. Chandrakumar, Mat. Today: Procee. 37[2] (2021) 214-219.
-
- 26. S. Ramesh, R. Viswanathan, and S. Ambika, Measurement. 78 (2016) 63-72.
-
- 27. A. Kannan, R. Mohan, R. Viswanathan, and N. Sivashankar, J. Mat. Res. Tech. 9[6] (2020) 16529-16540.
-
- 28. R. Viswanathan, S. Ramesh, S. Maniraj, and V. Subburam, Measurement. 159 (2020) 107800.
-
- 29. R. Viswanathan, S. Ramesh, and V. Subburam, Measure- ment. 120 (2018) 107-113.
-
- 30. S.I. Ghazanlou, A. Shokuhfar, S. Navazani, and R. Yavari, Bulletin Mater. Sci. 39[5] (2016) 1185-1195.
-
- 31. Y. Yang and Y.F. Cheng, Surf. Coat. Technol. 216 (2013) 282-288.
-
- 32. K.A. Kumar, G.P. Kalaignan, and V.S. Muralidharan, Ceram. Int. 39 (2013) 2827.
-
- 33. A. Jegan and R. Venkatesan, Int. J. Min. Metall. Mat. 20[5] (2013) 479-485.
-
- 34. S. Maniraj and R. Thanigaivelan, Trans. Indian Inst. Met. 72 (2019) 3057-66.
-
- 35. C. Kollia N. Spyrellis, J. Amblard, M. Froment, and G. Maurin, J. App. Electrochem. 20 (1990) 1025-1032.
-
- 36. L. Chen, L. Wang, Z. Zeng and T. Xu, Surf. Coat. Technol. 201 (2006) 599-605.
-
- 37. Q. Li, X. Yang, L. Zhang, J. Wang and B. Chen, J. Alloys Compd. 482 (2009) 339-344.
-
- 38. A. Abdel Aal and H.B. Hassan, J. Alloys Compd. 477 (2009) 652-656.
-
- 39. P. Knutssan, H. Lai and K. Stiller, Corro. Sci. 23 (2013) 230-236.
-
- 40. K.S. Vadayar and S.D. Rani, Int. J. Appl. Res. Mech. Eng. 2[4] (2013) 223-227.
- 41. C.T. Liu, J. Ma, and X.F. Sun, J. Alloy. Compd. 491[1-2] (2010) 522-526.
-
- 42. A. Kewther, B.S. Yilbas, and M.S.J. Hashmi, J. Mat. Engg. Perf. 10 (2001) 108-113.
-
- 43. Z. Liang, Y. Gui, and Q. Zhao, Mat. Res. Exp. 7 (2020) 016548.
-
 This Article
-
2022; 23(1): 69-78
Published on Feb 28, 2022
- 10.36410/jcpr.2022.23.1.69
- Received on Oct 9, 2021
- Revised on Nov 17, 2021
- Accepted on Nov 27, 2021
Services
Shared
Correspondence to
- D.R. Joshua
-
Department of Mechanical Engineering, AVS Engineering College, Salem-636003, Tamil Nadu, India.
Tel : +7200008770 - E-mail: joshuamec@gmail.com
Clean-Energy Research Institute(CRI), Hanyang University, 222, Wangsimni-ro, Seongdong-gu, Seoul, 04763, Korea
E-mail: jcpr@hanyang.ac.kr