


- Effects of sintering temperature on the dielectric and impedance properties of phase-pure titanium dioxide ceramics
Liqi Cui, Ruifeng Niu and Weitian Wang*
Physics Department, Yantai University, China
This article is an open access article distributed under the terms of the Creative Commons Attribution Non-Commercial License (http://creativecommons.org/licenses/by-nc/4.0) which permits unrestricted non-commercial use, distribution, and reproduction in any medium, provided the original work is properly cited.
In this study, phase-pure titanium dioxide TiO2 ceramics were sintered at different temperatures (1,000, 1,100, 1,200, 1,300, 1,400 oC). The effects of sintering temperature on the compaction, dielectric and impedance properties were investigated. Frequency and temperature dependencies of dielectric permittivity and dielectric loss were revealed by using dielectric measurements. When the TiO2 ceramics sintered at 1,400 oC, it exhibits the larger dielectric constant and the smaller dielectric loss as a result of increased density and decreased porosity. The analysis of complex impedance in the frequency range 100 Hz-10 MHz indicated that the TiO2 ceramics were dielectrically combinations of bulk grains and grain boundaries. These results suggest that the sintering temperatures have effects on the microstructure, leading to the variations in dielectric and impedance properties of TiO2 ceramics
Keywords: Ceramics, Dielectric properties, Impedance analysis, Sintering temperature
Titanium dioxide (TiO2) materials are widely used in the fields of coatings, electrochromic devices [1, 2], photochemical catalysis [3, 4], photovoltaic cells [5, 6], electrochemical gas sensors and fiber waveguid [7, 8]. For many of these applications, the crystal structure, phase transition, and calcination temperature have demonstrable effects on the properties of TiO2 ceramics [9, 10]. In recent years, many researchers focus on the preparation of TiO2 microsphere [11], nanofibers [12], and nano- particles [13], and investigate the remarkable photo- catalytic behavior and improved efficiency in dye-sensitized solar cells. It has been reported that TiO2 ceramics show large dielectric constants and interesting nonlinear optical coefficients, and these properties are functions of compaction and synthesis temperature [12]. As is known, the sintering temperature has promising effects on the physical properties of transition metal oxides, especially the electrical and pore characteristics [14-16]. In addition, TiO2 ceramics have the advantages of easier processing method and lower cost as com- pared with other oxides. Therefore, the preparation of TiO2 ceramics and experimental studies on the dielectric and impedance properties are even more attractive to the researchers.
Generally, there are three different structural phases for TiO2 as rutile, anatase and brookite. Except the metastable brookite phase, the stable phase transforma- tion will occur from anatase to rutile with increasing temperature. Rutile has a more closely of the crystal accumulation, a higher refractive index and an energy band gap of 3.06 eV, which explains why it has a wide prospect in practical optical and electrical applications [17, 18]. In this study, we present the fabrication of single-phased rutile TiO2 ceramics by a traditional ceramic process, but sintered at different temperatures. The effects of temperature on the microstructures and dielectric properties were investigated. The complex dielectric properties were measured as functions of temperature and frequency. The impedance analysis in a broad frequency range was used to reveal the grain and grain boundary development with the sintering temperatures.
The TiO2 ceramics were fabricated by using TiO2 powder with a purity of 99.95% (Macklin Chemical Co. Ltd.). The powder was grinded and pressed into high-density pellets with a thickness of 5 mm and a diameter of 15 mm under a pressure of 7 MPa. The samples were sintered separately at different tempera- tures for 6 hours in air atmosphere. Throughout this paper, we assigned symbols of TO-0, TO-1, TO-2, TO-3, and TO-4 for the samples sintered at 1,000, 1,100, 1,200, 1,300 and 1,400 oC, respectively. The ceramic phases were analyzed by using x-ray diffraction (XRD) with Cu Kα radiation at 1.54 Ǻ. The bulk densities of the samples were measured by the Archimedes method. The fabricated ceramic pellets were carefully polished and subsequently pasted with conductive silver paste on both sides as electrodes for the purpose of dielectric measurements. The determination of complex dielectric responses was performed using a capacitor arrange- ment in a temperature range from 80 to 300 K. The impedance spectroscopy was examined in a frequency range from 100 Hz to 10 MHz using a LCR meter (HP4194A) with an applied signal voltage of 0.05 V.
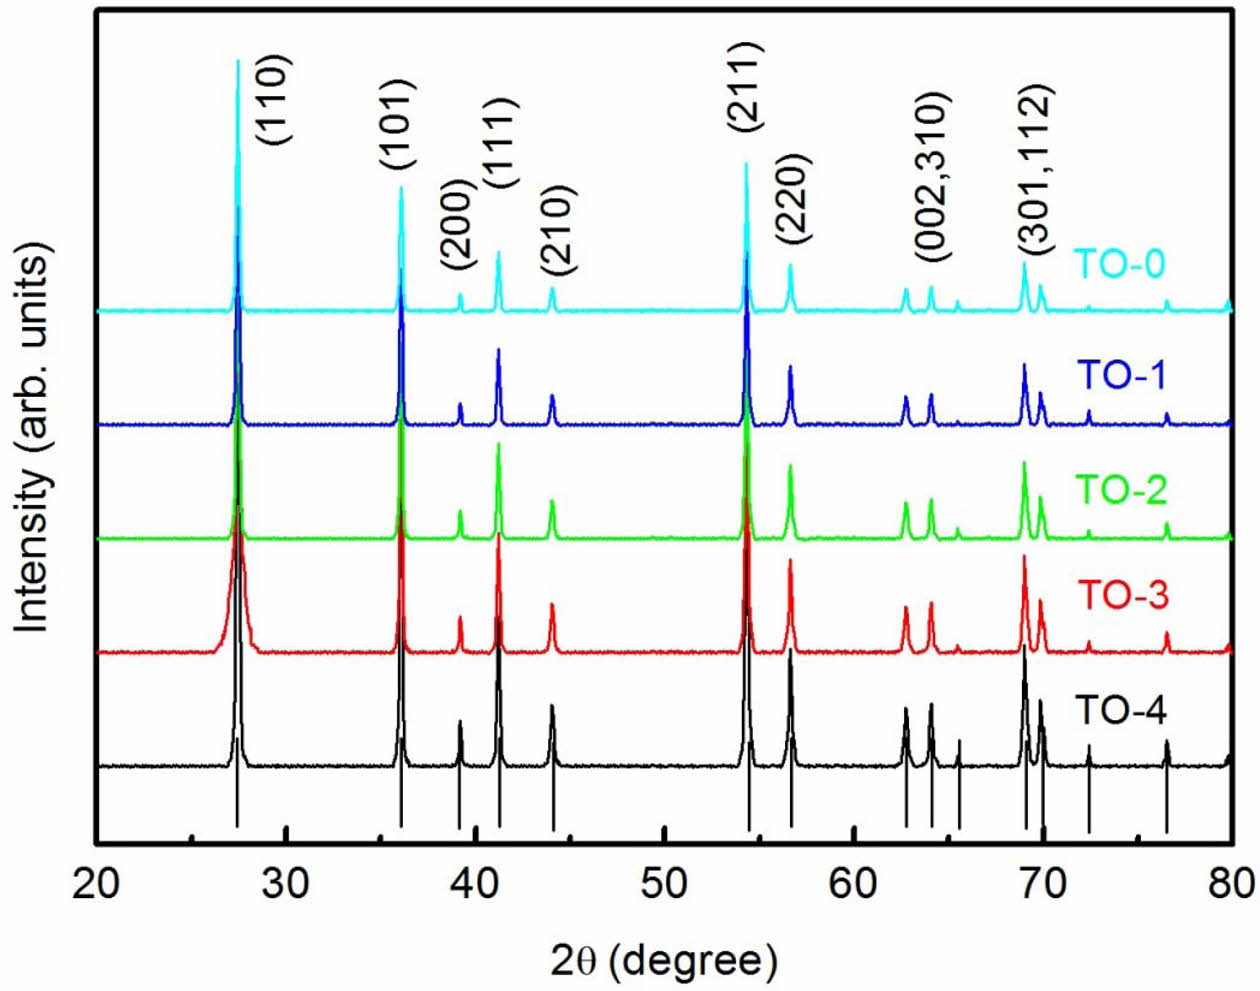
Fig. 1 displays the XRD patterns of the prepared TiO2 ceramics sintered at various temperatures. The black lines at the bottom indicate the allowed Bragg reflections, and all the peaks could be marked as a rutile phase with the space group P42/mnm. All the XRD patterns are similar and no impurity could be detected indicating the single phase of the prepared samples. The calculated lattice parameters of the rutile TiO2 ceramics are obtained to be a = 4.594 Å and c = 2.957 Å, which are similar with that of JCPDS No. 21-1276. It is obvious from Fig. 1 that the rutile TiO2 diffraction peaks become sharper and stronger as the sintering temperature improved from 1000 to 1400 oC, which suggests that the average crystalline grain grows with increase in the sintering temperature. The mean crystallite size d can be estimated according to the Scherrer’s method by the following equation [19],
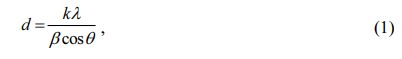
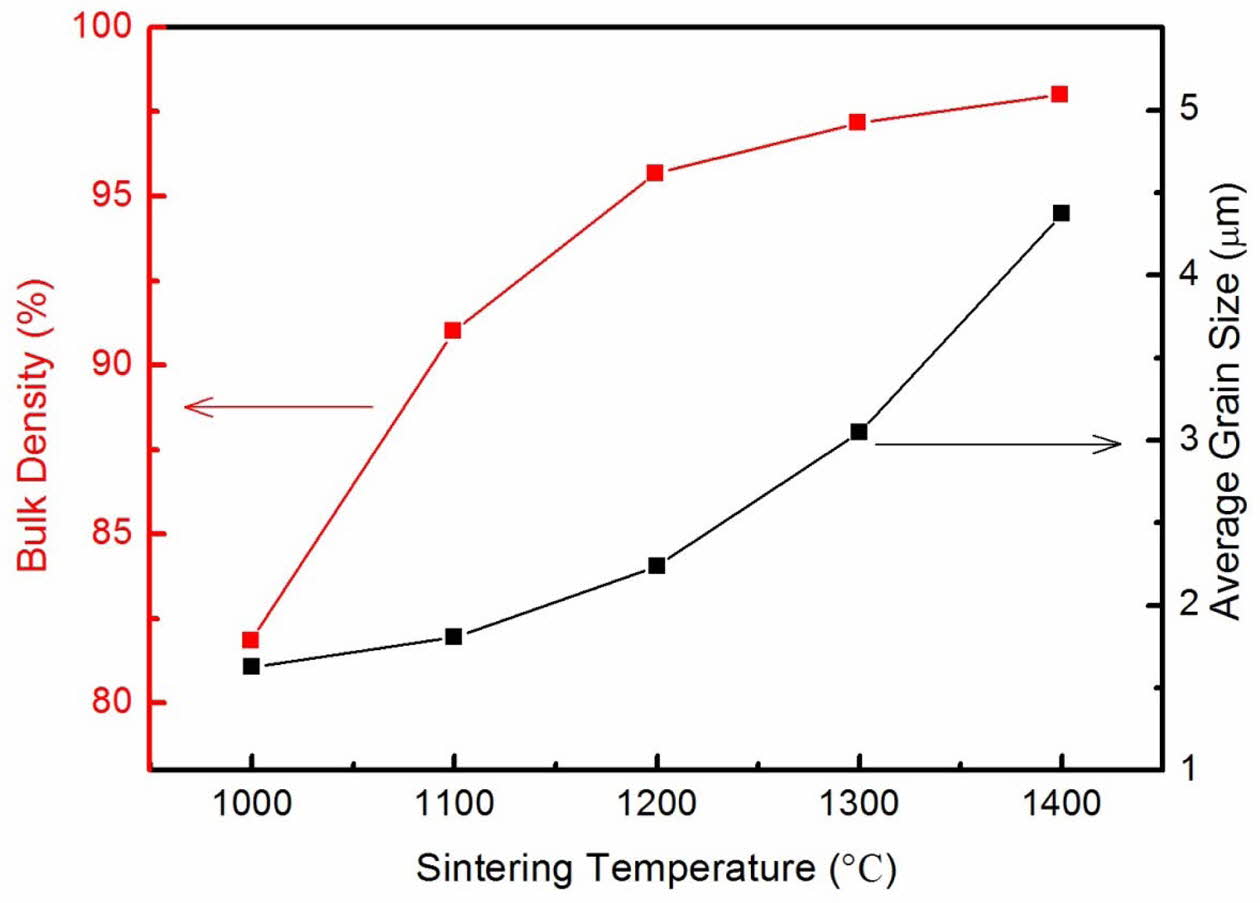
where k = 0.9 is the Scherrer constant, λ is the wave- length, and β is the full width at half maximum (FWHM) of the XRD peak at the diffraction angle θ. The average grain sizes from the characteristic peaks in the XRD patterns of the samples are shown in Fig. 2. The results suggest that mean grain size is incline to increase with the increase of sintering temperatures in the range of 1,000-1,400 oC. The grain size trend is in agreement with the reported results of other oxide ceramics [20-23].
The densification of the prepared TiO2 ceramics at various temperatures is shown in Fig. 2. In the tem- perature range of 1,000-1,400 oC, the density increases with increasing temperature as a result of the larger crystallite size and the decrease in the number of pores at higher temperature. Despite reports that further increase in the sintering temperature could lead to the decrease of the density of some multicomponent per- ovskite oxide ceramics [23, 24], this feature was not revealed in our experiment. This may be due to the fact that the sintering temperatures are not high enough to cause possible element loss since TiO2 has high melting point and thermal and chemical stability.
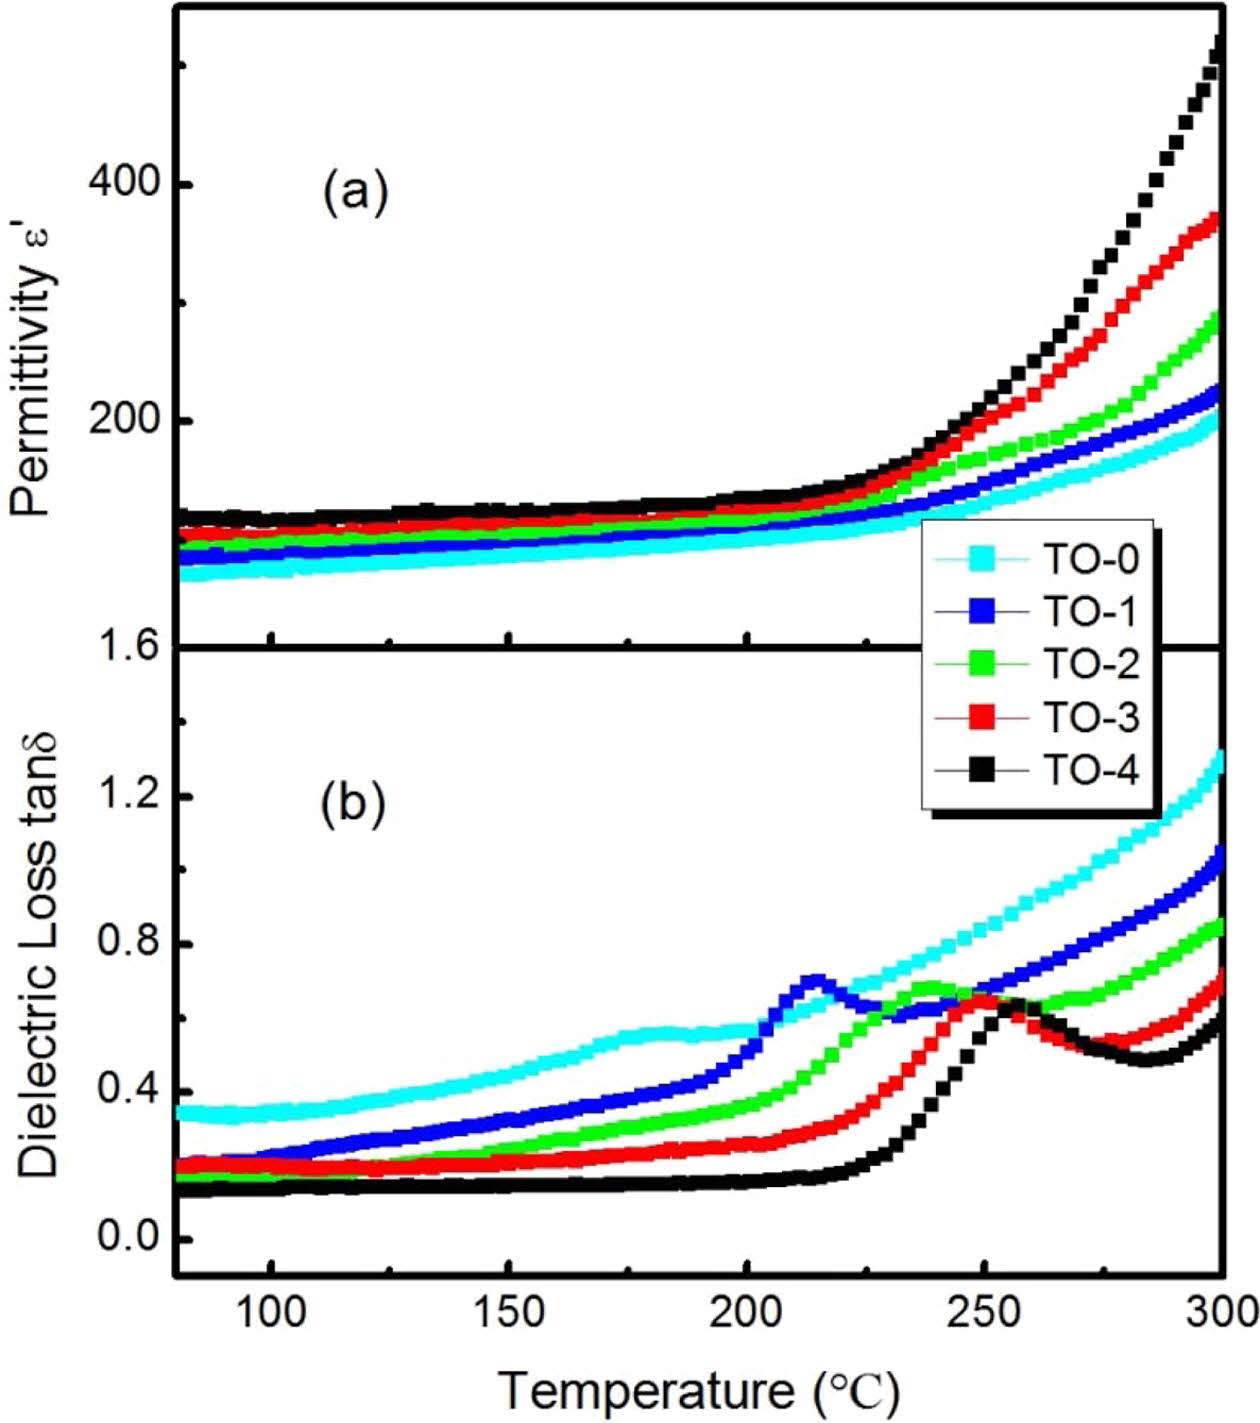
Figs. 3(a) and 3(b) show the typical variations of the real part of the complex permittivity ε' and the loss tangent tanδ at 800 KHz with different sintering tem- peratures, respectively. The values of ε' fluctuate within a narrow range in the low temperature range from 80 to 200 K. When the temperature is over 200 K, ε' increases intensively with the increasing of T. Moreover, as can be seen from Fig. 3(a), ε' of the samples sintering at higher temperature is larger than that of sintering at lower temperatures. The maximum value of ε' increases from 200 to 520 as the temperature increases from 1,000 to 1,400 oC. This can be attributed to the increasing density at higher sintering temperature shown in Fig. 2.
The values of tanδ, as shown in Fig. 3(b), increase with the increasing of measuring temperature. However, the tanδ of samples sintering at higher temperature is lower than that of sintering at lower temperatures, which is in the opposing trend of ε'. With the sintering temperature increasing, the number of pores and defects decrease, which may result in the decrease of tanδ. The results in Fig. 3 indicate that the dielectric properties of the TiO2 ceramics vary with the sintering temperature. Similar results have also been reported by other workers [25, 26].
It should be noted that the data of tanδ [Fig. 3(b)] display typical peaks in the temperature range from 80 to 300 K. The positions of tanδ peaks shift to higher temperatures as the sintering temperature increases. Generally, the peaks of tanδ indicate distinct diffused transitions which possibly come from the crystal grain and grain boundary effects in polycrystalline ceramics [27, 28]. Analysis of the peak positions of tanδ will reveal the different properties of thermally activated relaxations in the prepared samples.
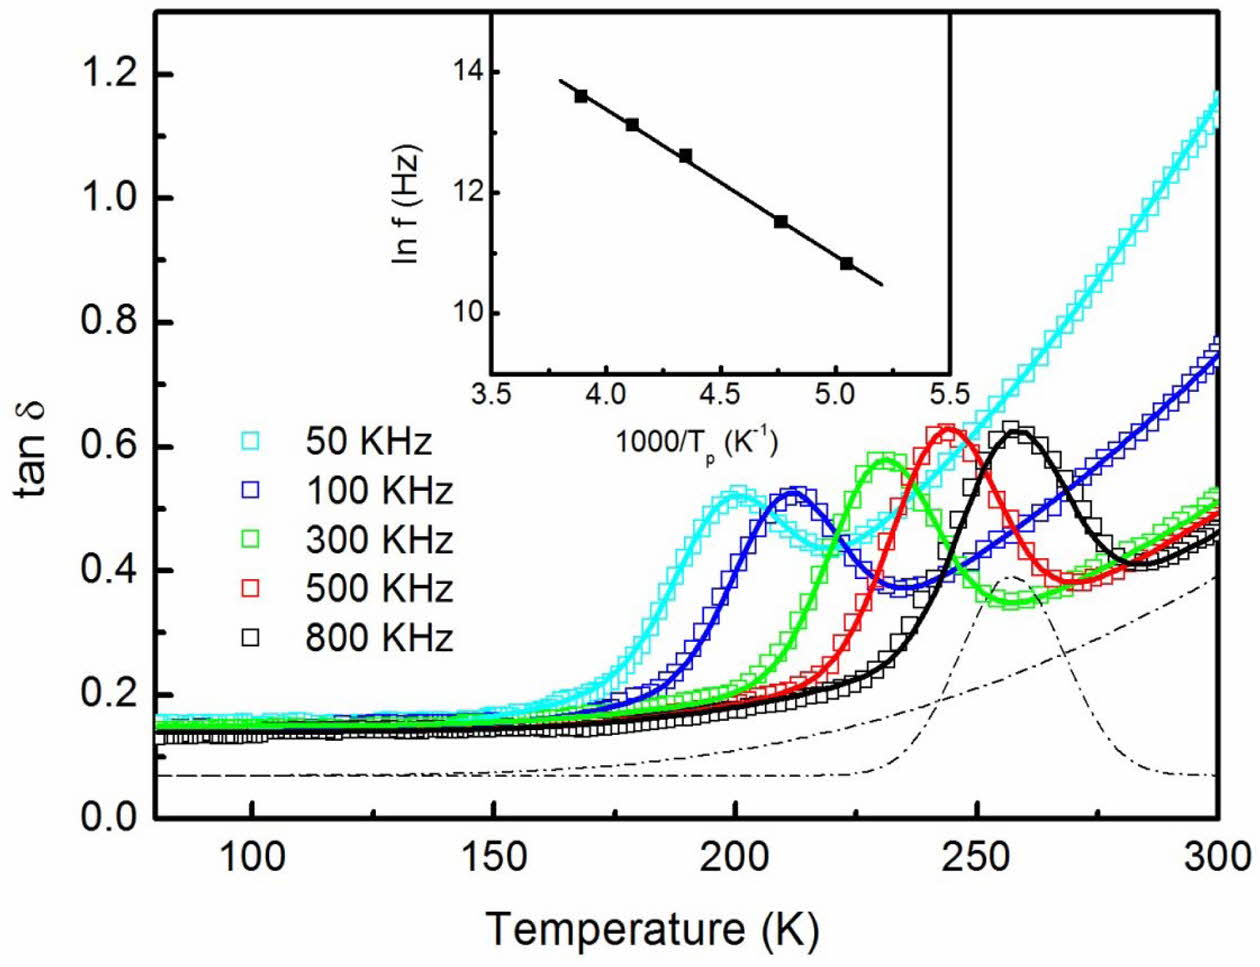
Typical temperature-dependent tanδ for sample TO-4 at different frequencies is shown in Fig. 4. The experi- mental data of tanδ can be simulated by using a Gaussian function overlying on an exponential increasing back- ground. By extracting the Gaussian function, the Gaussian peak position can be obtained accurately. The simulating Gaussian curve and background for the data at 800 KHz were shown in the plot. Tp is the Gaussian peak position. The solid curves are the fitting results. The experimental data agree well with the theoretical simulation.
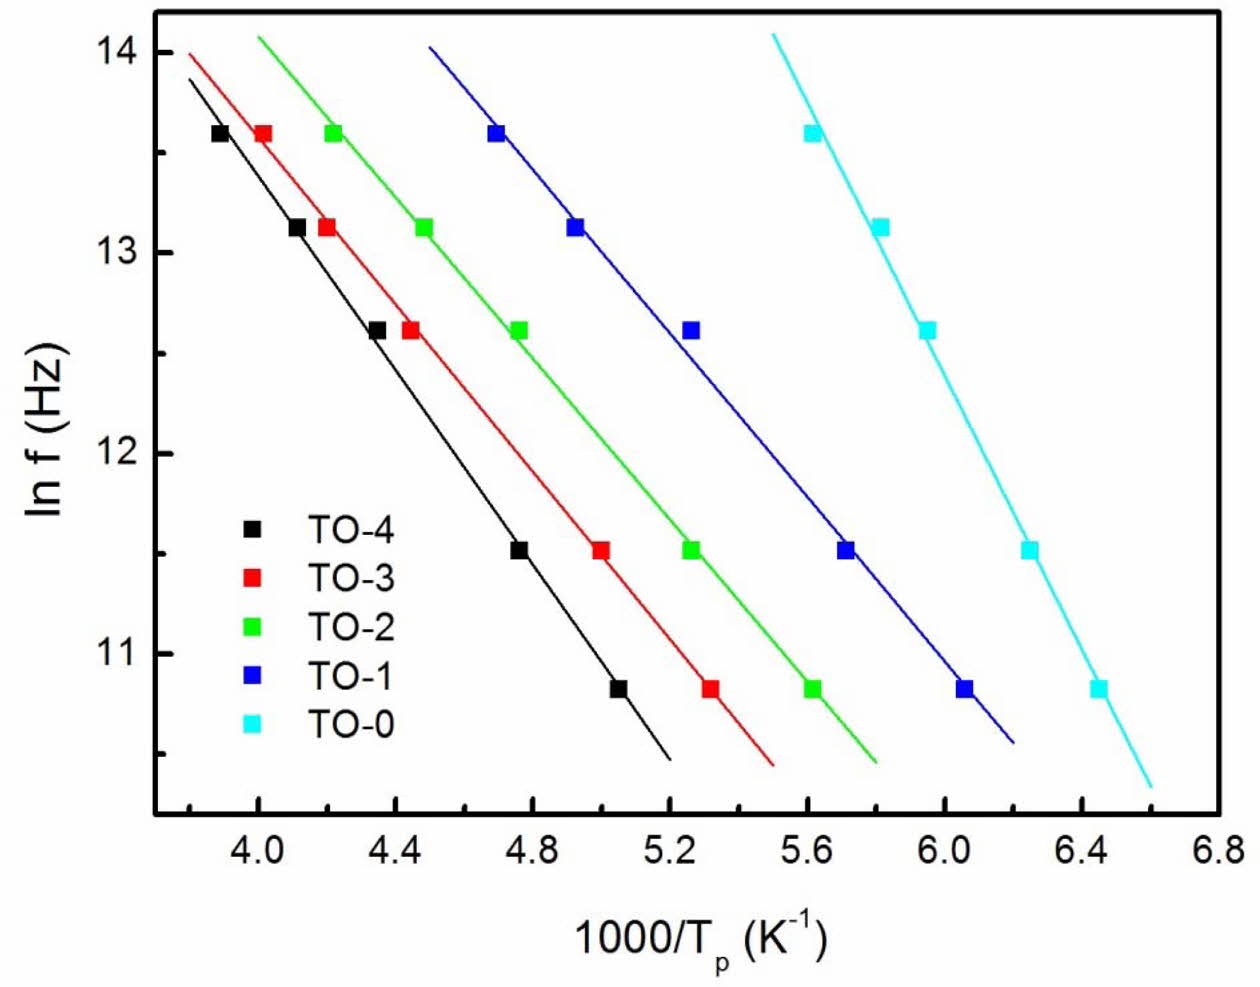
During common thermally activated relaxation process, the Arrhenius relationship can be used to describe the relaxation time, which can be expressed as
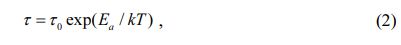
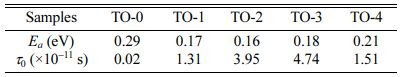
where t is the relaxation time, t0 is the preexponential factor, Ea is the activation energy and k is the Boltzmann constant. When T = Tp, the equation ln(2p f t0) + Ea/kTP = 0 should be satisfied. The linear relationship between ln ( f ) and 1/Tp is shown in the inset of Fig. 4. The determined Ea and t0 for the sample TO-4 were 0.21 eV and 1.51 × 10⁻¹¹ s, respectively. Similar measurements were performed on the other samples, and similar results were obtained (not shown here). The Arrhenius plots for all the samples are shown in Fig. 5. The deter- mined Ea and t0 for all the samples are given in Table 1. The different values indicate the influence of sintering temperature on the thermally activated relaxations in the prepared samples.
Generally, the oxide polycrystalline ceramics are dielectrically heterogeneous, and usually have at least three components contributing to the dielectric effects [29]: the crystal grains, grain boundaries, and electrodes. Impedance analysis is often used to reliably demonstrate the different dielectric processes. The most common equivalent circuit used to describe the dielectric responses of polycrystalline ceramics can be assumed a series association composed of parallel connection of a resistor R and a capacitor C. Each parallel RC element will bring about a semicircle in the complex plane. According to the impedance spectroscopy analysis method [29, 30], the complex impedance Z* is defined as
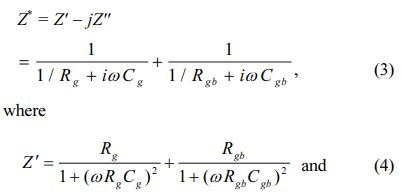
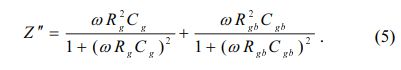
The subscripts g and gb denote the bulk grains and grain boundaries, respectively. Different components in these types of materials have different relaxation frequency f. Under normal conditions, the f of the crystal grains is often at least two orders of magnitude higher than that of the grain boundaries. Then two separate semicircles will be shown on the impedance spectra.
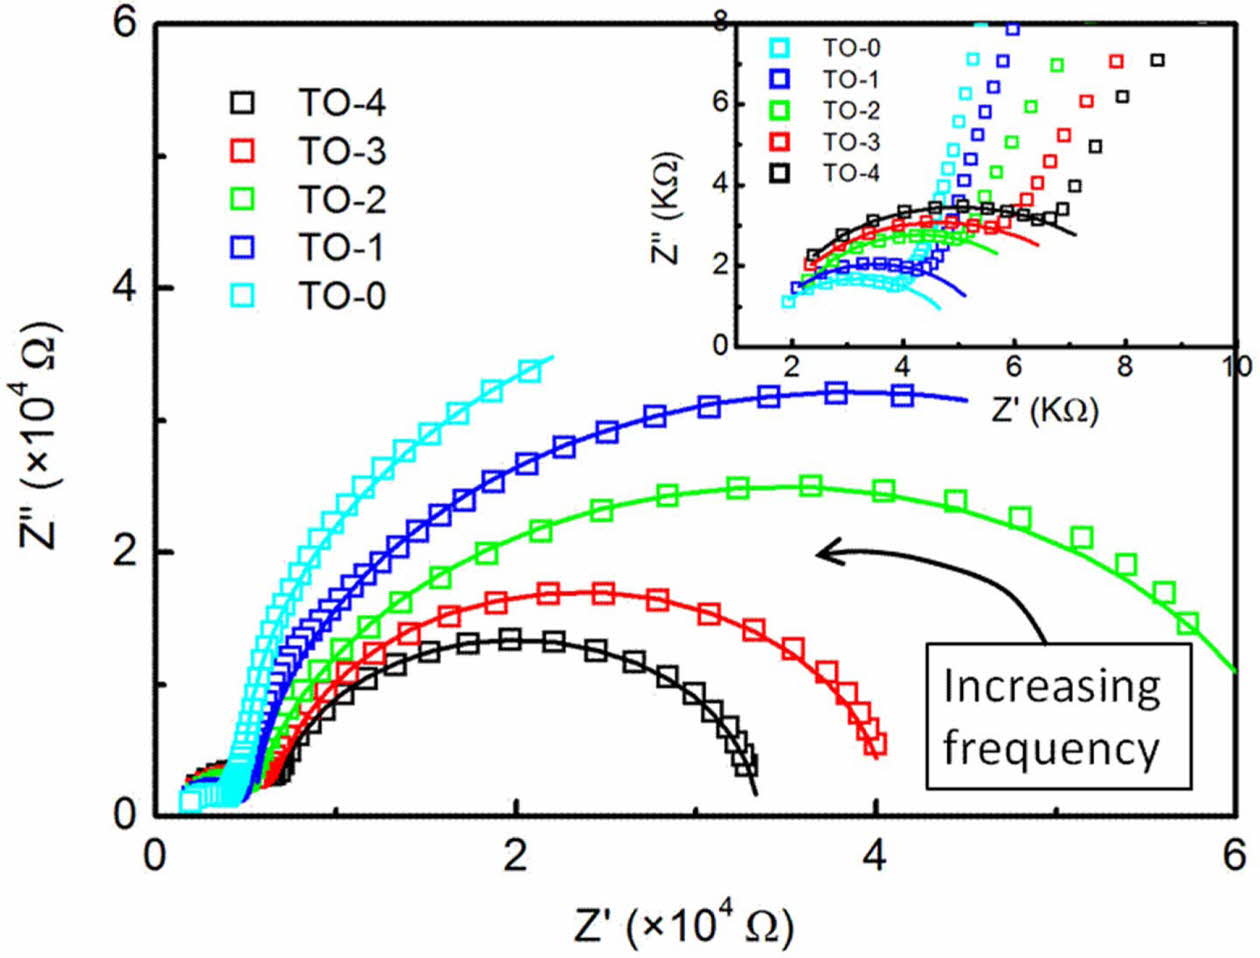
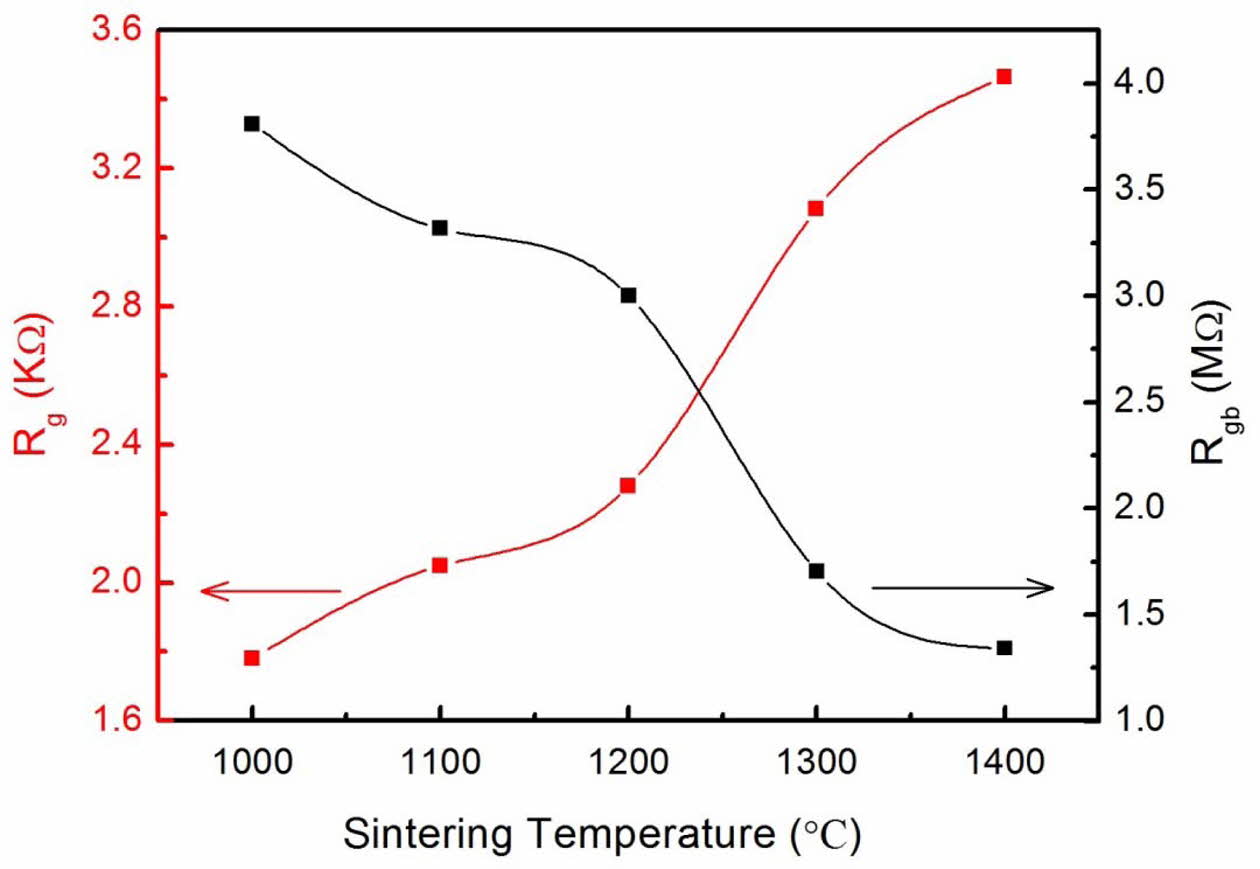
Fig. 6 shows Z'' versus Z' plots for TiO2 samples sintered at different temperatures in the frequency range of 100 Hz-10 MHz at room temperature. The inset shows an enlarged view of the complex impedance at high frequencies. The solid curves are the theoretical fits using equation (3). The dielectric responses from grains and grain boundaries in TiO2 ceramics are responsible for the observed two arcs from left (high) to right (low) frequencies, respectively. It is clear from Fig. 6 that the arcs at high frequencies become larger with the sintering temperature increasing, as shown in the inset of Fig. 6, while those at low frequencies are getting smaller. Since the semicircles in the impedance plane related to the resisitances of the different parts in the samples, the variation of the semicircle size suggests the change of Rg and Rgb. The deduced Rg and Rgb values versus the sintering temperatures are plotted in Fig. 7. The resistance of intrinsic grains increases with the increasing sintering temperature, while that of grain boundaries decrease monotonously for the TiO2 samples. This is due to the fact that the grain size tends to increase while the porosity in the samples tends to decrease with sintering temperatures. All the results suggest the influence of sintering temperatures on dielectric properties of TiO2 ceramics.
|
Fig. 1 XRD data for the prepared samples sintered at different temperatures. |
|
Fig. 2 Changes of density and average grain size with sintering temperature for the TiO2 ceramics. |
|
Fig. 3 Temperature dependence of (a) ε' and (b) tanδ at 800 KHz for the prepared samples sintered at different temperatures. |
|
Fig. 4 Typical temperature dependence of tanδ for the sample TO4 at different frequencies. Dashed lines are Gaussian and exponential functions fitting for the experimental data at 800 KHz. The solid curves are the fitting results. The inset shows the relationship between ln (f) and 1/Tp for the sample TO-4. |
|
Fig. 5 Arrhenius plots of lnf with inverse of temperature for the prepared samples. |
|
Fig. 6 mpedance Z'' vs. Z' plots for the samples. The inset displays an enlarged view of the complex impedance at high frequencies. The solid curves are the fitting results. |
|
Fig. 7 Variations of Rg and Rgb with the sintering temperatures |
Rutile TiO2 ceramics were prepared at different tem- peratures and the effects of the sintering temperature on the dielectric and impedance properties were studied. With increasing the sintering temperature, both the density and the crystalline size increased, while the porosity decreased. The dielectric properties of the TiO2 ceramics are affected by the sintering temperature. The maximum value of dielectric permittivity ε' increases as the sintering temperature increases from 1000 to 1,400 oC, but the values of tanδ develop in the opposing trend. The complex impedance spectroscopy indicates that the heterogeneous structures exist in the TiO2 ceramics consisting of grains and grain boundaries. The typical semicircle arcs at high and low frequencies vary with the sintering temperature, which suggests the effects of the sintering temperature on the grains and grain boundaries of TiO2 ceramics.
- 1. M. Mosaddeq-ur-Rahman, G. Yu, T. Soga, T. Jimbo, H. Ebisu, and M. Umeno, J. Appl. Phys. 88 (2000) 4634-4641.
-

- 2. C.C. Hsieh, K.H. Wu, J.Y. Juang, T.M. Uen, J.-Y. Lin, and Y.S. Gou, J. AppI. Phys. 92 (2002) 2518-2523.
-
- 3. Y. Paz, Z. Luo, L. Rabenberg, and A. Heller, J. Mater. Res. 10 (1995) 2842-2848.
-
- 4. C.G. Granqvist, Sol. Energy Mater. Sol. Cells 60 (2007) 201-262.
-
- 5. Y.-S. Song, M.-H. Lee, B.-Y. Kim, and D.Y. Lee, J. Ceram. Process. Res. 20 (2019) 182-186.
- 6. S.Y. Huang, G. Schlichthörl, A.J. Nozik, M. Grätzel, and A.J. Frank, J. Phys. Chem. B 101 (1997) 2576-2582.
-
- 7. M. Ferroni, M.C. Carotta, V. Guidi, G. Martinelli, F. Ronconi, O. Richard, D. Van Dyck, and J. Van Landuyt, Sensors and Actuators B: Chemical 68 (2000) 140-145.
-
- 8. A. Ito, H. Masumoto, and T. Goto, Mater. Trans. 44 (2003) 1599-1603.
-
- 9. J.L. Look, and C.F. Zukoski, J. Am. Ceram. Soc. 75 (1995) 1587-1595.
-
- 10. C.J. Barbe, F. Arendse, P. Comte, M. Jirousek, F. Lenzmann, V. Shklover, and M. Gratzel, J. Am. Ceram. Soc. 80 (1997) 3157-3171.
-
- 11. H. Sutrisno, and Sunart, J. Ceram. Process. Res. 18 (2017) 378-384.
- 12. Y.-S. Song, S. Son, D.Y. Lee, M.-H. Lee, and B.-Y. Kim, J. Ceram. Process. Res. 17 (2016) 1197-1201.
- 13. H.S. Lee, S.M. Koo, and J.W. Yoo, J. Ceram. Process. Res. 13 (2012) s300-s303.
- 14. F. Meng, Mat. Sci. Eng. B 117 (2005) 77-80.
-
- 15. A. Ruiz, G. Dezanneau, J. Arbiol, A. Cornet, and J.R. Morante, Thin Solid Films 436 (2003) 90-94.
-
- 16. W. Yan, N. Li, and B. Han, J. Ceram. Process. Res. 11 (2010) 388-391.
- 17. L. Hai, D. Ying, J. Le-yong, Int. J. Min. Met. Mater. 16 (2009) 592-597.
- 18. K.H. Soon, K.S. Moon, K.S. Hyun, K.Y. Jae, C.H. Young, and H. William, Am. Mineral. 77 (1992) 545-557.
- 19. U. Holzwarth, and N. Gibson, Nat. Nanotechnol. 6 (2011) 534-534.
-
- 20. Y.-S. Hong, H.-B. Park, and S.-J. Kim, J. Eur. Ceram. Soc. 18 (1998) 613-619.
-
- 21. T.-Y. Chen, S.-Y. Chu, and Y.-D. Juang, Sensor. Actuat. A: Physical 102 (2002) 6-10.
-
- 22. S.-Y. Chu, T.-Y. Chen, and I.-T. Tsai, Integr. Ferroelectr. 58 (2003) 1293-1303.
-
- 23. R. Yimnirun, R. Tipakontitikul, and S. Ananta, Int. J. Mod. Phys. B 20 (2006) 2415-2424.
-
- 24. Y. Chen, and Y. Chang, Ferroelectrics 383 (2009) 183-190.
-
- 25. L.B. Kong, W. Zhu, and O.K. Tan, Mater. Lett. 42 (2000) 232-239.
-
- 26. A. Bouzid, E. Bourim, M. Gabbay, and G. Fantozzi, J. Eur. Ceram. Soc. 25 (2005) 3213-3221.
-
- 27. M. Adamczyk, Z. Ujma, and M. Pawełczyk, J. Mater. Sci. 41 (2006) 5317-5322.
-
- 28. W. Wang, B. Xu, P. Gao, W. Zhang, and Y. Sun, Solid State Commun. 177 (2014) 7-9.
-
- 29. D.C. Sinclair and A.R. West, J. Mater. Sci. 29 (1994) 6061-6068.
-
- 30. D.C. Sinclair and A.R. West, J. Appl. Phys. 66 (1989) 3850-3856.
-
 This Article
-
2022; 23(1): 57-61
Published on Feb 28, 2022
- 10.36410/jcpr.2022.23.1.57
- Received on Oct 3, 2021
- Revised on Nov 30, 2021
- Accepted on Dec 4, 2021
Services
Shared
Correspondence to
- Weitian Wang
-
Physics Department, Yantai University, China
Tel : +86 13573512787 - E-mail: wtwang@ytu.edu.cn
Clean-Energy Research Institute(CRI), Hanyang University, 222, Wangsimni-ro, Seongdong-gu, Seoul, 04763, Korea
E-mail: jcpr@hanyang.ac.kr