


- Mn-doped TiO2 via the sol-microwave process: Physicochemical properties and photocatalytic performance
Hao Huy Nguyena,*, Gobinda Gyawalib,c,* and Bhupendra Joshib,*
aFaculty of Applied Sciences, Ton Duc Thang University, Ho Chi Minh City, Vietnam
bDepartment of Fusion Science and Technology, Sun Moon University, Asan, 31460, Korea
cResearch Center for Eco Multi-Functional Nano Materials, Sun Moon University, Asan, 31460, KoreaThis article is an open access article distributed under the terms of the Creative Commons Attribution Non-Commercial License (http://creativecommons.org/licenses/by-nc/4.0) which permits unrestricted non-commercial use, distribution, and reproduction in any medium, provided the original work is properly cited.
Mn-doped TiO2 nanomaterials were synthesized via the sol-microwave process. The microwave was used instead of the gel formation step in a conventional sol-gel method to shorten the reaction time. The physicochemical properties of the samples were evaluated by using respective modern characterization tools. The Mn-doping on TiO2 nanomaterial significantly improved the physical and chemical properties of the samples. Similarly, the outcome revealed the enhancement in photocatalytic performance of the Mn-doped TiO2. The efficient separation of photoelectron-hole pairs and increased light absorption ability in the UV and visible regions are the major reasons to improve the photocatalytic performance of the Mn-doped TiO2 for methylene blue degradation compared to the undoped materials
Keywords: Sol-microwave, Mn-doped TiO2, photocatalyst, Methylene blue
TiO2 nanomaterials are currently considered as the standard reference catalysts in the field of photocatalysis; however, the large band gap energy (3.0-3.2 eV) of pristine TiO2 may constrain its photocatalytic perfor- mance. At such higher band gap energies, the excitation of electrons in the valence band is only possible under ultraviolet irradiation, which accounts for about 5% of the solar spectrum [1]. Reducing Ti4+ into Ti3+ ions and creating oxygen vacancies on the surface of TiO2 by using NaBH4, CaH2, and metals (Al, Mg, Zn, and Li) as reducing agents have shown an improved optical absorption [2-4]. The non-stoichiometric reduced TiO2 can also be prepared by calcining white TiO2 under high pressure in the Ar, N2, or H2 atmosphere [5]. The appearance of Ti3+ and oxygen vacancy defects are associated with the formation of mid-gap states on the band gap structure of the synthesized TiO2, leading to enhancing the visible light response. However, these methods often require harsh experimental conditions that are time-consuming and require expensive facilities affecting their practical application.
Transition metal doping is also an efficient approach to engineer the electronic structure of TiO2. Moreover, doping is more preferred over reducing the TiO2 due to the simple synthesis process. In the doping method, dopant ions might incorporate into the crystal lattice or intercalate in the interlayer spaces of TiO2 structures [6]. Mn doping in TiO2 might form intermediate bands, unlike other 3d metals doping, and possesses more sig- nificant curvature. Therefore, the charge carrier mobility increases [7], reducing the recombination of electrons and holes in Mn-doped TiO2. The unique properties of Mn-TiO2 have been reported in the literature. For example, Akshay et al. [8] investigated that the presence of Mn as an impurity at the TiO2 lattice led to the establishment of new energy levels or mid gap states inside the forbidden band gap. These new energy levels serve as the barriers to hinder the recombination of photoelectrons and holes, thus enhancing the photo- catalytic activities of the TiO2 photocatalyst. Also, the authors [9-11] demonstrated the extension of light absorption ability of the TiO2 in the visible region after Mn doping, thereby improving the catalytic performance on the degradation of a reference pollutant, methylene blue (MB) dye. Although mentioned reports have tried to explain the changes in the physicochemical properties of Mn-TiO2, a detailed study is still lacking to clarify the effects of Mn on the doping process.
Mn-TiO2 can be synthesized in many ways, including the sol-gel method, hydrothermal treatment, and tem- plating synthesis. Among these strategies, the sol-gel route has paid much attention due to its simple fabri- cation process. However, the process is usually time-consuming in the gel formation, about 24 h [7]. In this study, Mn-doped TiO2 samples were synthesized via a sequential process of sol step followed with the microwave treatment. The replacement of the gel step by the microwave treatment is to shorten the reaction time from 24 h to 5 min.
Materials
Titanium butoxide (purity 97%), manganese (II) acetylacetonate, and isopropanol were purchased from Sigma-Aldrich and Hayman Limited. All materials were used without any further treatments.
Synthesis of TiO2 nanostructures
Firstly, 0.152 g of Mn (II) acetylacetonate was dissolved in 30 mL distilled water in a beaker, labeled as A. Secondly, 4.08 g of titanium butoxide was added slowly to 60 mL of isopropanol under magnetic stirring for 10 min at 1000 rpm to form a clear solution, labeled as B. Next, solution A was dripped slowly into solution B. Then, the mixture was stirred at 1000 rpm for 30 min at room temperature.
The above mixture was then undergone a microwave treatment at 150 oC, 195 W, 600 rpm for 5 min. After cooling, the resultant product was washed with distilled water several times. Finally, the sample was dried at 100 oC overnight and heated at 450 oC for 2 h to obtain Mn-TiO2.
The same process was conducted to prepare un-doped TiO2 except the Mn precursor and denoted as TiO2.
Characterization
The crystallinity and structure of photocatalysts were analyzed by powder X-ray diffraction (XRD) using Rigaku X-ray diffractometer at a scan rate of 4o/min in 2θ with Cu Kα radiation (λ=1.54 Å). The morphology of the as-prepared samples was observed by scanning electron microscope (SEM, JEM-2100F, Jeol). Raman spectra were recorded by Raman spectrometer (Horiba, LabRam, HR 800) coupled to an Olympus BX41 optical microscope. X-ray photoelectron spectra (XPS) of the products were collected using an X-ray monochromator XR5 Gun-500 µm from Thermo Scientific. Photolumine- scence (PL) measurement was determined with an FLS 980 spectrophotometer (Edinburg Instruments, UK) fitted with the standard red PMT detector (Hamamatsu). The light absorbance intensity of MB at various intervals during the photocatalytic evaluation and band gap values were measured by UV-Vis double beam spectrophoto- meter (Scinco, Mega-2100) and UV-vis-NIR spectro- photometer (DRS, UV-Vis spectrophotometer NIR JASCO 570), respectively. After photocatalysis, the total organic carbon (TOC) in the aliquot was analyzed by TOC-L CPH/CPN (Shimadzu).
Photocatalytic degradation of methylene blue
Thephotocatalytic activity of the prepared samples was evaluated by the degradation of methylene blue (MB) aqueous solution under simulated solar light irradiation. In a typical experimental process, 0.05 g of photocatalytic powder was mixed with 50 mL of an aqueous MB solution (20 ppm). The mixture was then magnetically stirred in the dark for 30 min to establish the absorption-desorption equilibrium between the MB and photocatalyst surface under ambient atmospheric conditions. Following that, the mixture was irradiated under the simulated solar light source for 150 min. The photocatalytic activity of samples was measured based on the change in the MB concentration at the given irradiation time intervals.
Physicochemical properties
Phase analysis
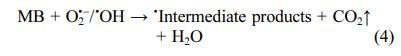
Fig. 1 shows the XRD patterns of samples. The P25 exhibited the presence of both anatase and rutile phases, as indicated in the XRD spectrum. However, the rutile phase was not observed in the TiO2 and Mn-TiO2 samples. As can be seen, there is a slight shift of the anatase phase main peak towards a higher angle, which might be due to the Mn doping effect into the TiO2. No further impurity peaks are appeared in the XRD patterns, indicating the effectiveness of the doping process for the preparation of the doped TiO2 nanomaterials in a shortened reaction time.
The average crystallite size of TiO2 and Mn-TiO2, derived by the Scherrer equation [12-15], is 7.4 nm and 6.1 nm, respectively. A slight decrease in the average crystallite size of Mn-TiO2 compared with TiO2 can be correlated with the Mn doping process that inhibited crystallite size growth.
Morphology and elemental analysis
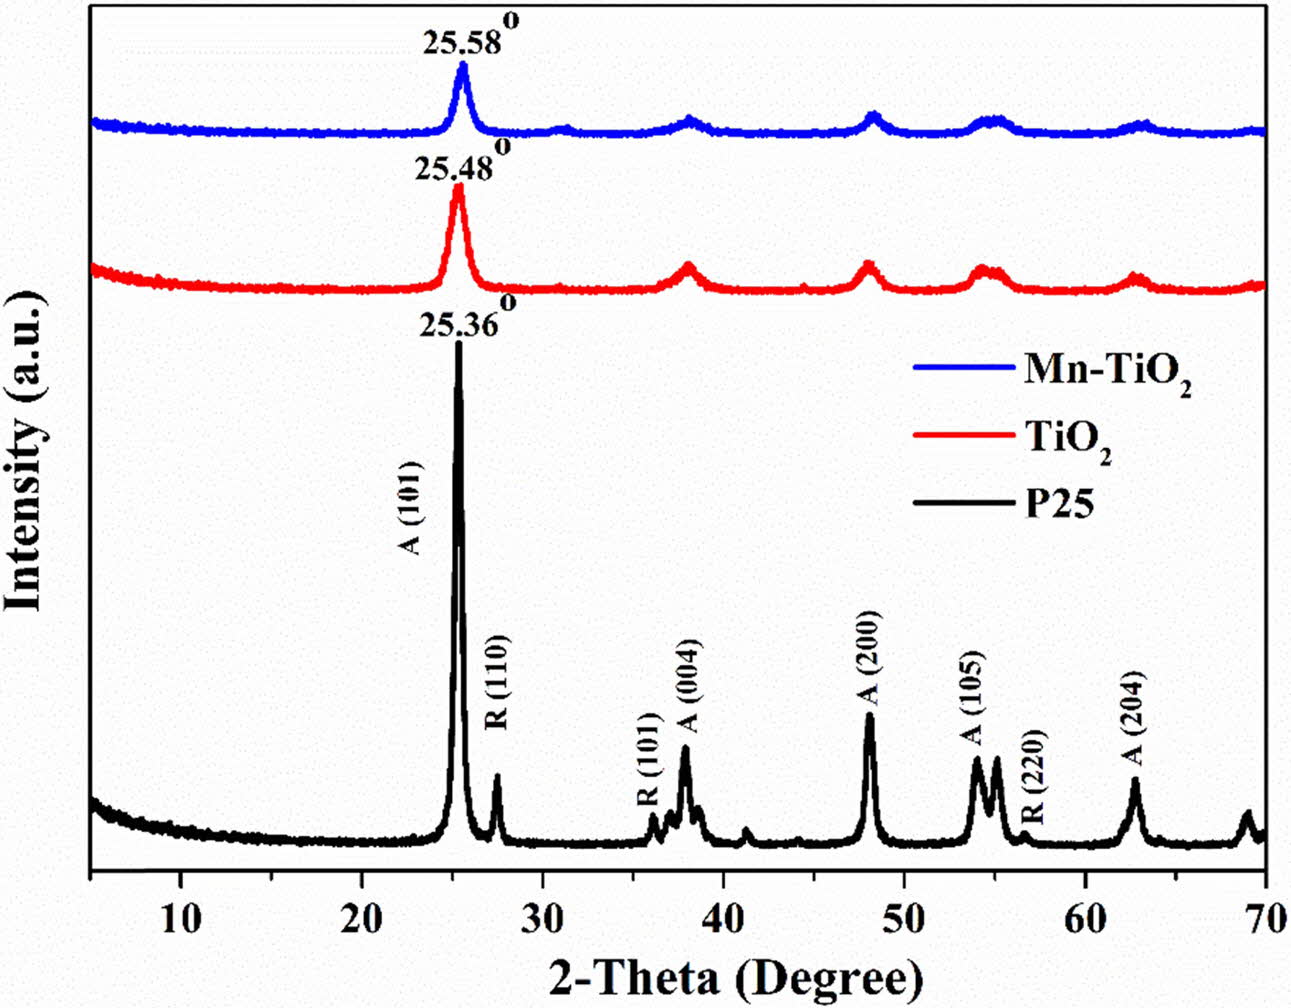
The FESEM images, elemental mapping, and EDS spectrum of Mn-TiO2 samples are displayed in Fig. 2. The FESEM images indicate the high agglomeration of TiO2 and Mn-TiO2 nanoparticles. As suggested from Scherrer’s calculation of the crystallite size, the dimension of nanoparticles is very small, and difficult to obtain the actual morphology by FESEM. Thus, a highly agglomerated morphology was observed due to the intrinsic nature of the nanoparticles and their surface energy. Thus, the actual morphology and particle size information could not be confirmed from the FESEM images. However, the EDS spectrum confirmed the existence of Mn, Ti, and O elements in Mn-TiO2 powder. Hence, the experimental characterization suggests that the Mn has been successfully incorporated into the TiO2.
Raman analysis
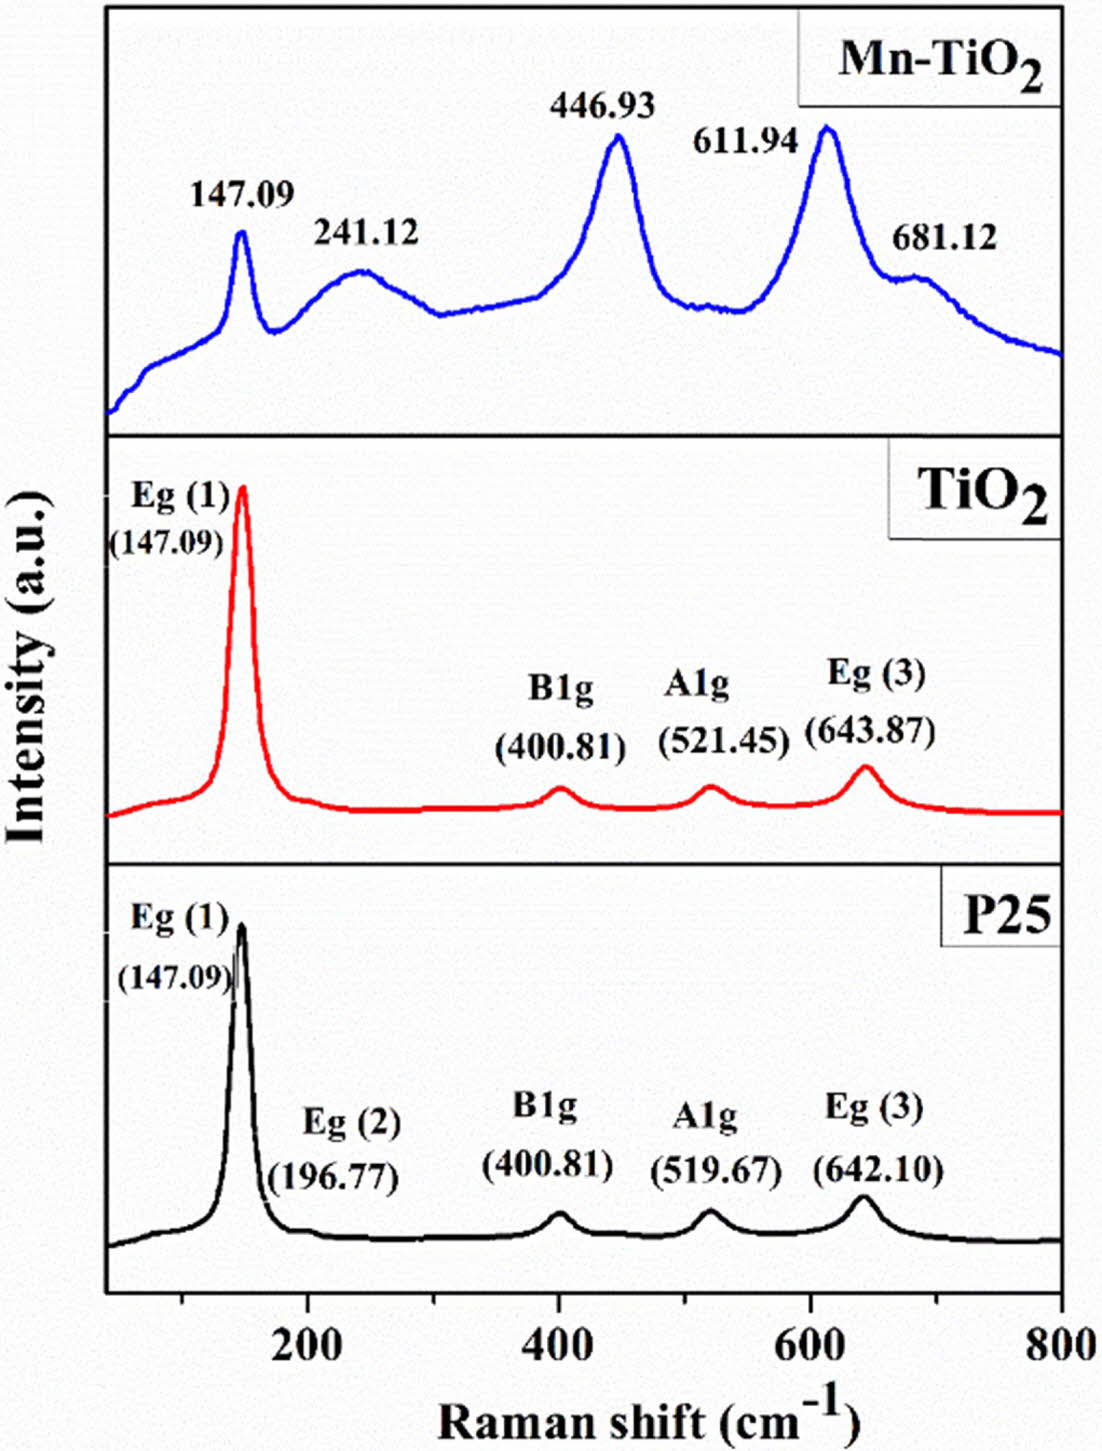
Raman spectra of the samples were analyzed to investigate the effects of Mn doping on the TiO2 lattice structure, as shown in Fig. 3. There are four Raman active vibrational modes of P25 represented for the anatase phase, which are assigned to Eg(1) (147.09 cm-1), Eg(2) (196.77 cm-1), A1g (519.67 cm-1), and Eg(3) (642.10 cm-1), and a peak at 400.81 cm-1 (B1g) of the rutile phase. However, the Eg(2) mode is not observed for TiO2, probably due to the reduction of the crystallinity of the sample. In Mn-TiO2, the peaks of B1g, A1g, and Eg(3) modes shifted markedly toward the higher wavenumber, which may relate to the generation of defects such as oxygen vacancy and Ti3+ state. The formation of defects is consistent with the decrease in the number of Ti-O bonds, thereby changing the lattice characteristic of the Mn-TiO2 [8].
Binding energies and oxidation states
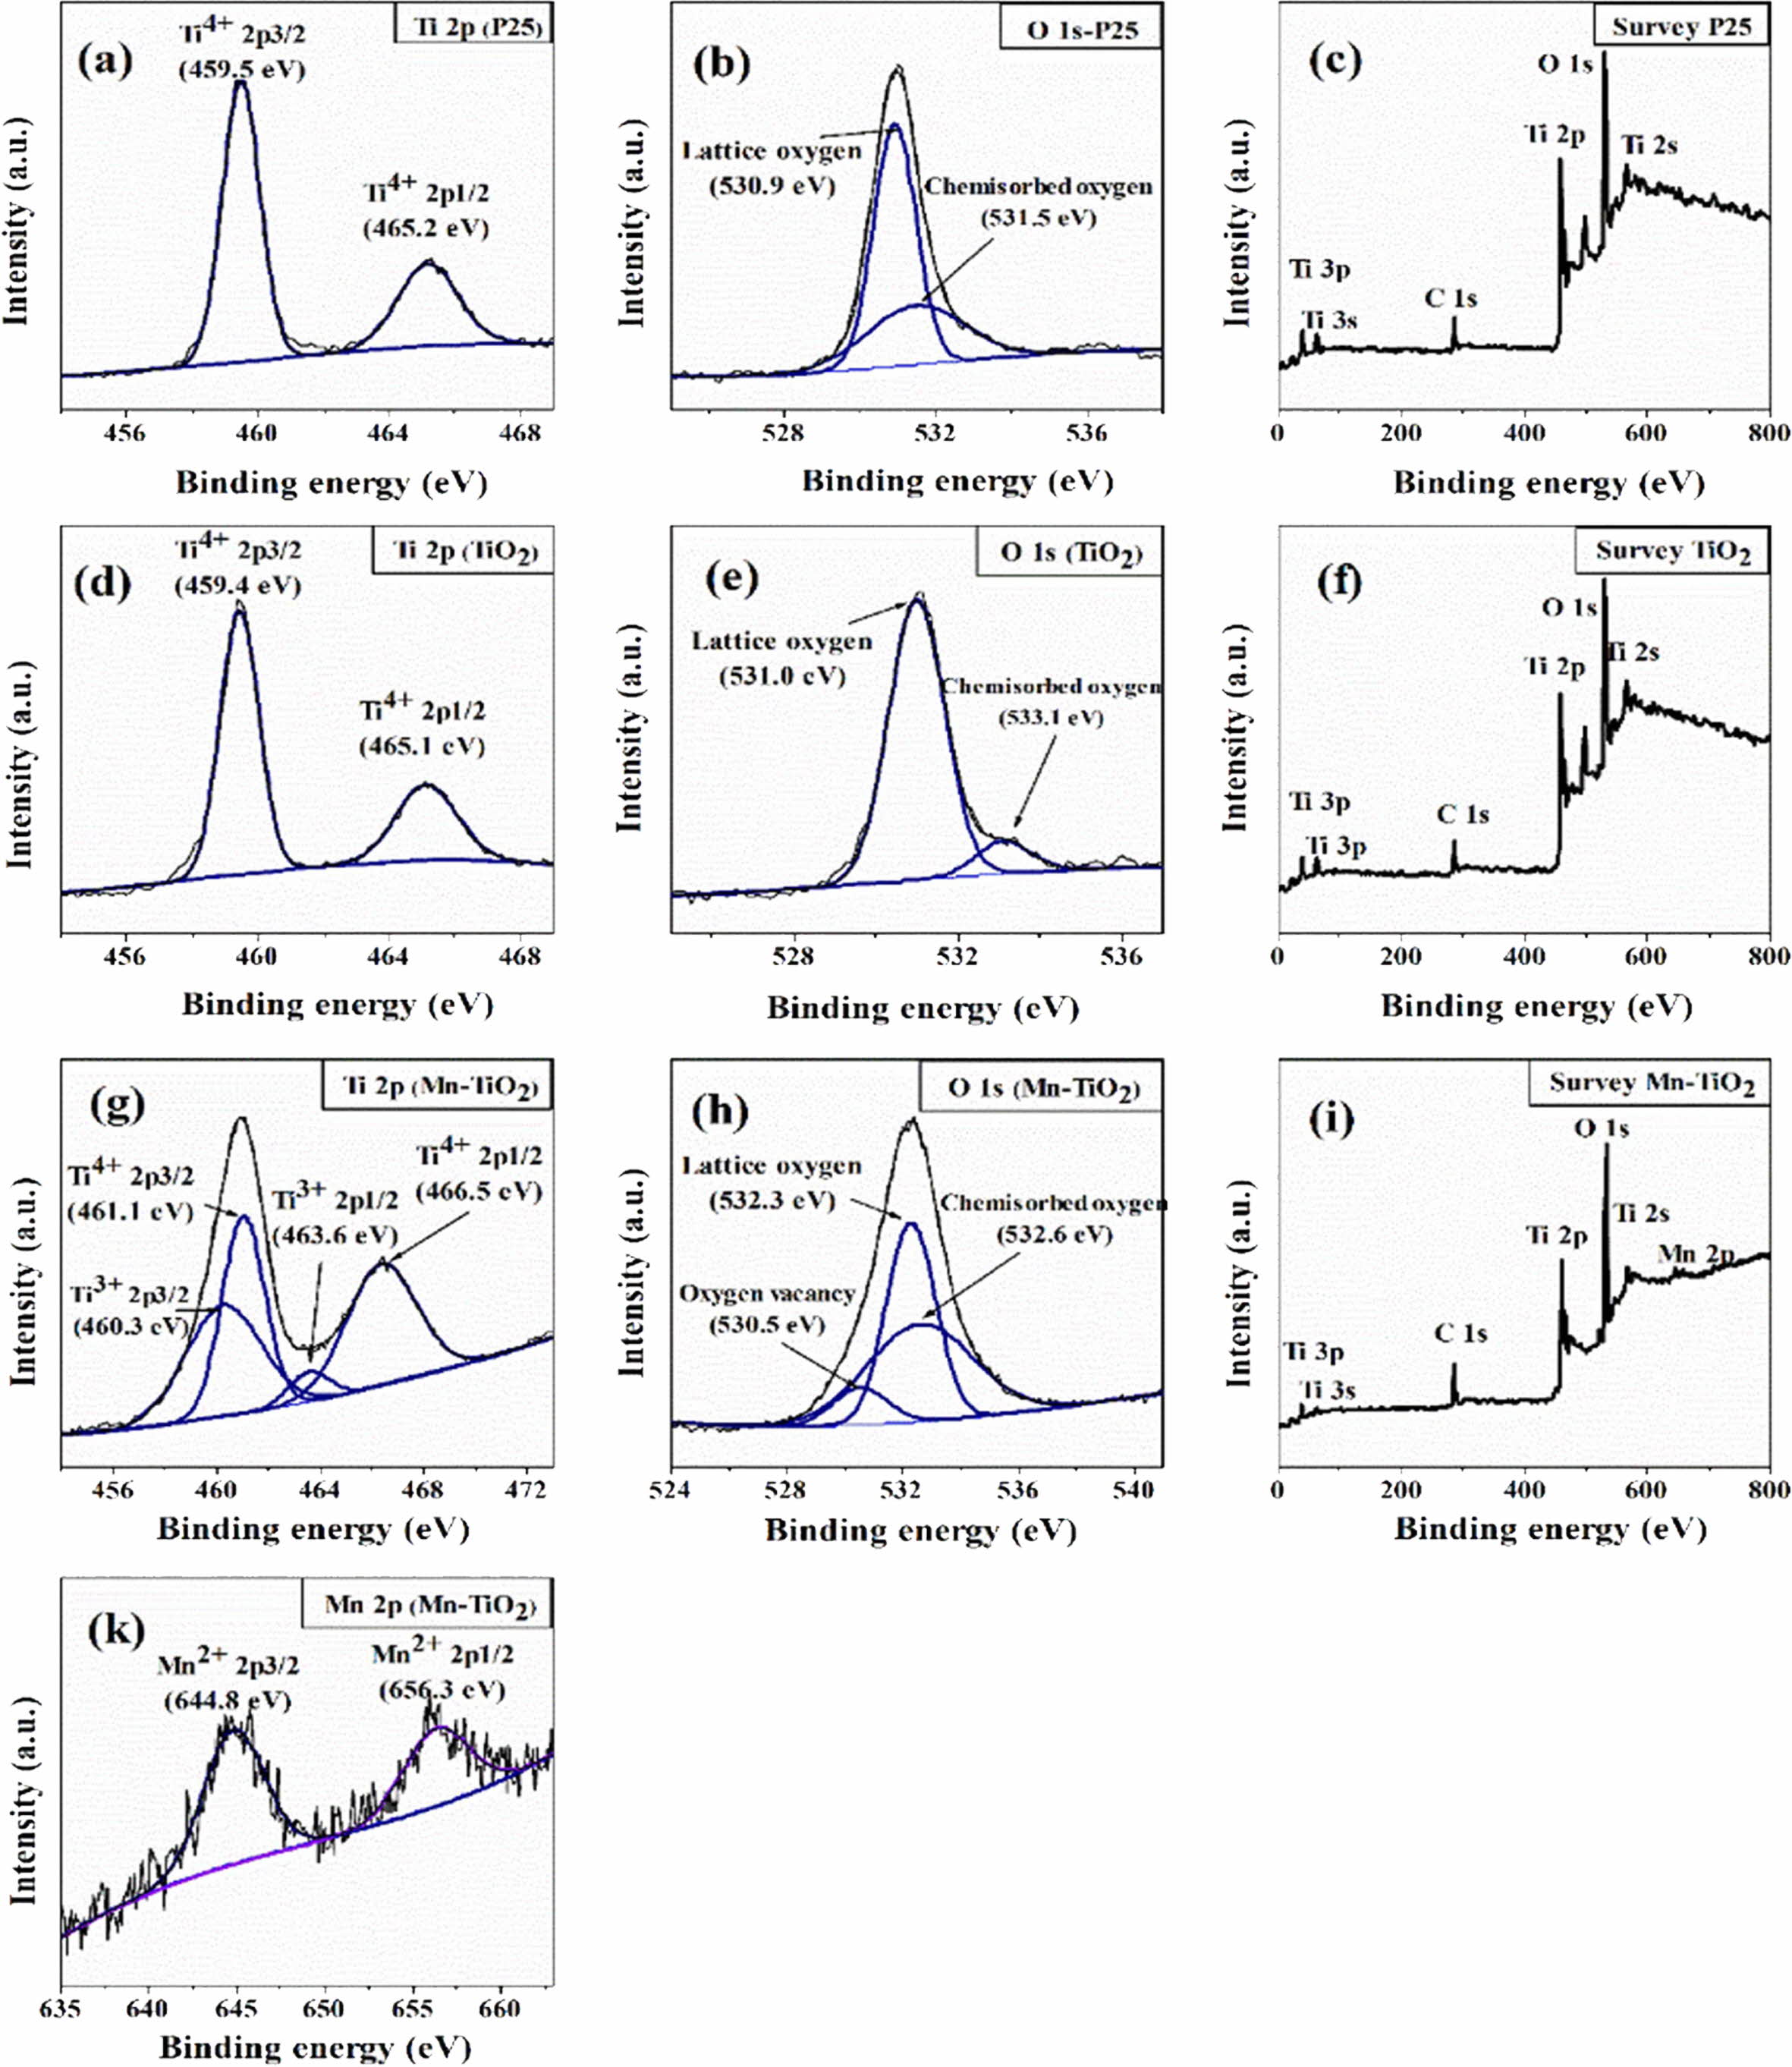
XPS spectra were measured to analyze the binding energies and oxidation states of specific elements in the samples, as shown in Fig. 4. The C 1s peak at 285.6 eV was used as the reference energy to correct all the spectra. The survey spectra of the Mn-TiO2 sample (Fig. 4i) demonstrated the existence of Mn in the Mn-TiO2 sample, thus suggesting the incorporation of Mn in the TiO2 structure. The deconvoluted XPS of Mn 2p in Fig. 4(k) exhibit two broad peaks at 644.8 eV and 656.3 eV, attributed to Mn 2p3/2 and Mn 2p1/2, respec- tively. Fig. 4(b, e, and h) indicated the deconvoluted peaks of O 1s in different samples. Interestingly, the oxygen vacancy peak was only observed in the Mn-TiO2 sample. The oxygen vacancy in Mn-TiO2 powder has also been reported in many publications [8, 16]. Here, the formation of oxygen vacancy was due to the impact of the doping process on the TiO2 nanostruc- tures. The deconvoluted Ti 2p spectra of P25 (Fig. 4a) and TiO2 (Fig. 4d) show two peaks corresponding to Ti4+ 2p3/2 and Ti4+ 2p1/2 without any evidence of the existence of Ti3+. However, the Ti 2p spectrum of Mn-TiO2 revealed the formation of Ti3+ which is assigned to Ti3+ 2p3/2 at 460.3 eV and Ti3+ 2p1/2 at 463.6 eV. The appearance of Ti3+ state in Mn-TiO2 material demon- strated that the Mn element was introduced into the crystal lattice of TiO2, confirming the success of the doping process. Based on the above XPS analysis, the possible mechanism can be proposed as following:

PL spectroscopic analysis
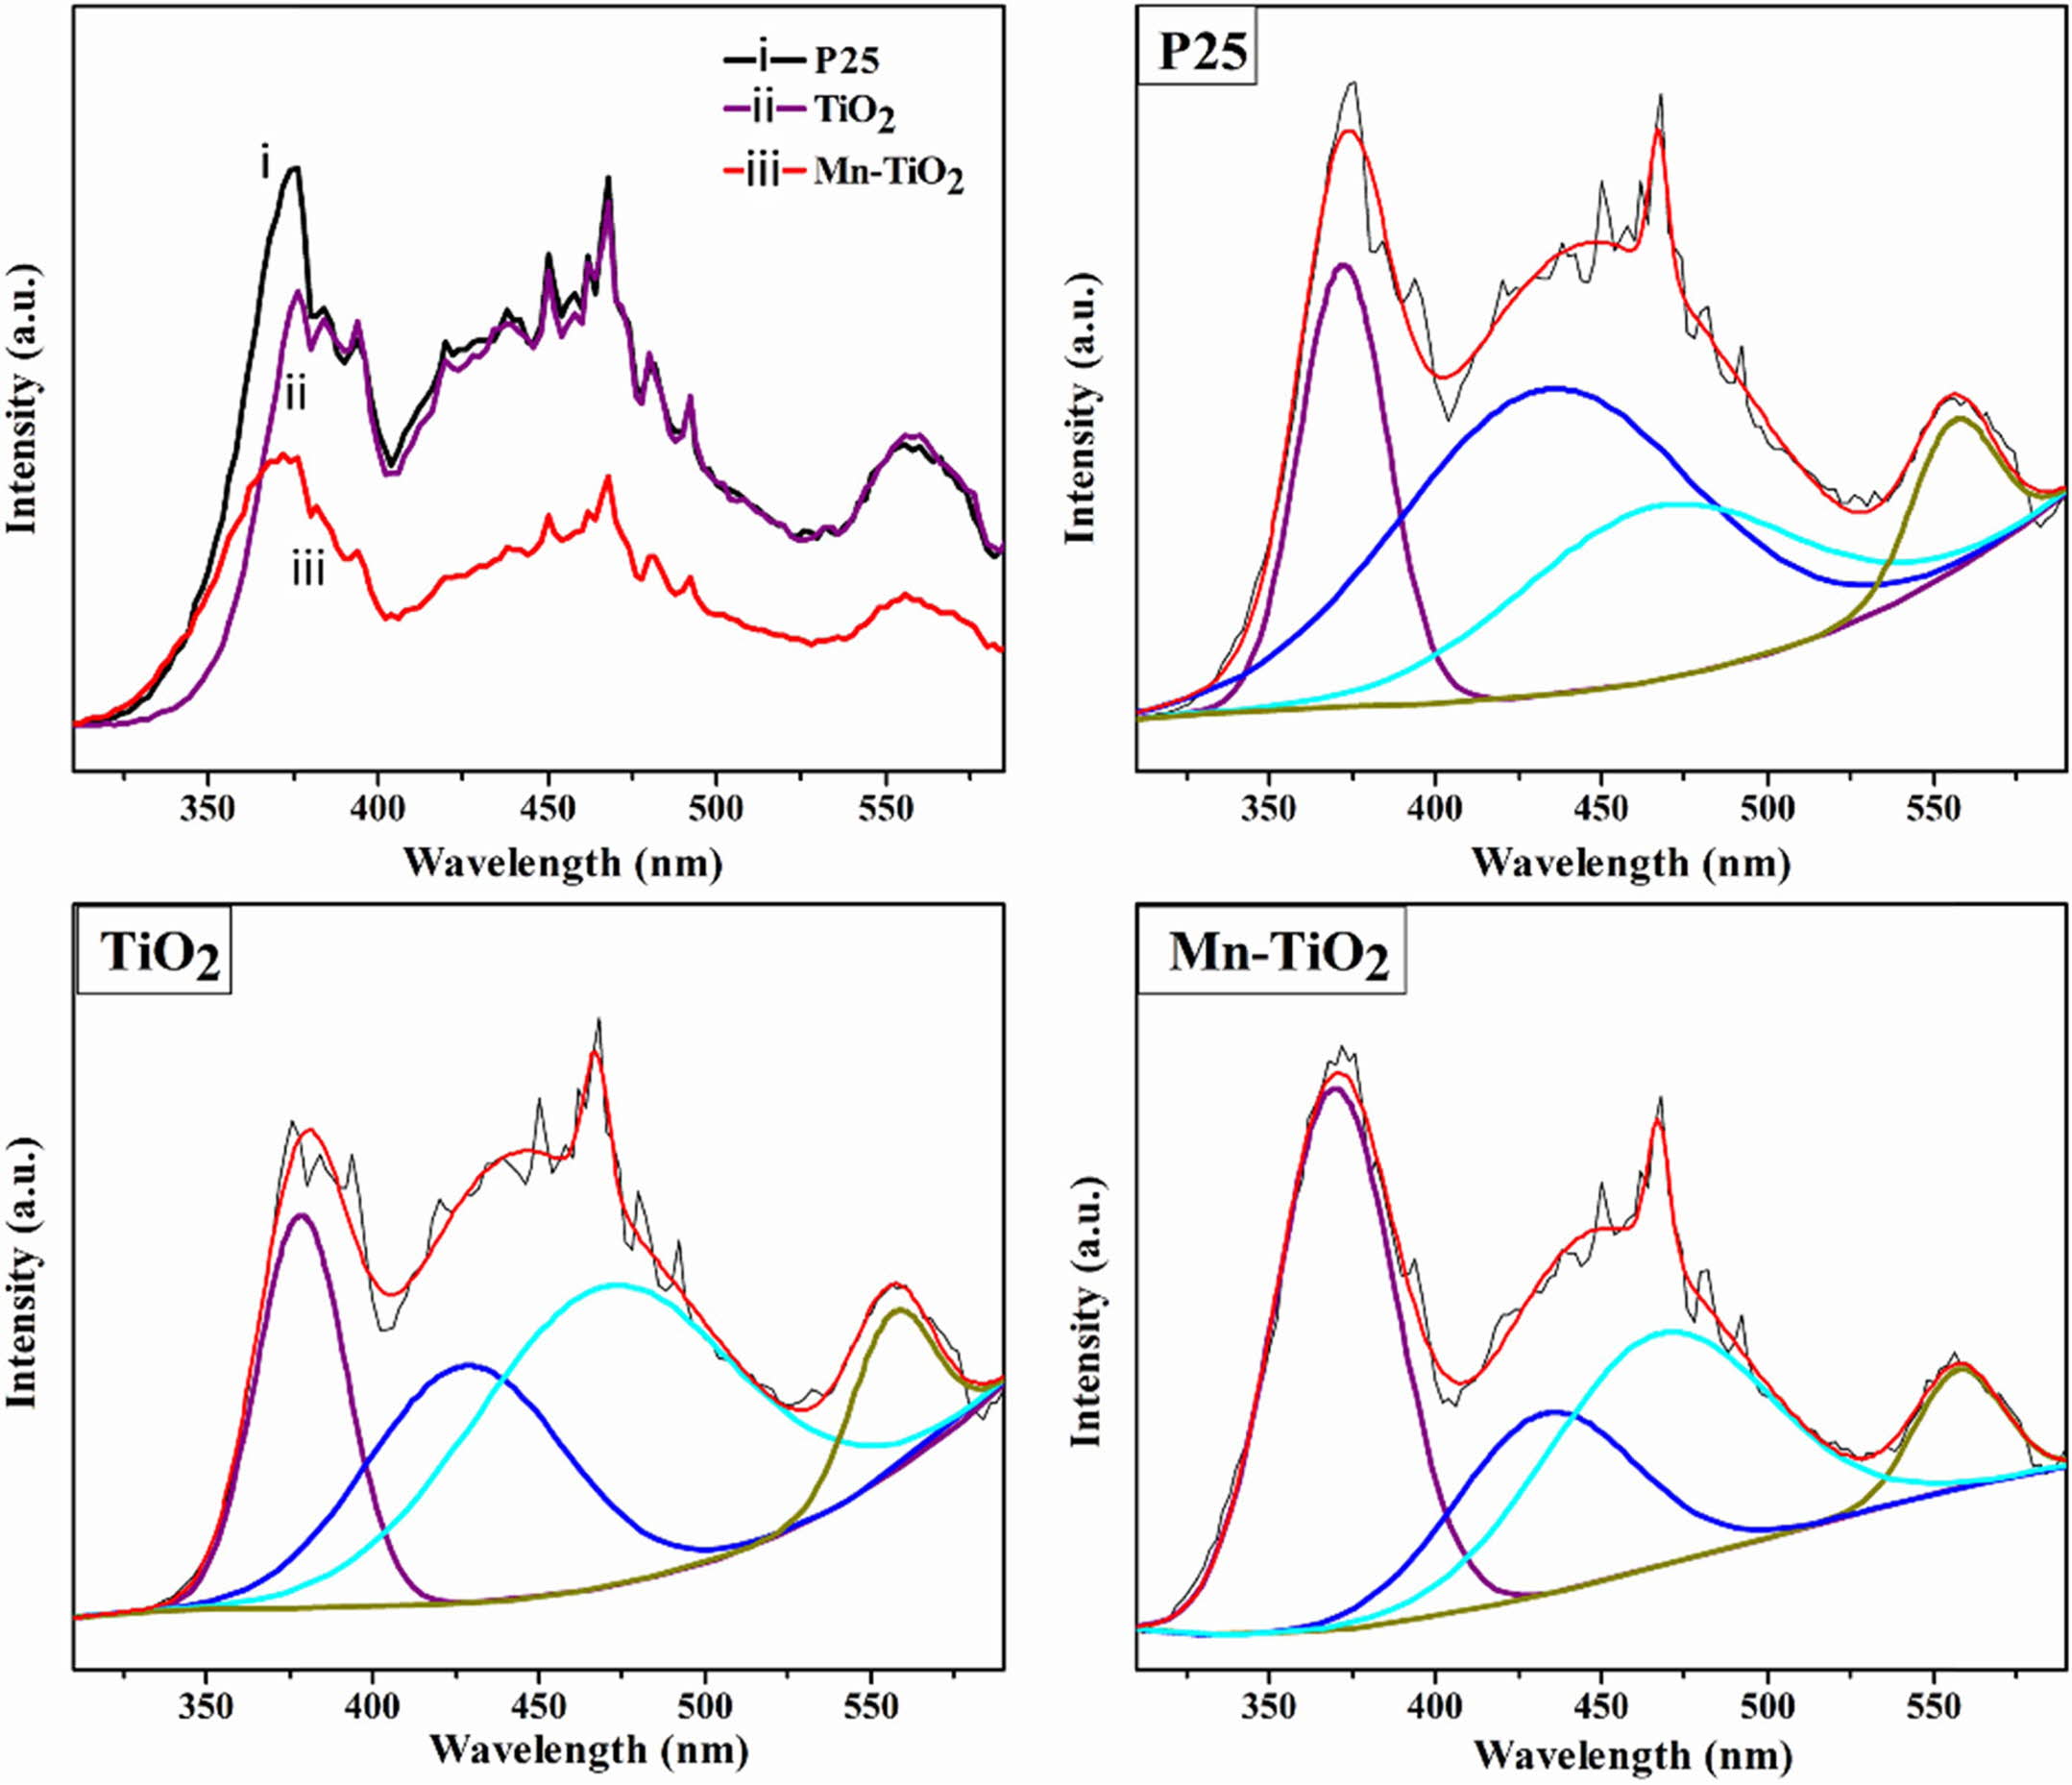
The PL emission spectra are used to study the recom- bination rate and migration efficiency of photoelectron-hole pairs and the defects in samples [8, 17-19]. As shown in Fig. 5, the deconvoluted PL spectra of P25, TiO2, and Mn-TiO2 indicated four emission peaks in the range of 350 to 600 nm. These deconvoluted peaks may be associated with the near band edge emission (around 370 nm), self-trapped excitons (about 430 nm), the charge movement from Ti 3p to TiO62- (about 470 nm), and the appearance of hydroxyl groups (OH) (about 560 nm) [8, 20, 21]. The intensity of the PL emission spectra is inversely proportional to the separation efficiency of the photogenerated carriers. Hence, the decrease in PL intensity of Mn-TiO2 com- pared to the TiO2 sample revealed a better separation of photo-induced charges. The possible reason is the for- mation of oxygen vacancy defects, which trap electrons in the Mn-TiO2 sample, enhancing the electron-hole separation.
According to Akshay et al. [8], the reduction of PL intensity is also affected by the presence of Mn dopant on grain boundaries at the surface or interior of the Mn-TiO2 nanocrystals. Here, the lower charge recombi- nation rate in the Mn-TiO2 sample might have resulted from the mid-gap band formation.
UV-vis spectra and band gap energy
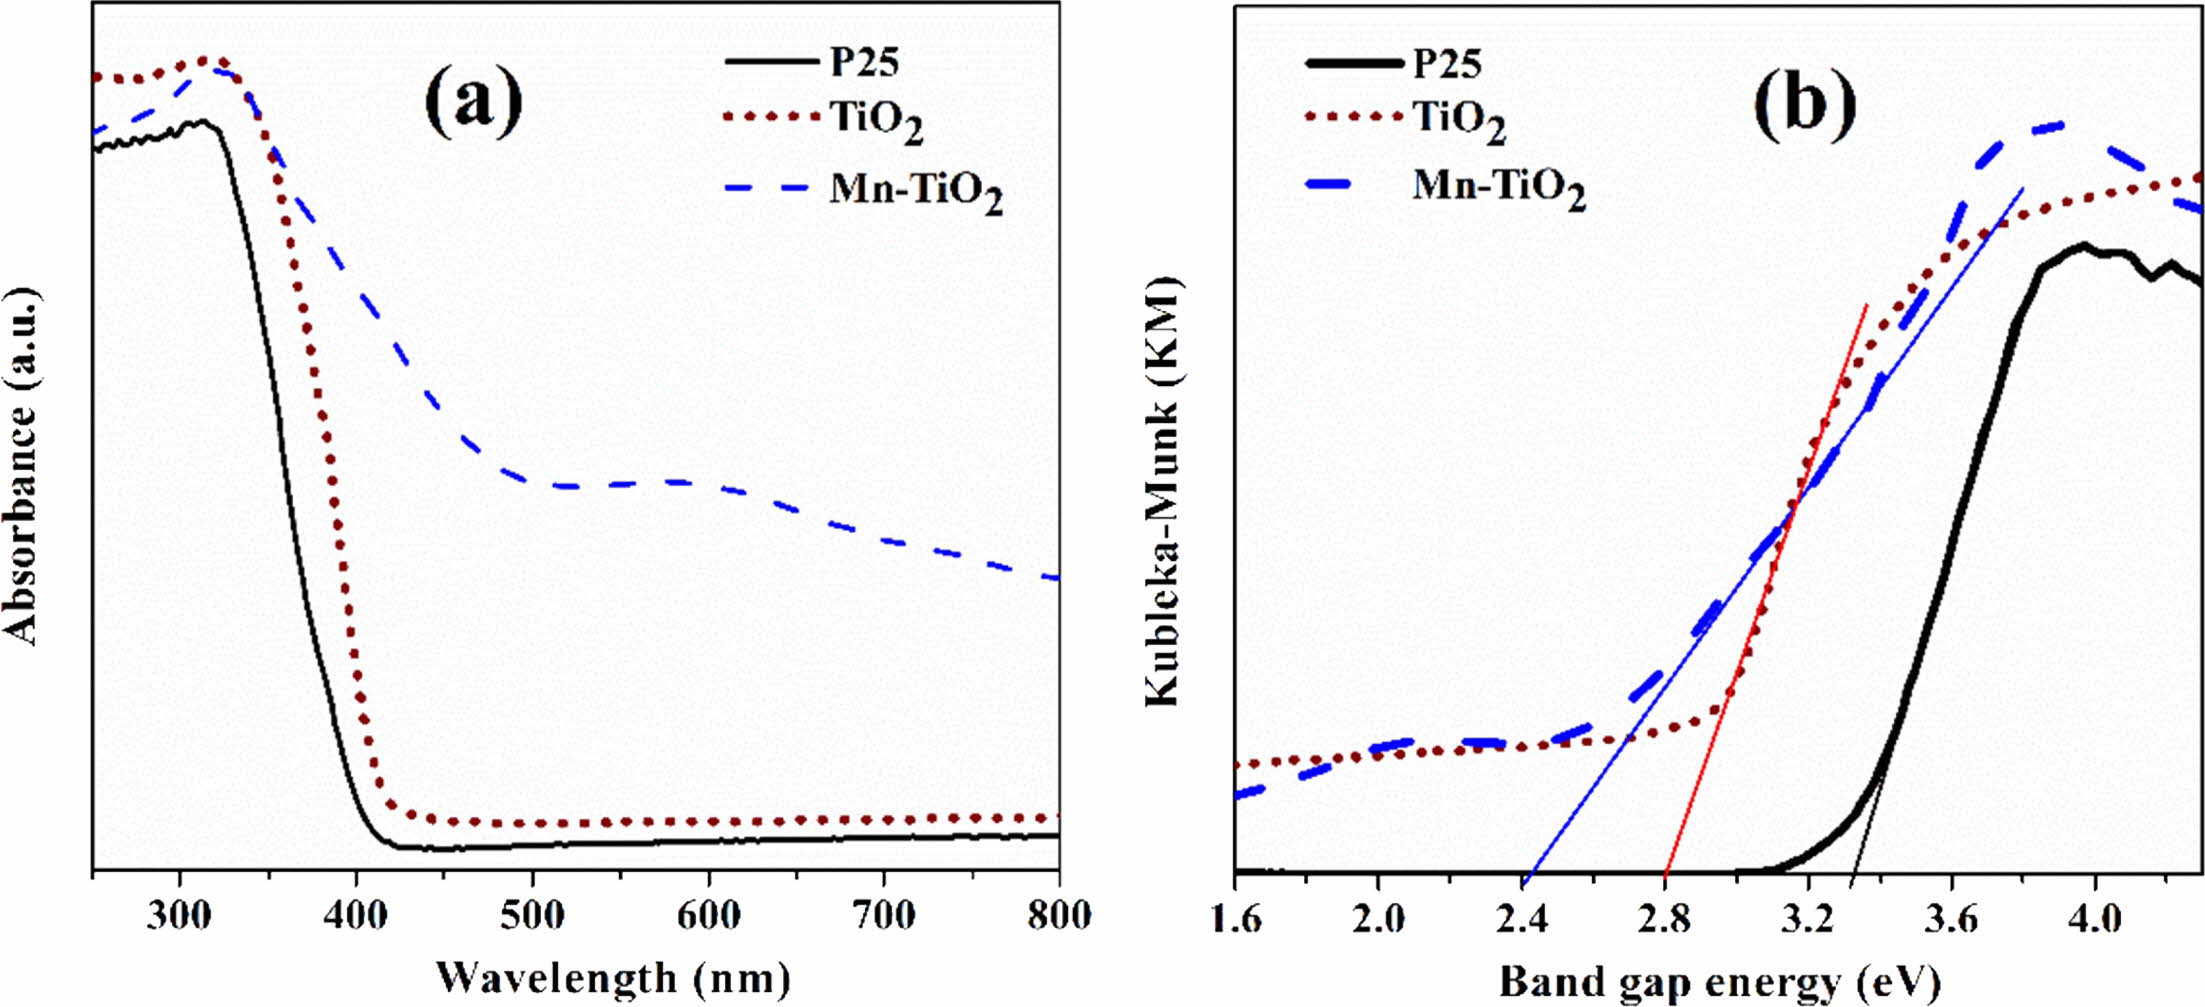
The UV-Vis diffuse reflectance spectroscopy was used to examine the photoresponsive properties of the as-synthesized samples. Fig. 6(a) revealed that the absorption ability of Mn-TiO2 in visible light increased significantly compared to P25 and TiO2 samples. The spectra also indicate that there was an absorption peak in the range 310-320 nm of Mn-TiO2, which was due to the transition of photoexcited electrons from the valance band to the conduction band [8, 22]. Inter- estingly, a weak peak appeared at about 590 nm on the spectroscopy of Mn-TiO2 that was not observed in P25 and TiO2 samples. The introduction of Mn into the TiO2 lattice induced this new peak, which led to the formation of intermediate states in the visible region of the Mn-TiO2 sample. According to the literature [8, 23], this additional peak was a result of the d-d transition assigned to 4T1g (G) → 6A1g (S). On the other hand, the doping process resulted in the formation of defects such as Ti3+ and oxygen vacancy, as discussed in the XPS spectra. The absorption peak at 590 nm was, therefore, contributed by these defects.
The band gap energy was evaluated using the modi- fied Kubelka-Munk method, as shown in Fig. 6b. The band gap values of P25, TiO2, and Mn-TiO2 are 3.23 eV, 2.80 eV, and 2.40 eV, respectively. The decrement of the band gap value of the Mn-TiO2 sample is in good agreement with the UV-vis spectra.
Photocatalytic activity
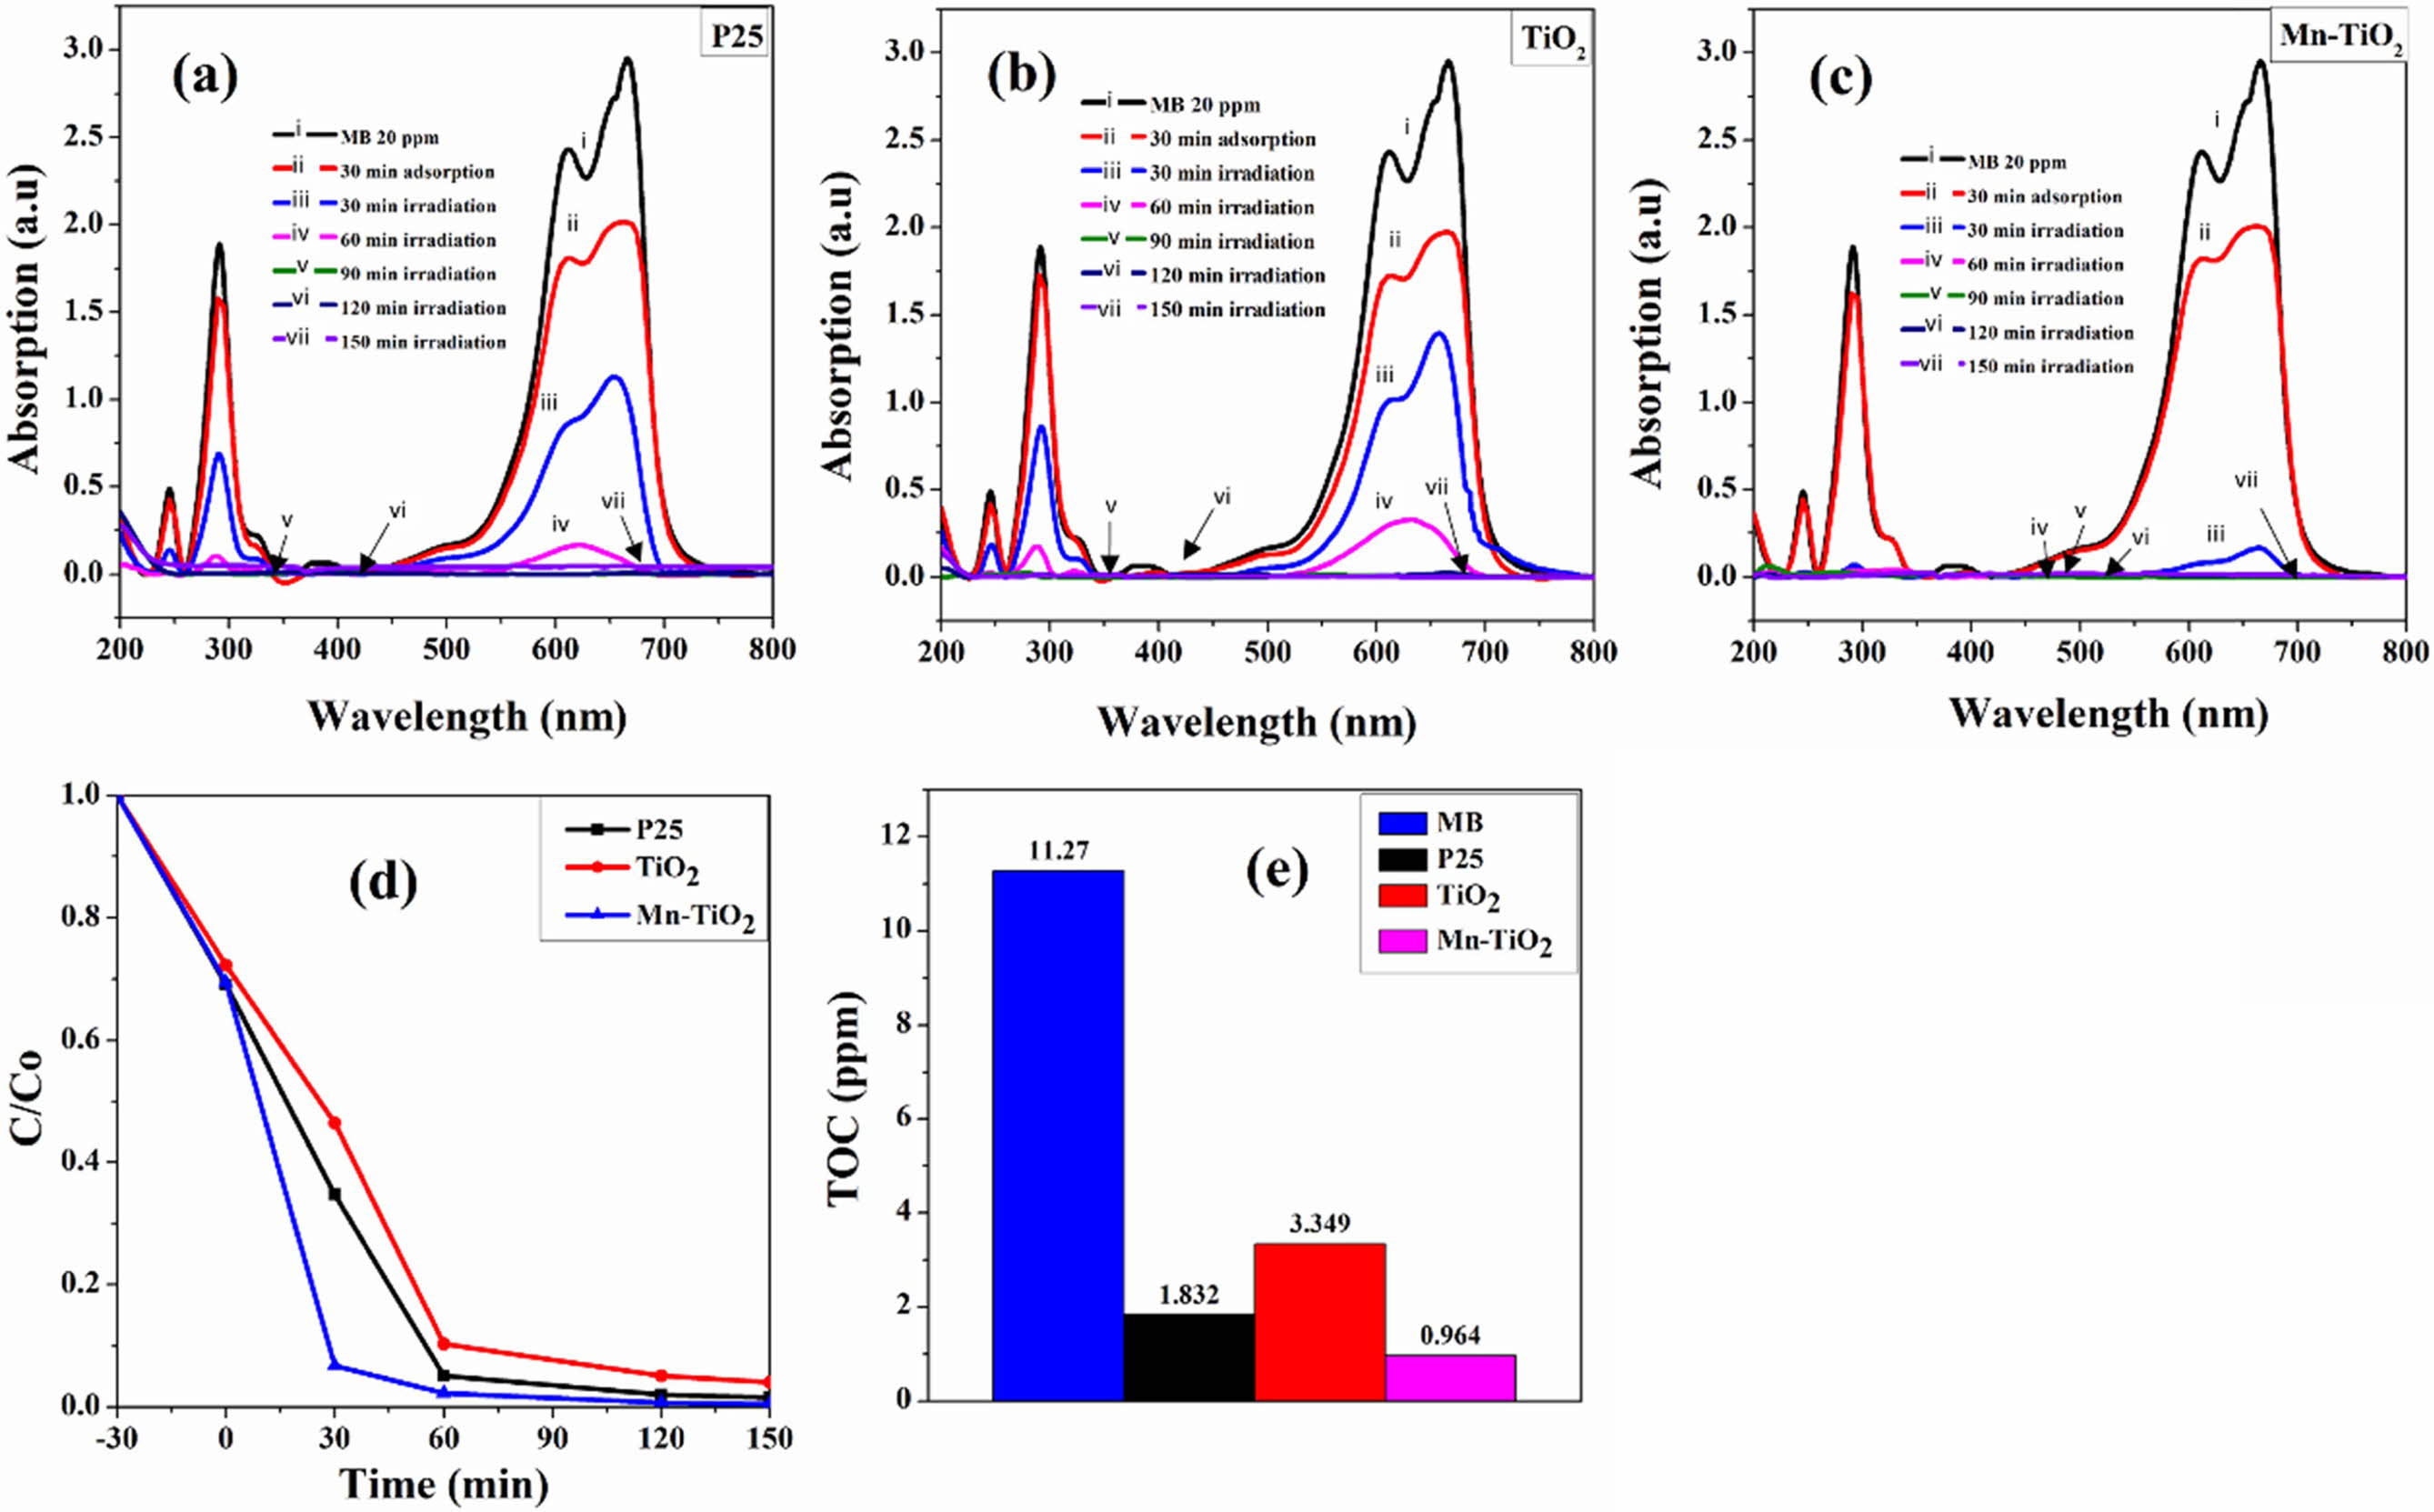
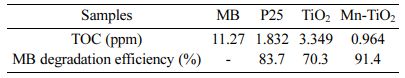
The photocatalytic performance of the as-prepared samples was evaluated through the photocatalytic de- gradation of the MB. The decolorization rate of MB under simulated solar light illumination for 150 min is shown in Fig. 7(a-c). The kinetics of photocatalytic decolorization of MB (Fig. 7d) revealed that the rate of MB decolorization by Mn-TiO2 was faster than that of P25 and TiO2 samples for 30 min of simulated irradi- ation. The MB decolorization degree was about 93% for Mn-TiO2, while this ratio is 35% and 45% for P25 and TiO2, respectively. Furthermore, it was observed that MB was decolorized almost completely within 60 min by Mn-TiO2 while it took more than 90 min for TiO2 and P25 samples. The TOC results of the MB solution after 150 min of the photocatalytic reaction are illustrated in Fig. 7(e) and summarized in Table 1. The decreased values of TOC additionally confirm the photo- catalytic ability of sol-microwave prepared samples. The TOC data of MB, P25, TiO2, and Mn-TiO2 after 150 min irradiation under simulated solar light corresponds to 11.27, 1.832, 3.349, and 0.964 ppm. Following that, the lower TOC value for Mn-TiO2 indicates a better photocatalytic efficiency of Mn-TiO2 compared to P25 and TiO2 samples.
The higher photocatalytic performance of Mn-TiO2 in terms of MB degradation can be explained as follows; firstly, the light absorption ability in the visible region of Mn-TiO2 is higher than that of TiO2 and P25, as indicated in Fig. 6(a), thereby allowing Mn-TiO2 to harvest better sunlight energy for its photocatalytic activity. Secondly, the lower recombination rate of photo- electrons and photo holes of Mn-TiO2 compared with P25 and TiO2 plays a major role in MB degradation efficiency. Moreover, the existence of oxygen vacancy in Mn-TiO2 also contributed to the photocatalytic per- formance of Mn-TiO2.
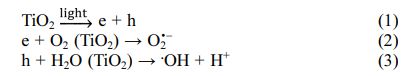
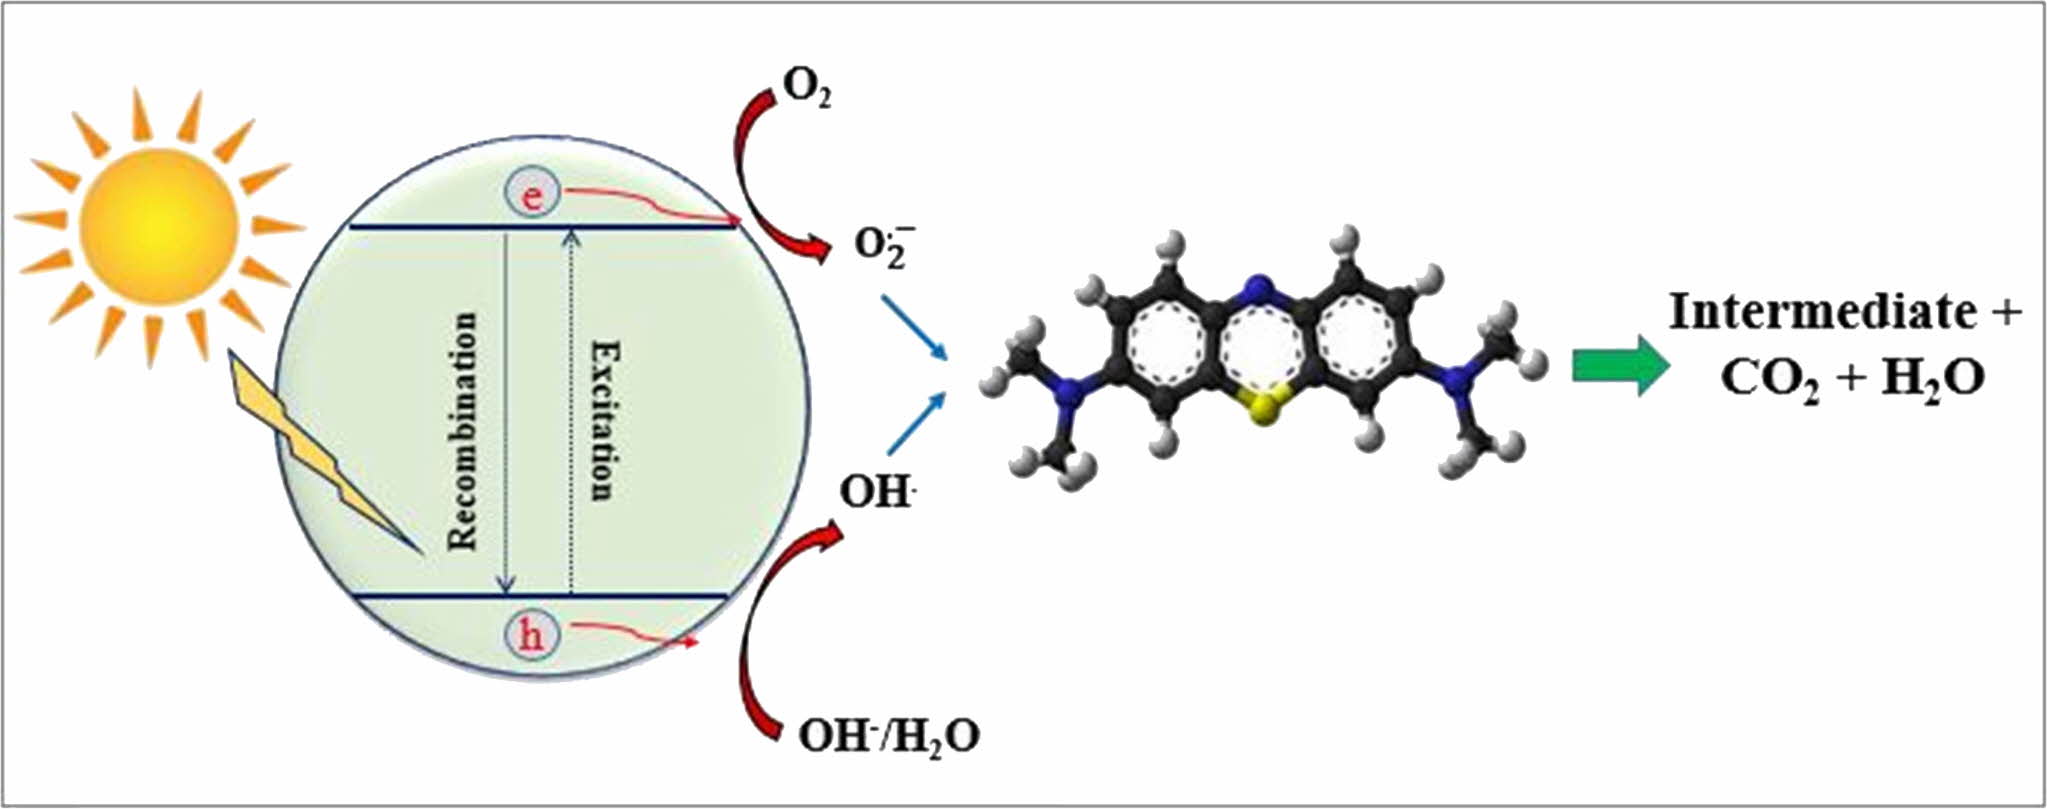
The proposed photocatalytic mechanism for MB degradation is diagrammatically illustrated in Fig. 8. Under the simulated solar light illumination, photoelec- trons and photo holes are generated on the conduction band and valance band of TiO2, respectively. According to previous literature [24-27], the photoelectrons then reduce oxygen to produce superoxide radical anions (O2• -) while photo holes react with water to form ·OH radicals.
These free radicals convert MB into intermediate products, CO2, and water as indicated in the below equations [24]:
|
Fig. 1 XRD patterns of samples. |
|
Fig. 2 FESEM images of TiO2 and Mn-TiO2; (a), (b) and (c) are elemental mapping and EDS spectra of the Mn-TiO2 sample, respectively |
|
Fig. 3 Raman spectra of samples |
|
Fig. 4 XPS spectra of the samples: Ti 2p, O1s, and Survey spectrum of P25 (a-c), TiO2 (d-f), and Mn-TiO2 (g-i), respectively, and Mn 2P spectrum of Mn-TiO2 sample (k). |
|
Fig. 5 PL spectra and deconvoluted emission spectra of the samples. |
|
Fig. 6 UV-vis spectra (a) and band gap energy of samples (b). |
|
Fig. 7 Photocatalytic degradation of MB dye by different samples: (a-c) decolorization rate, (d) C/C0 plot, and (e) total organic carbon (TOC) analysis of the dye after 150 min of irradiation. |
|
Fig. 8 Mechanism of MB photodegradation process. |
In this study, TiO2 and Mn-TiO2 nanomaterials were synthesized successfully via the sol-microwave route. The physicochemical properties of obtained samples were analyzed. The X-ray diffraction indicated a slight shift of the anatase main peak towards the higher angle, while the creation of oxygen vacancy in the samples was confirmed via the XPS analysis of Mn-TiO2. Moreover, the PL and UV-vis spectra also revealed the lower recombination rate of charge carriers and the enhanced light absorption ability of Mn-TiO2 compared to the P25 and TiO2 samples. Thus, it is concluded that the enhanced efficiency of the Mn-doped TiO2 sample, prepared by the sol-microwave process, was observed for the photocatalytic degradation of MB.
The authors would like to acknowledge Research Center for Eco Multi-Functional Nanomaterials at Sun Moon University, Korea, for providing the necessary facilities to carry out the research.
- 1. B. Wang, S. Shen, and S.S. Mao, J. Mater. 3 (2017) 96-111.
-

- 2. H.H. Nguyen, G. Gyawali, T.H. Kim, S. Bin Humam, and S.W. Lee, Prog. Nat. Sci. Mater. Int. 28 (2018) 548-553.
-
- 3. S. Bin Humam, H.H. Nguyen, C. Regmi, G. Gyawali, B. Joshi, and S.W. Lee, Ceram. Int. 45 (2019) 4230-4236.
-
- 4. J. Tian, X. Hu, H. Yang, Y. Zhou, H. Cui, and H. Liu, Appl. Surf. Sci. 360 (2016) 738-743.
-
- 5. L. Andronic and A. Enesca, Front. Chem. 8 (2020) 565489.
-
- 6. M. Khairy and W. Zakaria, Egypt. J. Pet. 23 (2014) 419-426.
-
- 7. Q.R. Deng, X.H. Xia, M.L. Guo, Y. Gao, and G. Shao, Mater. Lett. 65 (2011) 2051-2054.
-
- 8. V.R. Akshay, B. Arun, G. Mandal, and M. Vasundhara, New J. Chem. 43 (2019) 14786-14799.
-
- 9. R. Chauhan, A. Kumar, and R.P. Chaudhary, Spectrochim. Acta - Part A Mol. Biomol. Spectrosc. 98 (2012) 256-264.
-
- 10. Y. Chen and X.J. Ma, Adv. Mater. Res. 989-994 (2014) 531-535.
-
- 11. Z. Xu, C. Li, N. Fu, W. Li, and G. Zhang, J. Appl. Electrochem. 48 (2018) 1197-1203.
-
- 12. R. Kumar and V. Kumar, Opt. Mater. (Amst). 88 (2019) 320-332.
-
- 13. G. V. Kanmani, V. Ponnusamy, G. Rajkumar, and M.T. Jose, Opt. Mater. (Amst). 96 (2019) 109350.
-
- 14. H.K. Inamdar, M.V.N. Ambika Prasad, R.B. Basavaraj, M. Sasikala, S.C. Sharma, and H. Nagabhushana, Opt. Mater. (Amst). 88 (2019) 458-465.
-
- 15. P. Chatterjee and A.K. Chakraborty, Opt. Mater. 111 (2021) 110610.
-
- 16. B. Choudhury and A. Choudhury, Curr. Appl. Phys. 13 (2013) 1025-1031.
-
- 17. H.H. Nguyen, G. Gyawali, A. Martinez-Oviedo, H.P. Nguyen, and S.W. Lee, Korean J. Chem. Eng. 37 (2020) 1507-1514.
-
- 18. H.H. Nguyen, G. Gyawali, A. Martinez-Oviedo, Y.K. Kshetri, and S.W. Lee, J. Photochem. Photobiol. A Chem. 397 (2020) 112514.
-
- 19. H.H. Nguyen, G. Gyawali, J.S. Hoon, T. Sekino, and S.W. Lee, Appl. Surf. Sci. 458 (2018) 523-528.
-
- 20. W.Y. Wu, Y.M. Chang, and J.M. Ting, Cryst. Growth Des. 10 (2010) 1646-1651.
-
- 21. R. Sanjinés, H. Tang, H. Berger, F. Gozzo, G. Margaritondo, and F. Lévy, J. Appl. Phys. 75 (1994) 2945-2951.
-
- 22. S. Di Mo and W.Y. Ching, Phys. Rev. B. 51 (1995) 13023-13032.
-
- 23. B. Sudhakar Reddy, N.O. Gopal, K. V. Narasimhulu, C. Linga Raju, J.L. Rao, and B.C.V. Reddy, J. Mol. Struct. 751 (2005) 161-167.
-
- 24. R. Zuo, G. Du, W. Zhang, L. Liu, Y. Liu, L. Mei, and Z. Li, Adv. Mater. Sci. Eng. 2014 (2014) 170148.
-
- 25. Y. Nosaka and A.Y. Nosaka, Chem. Rev. 117 (2017) 11302-11336.
-
- 26. W. Yu, F. Chen, Y. Wang, and L. Zhao, RSC Adv. 10 (2020) 29082-29089.
-
- 27. M. Pawar, S.T. Sendoǧdular, and P. Gouma, J. Nanomater. 2018 (2018) 5953609.
-
 This Article
-
2022; 23(1): 33-40
Published on Feb 28, 2022
- 10.36410/jcpr.2022.23.1.33
- Received on Jun 7, 2021
- Revised on Sep 24, 2021
- Accepted on Sep 25, 2021
Services
- Abstract
introduction
experimental procedure
results and discussion
conclusion
- Acknowledgements
- References
- Full Text PDF
Shared
Correspondence to
- Hao Huy Nguyen a, Gobinda Gyawali b,c and Bhupendra Joshi b
-
aFaculty of Applied Sciences, Ton Duc Thang University, Ho Chi Minh City, Vietnam
bDepartment of Fusion Science and Technology, Sun Moon University, Asan, 31460, Korea
cResearch Center for Eco Multi-Functional Nano Materials, Sun Moon University, Asan, 31460, Korea
Tel : +82 41 530 2882 Fax: +82 41 530 2840 - E-mail: nguyenhuyhao@tdtu.edu.vn, nguyenhuyhao@tdtu.edu.vn
Clean-Energy Research Institute(CRI), Hanyang University, 222, Wangsimni-ro, Seongdong-gu, Seoul, 04763, Korea
E-mail: jcpr@hanyang.ac.kr