


- Influence of ceramic based nanofluids and inlet header geometry on the thermal performance of wavy microchannel heat sink
M. Satheeshkumara,*, M.R. Thansekharb and R. Pandiyarajanc
aResearch Scholar, Department of Mechanical Engineering, K.L.N College of Engineering, Pottapalayam, India - 630 612
bProfessor, Department of Mechanical Engineering, K.L.N College of Engineering, Pottapalayam, India - 630 612
cAssociate Professor & Head, Department of Mechatronics Engineering, Agni College of Technology - Thalambur, Chennai, India - 600 130This article is an open access article distributed under the terms of the Creative Commons Attribution Non-Commercial License (http://creativecommons.org/licenses/by-nc/4.0) which permits unrestricted non-commercial use, distribution, and reproduction in any medium, provided the original work is properly cited.
The increasing need for development in microelectronics and systems has naturally led to pursuit of modern advancements in the field of cooling technology. Microchannels offer excellent high temperature heat management in electronic systems. Microchannels utilize fluids capable of transferring heat energy released by the operating circuits by fluid flow. The fluid flow and nature of fluid are highly resonant on the performance of the microchannel heat sinks. The present work is a novel approach of an investigation of three-dimensional ceramic based nanofluids flow performance in a fabricated wavy microchannel heat sink with varying inlet header geometry. The coolant nanofluids investigated are concentrated with silicon dioxide (SiO2) and aluminum oxide (Al2O3) ceramic nanoparticles with varying volume percentages and their hydraulic and thermal performance were investigated. Experimental evaluations were performed to determine variations in local Nusselt number and axial coefficient of heat transfer for SiO2 and Al2O3 nanoparticles concentration. Computational fluid analysis was performed to evaluate transport equations to determine pressure drop, friction factor and Nusselt number of the fluid flow. It was observed that increasing heat flux amplitude causes rise of local maxima of Nusselt number with corresponding decrease of the local minima. The decrease of local minima was more profound than increase of local maxima. The different inlet header geometries influence the local Nusselt number with conical frustum header producing the value followed by semi-circular, rectangular and triangular inlet section geometries. The observed Nusselt number and heat transfer rate was highest in case of Al2O3 followed by SiO2 and distilled water as coolant fluids for the heat sink. Higher Nusselt number was observed for conical frustum and semi-circular inlet header geometries when SiO2 and Al2O3 based coolant fluids were used. High friction factor was observed when the nanoparticle concentration was 0.25 volume percentage for the entire Reynolds number under investigation. A computational model was utilized to evaluate the drops in pressure in the wavy microchannel and determine frictional characteristics of the nanofluids in the present work
Keywords: ceramic nanoparticles, wavy heat sink, microchannel heat sink, inlet heat geometry
The advancement of electronic devices in recent years had upped the need for large scale adoption of integrated circuits in almost every industrial domain. The miniaturized circuit processors however, required significant attention in terms of thermal conditions as the heat dissipation was a crucial factor to extract optimum performance. The thermal management of microprocessors was especially vital with new generation processor chips possessing astonishing processing cap- abilities and speed of execution, requiring heat dissipation of about 100 W/cm2 for best case scenarios [1]. Compact cooling systems with improved effectiveness capable of reliable performance were required in cases of high-performance circuits. The traditional air-cooled systems lacked the necessary performance in this regard, especially with operating conditions within 10 and 50 W/cm2 [2]. By utilizing Nusselt number the heat removal of a surface was executed by either optimization of heat transfer rate with respect to heat exchanger volume or by enhancing the thermal conductivity of the cooling nanofluid. The effective method of improving the cooling capacity of a channeled heat sink was by increasing homogenous flow distribution via parallel fluid flow channels [3].
Effect of microchannel geometric designs were in- vestigated for determining their influence on thermo-hydraulic performances of a heat sink. The investigation involved evaluation of parameters such as fluid flow passage pattern, cross sectional geometry, varying inlet header shapes and position of the manifold [4]. Studies involving research to improve the working fluid`s thermal conductivity by means increasing the concentration of dispersed nanoparticles [5] and alternating the corres- ponding nanoparticle size and temperature [6]. Experi- mental investigations of heat energy performance of a wavy microchannel in a heat sink having a cross-section of rectangular geometry circulating a concentrated nano- fluid synthesized with 0.1 volume percentage of silver particles revealed an improvement of over 40% in convective mode heat transfer [7]. Numerical study of performance of alumina synthesized nanofluid suspended with water exhibited increase in Nusselt number influenced by increasing nanoparticles dispersion inferring that the rate of heat transfer is dependent on volumetric fraction of the nanoparticles [8].
The study involving a simulated laminar flow of the nanofluids within the microchannel with rectangular section investigated the performance metrics of the base fluid per Maxwell`s criteria and established that the fluid`s temperature dependent property influences the micro channel’s thermal conductivity [9]. Investigation on flow maldistribution to evaluate the thermal perfor- mance of parallel and collinear oblique channels in an oblique finned heat sink revealed angle of inlet manifolds were pivotal in reduction of flow migration. The charac- teristics of the flow migration were investigated by numerical simulations, wind tunnel analysis to evaluate the rate of fluid flow [10].
Based on the literature review, it was found that limited number of experimental and numerical contributions was available for wavy micro channel heat sinks with different inlet header geometries. The present work is the novel approach in investigating a fabricated wavy microchannel with varying inlet header geometries with ceramic based nanofluid coolant for hydraulic and thermal flow performance. The present work involved experimental and numerical analysis of four inlet header geometries on the microchannels namely, semi-circular, conical frustum, triangular and rectangular inlet headers. The nanofluids investigated in the study were distilled water, Silicon dioxide (SiO2) based nano- fluid and Aluminum trioxide (Al2O3) based nanofluid with varying volume percentage concentration. The microchannels were experimentally investigated for influences of the inlet header geometries on the heat transfer rate, local Nusselt number maxima, variations of Reynolds number, pressure drop and friction factors of the nanofluids. Numerical investigations by means of computational fluid dynamics were performed to analyze the trends of the nanofluid flow and heat transfer behavior on the four microchannel heat sinks.
The contributions of the present work are the results of the investigations of influence of inlet header geometry on the wavy microchannels towards achieving a homo- genous fluid flow performance with desirable heat dissipations and the required nanoparticle concentra- tions of Silicon dioxide (SiO2) and Aluminum trioxide (Al2O3). The laminar region of the fluid flow was in- vestigated for effects of header shape and size, pressure drop and flow rate by computational numerical model in ANSYS FLUENT software.
Test sections and geometrical parameters
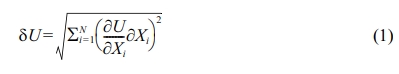
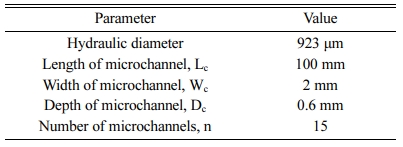
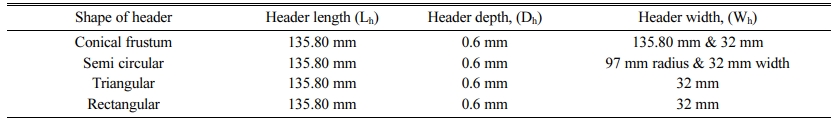
In the present work, the experimental and numerical analysis of wavy microchannels with different inlet header geometries was performed. The wavy micro- channels were fabricated with similar channel length, frontal flow area and micro channel thickness with varying inlet header geometry for the experimental analysis [11]. The geometric parameters of the wavy channel for the experimental apparatus are listed in Table 1. The wavy microchannels were designed with different inlet header geometries such as conical frustum, semi-circular, triangular and rectangular profiles and their specifications are listed in Table 2. The wavy microchannels with respective inlet header geometries are represented in Fig. 1.
The fabrication of all the microchannels was based on wavy microchannel design. The hydraulic diameter of the microchannel fabricated for the analyses was 923 μm. The length of the wavy microchannel was 100 mm and has 2 mm width. The depth of the microchannel is 0.6 mm and the number of microchannels for each inlet header design was 15.
As for the dimensions of the different inlet headers, the header lengths for conical frustum, semi-circular, triangular and rectangular inlet header geometries were 135.80 mm. The header depths of all the inlet geometries were also the same at 0.6 mm. The conical frustum header had a design radius of 135.80 mm and 32 mm of header width; with semi-circular inlet header had a 97 mm diameter and 32 mm width. The triangular and rectangular inlet headers both had a header width of 32 mm.
Design of flow loop and experimental analysis
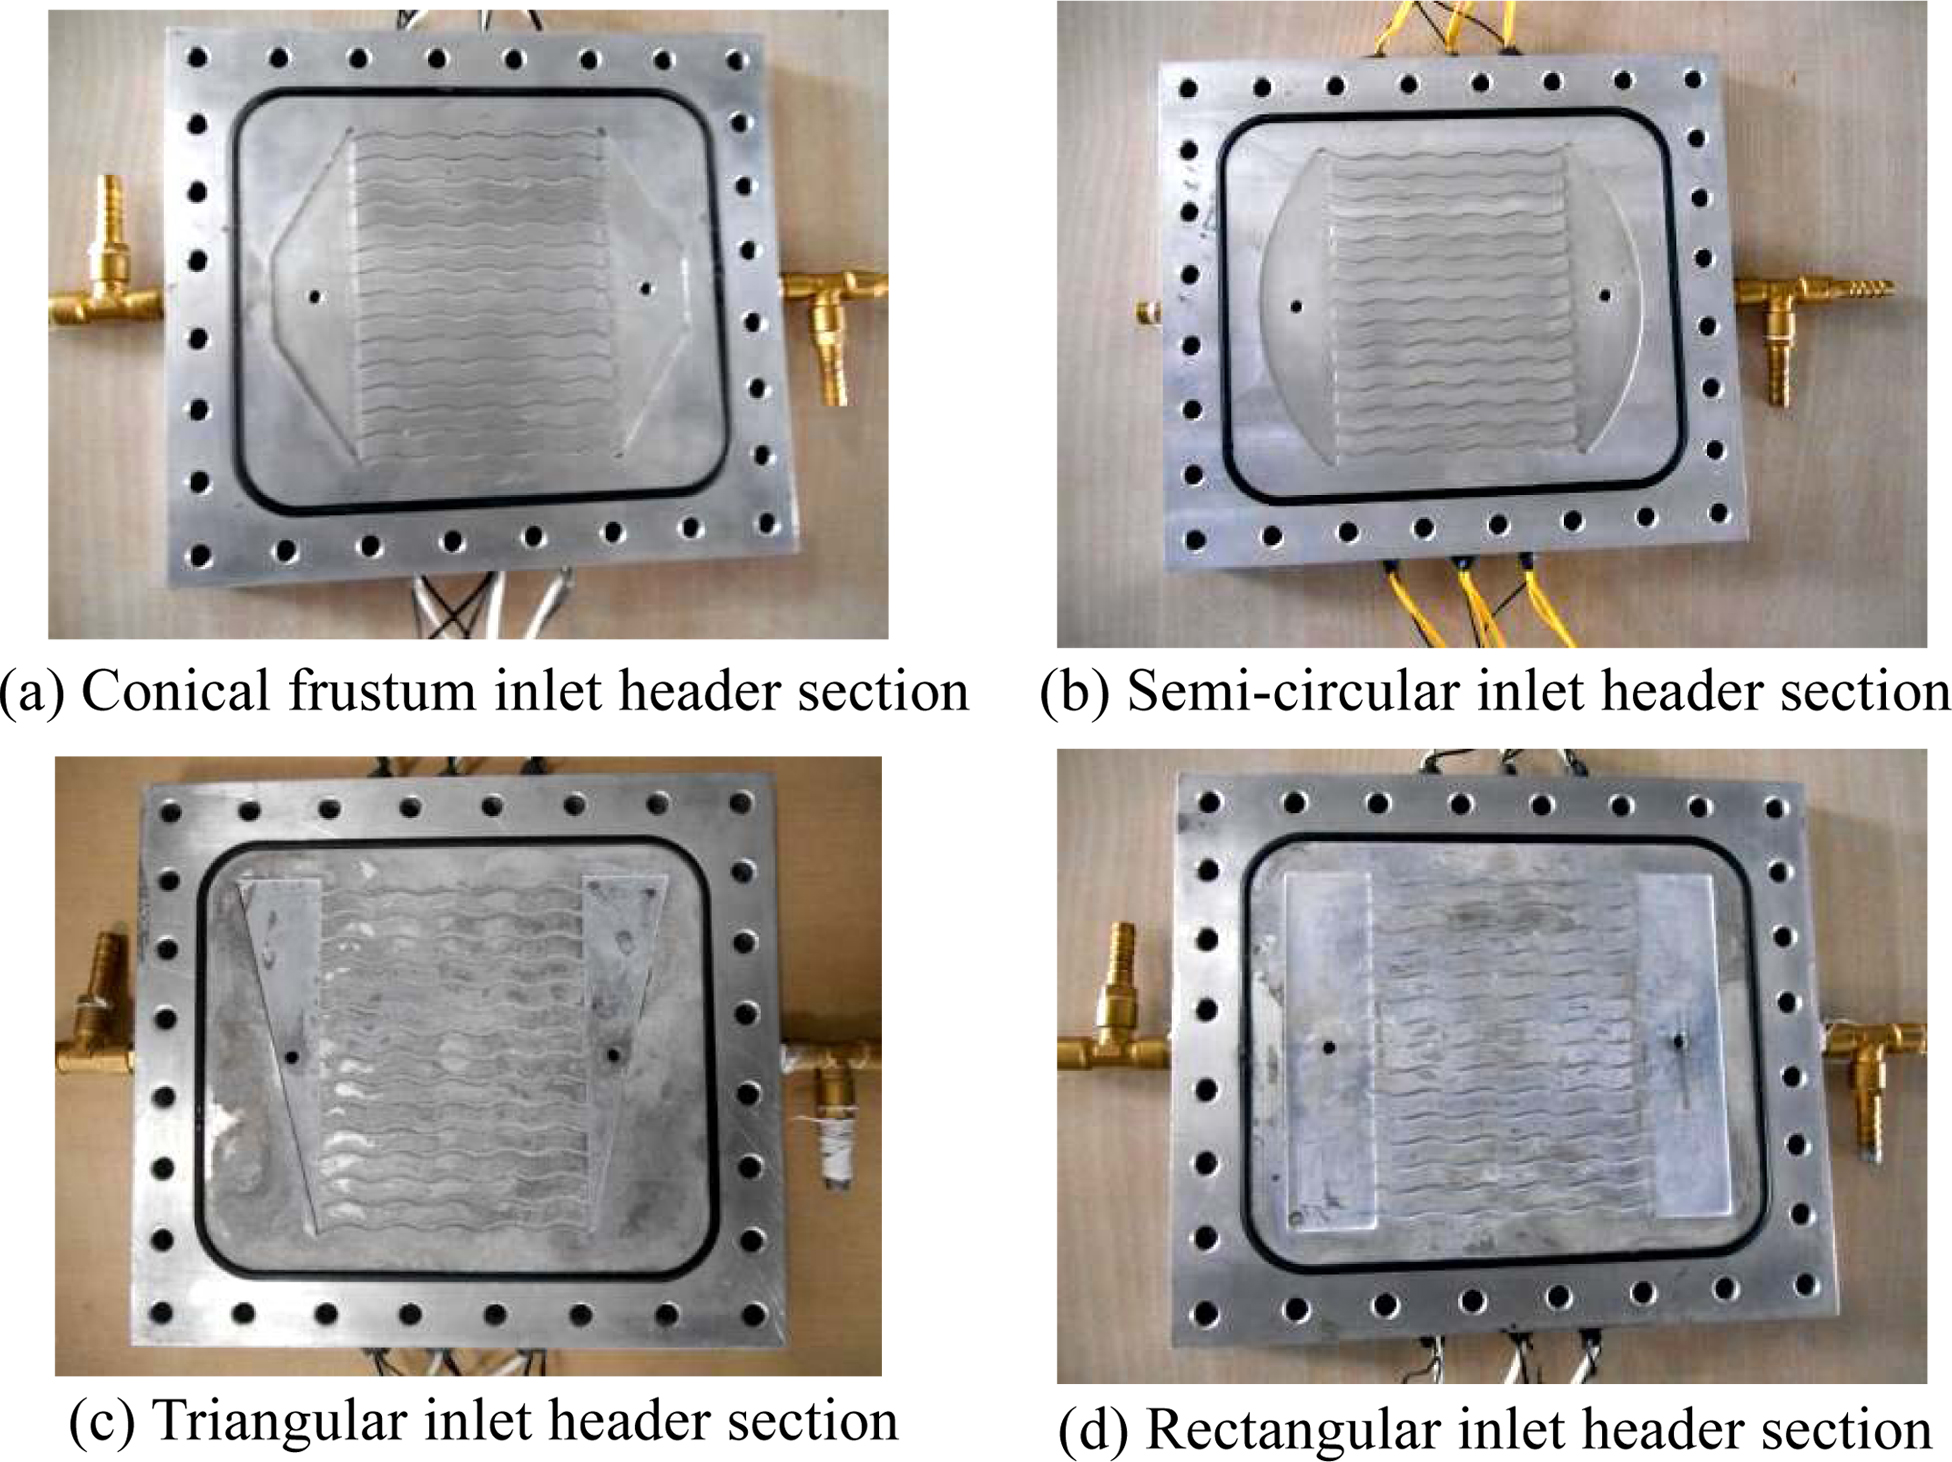
The experimental setup included measuring instru- ments to determine fluid state and temperature, fluid transmission pump system, a steady temperature bath bearing removable test segments and coolant systems (Fig. 2). The parts of the fluid transmission system involving fluid reservoirs, connecting pipes were con- structed from stainless steel. The main fluid flow gauging device was a highly susceptible ultrasonic meter which used ultrasonic signals for modifying parameters of fluid viscosity and type of fluid circulated and their temperature. Precision T-type thermocouples were utilized for measuring temperatures at the inlet and outlet flow of the fluid. K-type omega thermocouples were mounted on the surfaces to test and ensure homo- geneity of the temperature distribution in the walls. The drop-in pressure was calculated by the difference between local pressures at both sections inlet and exit of the fluid flow. Precision pressure transmitters were utilized in determining the isothermal conditions of the system. The chamber temperature was regulated by an 2 kW electric heater providing heat, a thermostat, power control unit and precision temperature sensor. The temperature sensor in control unit was used to regulate the power control system and heater system.
The system maintains the boiling point of the water and when the water chambers reach this limit, dry saturated steam surround the test section. The test section into which the fluid flows was subjected to heating by the steam condensed on the test sections` outer surface [12]. This is imperative in maintaining homogenous wall temperature at 95 oC. The units used for cooling consisted of heat exchanger with fins brazed onto the surface alongside a cooling fan, a temperature controller and sensor. The decrease in fluid flow influenced reduction of measuring errors. The factors that were measured six times were done so by maintaining first half to increase and second half to decrease the trends [13]. The innermost of the four were selected to estimate the average values for data processing.
Analysis of uncertainty
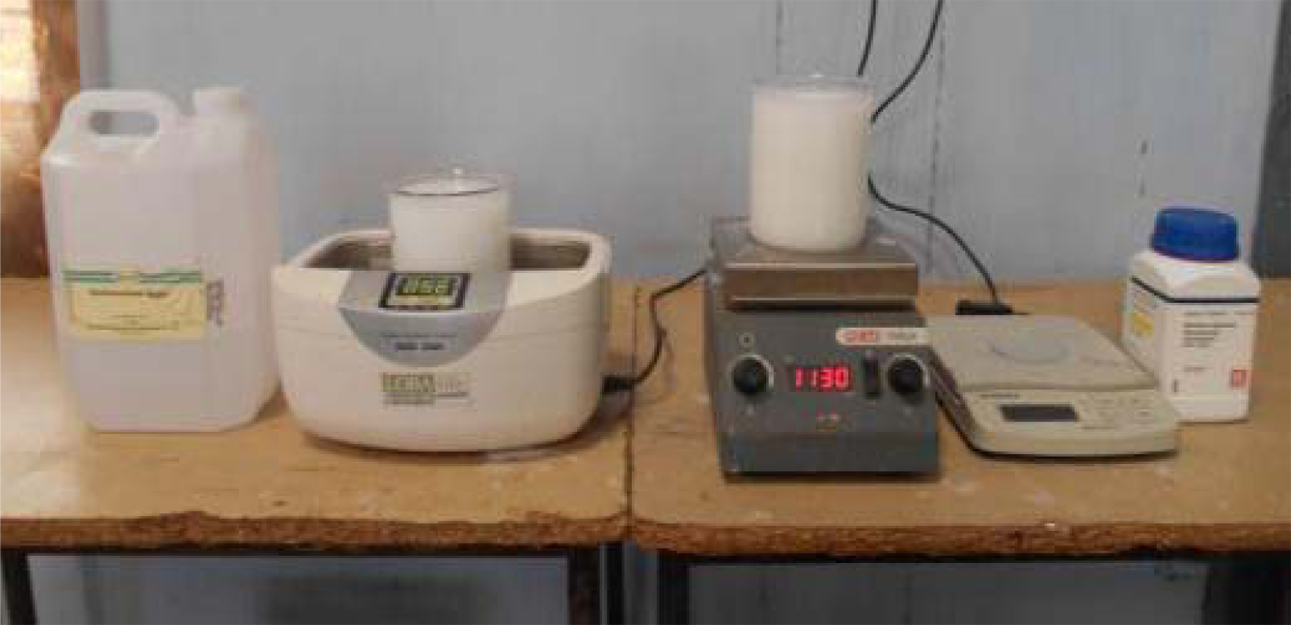
The microchannel heat sink specimen was tested for leakage by pressure testing the specimen under water tank. The testing procedure was repeated for to achieve consistency in the observed results with an uncertainty of ±0.025% with subsequent visual inspections. The microchannel with 150 mm length;1mm width and 10 mm depth exhibited the highest uncertainty of ±0.80%. The corresponding uncertainty to the Reynolds number was determined as ±3.2%. The uncertainty was determined Equation (1) by associating uncertainties of individual terms.
The fluid flow (liters/minute) was measured by an ultrasonic fluid flow meter; the fluid flow and surface temperature (oC) were measured by outlet, inlet and surface thermocouples with an accuracy of 0.1oC and the fluid pressure (pascals) was measured by pressure transmitters. The variables that were measured were used to determine the parameters` uncertainties. During the test, the nanofluid was extracted from the testing setup by flushing with de-ionized water. Subsequently the coolant was vacuumed out of the reservoir. The entire testing setup was completely air dried prior to the subsequent trial.
Preparation of nanofluids
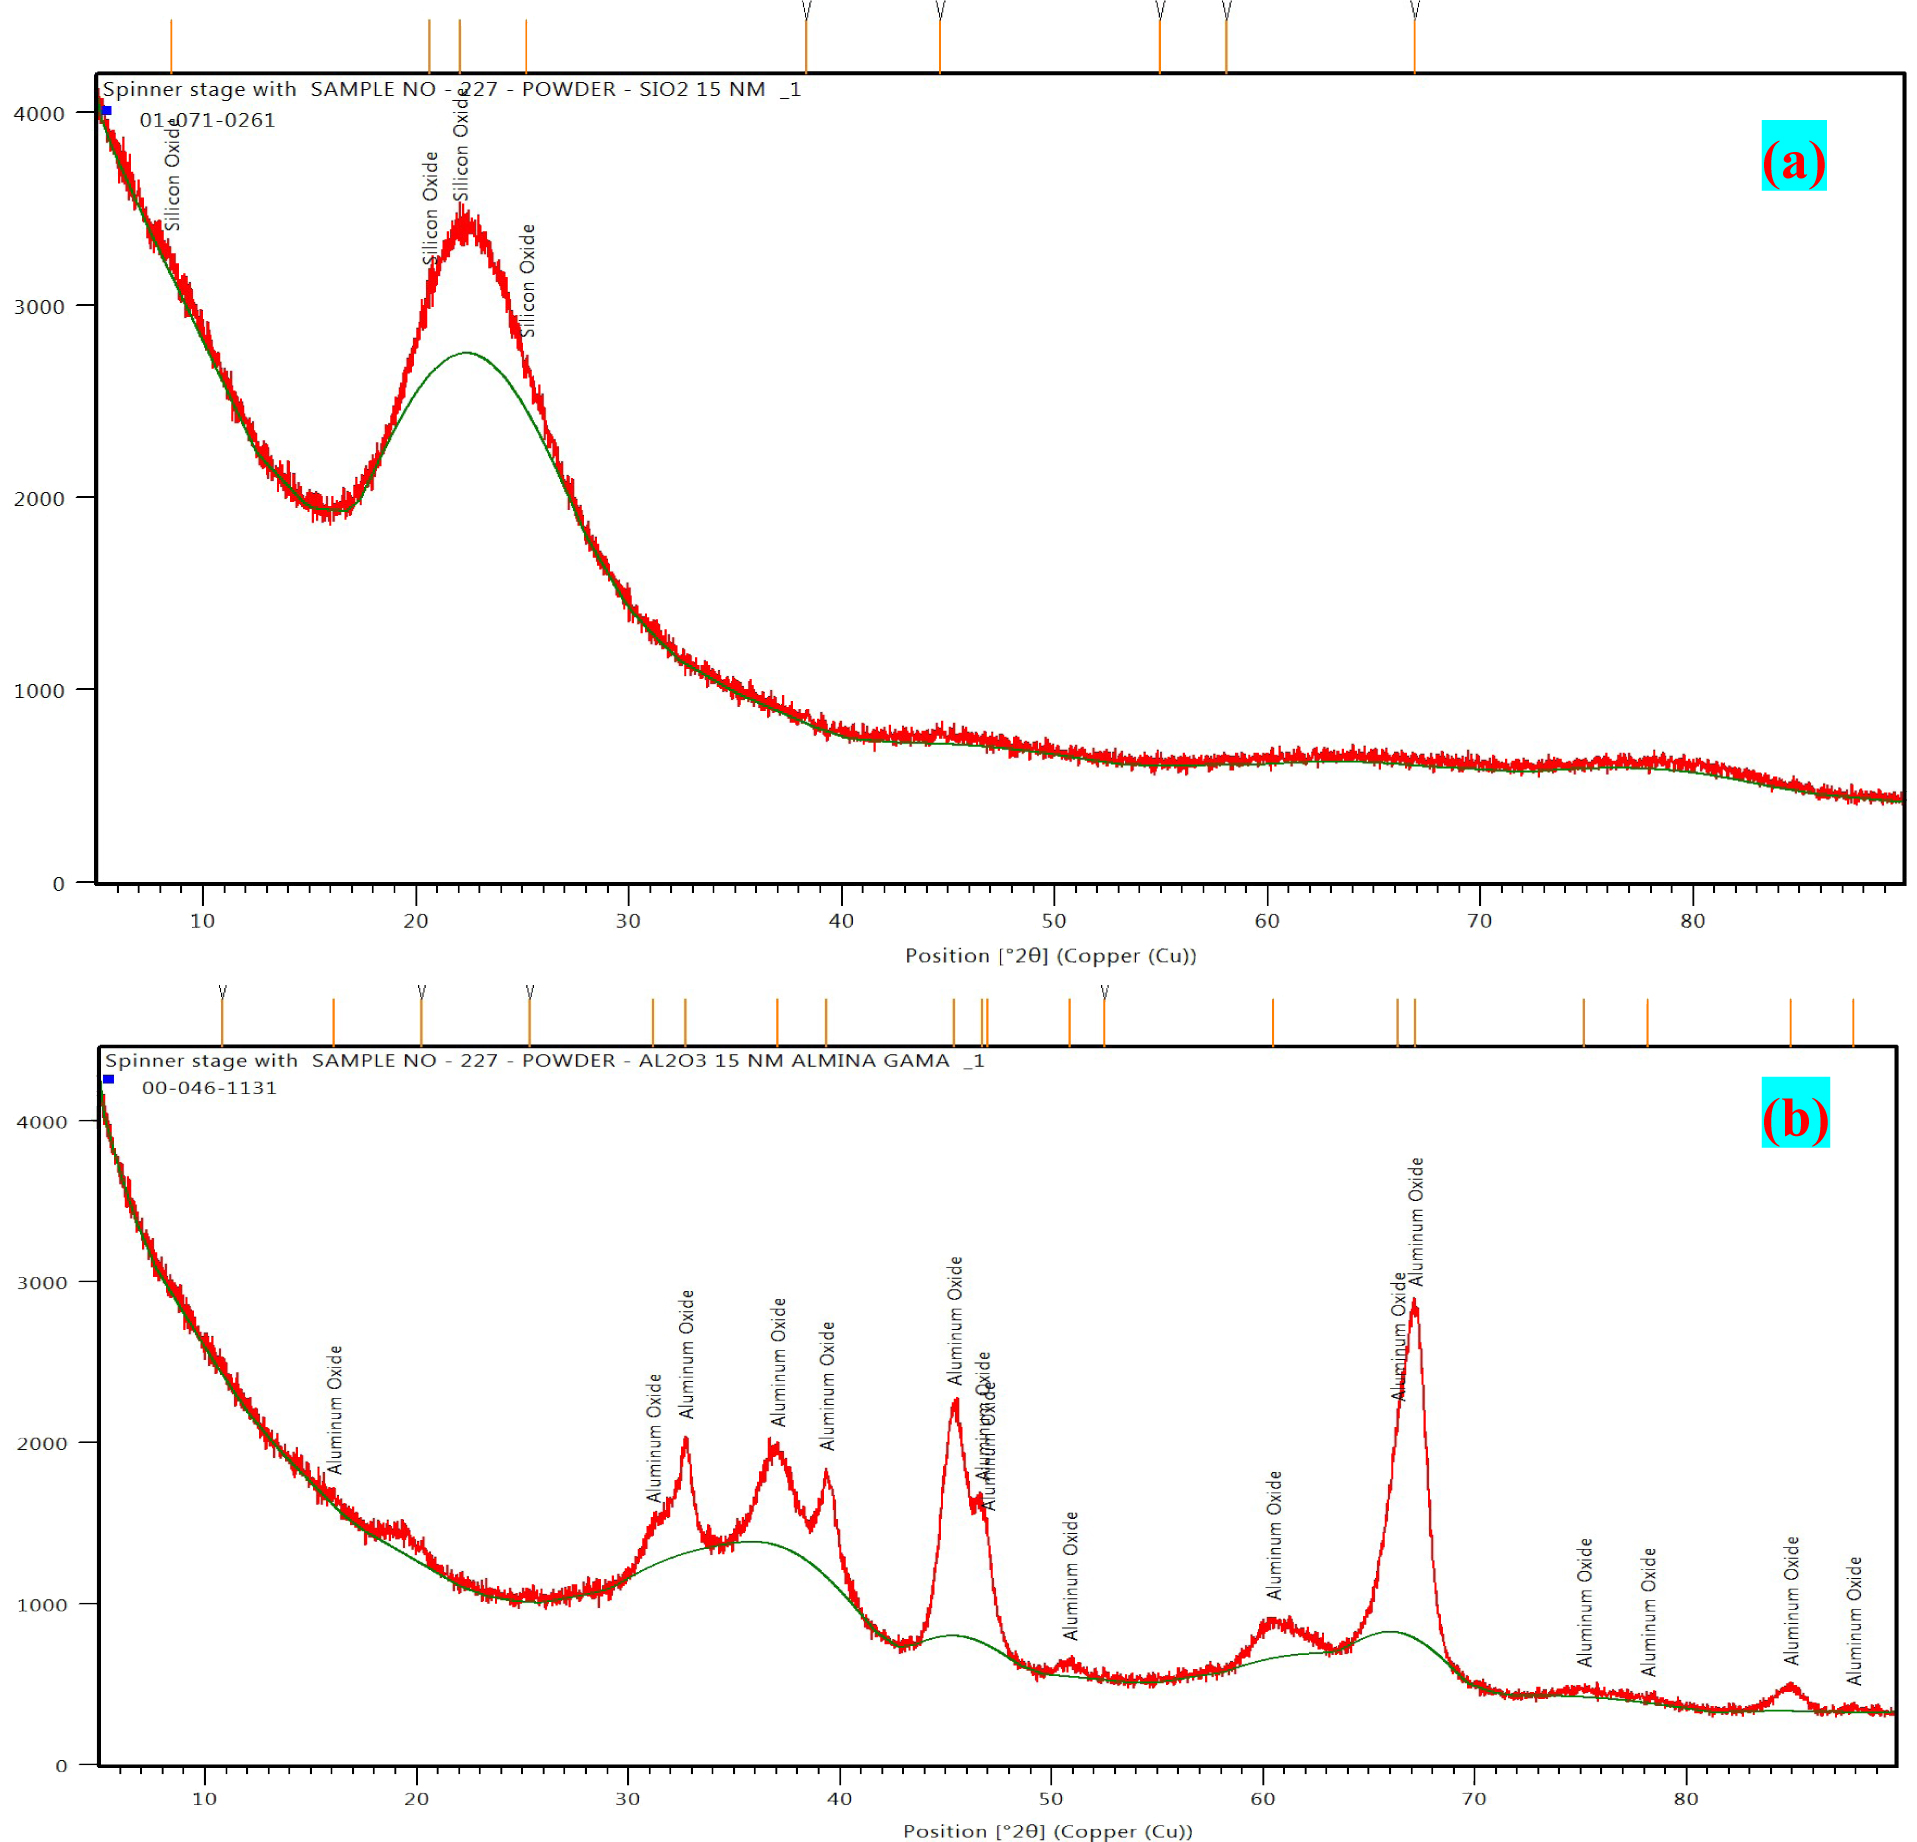
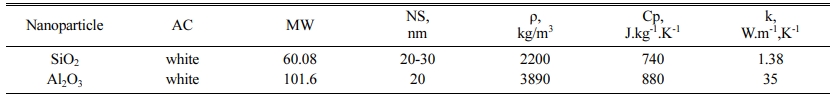
The nanofluids in the investigation were produced by dispersing Silicon dioxide (SiO2) and Aluminum trioxide (Al2O3) nanoparticles in anatase crystal phase. The purity level being 99%, the average diameter was 15 nm with specific surface area of 356 m2/g. Double distilled water was used as the base fluid. The present study includes four types of nanofluids that were prepared for investigation. De-ionized water served as base fluid with liquid medium [14, 15]. Silicon dioxide and aluminum trioxide were used as additives, their physical properties listed in Table 3.
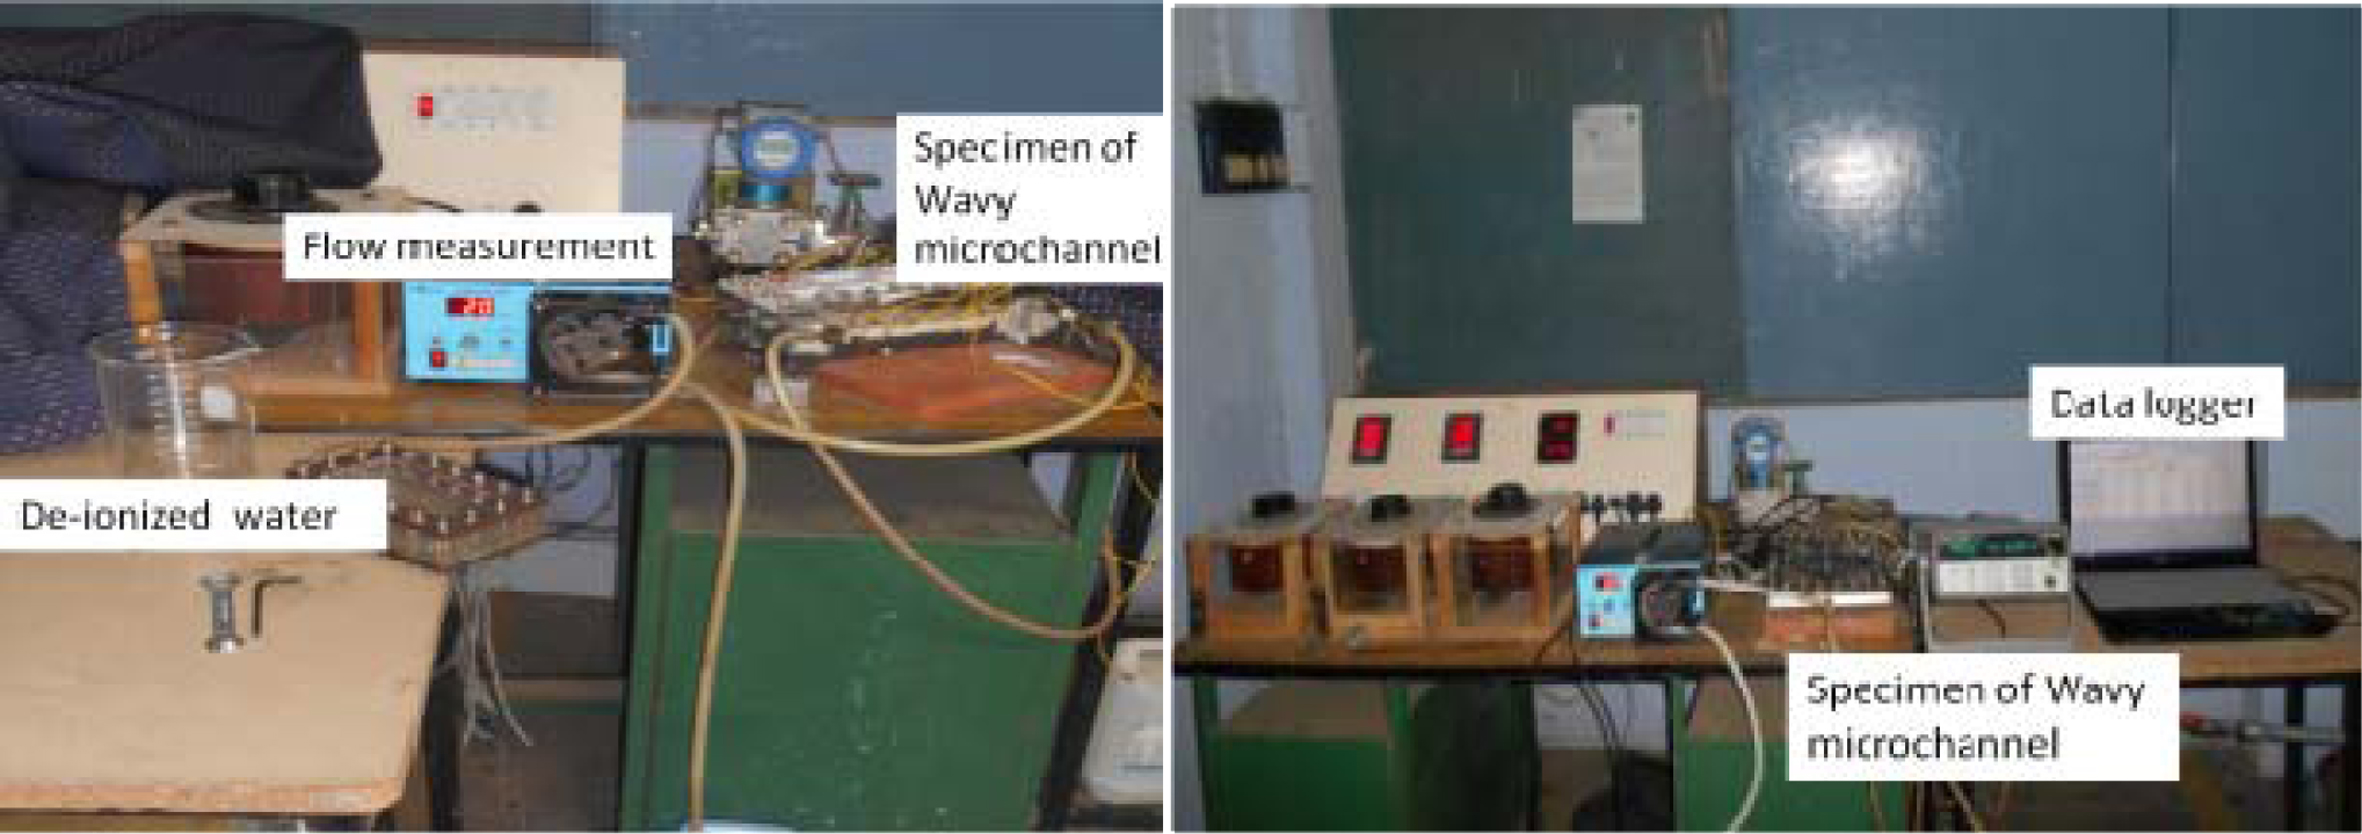
Aluminum trioxide-de-ionized water nanofluid was formulated in two mass fractions namely, 0.1 and 0.25% of the nanoparticles by two-step method which was a widely used for preparing nanofluids. The nano- particles were roughly spherical shaped with a diameter of 15 nm. The dry powdered nanoparticles were first produced in either chemical or physical methods. They were dispersed as a fluid subsequently due to intense magnetic field excitement, ultrasonic disturbance, homo- genizing and ball milling. The nanoparticles aggregate due to the large surface area activity suspension [16, 17]. To circumvent this, surfactants were used to enhance the stability of the nanofluids. The formulation of SiO2-de-ionized water nanofluid was also similar in principle. The nanoparticles were dispersed in the base fluid when the nanoparticles reach adequate mass for the chosen concentration. This was done by vertical axis ultrasonic probe with a frequency of 30 kHz, with the samples exposed to constant irradiation process for duration of 60 min, to allow for optimizing of water conductivity with the addition of TiO2 nanoparticles. Post preparation of each nanofluid, measurements of the fluid pH, fluid viscosity and thermal conductivity were conducted (Fig. 3). The stability times of the stationary-state nanofluid samples are observed to be diverse, which is due to the spherical particles` sedi- mentation velocity.
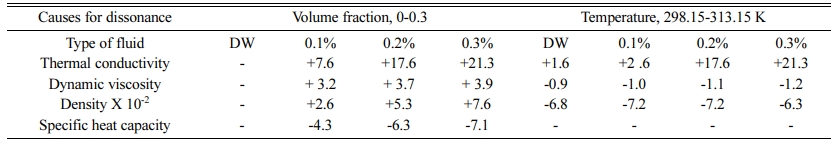
The nanofluids were evaluated for density and specific heat capacity by digital balance and differential scanning calorimeter respectively. The specific heat capacity was observed to decrease with the increasing concentration of the nanoparticles with no significant variations in temperature in that range [18]. The average variations between the properties measured for Al2O3 and SiO2 nanoparticles are listed in Table 4 with the stability graphs represented in Fig. 4.
Developing computational fluid dynamics model
The optimal combination of the inlet header geometry was evaluated by means of software simulation by Computational fluid dynamics (CFD). In the present work, detailed CFD analysis was performed to predict coolant flow performance with respect to different inlet header geometries and inlet entry arrangement. By using mathematical equations, a numerical model was developed to determine the coolant fluid flow behavior within the wavy microchannels [19]. The flow was assumed as three-dimensional, incompressible laminar Newtonian fluid flow. CFD analysis was performed using ANSYS FLUENT (v18.0) software. The formulated conservation equations were solved for mass and momentum by finite control volume method. The analysis involved creation of header geometry, fluid volume extraction, geometry discretization, study of grid independence, specifying flow properties of the fluids, specifying boundary conditions, finding solutions for numerical equations and convergence test, extracting and interpreting results and validation of the obtained results with experimental data.
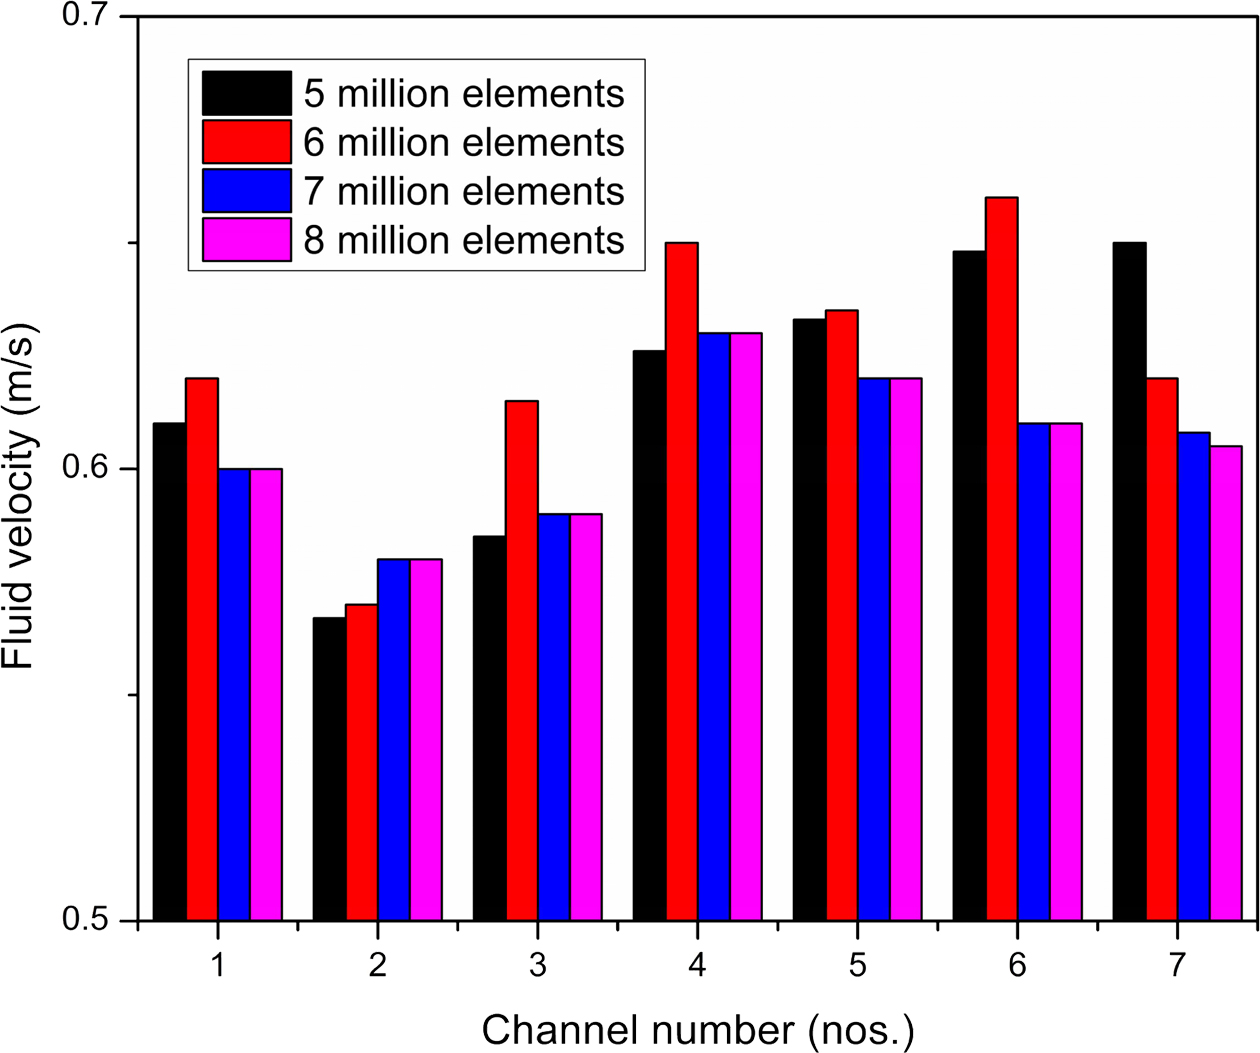
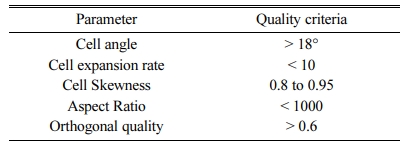
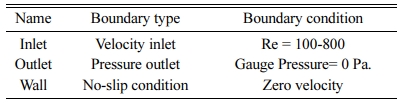
The computational domain was discretized by ANSYS ICEM CFD v18.0 meshing software. Table 5 enumerated the criteria of the mesh quality. The domain was developed with 7 million mesh count. The fluid velocity was compared with the calculated velocity when the initial mesh count was set at 5 million. The observed deviation was higher than 10% and subsequently the mesh count was set at 6 million. The observation in deviation was noted to be less than 1% for both mesh counts without major changes in observation. As a result, the mesh count selected was 7 million to evaluate the solution time. The mesh independence study is inferred in Fig. 5. Table 6 enumerated the boundary conditions of the present work. The computational domain utilized a pressure based double precision solving multiprocessor. The validated K-ε turbulence model was the turbulence of the fluid flow.
The semi-implicit pressure linked equation method was utilized in developing the governing equation pressure-velocity coupling. The method used a solution convergence with 1e-6 residual for velocity and pressure. A solution convergence criterion of residual of 1e-6 was fixed for pressure and velocity. The three-dimensional forced convectional flow and heat transfer analysis were made by ANSYS FLUENT software package. The analysis involved the following assumptions for the fluid:
• The fluid has zero thermo-physical property varying with temperature;
• Incompressible viscous Newtonian fluid;
• No velocity slip within solid walls;
• Continuity of temperature and heat flux at all solid boundaries.
For simulations involving fluid flow, constant fluid inlet and outlet pressure were the boundary conditions. For simulation involving thermal conditions, constant fluid inlet temperature was assumed to be the condition for the boundary limit due to the walls being assumed as insulators [20]. The source for heat was assumed to be in the center of the channel in the direction of the flow to the other side of the wavy surface [21].
|
Fig. 1 Different inlet header section geometries for wavy channel in the investigation. |
|
Fig. 2 Experimental apparatus. |
|
Fig. 3 Preparation of nanofluid. |
|
Fig. 4 Stability graph of nanoparticles (a) Al2O3 (b) SiO2. |
|
Fig. 5 Mesh independence analysis. |
|
Table 4 Average variations of measured properties with volume fraction and temperature (%). |
Effect of sinusoidal heat flux on wavy channel
The influence of sinusoidal heat flux with varying heat flux amplitudes on the wavy channel is investigated. The amplitude of the microchannel is set at x/L=0.3 for three values of amplitudes, α=0.25; 0.5 and 0.75. The combined effects of heat flux amplitude on average Nusselt number for laminar regime (95
Effect of inlet header geometry on Nusselt Number
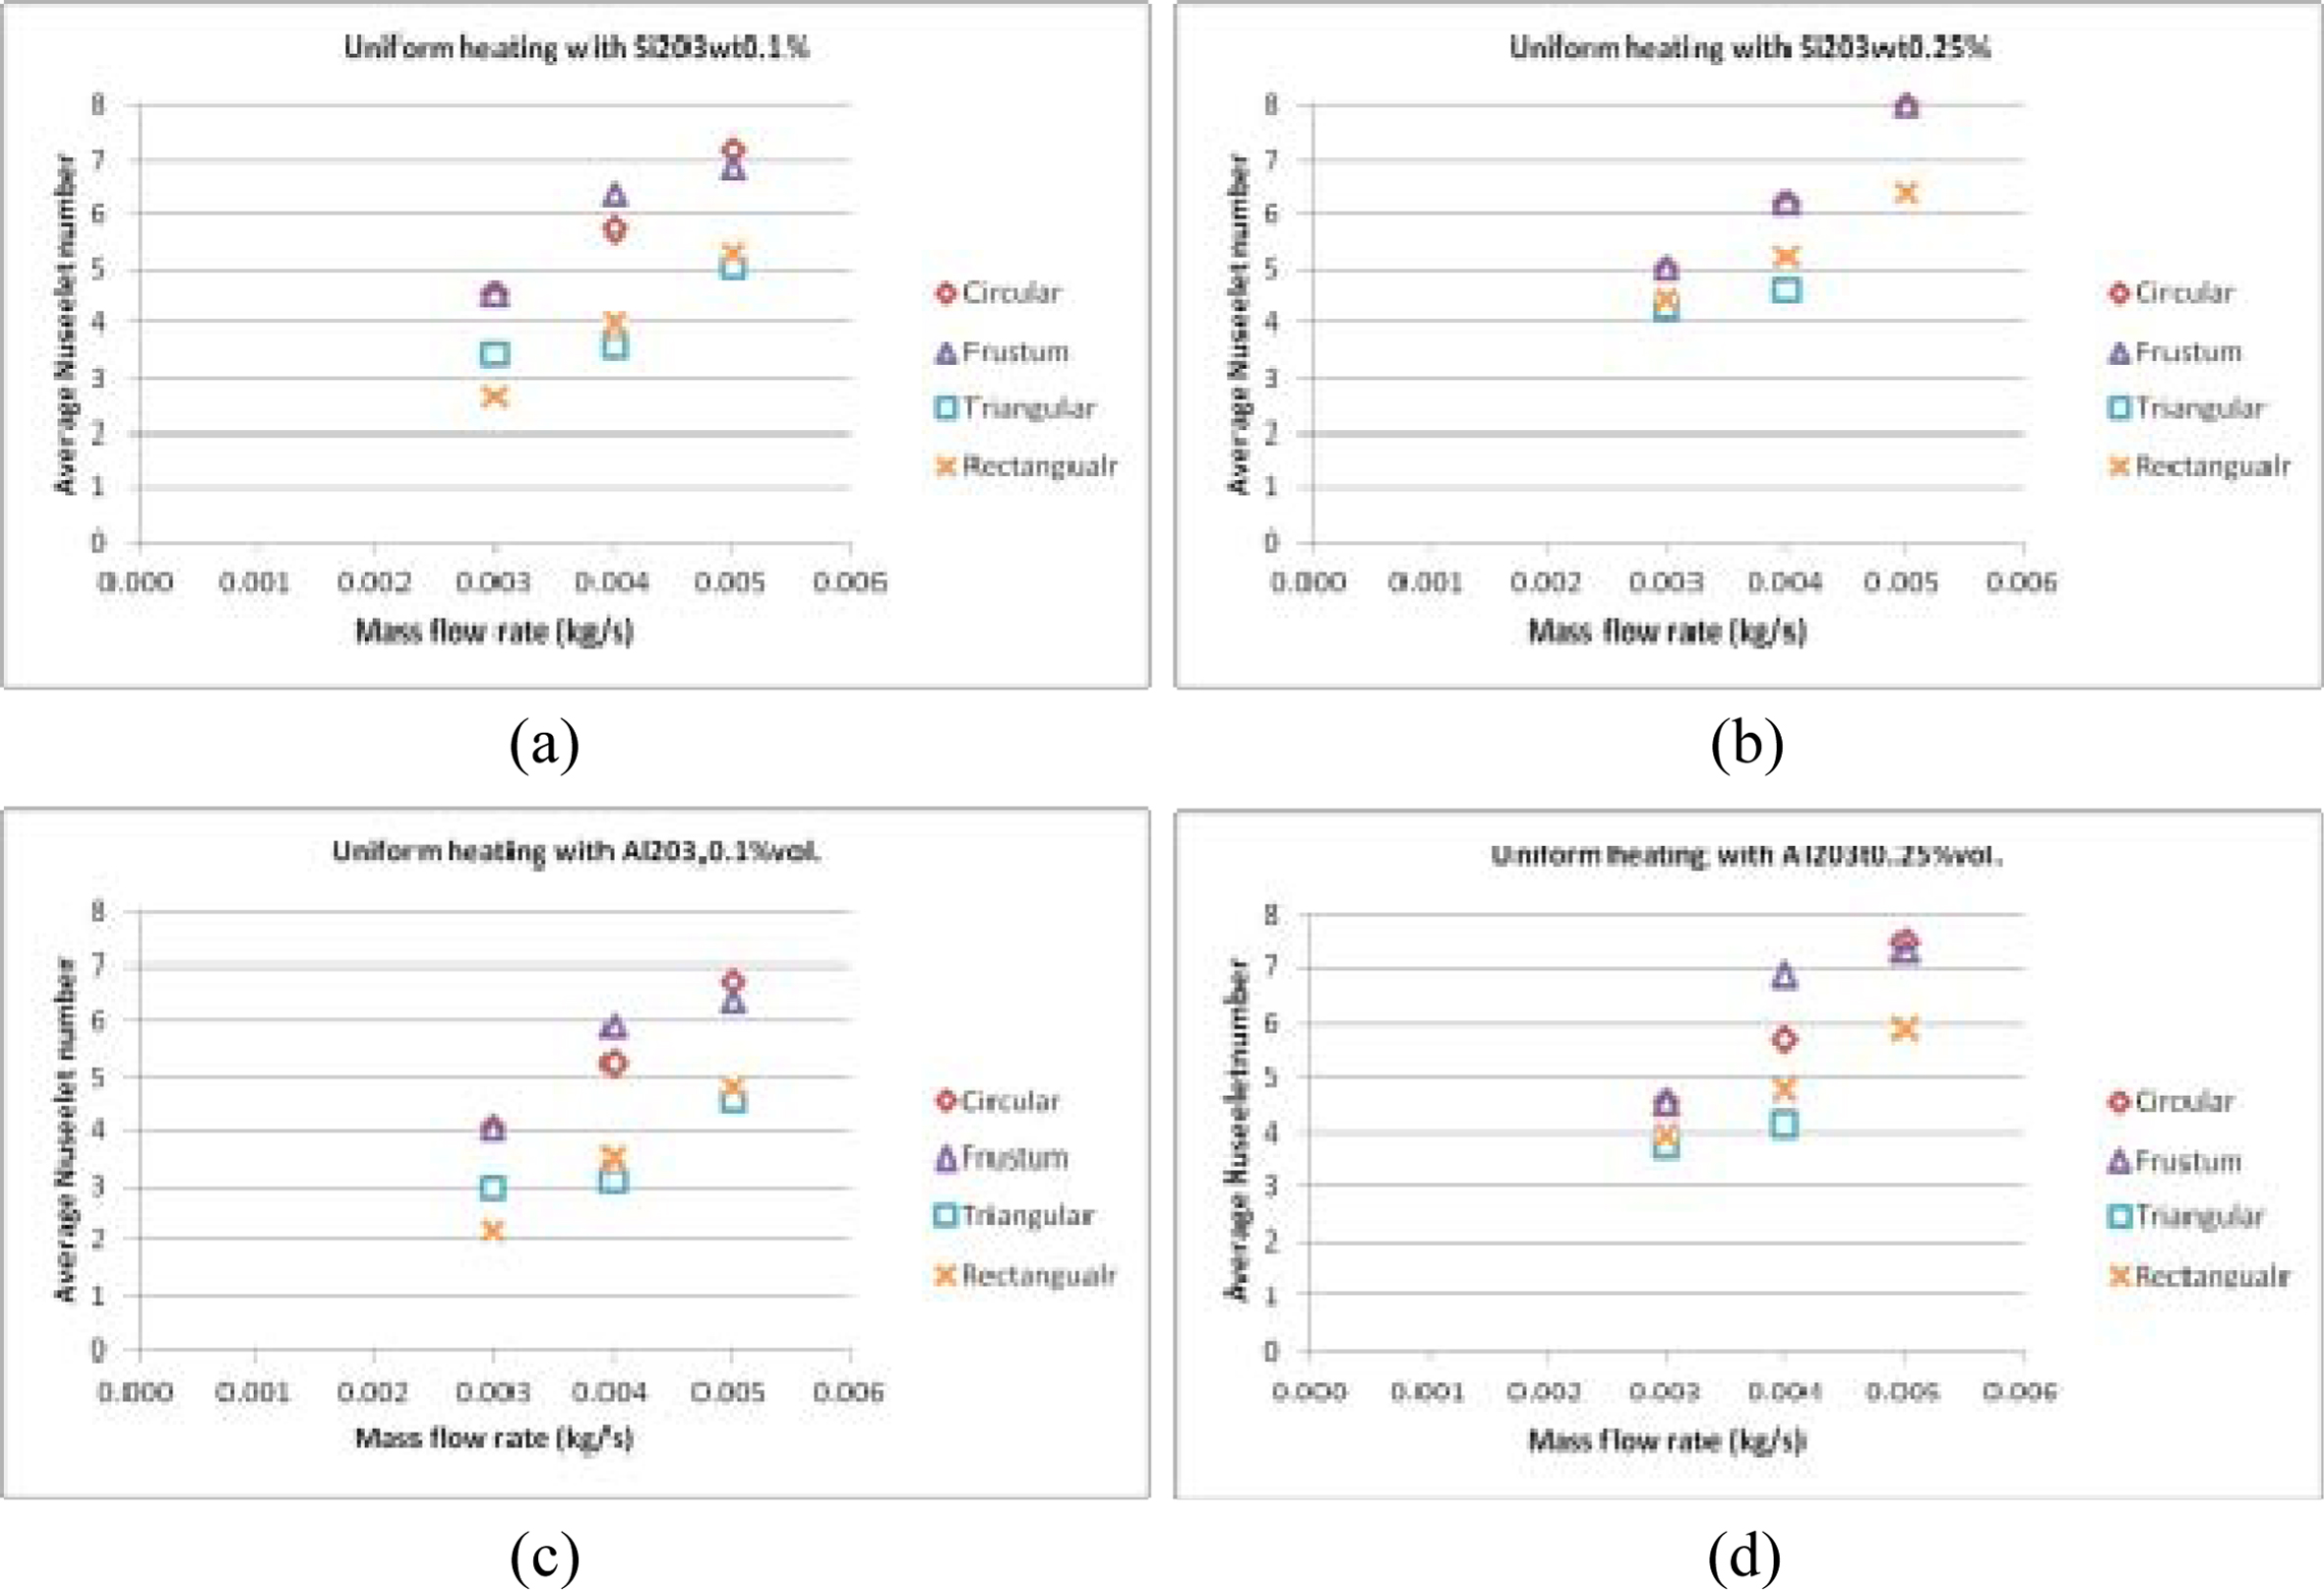
The numerical investigation for identifying the in- fluence of inlet header geometry on local Nusselt number was performed by subjecting the microchannels with different inlet headers to homogeneous heating of 40 W/cm2. The coolant temperature of the coolant fluids entering the wavy microchannels is 293.15 K under constant Reynolds number of
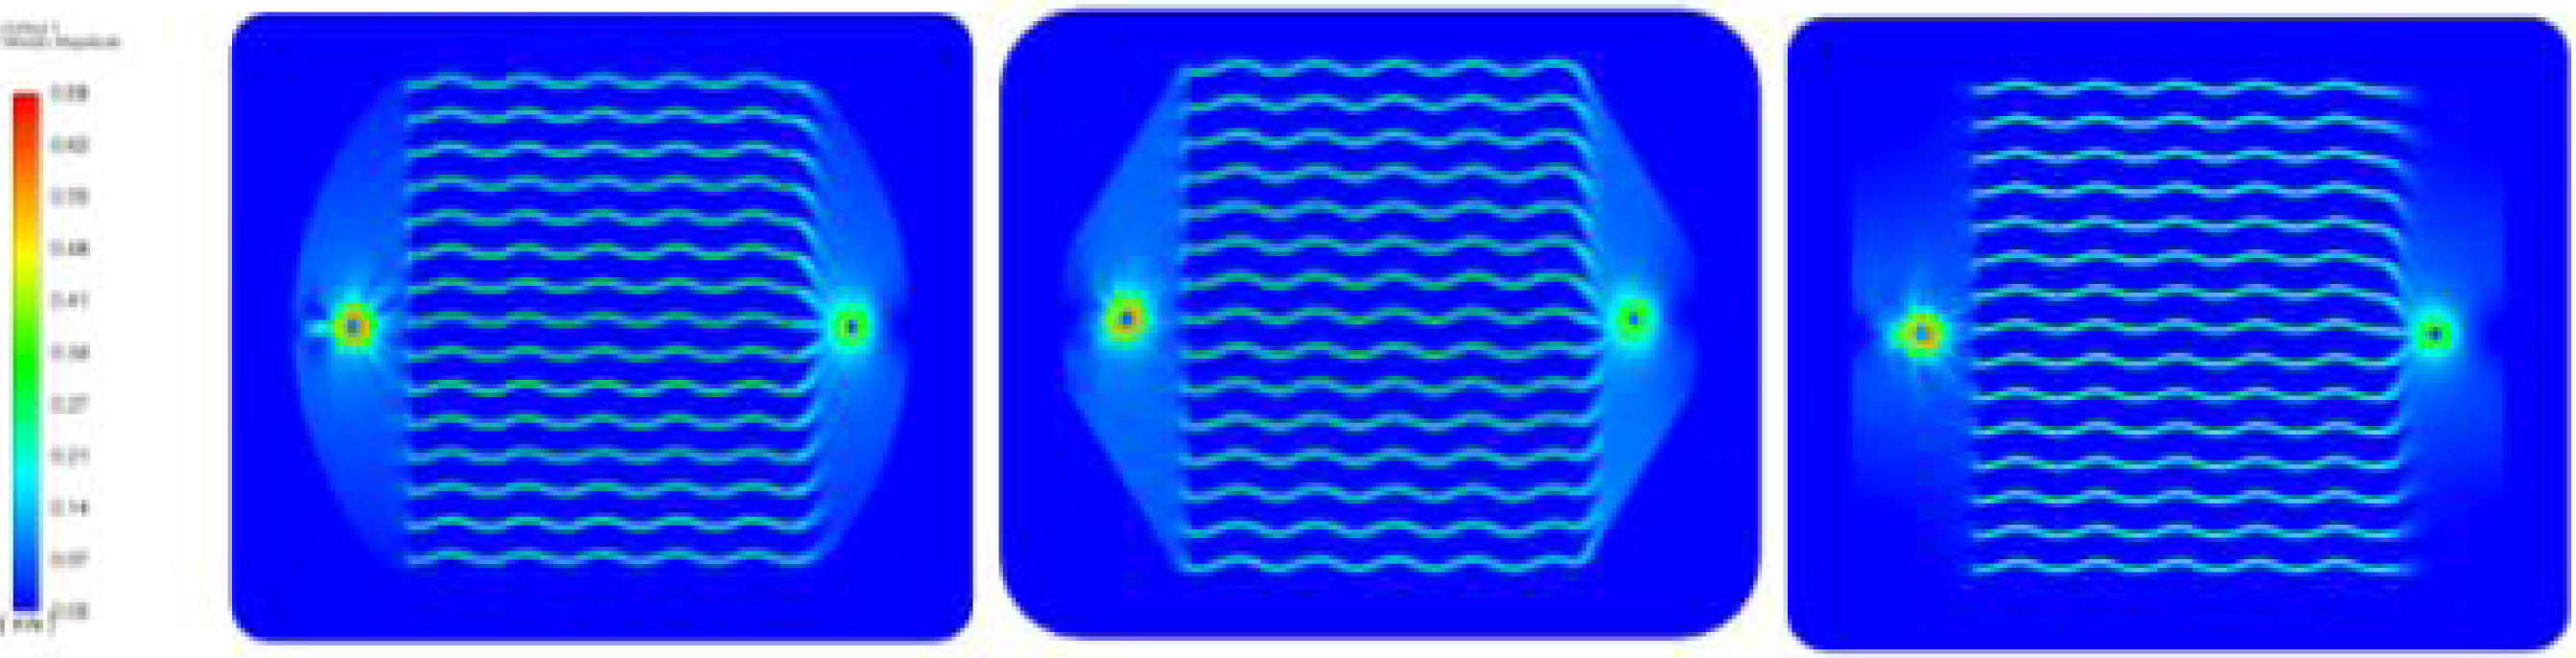
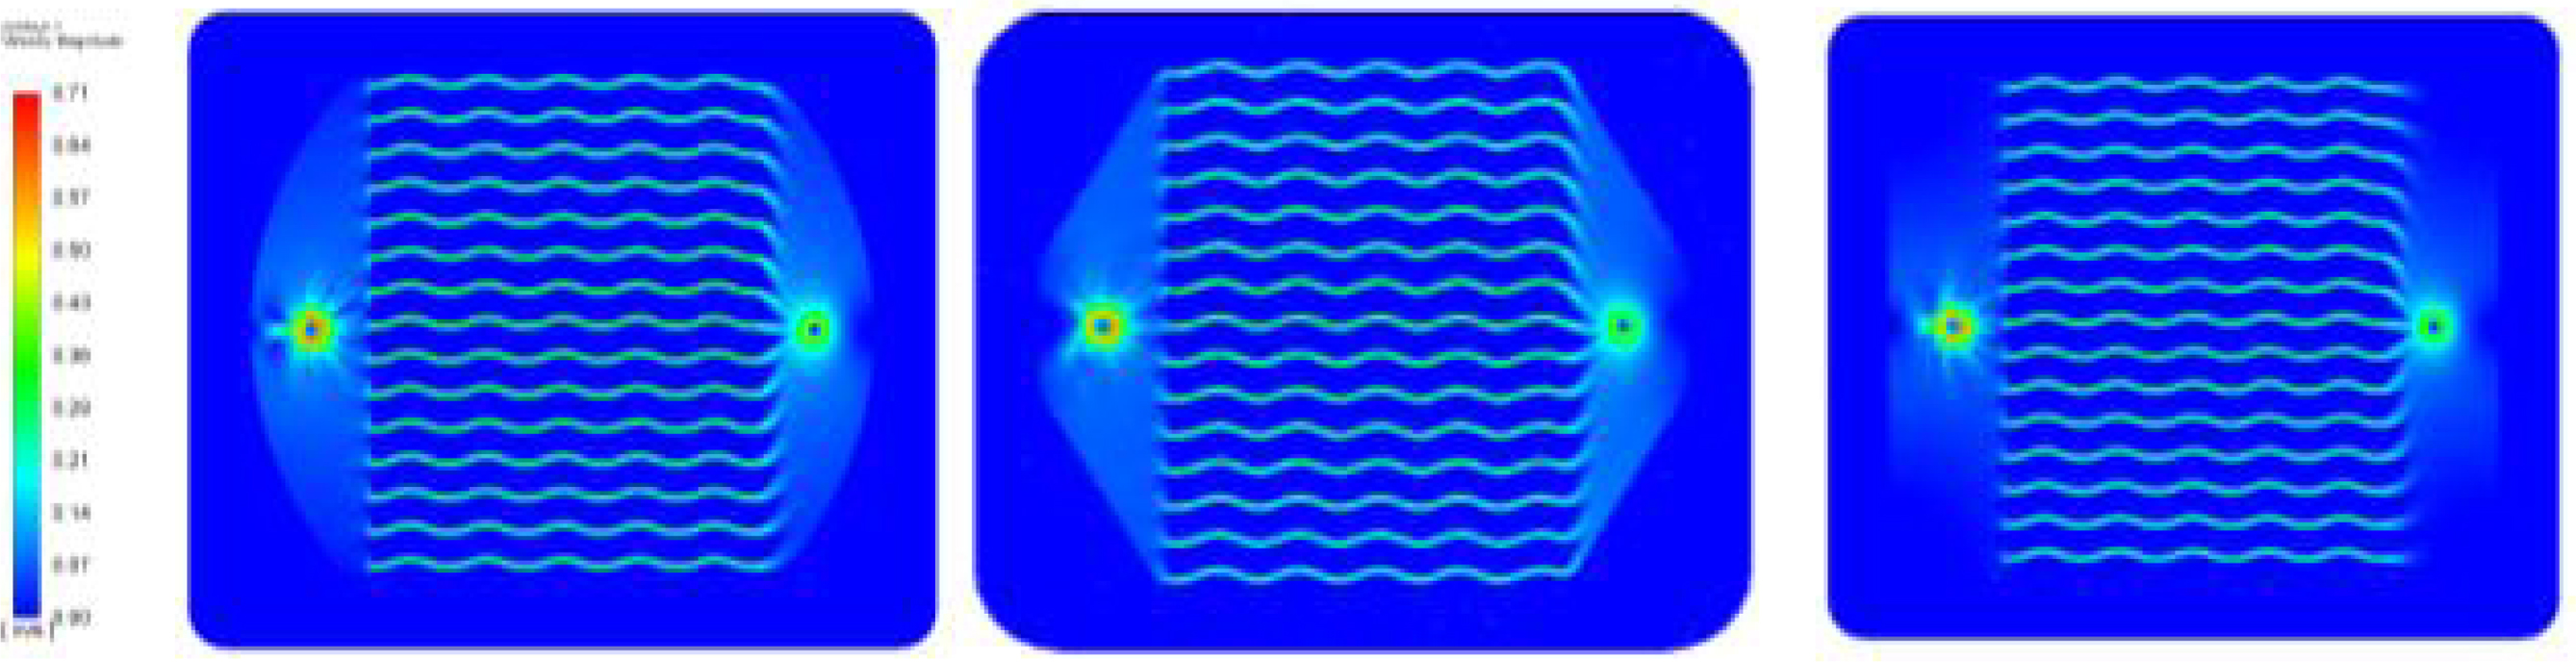
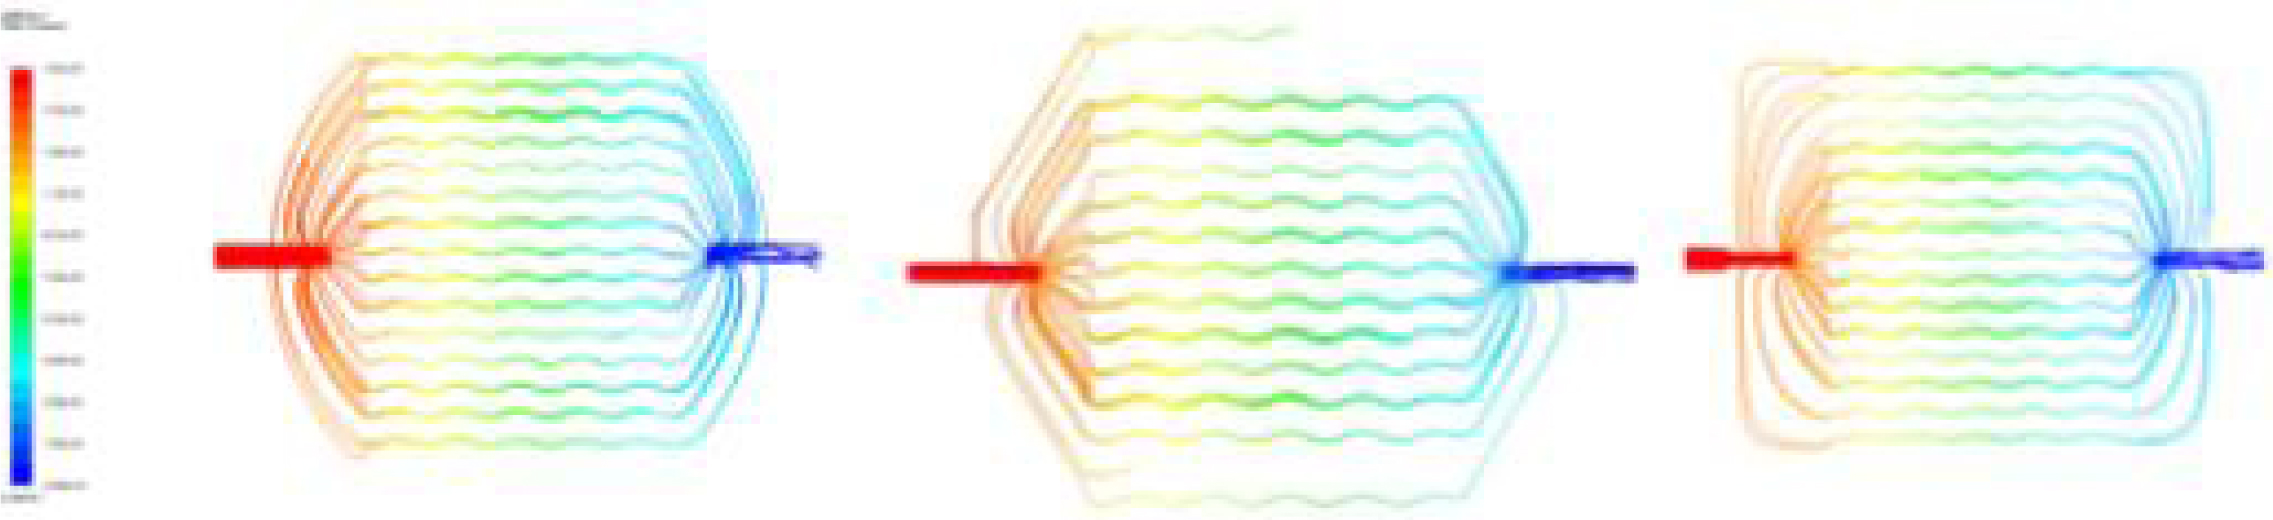
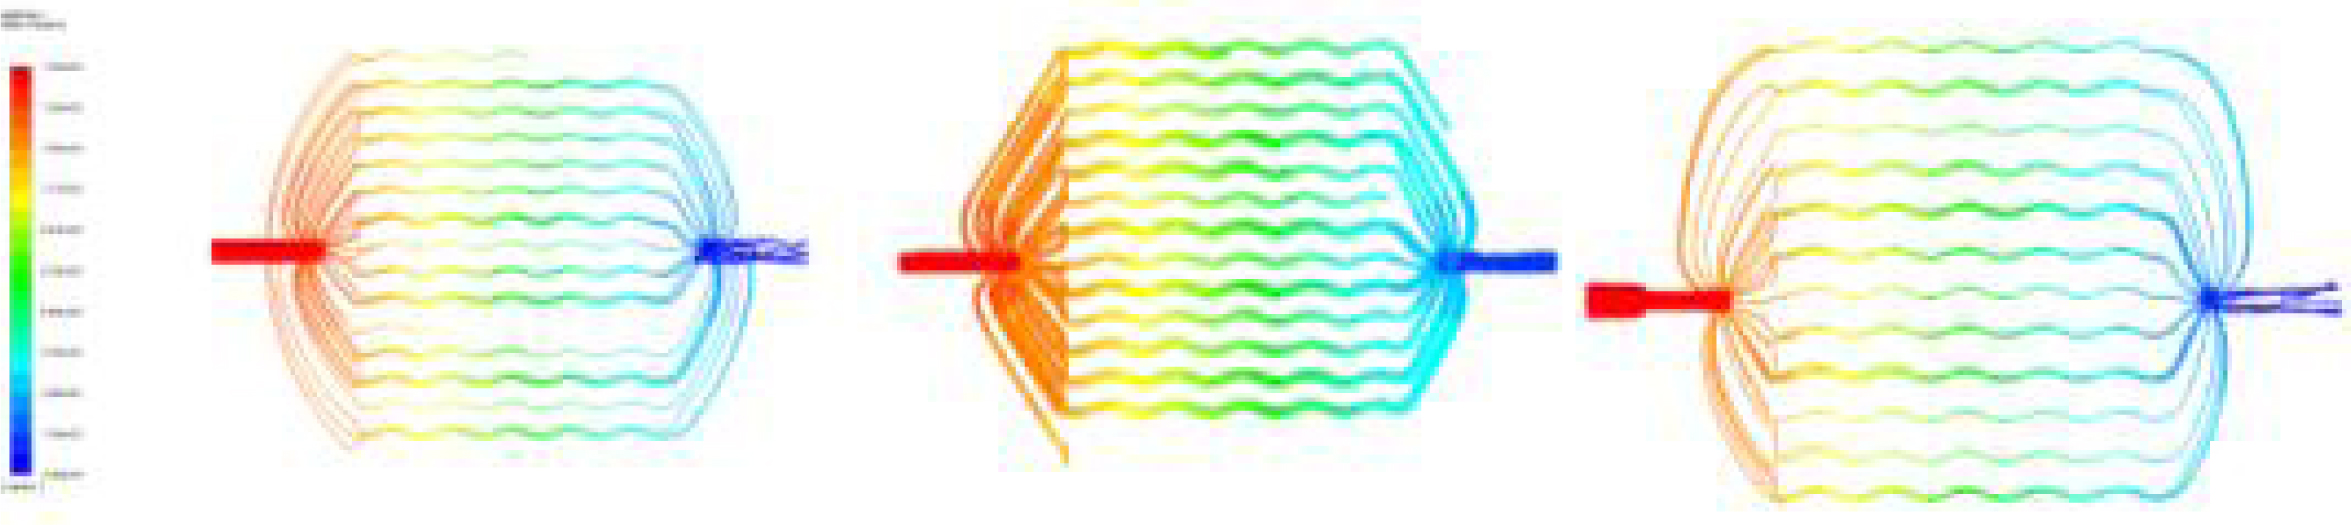
The velocity profiles of the four-inlet header wavy microchannels for when using SiO2 (Fig. 12) and Al2O3 (Fig. 13) based nanofluid were developed. The velocity profile of the wavy microchannel with triangular inlet header the heat transfer performance observed was comparatively inferior to the other three inlet header types and thus excluded from the numerical study.
Effect of header geometry on Friction factor
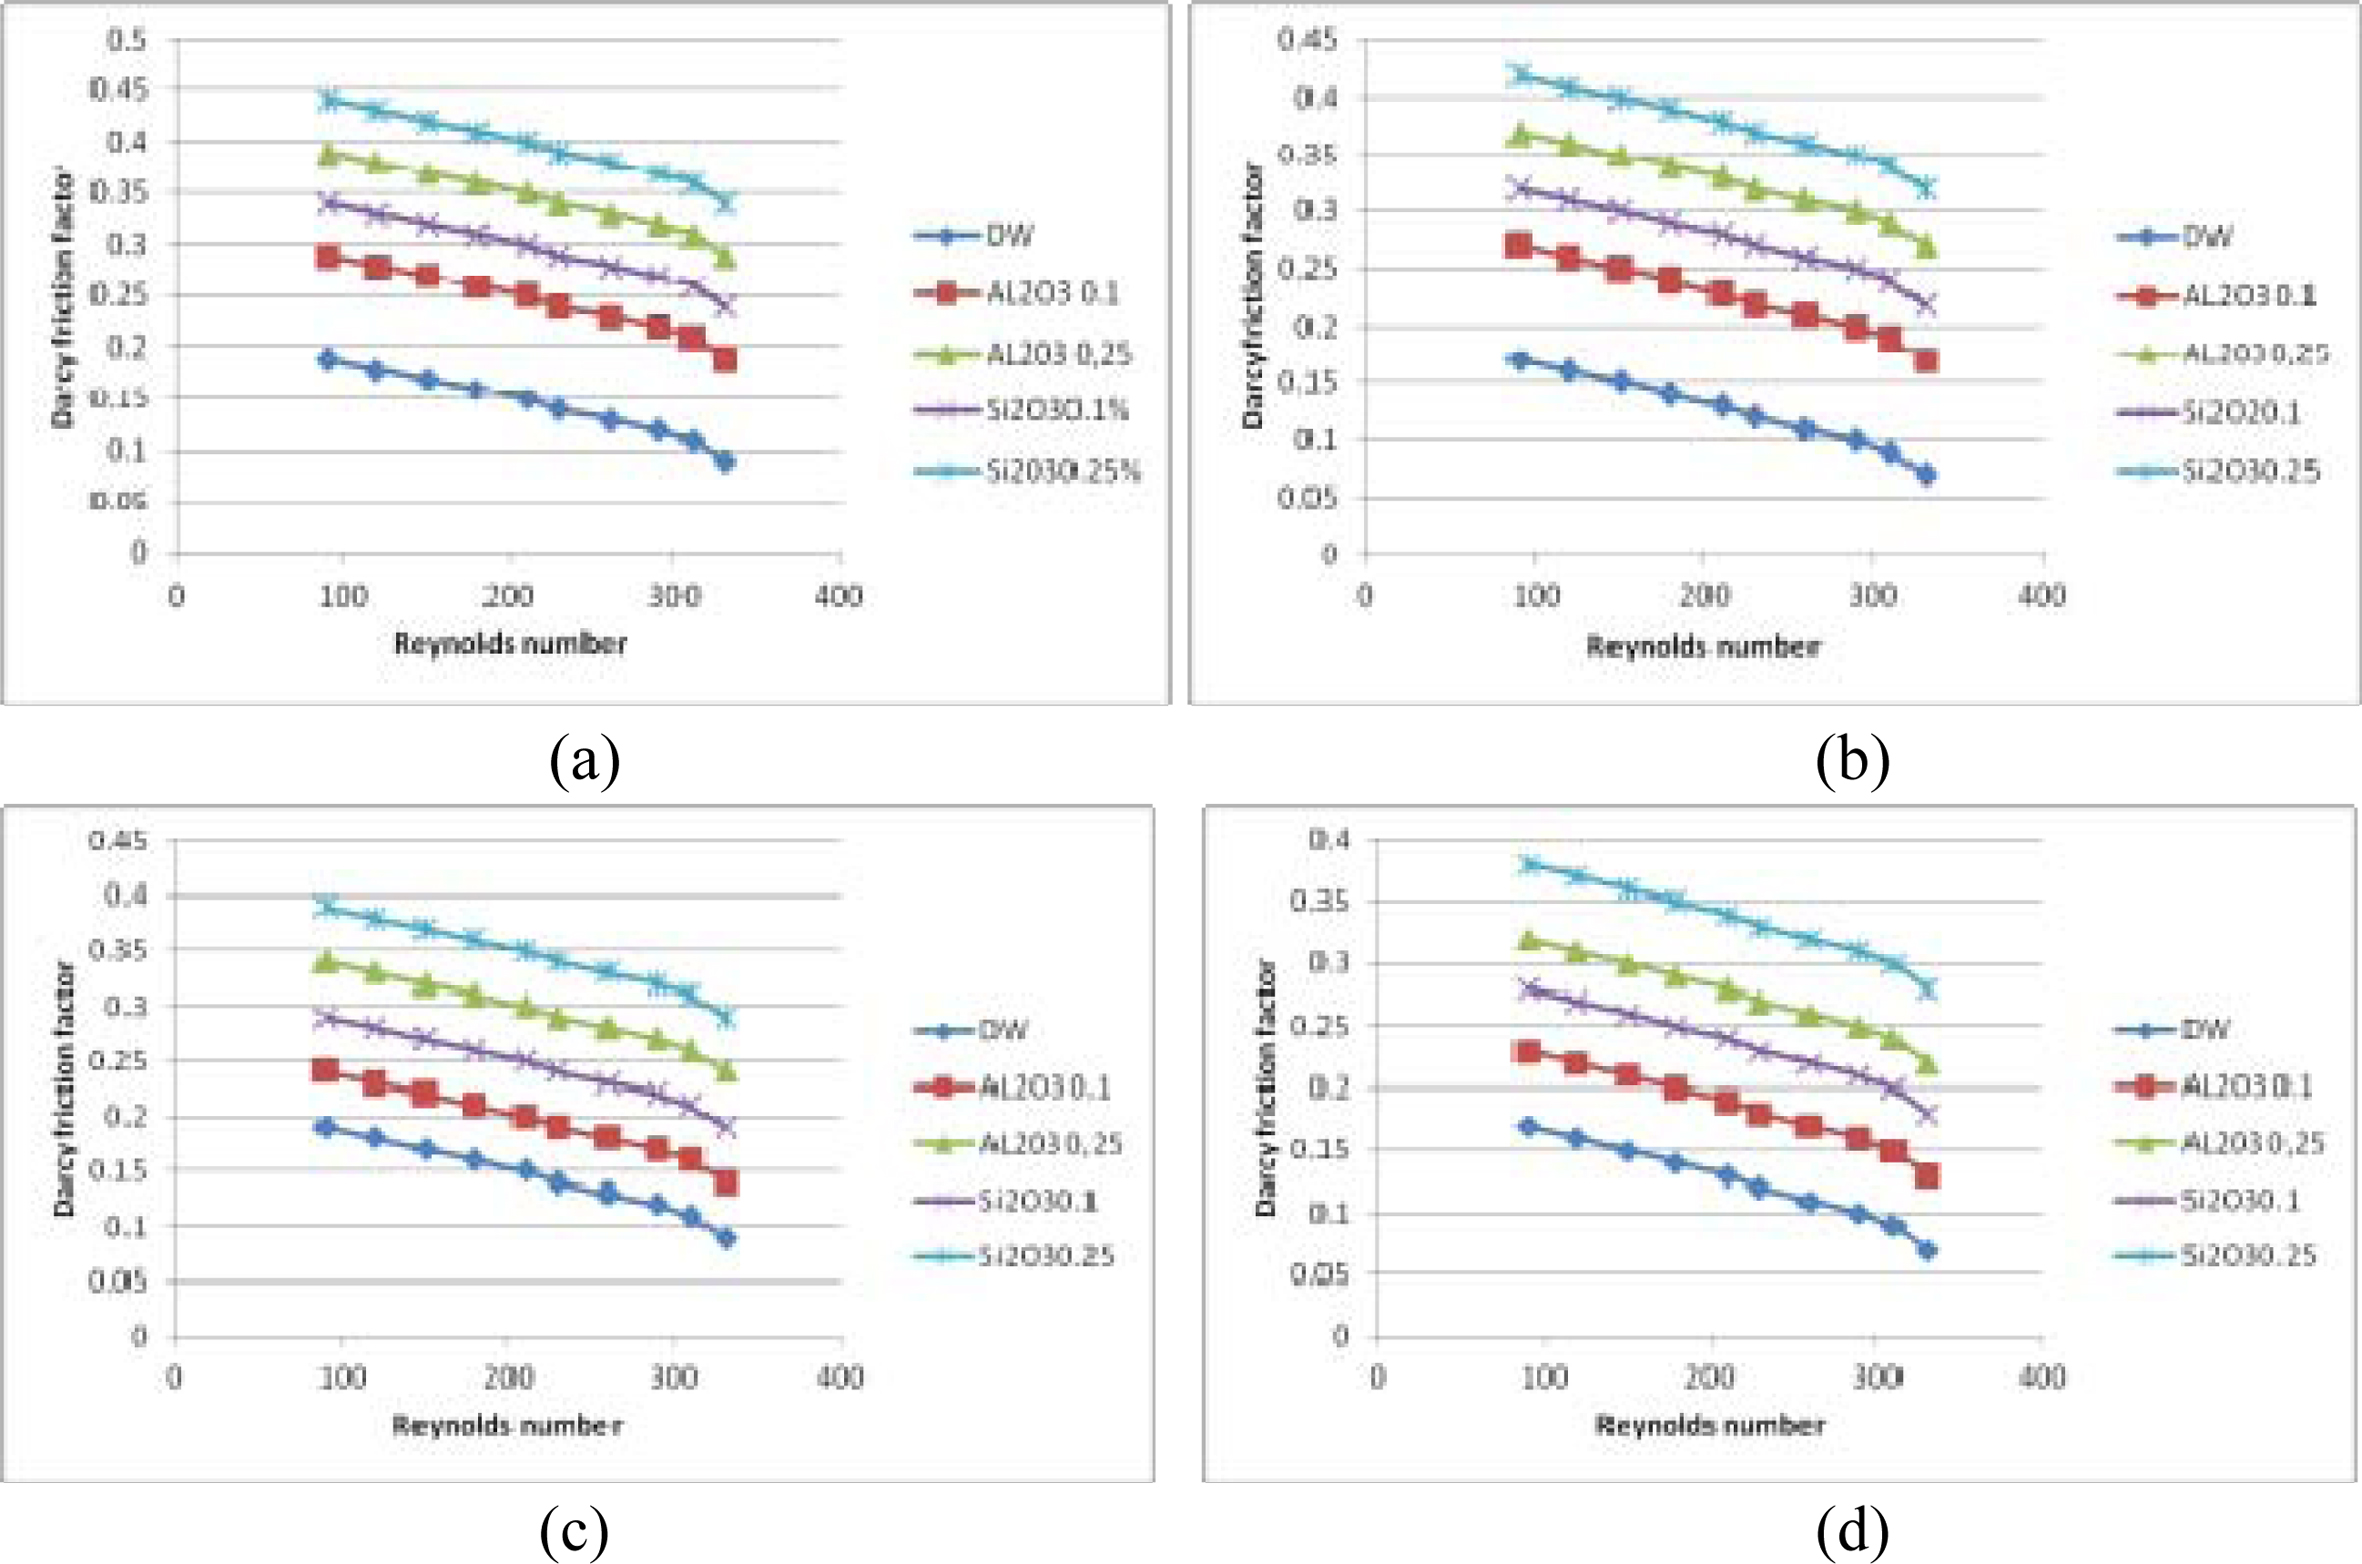
The present investigation utilized the Darcy’s principle of friction factor f, in the form of Colburn j-factor equation for adiabatic experiments. The friction factor f was ratio shear stress of the wall and kinetic energy flow per unit volume. The relation between the heat transfer performance and drop in pressure were established by f and j factors. The improved heat transfer rates which were influenced by losses in pressure and increasing friction factor were plotted graphically. The highest-pressure loss observed was 1.594 kPa and maximum friction factor was 0.45. The pressure losses are attributed to increased fluid perturbation, high fluid wave amplitude in the narrow section of the micro- channel. The relation between Darcy friction coefficient and Reynolds number for the four inlet header geometries was observed from Fig. 14.
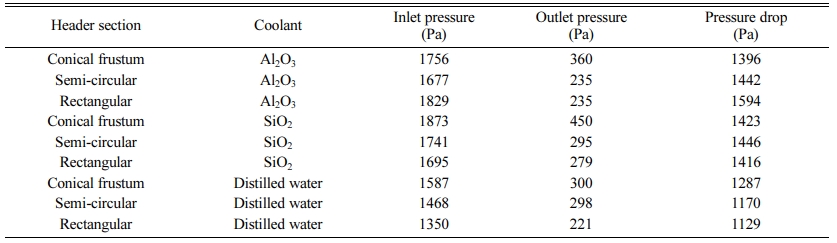
The data represented on the plot were obtained during circulation of the different nanofluids through the four different inlet header microchannels. The observation of the effect’s nanoparticle concentration of the nano- fluid on the pressure drop and behavior of friction factor for nanofluids Al2O3 (Fig. 15) and SiO2 (Fig. 16) were recorded. The dwindling friction coefficient against Reynolds number observed in Fig. 15 revealed an asymptotic trend in all four inlet header geometries of the wavy microchannels. The increasing nanoparticle concentrations in the nanofluids resulted in increase of coefficient of friction which otherwise decreased with increasing Reynolds number [21, 22]. It can be observed that the circulation of heat due to drop in pressure was more pronounced in rectangular inlet header than the case in semi-circular and conical frustum inlet headers. Between semi-circular and conical frustum geometry, the heat transfer and dissipation are observed to be slightly better in conical frustum, due to the straight-line geometry at the inlet and the exit of the micro- channel causing better heat absorption and dissipation throughout the fluid flow. This trend was most apparent in the case when the nanofluid SiO2 is circulated in the wavy microchannels with different inlet headers, where the conical frustum geometry exhibited enhanced performance in terms of pressure regulation and heat dissipation (Fig. 16).
Consistent increment of nanoparticles at a rate of 0.1 volume percentage leads to increase of friction factor by 95% with Reynolds number, Re = 300 and the same was true for the nanofluid concentration of 0.25 volume percentage, with Re = 400. The peak friction factor was observed at the nanoparticles concentration of 0.25 volume percentage for the entire range of Reynolds number in the present study. This was due to decrease of average fluid flow speed caused by the addition of nanoparticles concentration at 0.25 volume percentage. The change in friction factor was dependent on viscosity and nanofluid`s thermal conductivity [23]. Similarly, the friction factor also varied as per enhanced concentration of the nanoparticles in the nanofluid at 0.1-0.25 volume percentage. The drop in pressure which influenced the friction effects of the different nanofluids in the present study was listed in Table 7.
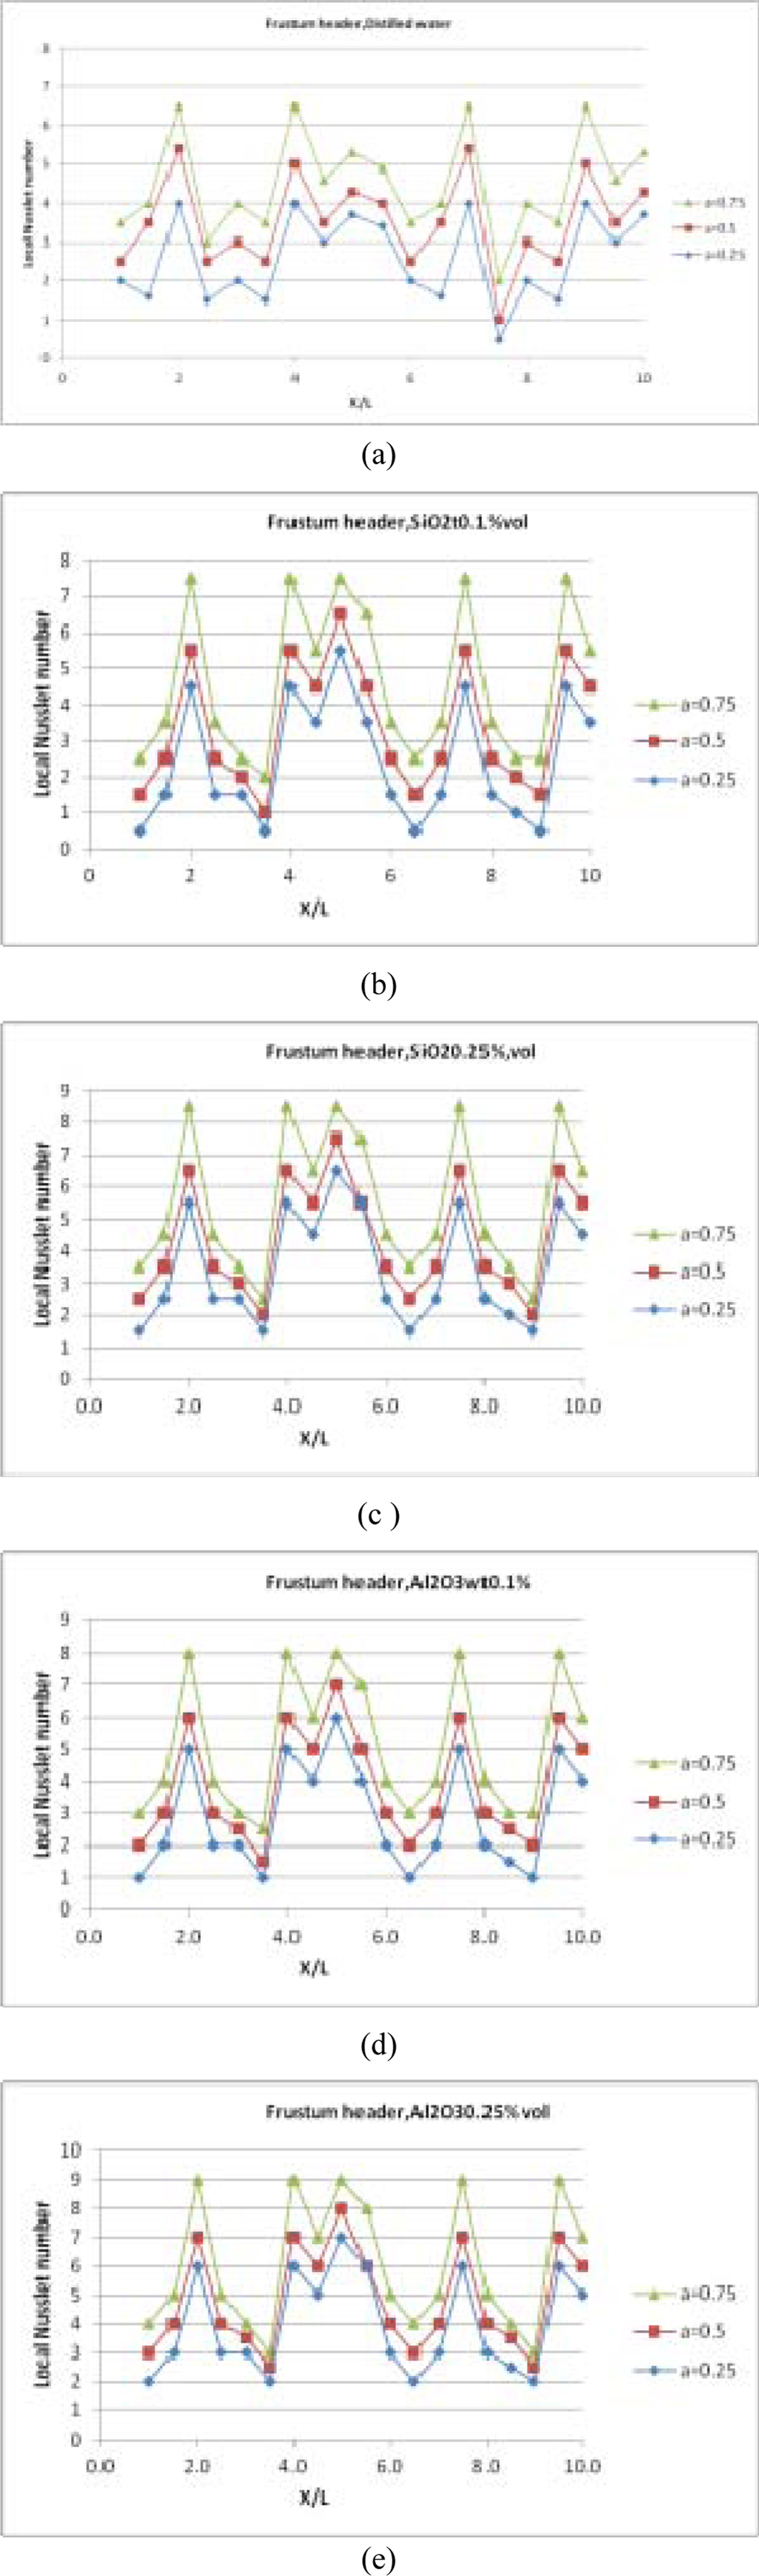
|
Fig. 6 Difference in trend of local Nusselt number at top of the wavy microchannel wall with conical frustum inlet header for three amplitude values |
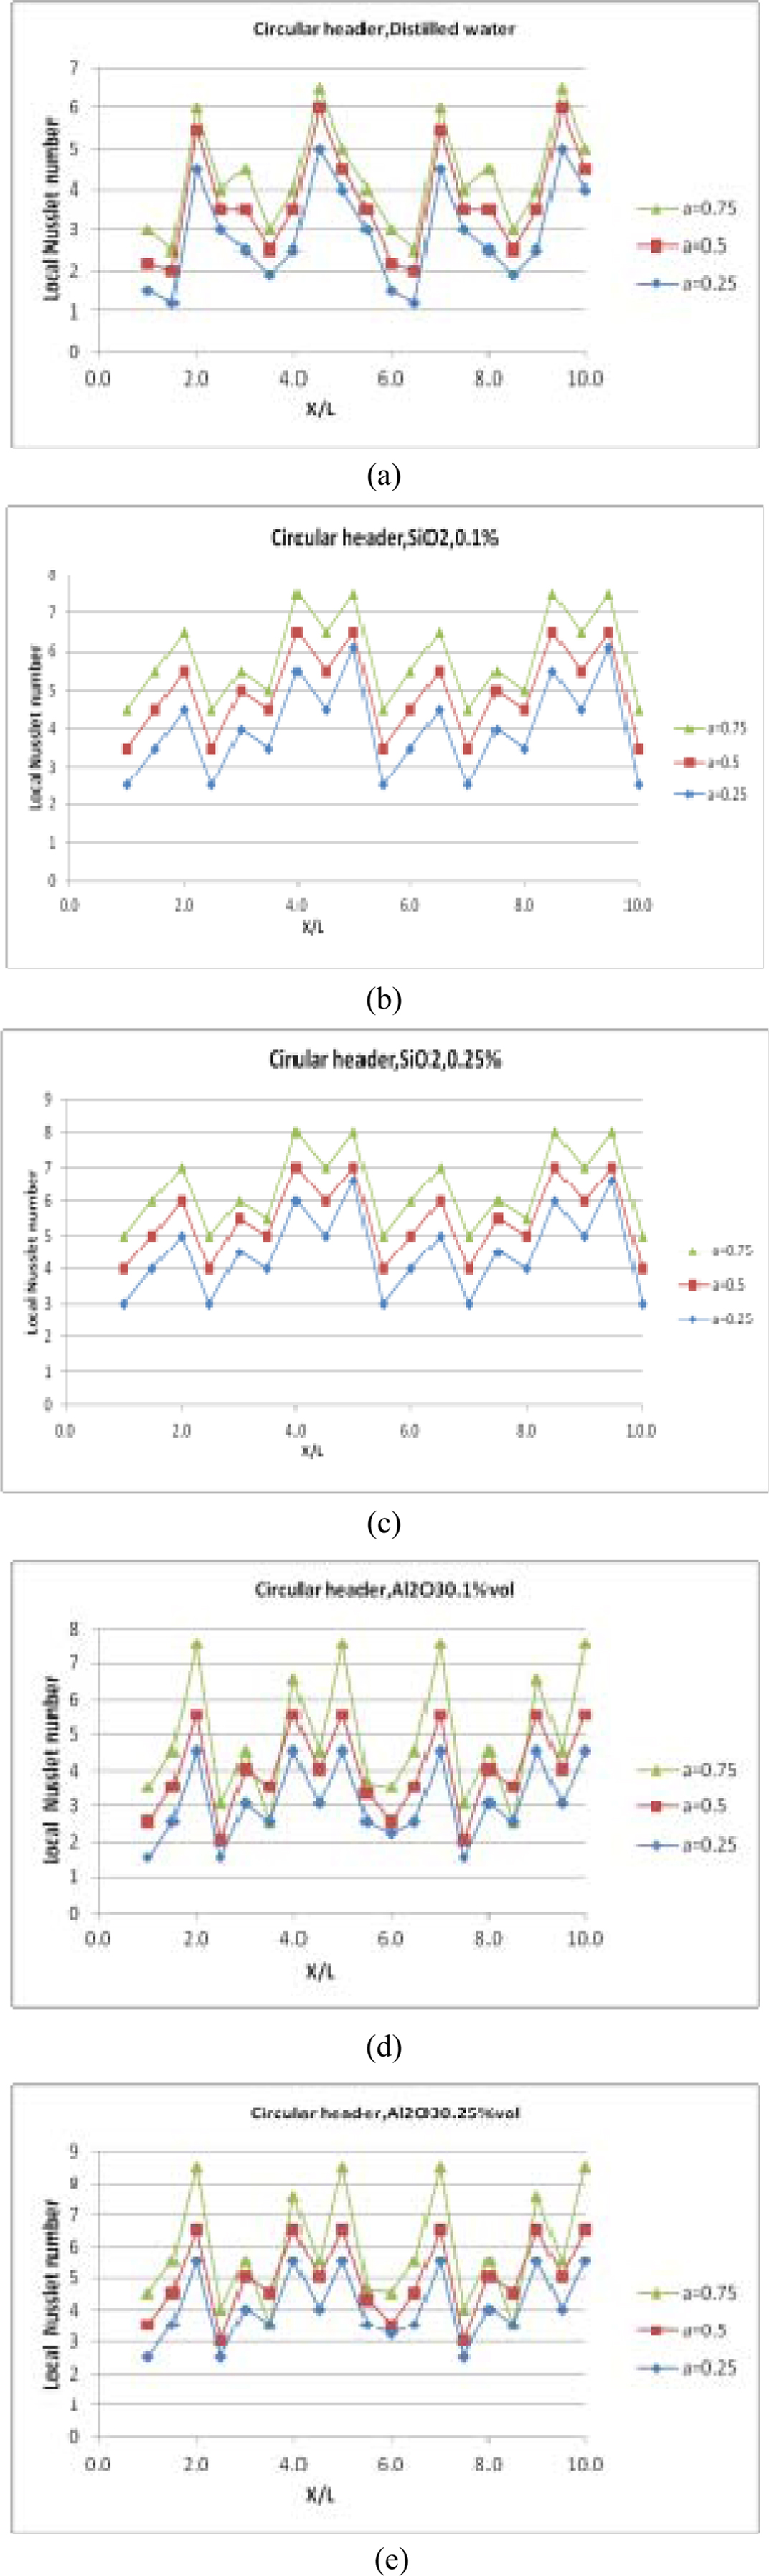
|
Fig. 7 Difference in trend of local Nusselt number at top of the wavy microchannel wall with semi-circular inlet header for three amplitude values |
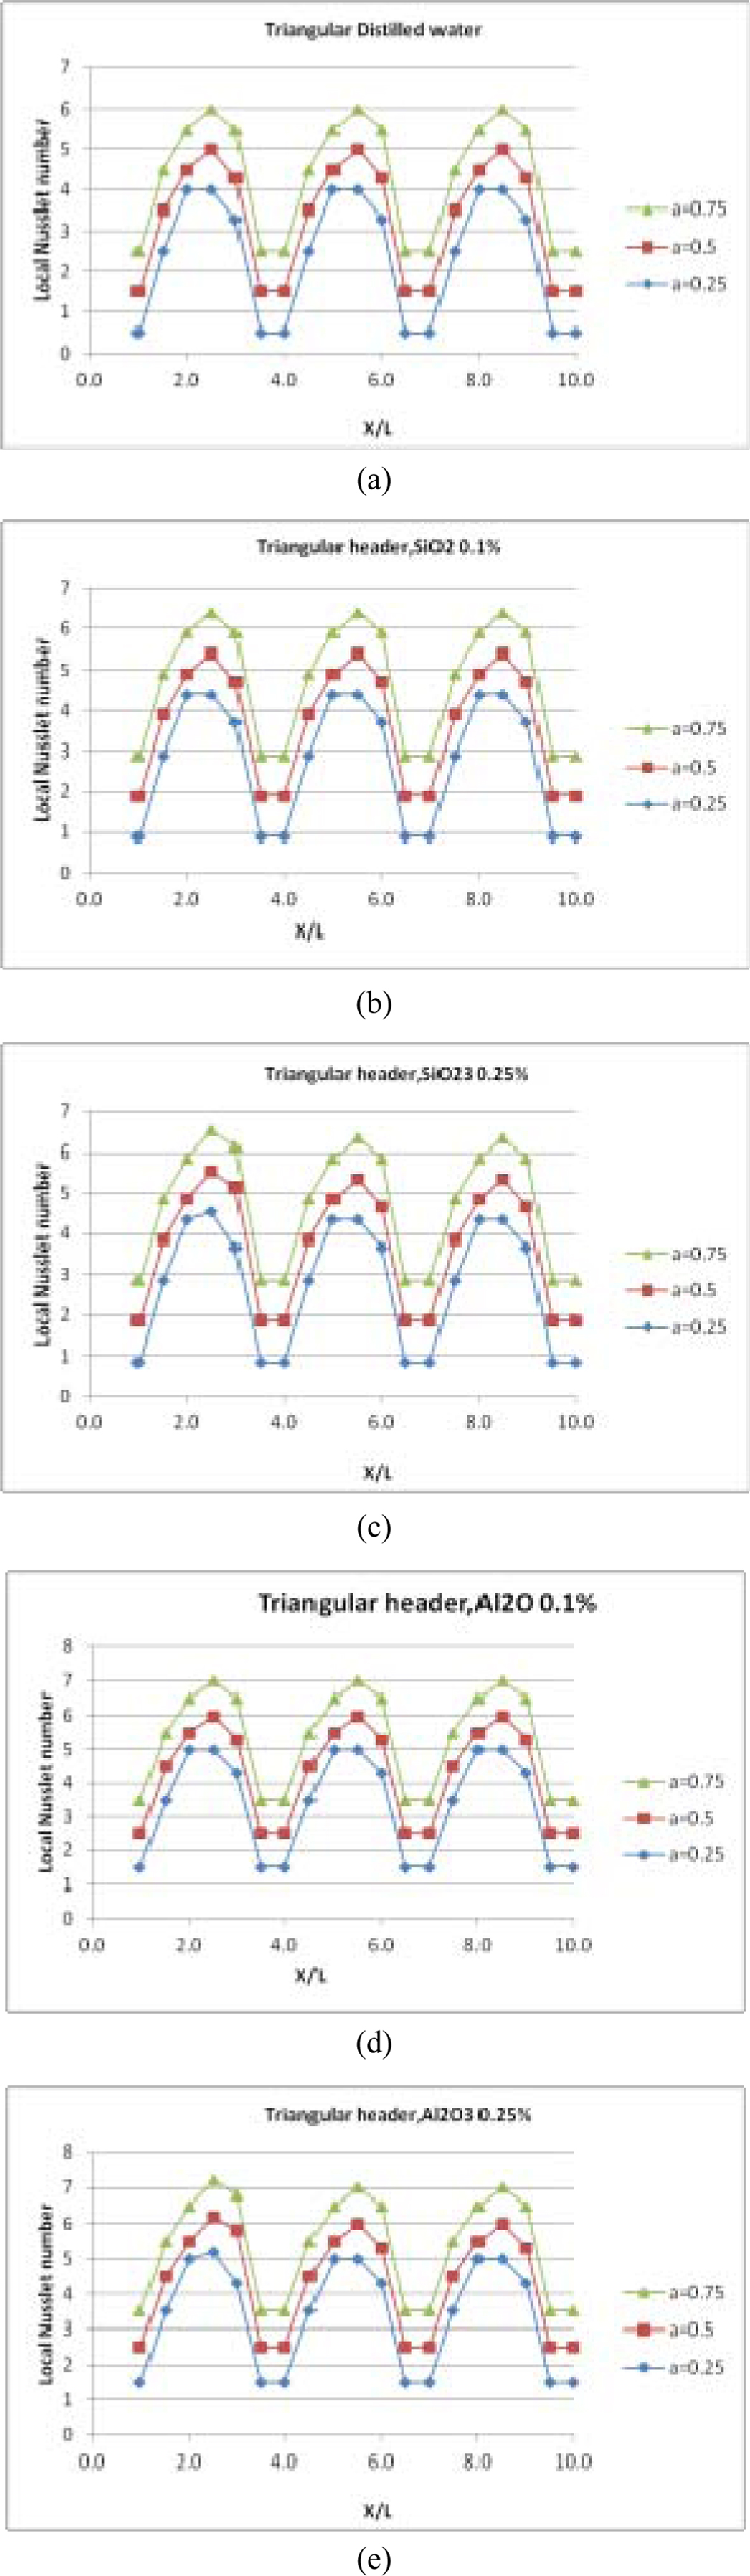
|
Fig. 8 Difference in trend of local Nusselt number at top of the wavy microchannel wall with triangular inlet header for three amplitude values |
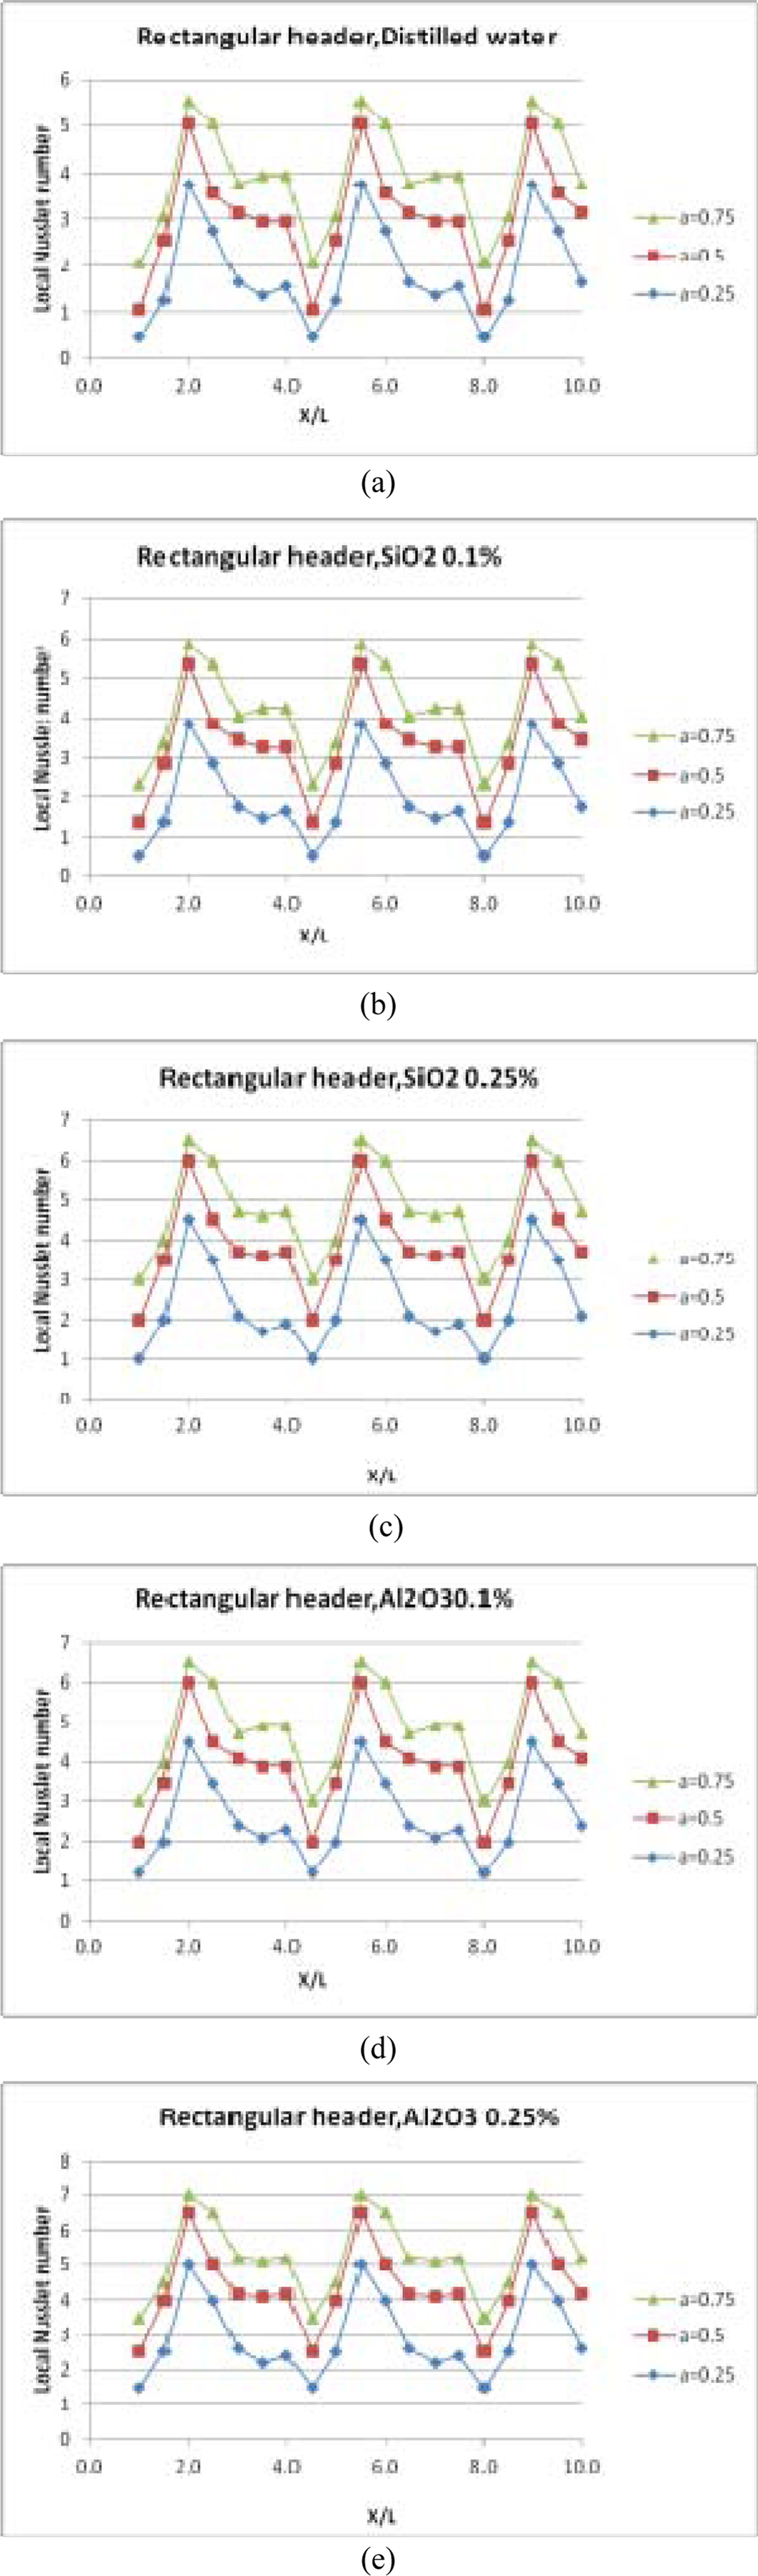
|
Fig. 9 Difference in trend of local Nusselt number at top of the wavy microchannel wall with rectangular inlet header for three amplitude values. |
|
Fig. 10 Variation of average Nusselt number with respect to mass flow rate (a) SiO2, 0.1%; (b) SiO2, 0.25; (c) Al2O3, 0.1%; (d) Al2O3, 0.25% volume percentages |
|
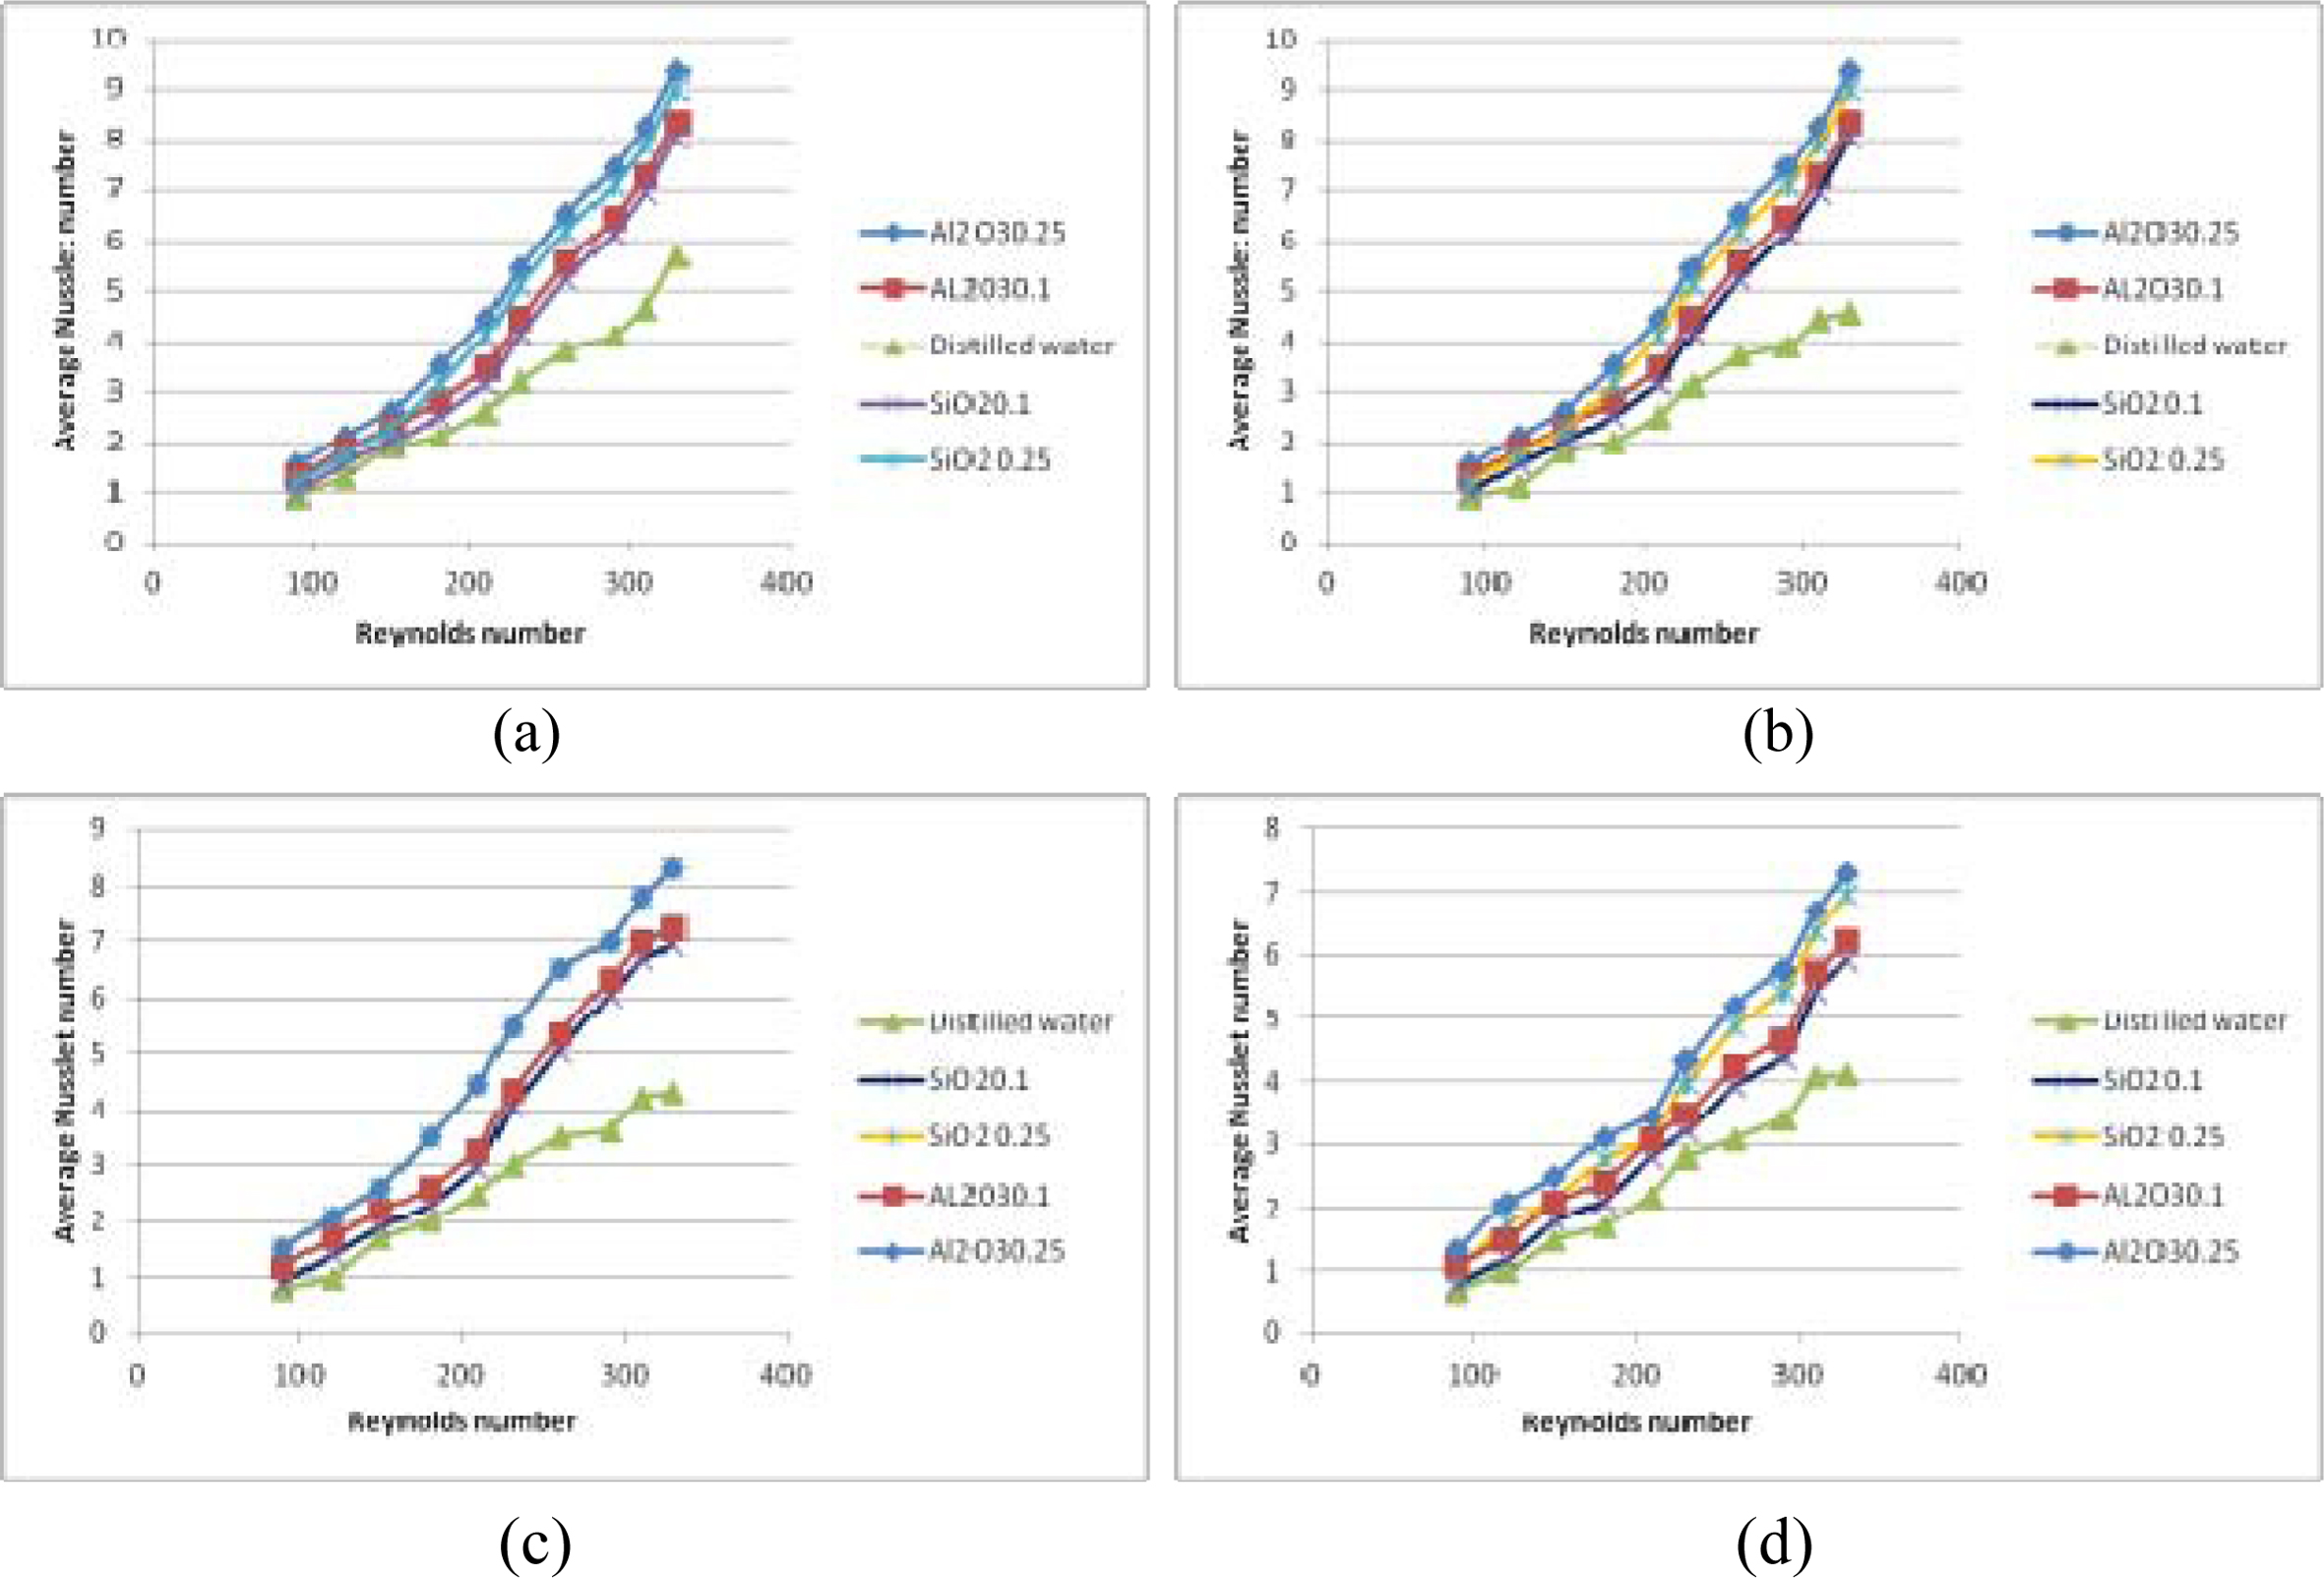
Fig. 11 Difference of average Nusselt number against Reynolds number for inlet headers (a) semi-circular (b) conical frustum (c) triangular (d) rectangular geometry. |
|
Fig. 12 Velocity profile of inlet headers (a) semi-circular (b) conical frustum (c) rectangular geometry while using Al2O3. |
|
Fig. 13 Velocity profile of inlet headers (a) semi-circular (b) conical frustum (c) rectangular geometry while using SiO2. |
|
Fig. 14 Friction factors of inlet headers (a) Semi-circular (b) Conical frustum (c) Triangle (d) Rectangle |
|
Fig. 15 Pressure drop of inlet headers (a) Semi-circular (b) Conical frustum (c) Rectangle while using Al2O3. |
|
Fig. 16 Pressure drop of inlet headers (a) Semi-circular (b) Conical frustum (c) Rectangle while using SiO2. |
In the present work the experimental and numerical investigations on a wavy microchannel had been suc- cessfully conducted for determining the nanofluid flow performance and influence of inlet header geometry on the heat sink. The investigations were performed to examine the resultant fluid flow rate, variations of local Nusselt number and Reynolds number, pressure drop and friction factor of the nanofluid in the wavy micro- channel. The experimental evaluations from the com- putational fluid analysis are summarized below;
The highest local Nusselt number of 9 was observed for conical frustum inlet header, followed by semi-circular, rectangular and triangular inlet headers ex- hibiting local Nusselt numbers of the order 8.5, 7.2 and 7 respectively. It was observed that with increasing heat flux amplitude, the local maxima of Nusselt increased with corresponding decrease of local minima.
The nanoparticles concentration of 0.25 volume percentage exhibited high friction factor for total range of Reynolds number factor in the present work. This was attributed to decrease of average flow speed in the fluid base when nanoparticles are increased in 0.25 volume percentage.
The highest Nusselt number exhibited was in the range of 4.5-7 and 5-8 for lower and higher mass flow rates respectively in case of conical frustum inlet header. The semi-circular header exhibited similar performance with triangular and rectangular headers exhibiting Nusselt number in the ranges of 2.8-5.2 and 4-6.2 respectively. The highest heat transfer rate for the coolant fluids was exhibited by Al2O3 followed by SiO2 and distilled water.
The developed computational model was utilized to determine the drop in pressure in the wavy micro channel and frictional characteristics of the nanofluids with potential for more future investigations.
ABS: Acrylonitrile butadiene styrene
CFD: Computational fluid dynamics
D: Depth of the microchannel, mm
L: Length of the microchannel, mm
W: Width of the microchannel, mm
H: Height of the microchannel, mm
m: Mass flow rate, kg/min
Re: Reynolds number
Le: Hydrodynamic entry length
Dh: Hydraulic diameter, mm
ᴓ: Non-uniformity factor
ρ: Fluid Density, kg/m3
m: Dynamic viscosity of the fluid, kgm/s2
∆p: Pressure drop, Pa
- 1. O.S. Osman, R.M. El-Zoheiry, M. ElSharnoby, and S.A. Nada, Alexa. Eng. J. 60(5) (2021) 4451-4459.
-

- 2. G. Takacs, G. Bognár, E. Bándy, G. Rózsás, and P.G. Szab, Microelec. Reliab. 79 (2017) 480-487.
-
- 3. S. Kumar and P.K. Singh, Inter. J. Ther. Sci. 138 (2019) 504-511.
-
- 4. Y. Alihosseini, M.Z. Targhi, M.M. Heyhat, and N. Ghorbani, Appl. Therm. Eng. 170 (2020) 114974.
-
- 5. P. Maheshwary, C. Handa, and K. Nemade, Appl. Therm. Eng. 119 (2017) 79-88.
-
- 6. K.A. Hamid, W.H. Azmi, M.F. Nabil, R. Mamat, and K.V. Sharma, Inter. J. Hea. Mas. Trans. 116 (2018) 1143-1152.
-
- 7. M. Sarafraz, V. Nikkhah, M. Nakhjavani, and A. Arya, Exp. Ther. and Flu. Sci. 91 (2018) 509-519.
-
- 8. A. Abdollahi, H. Mohammed, S. Vanaki, A. Osia, and M.G. Haghighi, Alexa. Eng. J. 56[1] (2017) 161-170.
-
- 9. X. Shi, S. Li, Y. Wei, and J. Gao, Inter. Com. Hea. Mas Trans. 90 (2018) 111-120.
-
- 10. B. Kanargi, J.M. SherminTan, P. SengLee, and C. Yap, Appl. Therm. Eng. 174 (2020) 115250.
-
- 11. S. Kumar, A. Kumar, A.D. Kothiyal, and M.S. Bisht, Therm. Sci. Eng. Prog. 8 (2018) 477-493.
-
- 12. H. Cho, S. Yoon, J.H. Lee, H. Cho, J.-K. Kim, and S.C. Yi, J. Ceram. Process. Res. 22[1] (2021) 106-113.
-
- 13. A.M. Aneesh, A. Sharma, A. Srivastava, and O.P. Chaudhury, Inter. J. Hea. Mas Trans. 118 (2018) 304-315.
-
- 14. S.G. Pakdehi, M. Salimi, M. Rasoolzadeh, and M. Abbasi, J. Ceram. Process. Res. 16[5] (2015) 505-510.
- 15. B.I. Lee, L. Qi, and T. Copeland, J. Ceram. Process. Res. 6[1] (2005) 31-40.
- 16. B.I. Lee and S. W. Lu, J. Ceram. Process. Res. 1[1] (2000) 20-26.
- 17. S.-H. Ahna and K.-W. Namb, J. Ceram. Process. Res. 18[11] (2017) 767-776.
- 18. Y.J. Lee, N. Koshizaki, and Y.D. Kima, J. Ceram. Process. Res. 9[2] (2008) 158-161.
- 19. M. Saeed. A.S. Berrouk, M.S. AlShehhi, and Y.F. AlWahedi, J. Sup. Flu. 176 (2021) 105306.
-
- 20. S.-H. Ahna and K.-W. Namb, J. Ceram. Process. Res. 18[9] (2017) 646-658.
- 21. K. Ren, W. Yuan, Z. Miao, and B. Yang, Appl. Therm. Eng. 176 (2020) 115061.
-
- 22. H. Shen, G. Xie, and C.-C. Wang, Appl. Therm. Eng. 163 (2019) 114332.
-
- 23. L. Gong, J. Zhao, and S. Huang, Appl. Therm. Eng. 88 (2015) 480-490.
-
 This Article
-
2021; 22(6): 679-691
Published on Dec 31, 2021
- 10.36410/jcpr.2021.22.6.679
- Received on Jun 29, 2021
- Revised on Sep 10, 2021
- Accepted on Sep 25, 2021
Services
- Abstract
introduction
materials and methods
results and discussion
conclusion
- Nomenclature
- References
- Full Text PDF
Shared
Correspondence to
- M. Satheeshkumar
-
Research Scholar, Department of Mechanical Engineering, K.L.N College of Engineering, Pottapalayam, India - 630 612
Tel : +919791328001 Fax: +914522090070 - E-mail: satheeshmech@gmail.com
Clean-Energy Research Institute(CRI), Hanyang University, 222, Wangsimni-ro, Seongdong-gu, Seoul, 04763, Korea
E-mail: jcpr@hanyang.ac.kr