


- Enhanced photoluminescence from KCl flux assisted Eu3+ doped CaTiO3 red phosphor for temperature sensing
Xiuying Tiana,*, Lei Lia, Mengyuan Weia, Changyan Jia, Zhi Huangb, Xin Liua, Jin Wena, and Yangxi Penga
aHunan Provincial Key Laboratory of Fine Ceramics and Powder Materials, School of Materials and Environmental Engineering, Hunan University of Humanities, Science and Technology, Loudi,417000, China
bNational Electronic Ceramic Product Quality Supervision and Inspection Center, Loudi, Hunan, 417000, ChinaThis article is an open access article distributed under the terms of the Creative Commons Attribution Non-Commercial License (http://creativecommons.org/licenses/by-nc/4.0) which permits unrestricted non-commercial use, distribution, and reproduction in any medium, provided the original work is properly cited.
CaTiO3: Eu3+ red phosphors with high thermal stability and temperature sensitivity were synthesized by KCl flux assisted solid phase reaction method and they had orthorhombic perovskite phase. CaTiO3:15%Eu3+ had the irregular particle structure, with mean particle size of about 1.58 μm, while CaTiO3:15%Eu3+ +6%KCl also had the irregular particle structure, with mean particle size of about 2.25 μm. When Eu3+ ion concentration was 15mol%, concentration quenching phenomenon took place, which could be explained by electric dipole-dipole interaction due to the critical Eu3+- Eu3+ distance of ~ 8.93 Å. We found that KCl flux could increase the particle size and crystallinity, which was beneficial to luminescence property. Based on the PL spectra excited at 398 nm, the color coordinates of CaTiO3:15%Eu3+ were (0.5911, 0.4008) and the color purity was 97.7%, while the color coordinates of sample CaTiO3:15%Eu3++ 6%KCl were (0.6042, 0.3895) and the color purity was 98.4%. The relative intensity IR1 and IR2 at 423 K is 87. 29% and 83. 22%, indicating the sample had high thermal stability. Based on TCLs FIR, Sr of CaTiO3:15%Eu3+ is 2322.67/T2. CaTiO3:Eu3+ red phosphor was expected to be a promising inorganic material for possible applications in temperature sensing
Keywords: Flux, optical thermometry, solid state reaction, calcium titanate, europium
Recently, rare earth doped luminescent materials have attracted much attention because of their wide application in various fields of phosphor-converted white light-emitting diodes (pc-WLEDs) [1, 2], photocatalysis [3], temperature sensing [4]. Recently, Eu3+ of the numerous rare earth ions is considered as a promising red luminescent activator because of their red 5D0→7F2 emission at about 616 nm [5, 6]. In addition, a selection of host material is also crucial for the luminescence properties of Eu3+ ion, depending on the phonon energy and bandgap value of the host material. As is known to all, CaTiO3 with low phonon energy and excellent physical and chemical properties is one of the most important host materials for luminescent materials [7].
Recently, the red emitting Eu3+ doped CaTiO3 phosphors prepared by polymerizing precursors [8, 9], microwave-assisted hydrothermal method [10], solvothermal method [11], sol-gel method [12, 13], solid-phase method [14-17]. Among many synthesis methods, although the solid-phase method is often accompanied by a small amount of impurities, its luminous efficiency and intensity are higher than other methods, and it is considered to be the best method for synthesizing phosphors [18]. In order to increase the luminescence intensity, charge compensation is usually carried out by adding ions, such as Li+ [16], Zn2+ [17], Mg2+ [14, 19], Sr2+ [20], Al3+ [13], Bi3+ [19], Sn4+ [20] and Nb5+ [21]. In addition, flux assisted solid-phase method, such as H3BO3 flux [21-23], NaF flux [24, 25] can not only improve the ion migration rate of reactants, but also improve the crystallinity of products [21, 22], thus enhancing the intensity of photoluminescence. However, the effect of KCl flux on the PL intensity of CaTiO3:Eu3+ red phosphors hasn't been reported yet.
In recent years, a great deal of research has focused on luminescent materials for optical thermometry [24, 26-32]. It is suitable for thermometry in corrosive en- vironments, strong electromagnetic field environment or other dangerous and harsh environments [35]. Phosphor thermometry are usually used in gas centrifuges, gas turbine, jet turbines, and rocket engines [28]. In particular, the fluorescence intensity ratio (FIR) technology, which is not affected by fluorescence loss and excitation light fluctuation and can achieve non-contact and accurate thermometry, has attracted much attention of researchers [23, 24]. At present, the research on the optical therm- ometer phosphors based on FIR technology mostly uses two thermally coupled energy levels (TCLs) related to temperature. However, relative sensitivity, as an important parameter of thermometry, is limited by the effective energy interval between TCLs. In order to prevent the population of the upper thermal coupling level from being too low, the energy interval is usually lower than 2,000 cm-1. In other words, the highest relative sensitivity value is lower than 2878/T2 [24]. For instance, Zhou et al. [34] has reported the temperature sensing of an upconversion (UC) NaYF4:Yb3+/Er3+ nanothermometer based on the TCLs of 2H11/2 and 4S3/2. However, FIR involved in the UC process is often affected by the thermal effect of the 980 nm excitation light, which will affect the measurement accuracy, not to mention the low luminous efficiency of the UC process. Therefore, a highly efficient FIR method free of UC process should be pursued, for which emissions from Eu3+ offer a possibility [34]. In 2017, Nanda et al. [27] reported that, based on the 5D1→7F2 /5D0→7F2 FIR value of Eu3+, the relative sensitivity of Eu3+ doped ZnO was as high as 3013/T2, higher than the theoretical relative sensitivity of 2878/T2. High relative sensitivity depends on the types, concentrations of doped ions, and host material. In general, for Eu3+ ions, the difference between the TCLs 5D1 and 5D0 is about 1,700 cm-1 [35]. At a certain temperature, they can achieve thermal equilibrium. For the YBO3:Eu3+ reported by Zhao et. al., the temperature required for the thermal coupling is above 450 K [35]. Otherwise, the electron could not cross the energy interval without enough energy, and so the upper thermally coupled level will not be filled. Therefore, CaTiO3:Eu3+ phosphors for optical therm- ometry are interesting by the FIR values of TCLs 5D1 and 5D0. At present, the commercial optical thermometry is carried out by using optical pyrometer and radiation thermometer. When the measured signal is converted to the real temperature, the emissivity of the measured object needs to be corrected. However, the emissivity of a substance is related to its properties, surface roughness, pollution and oxidation of surface, and temperature. Therefore, the emissivity of many non-blackbody materials is not accurately known, so the accuracy of thermometry is bound to be limited. If the infrared radiometer is used to measure the temperature, it is also affected by the infrared transmittance of the medium, Therefore, optical thermometry will encounter a lot of troubles. It is an effective method to use temperature sensitive phosphor for optical thermometry in some specific environment and certain temperature range, which is not affected by fluorescence loss and excitation light fluctuation and can achieve non-contact and accurate thermometry and can make up for the above shortcomings.
In this paper, Eu3+ doped CaTiO3 phosphors were prepared by KCl flux assisted solid state method. The Eu3+ ion concentration was optimized and the type of non-radiative energy transfer was determined. The influence of KCl flux doping amount on luminescence intensity of Eu3+ doped CaTiO3 phosphors was also discussed. For Eu3+ doped CaTiO3 phosphors, the energy gap of TCLs 5D1 and 5D0 is about 1,800 ± 22 cm-1. The FIR value is calculated by measuring the emitting intensity of 5D1 and 5D0 for the temperature sensing.
Preparation of samples
CaTiO3:xEu3+ phosphors (Eu3+/CaTiO3 molar ratio x is 1%, 5%, 10%, 15%, 20%, 25% and 30%) and CaTiO3:15%Eu3++yKCl with different amounts of KCl (molar ratio y of KCl/CaTiO3 is 0.5%, 1.0%, 1.5%, 2.0%, 3.0%, 4%, 5% and 6%) was prepared by traditional solid state reaction method. Reagent grade CaCO3 and TiO2 were used as raw materials, high purity Eu2O3 (99.99%) was used as activator, reagent grade KCl was used as flux and anhydrous ethanol was used as grinding agent and the mixture was ground for 45 min. It was then dried for 1 h. And then, it was transferred to the resistance furnace. It rose initially to 800 oC after 100 min, then rose to 1,300 oC in the air after 125 min and kept it for 2 h.
Characterization
PANalytical X 'pert PRO X-ray diffractometer was used for the X-ray diffraction (XRD) pattern. The surface morphologies were obtained by COXEM EM-30 PLUS scanning electron microscope (SEM), and the element distribution was analyzed by energy dispersive spectrometer (EDS, Oxford). The UV-visible diffuse reflectance (UV-vis DR) spectra were from Shimazu UV-2700 UV-vis spectrophotometer with an integral sphere. The photoluminescence (PL) and photolumine- scence excitation (PLE) spectra were from Hitachi F-7000 fluorescence spectrophotometer. Quantum efficiency was measured by a FLS1000 photoluminescence spec- trometer (Edinburgh Instruments Ltd.) with an integral sphere at room temperature. The standard TAP-02 fitting was used for controlling temperature (Orient KOJI instrument Co., Ltd) in order to obtain temperature-dependent photoluminescence spectra.
XRD analysis
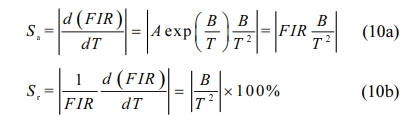
Fig. 1(a) shows the XRD pattern of CaTiO3:xEu3+ (x = 1%, 5%, 10%, 15%, 20%, 25% and 30%). It was observed that the typical peak of samples were basically consistent with stand card JCPDS#22-0153, attributed to orthorhombic perovskite structure and space group Pnma(62). However, when the Eu3+ concentration is not less than 10%, a small amount of impurity phase Eu2Ti2O7 (JCPDS#23-1072) appeared in the samples. In general, to form a novel solid solution, the radius percentage difference (Dr) of the substituted ion and the doped ion is lower than 30%, which can be determined by Eq. (1): [36]
where RS is the radius of substituted ion and RD is the radius of doped ion, respectively. When the coordination number is 6, the radii of Ca2+, Ti4+ and Eu3+ is 1. 00, 0. 605 and 0. 947 Å, respectively [37]. Herein, Dr value of Ca2+/Eu3+ was calculated to be about 5.3%. It indicates that Eu3+ ions are easier to replace Ca2+ ions due to the similar radius of Ca2+ and Eu3+ ions, compared with Ti4+ ions.
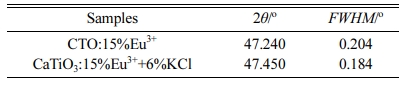
Fig. 1(b) shows the XRD patterns of sample CaTiO3: 15%Eu3++6%KCl. It could be seen that it had a small amount of impurity phase Eu2Ti2O7. In Table 1, we could see that the full width at half maximum (FWHM = 0.184o) of CaTiO3:15%Eu3++6%KCl was less than that of CaTiO3:15%Eu3+ (FWHM = 0.204o) for the typical peak (040), indicating that the addition of KCl flux can improve their crystallinity.
EDS and SEM analysis
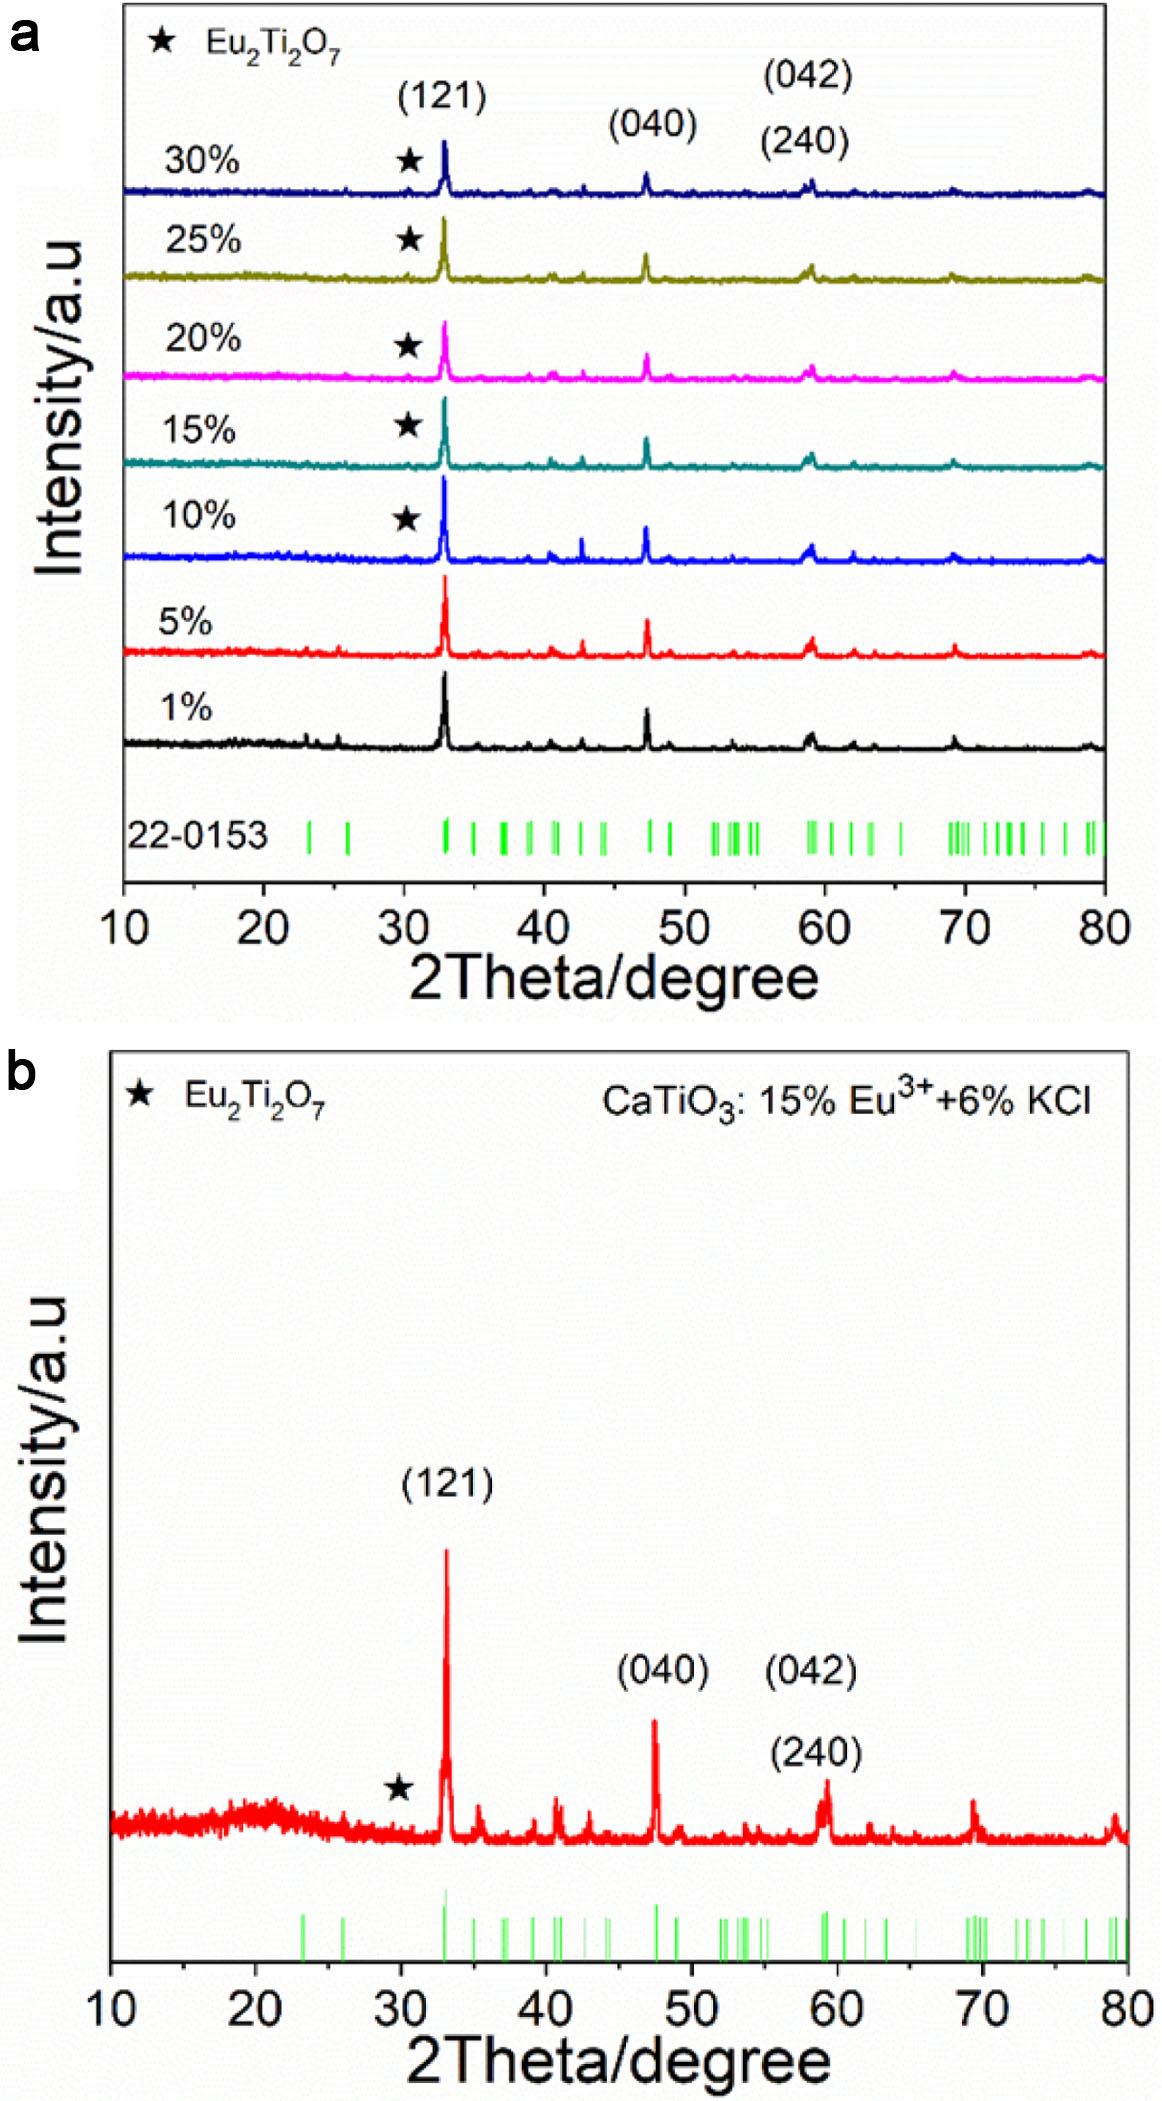
Fig. 2(a) and (b) show particle size distribution and SEM image of CaTiO3:15%Eu3+, indicating that the sample has an irregular particle structure with mean particle size of about 1.58 μm. Fig. 2(c) and (d) show particle size distribution and SEM image of CaTiO3: 15%Eu3++6%KCl, indicating that the sample also has a similar irregular particle structure with mean particle size of about 2.25 μm. EDS energy spectra and element mappings of CaTiO3:15%Eu3+ and CaTiO3:15%Eu3++ 6%KCl are also shown in Fig. 2(e, f, g) and (h). It was indicated that the samples not only contained elements of Ca, Ti, O, and Eu, but also contained Au and Mg, which were derived from the gold injection layer, which may be associated with the substrate material. Moreover, the Eu3+ ions were dispersed more evenly into the host material. However, for CaTiO3:15%Eu3++ 6%KCl, no K or Cl elements was found, which could be caused by the low sensitivity of the instrument and element content of KCl flux. In addition, it is found that the flux KCl can enhanced the diffusion coefficient and improve the crystallinity of host materials, beneficial to luminescence property.
UV-Vis DR spectra
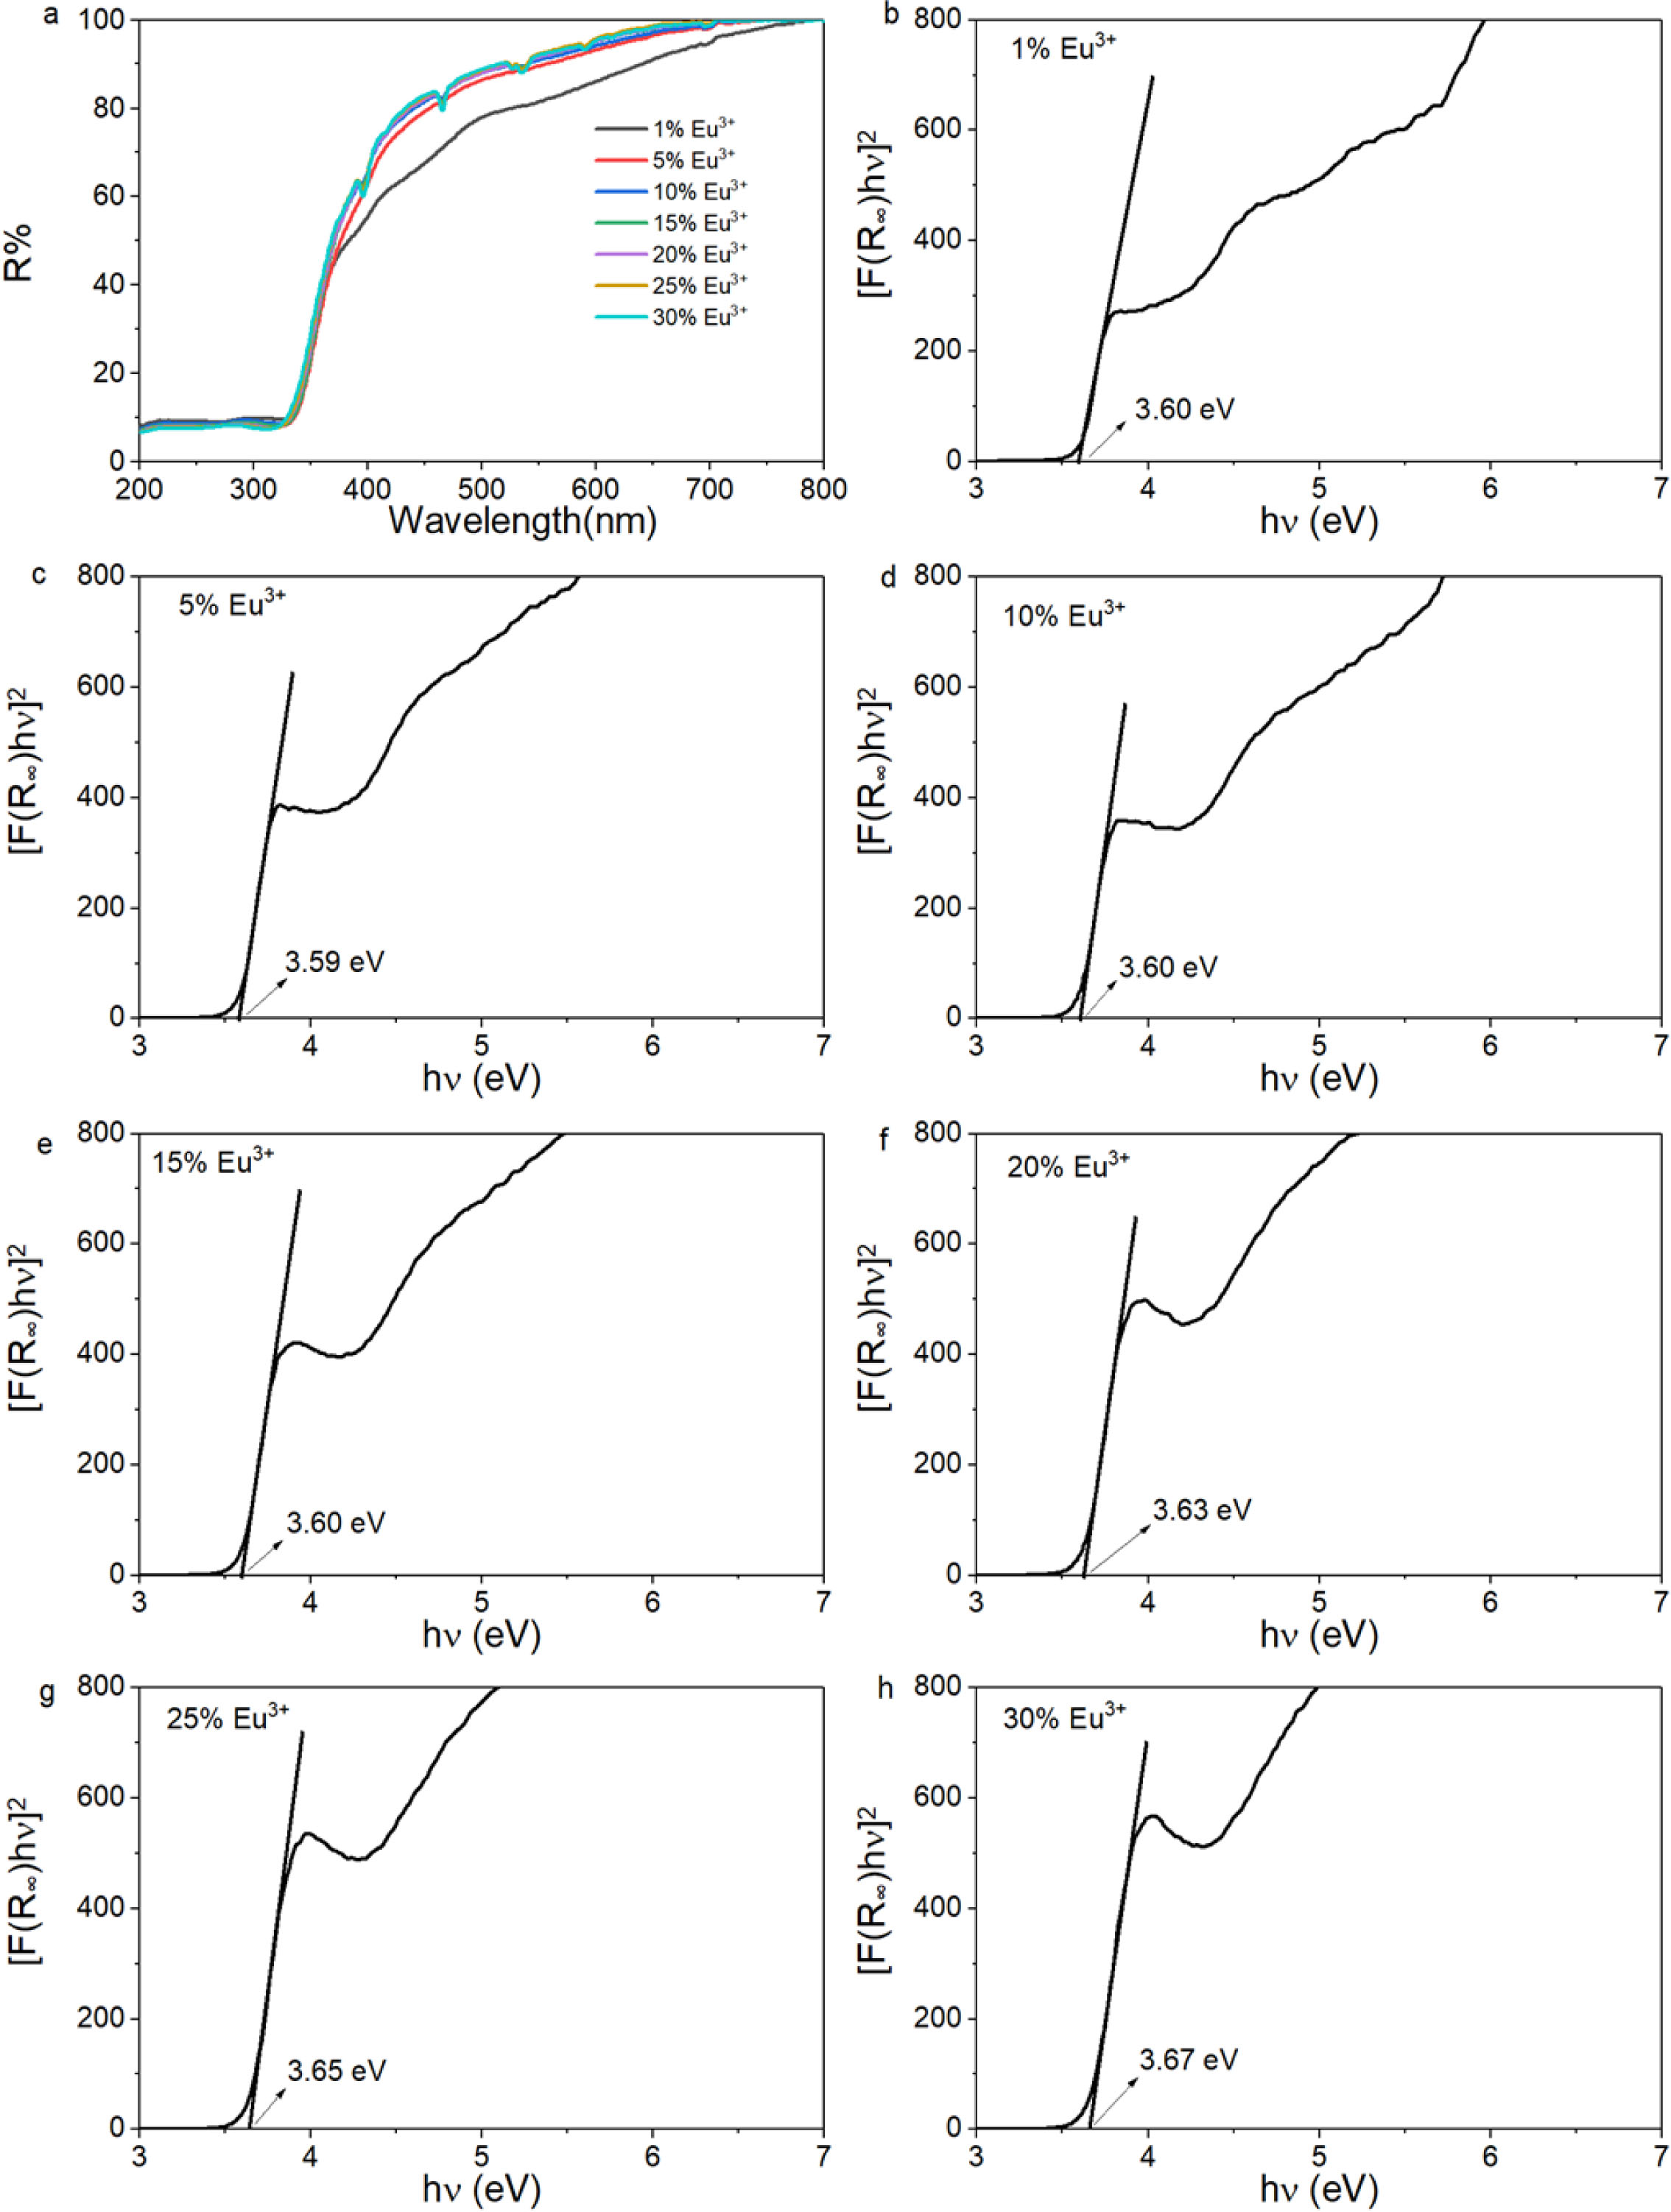
Fig. 3(a) and (b-h) are UV-vis DR spectra and the plots of [F(R¥)hn]2 vs photon energy (hn) of CaTiO3: xEu3+(x=1%, 5%, 10%, 15%, 20%, 25% and 30%). From Fig. 3(a), the band of 200-330nm was from the host absorption band of CaTiO3. The absorption peak at ~396 nm (7F0→5L6), ~466 nm (7F0→5D2), ~526 nm (7F0→5D1), ~536 nm (7F1→5D1), ~592 nm (7F1→5D0), ~614 nm (7F2→5D0) and ~696 nm (7F4→5D0) is from in-layer 4f-4f transitions of Eu3+ ions. In Fig. 3(b-h), the direct optical bandgap values (Eg) are calculated according to Kubelka-Munk (K-M) and Tauc function [38]:
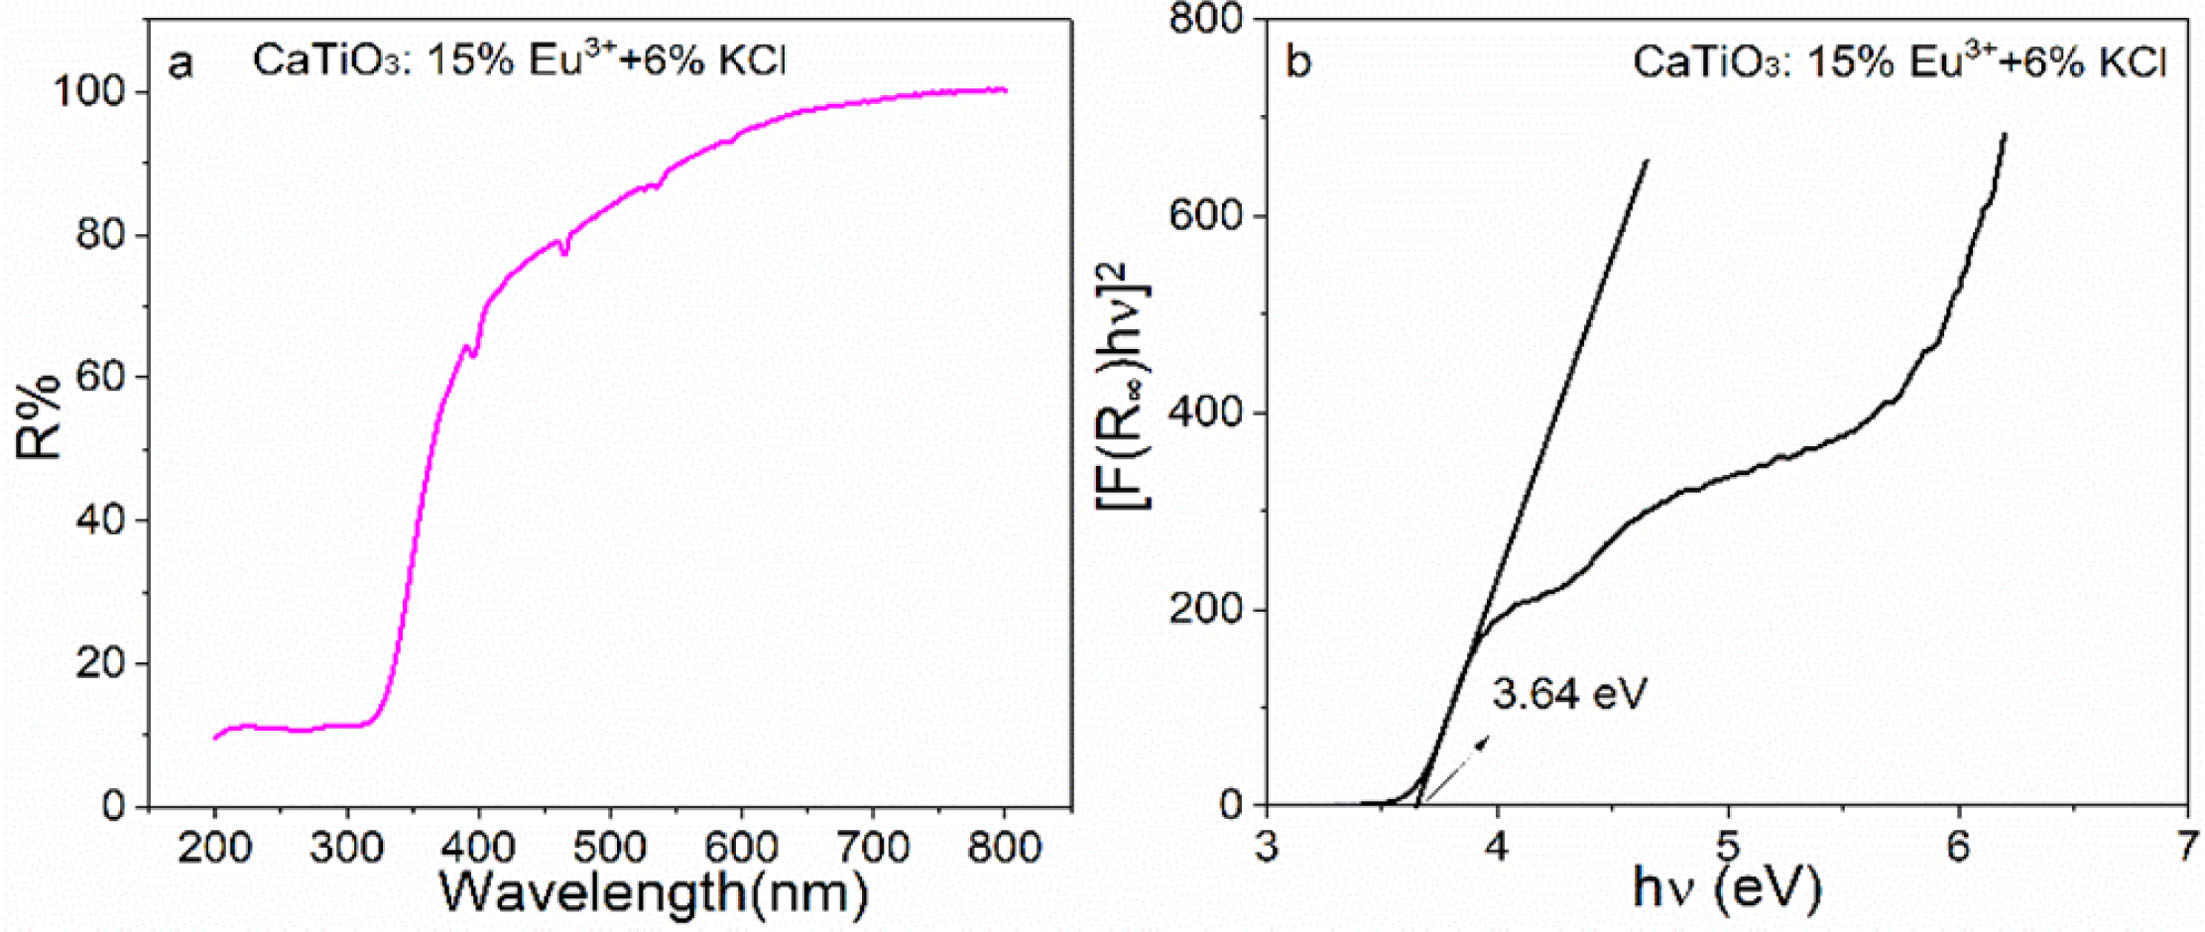
Where R¥ is the reflectivity ratio of the sample to BaSO4, F(R¥) is the K-M function, S is the scattering coefficient, K is the absorption coefficient, hn is the photon energy and Eg is the optical bandgap value. For the samples CaTiO3:xEu3+ (x = 1%, 5%, 10%, 15%, 20%, 25% and 30%), the optical bandgap values are in the range of ~3. 59-3.67 eV. Fig. 4(a) and (b) shows UV-vis DR spectra and the plots of [F(R¥)hn]2 versus hn of the sample CaTiO3:15%Eu3++6%KCl. Similarly, the band of 200-330 nm belongs to the absorption band of CaTiO3 host material. The absorption peak at ~396 nm (7F0→5L6), ~466 nm (7F0→5D2), ~526 nm (7F0→5D1), ~536 nm (7F1→5D1), ~592 nm (7F1→5D0), ~614 nm (7F2→5D0) and ~696 nm (7F4→5D0) is attributed to the Eu3+ in-layer 4f-4f transitions. The sample CaTiO3: 15%Eu3++6%KCl has an optical bandgap value of 3. 64 eV, which is more than that of CaTiO3:15%Eu3+ (3.60 eV), indicating that KCl flux can also promote to substitute Eu3+ ions for Ca2+ ions.
PLE and PL spectra
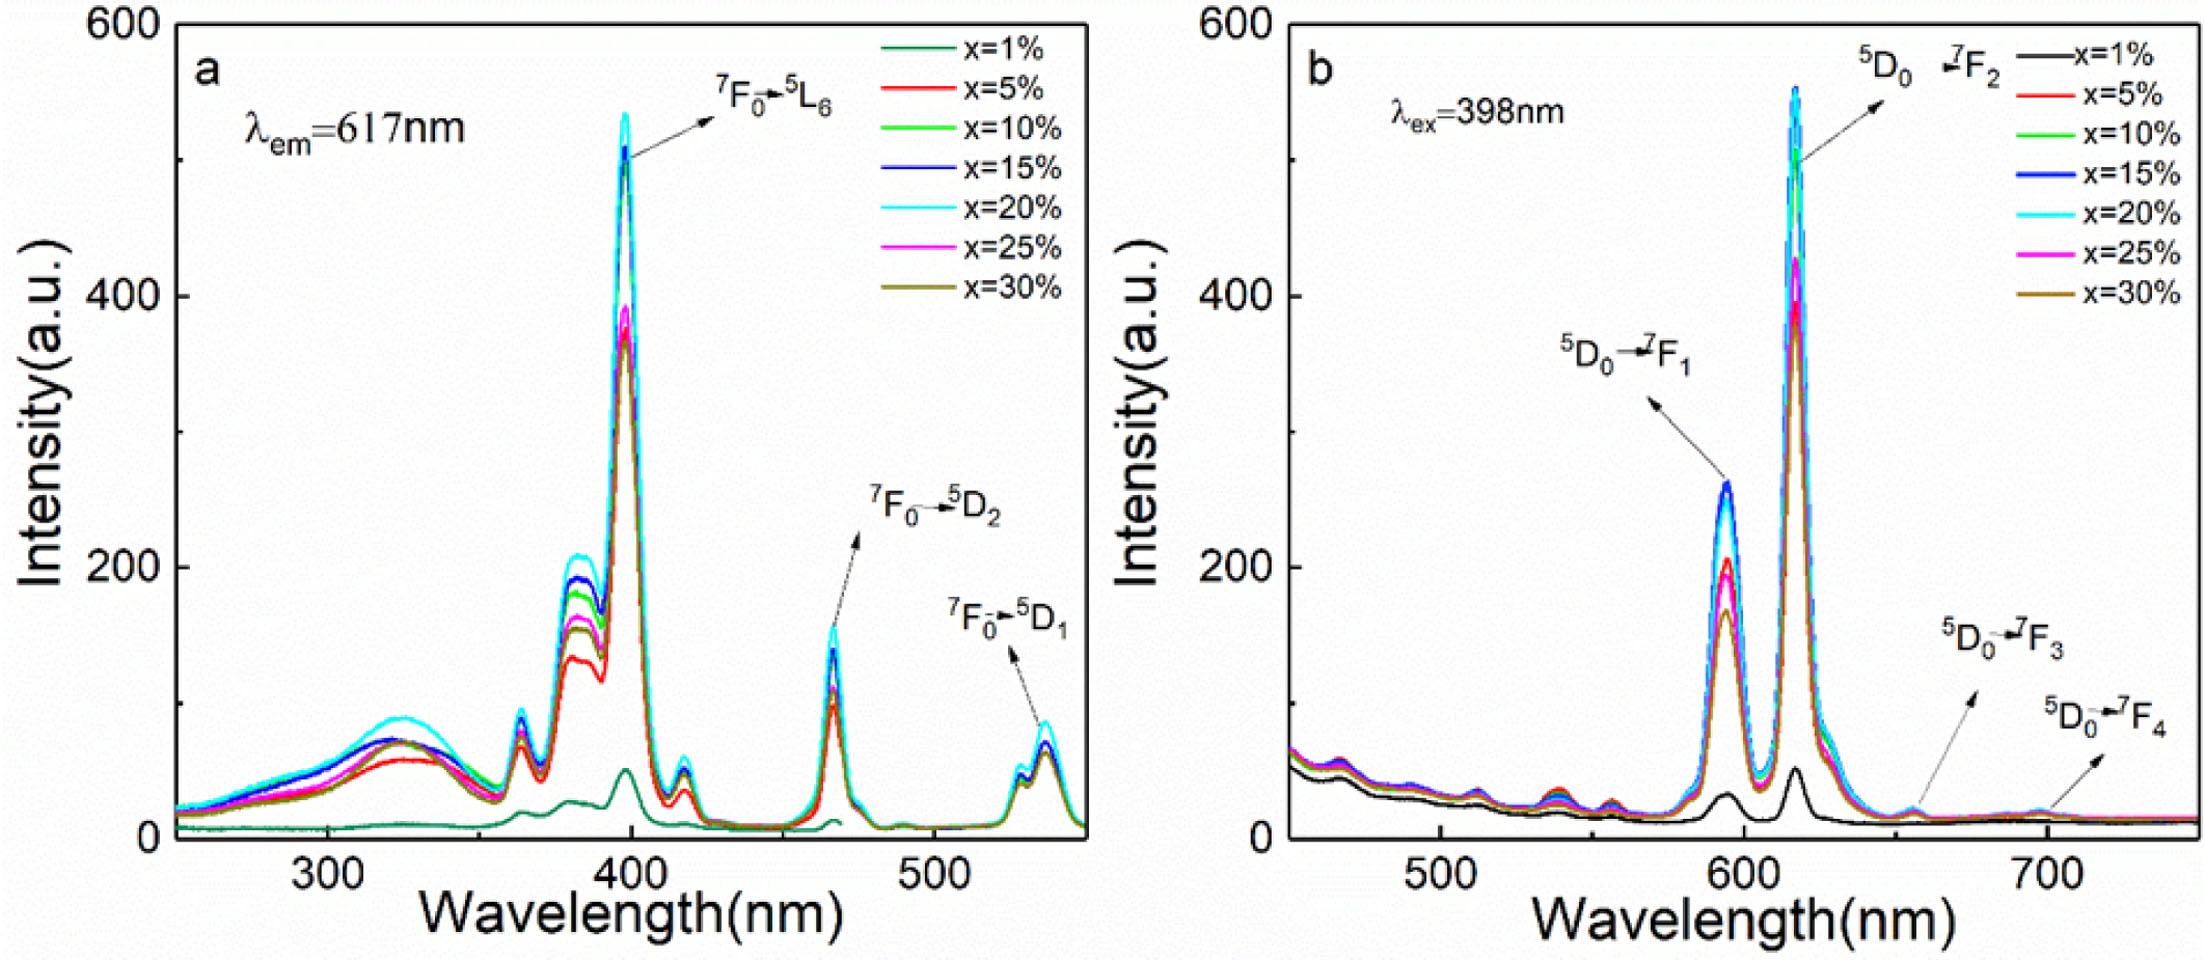
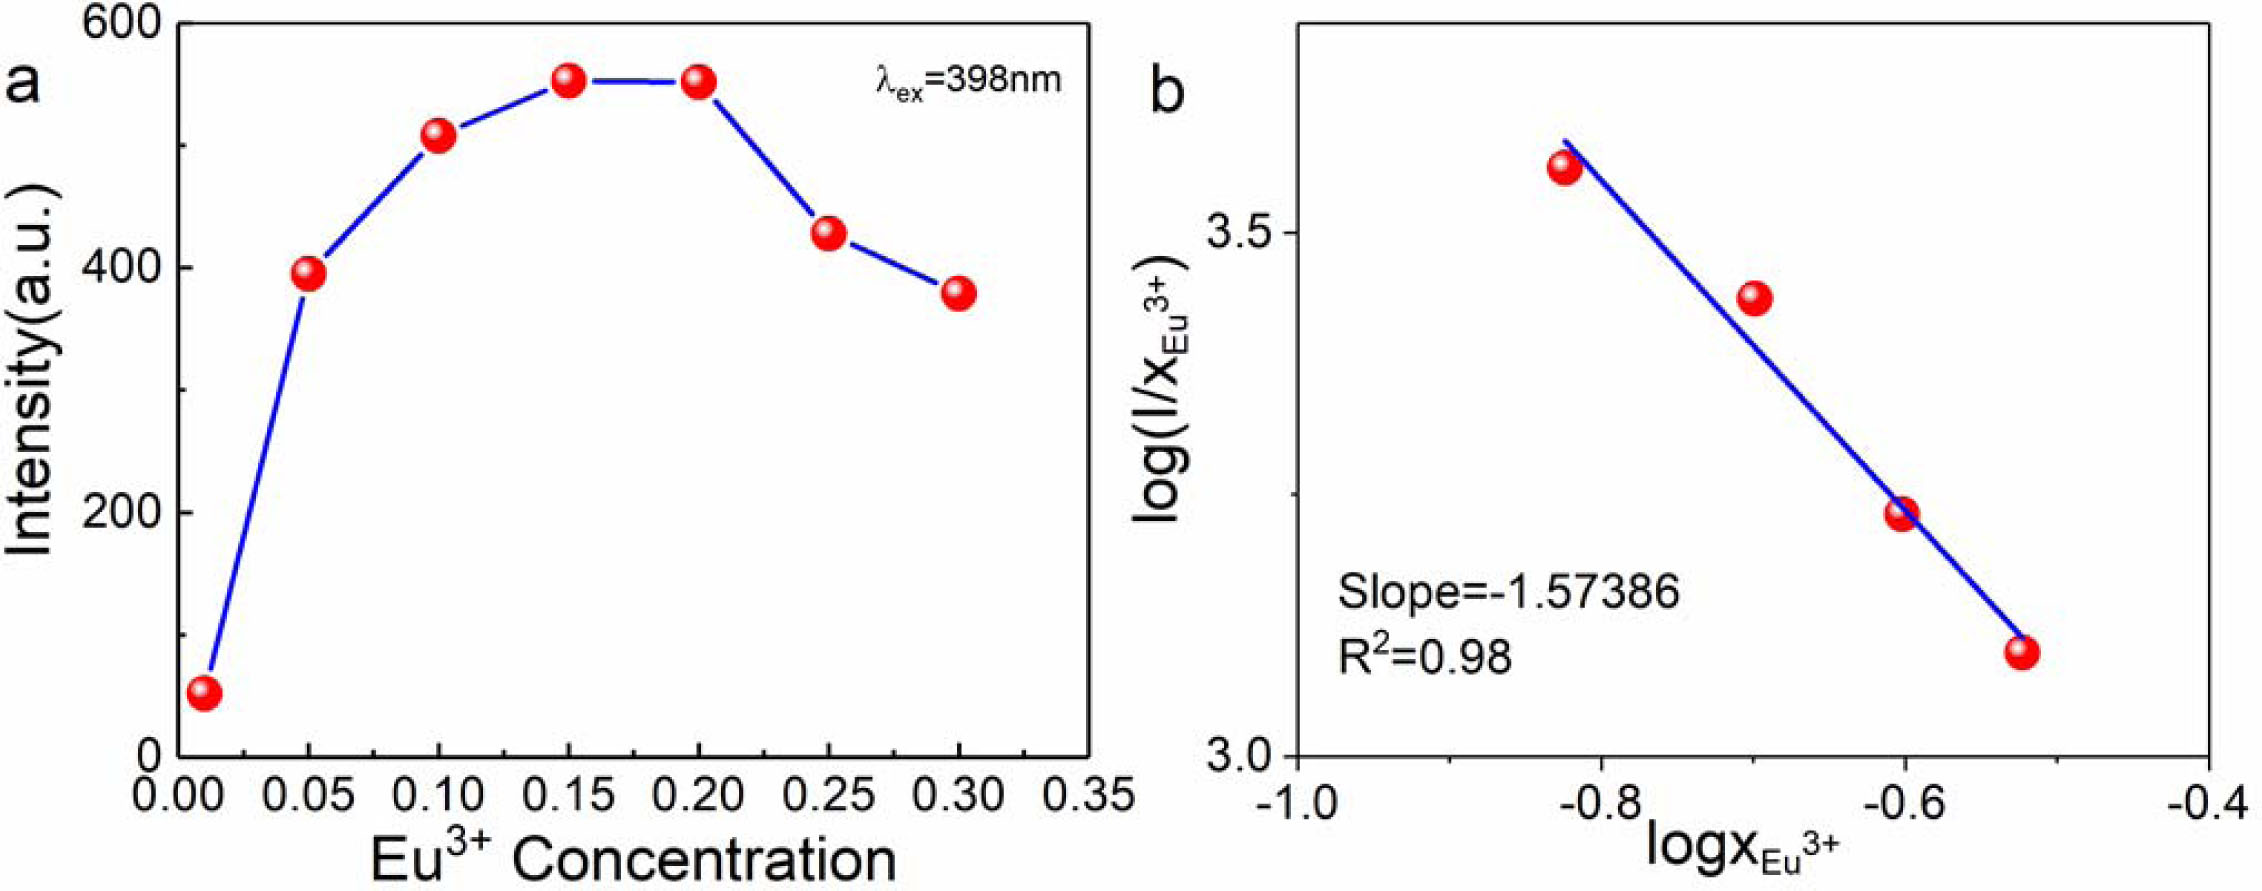
Fig. 5(a) is the PLE spectra of sample CaTiO3:xEu3+ (x = 1%, 5%, 10%, 15%, 20%, 25% and 30%) at the detection wavelength of 617nm. The band of 200-350 nm is from Eu3+−O2− charge transfer state (CTs), corresponding to 2p(O2−)→4f(Eu3+) [39]. The band of 350-560 nm are caused by the Eu3+ 4f-4f transitions [38]. The emitting peak at ~364 nm was from 7F0→5D4. In addition, we also observed that the emitting peak at ~380 nm, ~398 nm, ~418 nm, ~466 nm, ~528 nm and ~536 nm was from 7F0→5L7, 7F0→5L6, 7F0→5D3, 7F0→5D2, 7F0→5D1 and 7F1→5D1, respectively. The strength of emitting peak at ~398 nm from 4f-4f 7F0→5L6 transition is the strongest, which is basically consistent with the above UV-vis results, and matches with the GaN based near UV LED chip, suitable for red phosphors for WLED. Fig. 5(b) is the PL spectra of sample CaTiO3:xEu3+ (x = 1%, 5%, 10%, 15%, 20%, 25% and 30%) with an excitation wavelength of 398 nm. When the samples were excited by 398 nm, the main emitting peak of Eu3+ ions (~539 nm, ~556 nm, ~578 nm, ~594 nm, ~617 nm, ~656 nm and ~698 nm) is from 5D1→7F1, 5D1→7F2, 5D0→7F0, 5D0→7F1, 5D0→7F2, 5D0→7F3 and 5D0→7F4 transition. As known, the 5D0→7F1 magnetic dipole transition at ~594 nm is not limited by the strength of the Eu3+ crystal field, but strongest 5D0→7F2 emitting peak at ~617 nm results from extremely sensitive electric dipole transition, which is controlled by the local electric field. So Eu3+ ions mainly occupy non-inversion symmetric lattice site. Therefore, it is believed that the asymmetric ratio of 5D0→7F2/5D0→7F1 represents distortion degree of inversion symmetry [40]. As can be seen from Fig. 5(b), the Eu3+ concentration is 1%, 5%, 10%, 15%, 20%, 25% and 30%, the ratio of 5D0→7F2/5D0→7F1 is 1.54, 1.89, 2.02, 2.09, 2.20, 2.20 and 2.24, respectively. The large value indicates the asymmetric crystal field environment around Eu3+ ions. From Fig. 6(a), we can also observe that with the increase of Eu3+ ion concentration, the peak strength first increased and then decreased. When Eu3+ ion concentration is 15%, the sample excited at 398 nm has the strongest PL intensity, and then the PL intensity begins to decrease, which is called concentration quenching effect, from the reduction distance of Eu3+-Eu3+ in CaTiO3 host material. Critical distance (Rc) of Eu3+-Eu3+ is obtained from eq. (3) [41]:
Where, V is unit cell volume, Z is the number of formula units per unit cell and xc is critical concentration. As mentioned above, V and Z of pure CaTiO3 is 223.25 Å3 and 4, xc of CaTiO3:Eu3+ is 15%. Therefore, Eu3+-Eu3+ critical distance is ~8. 93 Å.
As known, non-radiative energy transfer can refer to electrical multipole interaction, exchange interaction and radiation reabsorption. It is considered as radiation reabsorption only when the excitation and emission spectra exist a lot of overlap [42] and that's unlikely to happen in our work. Moreover, for exchange interaction, critical distance is usually less than 5 Å, but the above calculated value of ~8.93 Å is greater than 5 Å. Therefore, it can also be excluded for exchange interactions, and in our work, electric multipole interaction can be used for explaining non-radiative energy transfer.
According to the relation of log(I/x) versus log(x) of CaTiO3:xEu3+ (x > 15%) in Fig. 6(b). the specific type from electrical multipole interaction can be obtained by eq. (4) [43, 44]:
Where β is constant, θ is electrical multipole characteristic, I is PL intensity and x > 15%. The q value of 6 is electric dipole-dipole (d-d), 8 is from dipole-quadrupole (d-q), and 10 is from quadrupole-quadrupole (q-q) interactions [43]. For CaTiO3:xEu3+, through linear fitting, its slope is −1.57386 = −θ/3, and θ is 4.72158 and approaches 6. Therefore, it is most appropriate to explain the concentration quenching by the type of electric dipole-dipole interaction.
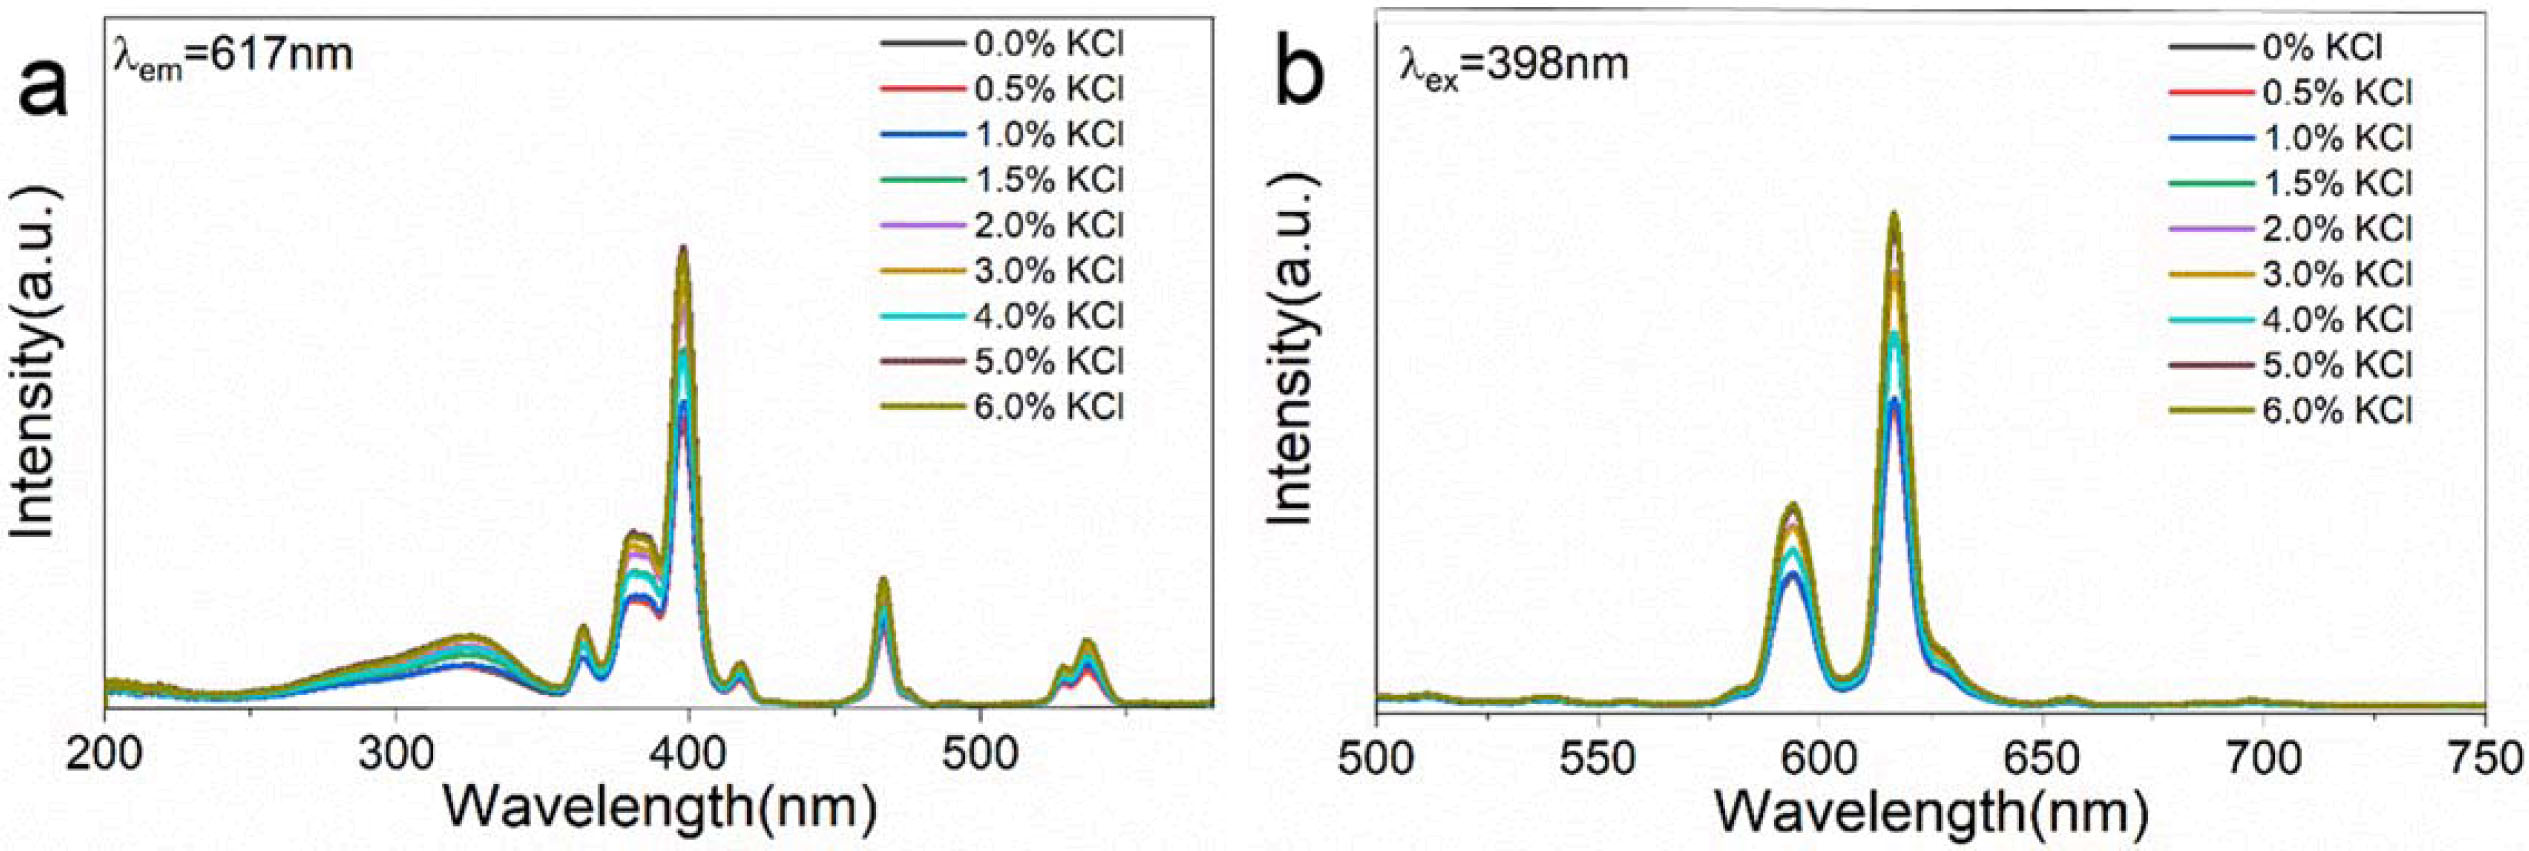
Fig. 7(a) is the PLE spectra of the samples CaTiO3: 15% Eu3++ y KCl (y = 0, 0.5%, 1%, 1.5%, 2%, 3%, 4%, 5% and 6%) at the detection wavelength of 617 nm. As before, the band at 200 ~350 nm is Eu3+−O2− CTs, from 2p(O2−)→4f(Eu3+) [39]. The characteristic peaks of 350-560 nm are from the Eu3+ 4f-4f transition [38]. We can observe that the emitting peak intensity at ~ 398 nm is the strongest, attributed to 7F0→5L6 4f-4f transition. Fig. 7(b) is the PL spectrum of sample CaTiO3:15% Eu3++ y KCl (y = 0, 0.5%, 1%, 1.5%, 2%, 3%, 4%, 5% and 6% excited at 398 nm. The several major emitting peaks (~617 nm, ~594 nm and~ 578 nm) are transitions of 5D0→7F2, 5D0→7F1 and 5D0→7F0, respectively. The emitting peak of ~ 594nm is from magnetic dipole transition of 5D0→7F1 and the peak at ~617 nm from 5D0→7F2 electric dipole transition is more sensitive and depends on local electric field. This peak at ~617 nm is the strongest, indicating that Eu3+ ion is mainly from the non-inversion symmetric lattice. The intensity ratio 5D0→7F2/5D0→7F1 reflects the degree of asymmetry. From Fig. 7(b), the ratio of 5D0→7F2/5D0→7F1 is 2.17, 2.21, 2.33, 2. 37, 2.38, 2.33, 2.38 and 2.41, when the KCl concentration is 0. 5%, 1%, 1. 5%, 2%, 3%, 4%, 5% and 6%, respectively. With the increase of KCl concentration, this value has an overall trend of increasing, indicating that the asymmetry degree has increased. with increasing KCl concentration, the overall intensity trend increases. The emitting peak is strongest when the concentration of KCl is 6%.
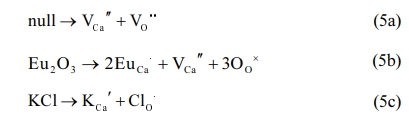
At high temperature, Schottky defects (VCa'' and VO••) concentrations are very higher [45]. The intrinsic Schottky defects are shown as Eq. (5a). As known, Eu3+ ions could replace Ca2+ ions due to the similar ionic radius of Ca2+ and Eu3+ ions as Eq. (5b). However, some undesirable defects such as VCa'' and VO•• are close to Eu3+, which can contribute to the quenching of Eu3+ emission. In our work, KCl could play the role of flux and compensator. On the one hand, the flux KCl could enhance the diffusion coefficient. Moreover, flux could be beneficial to improve the crystallinity, giving rise to higher oscillating strengths and enhancing optical property. On the other hand, K+ ion is usually incorporated into host materials to replace Ca2+ and Cl- ion substitutes for O2- as Eq. (5c). PL emission is enhanced by the charge compensation of K+, resulting in elimination of the concentration of VCa'' near Eu3+. The substitution of O2- by the Cl- ion originates the lower VO•• near Eu3+. Therefore, the reduced point defects near Eu3+ contribute to improvement of PL intensity.
Quantum yield and CIE chromaticity diagram
Quantum yield of the samples with or without KCl flux were calculated according to the method described by the reference [46]. It allows determining the sample quantum yield (h) using the following Eq. (6):
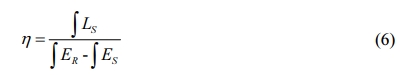
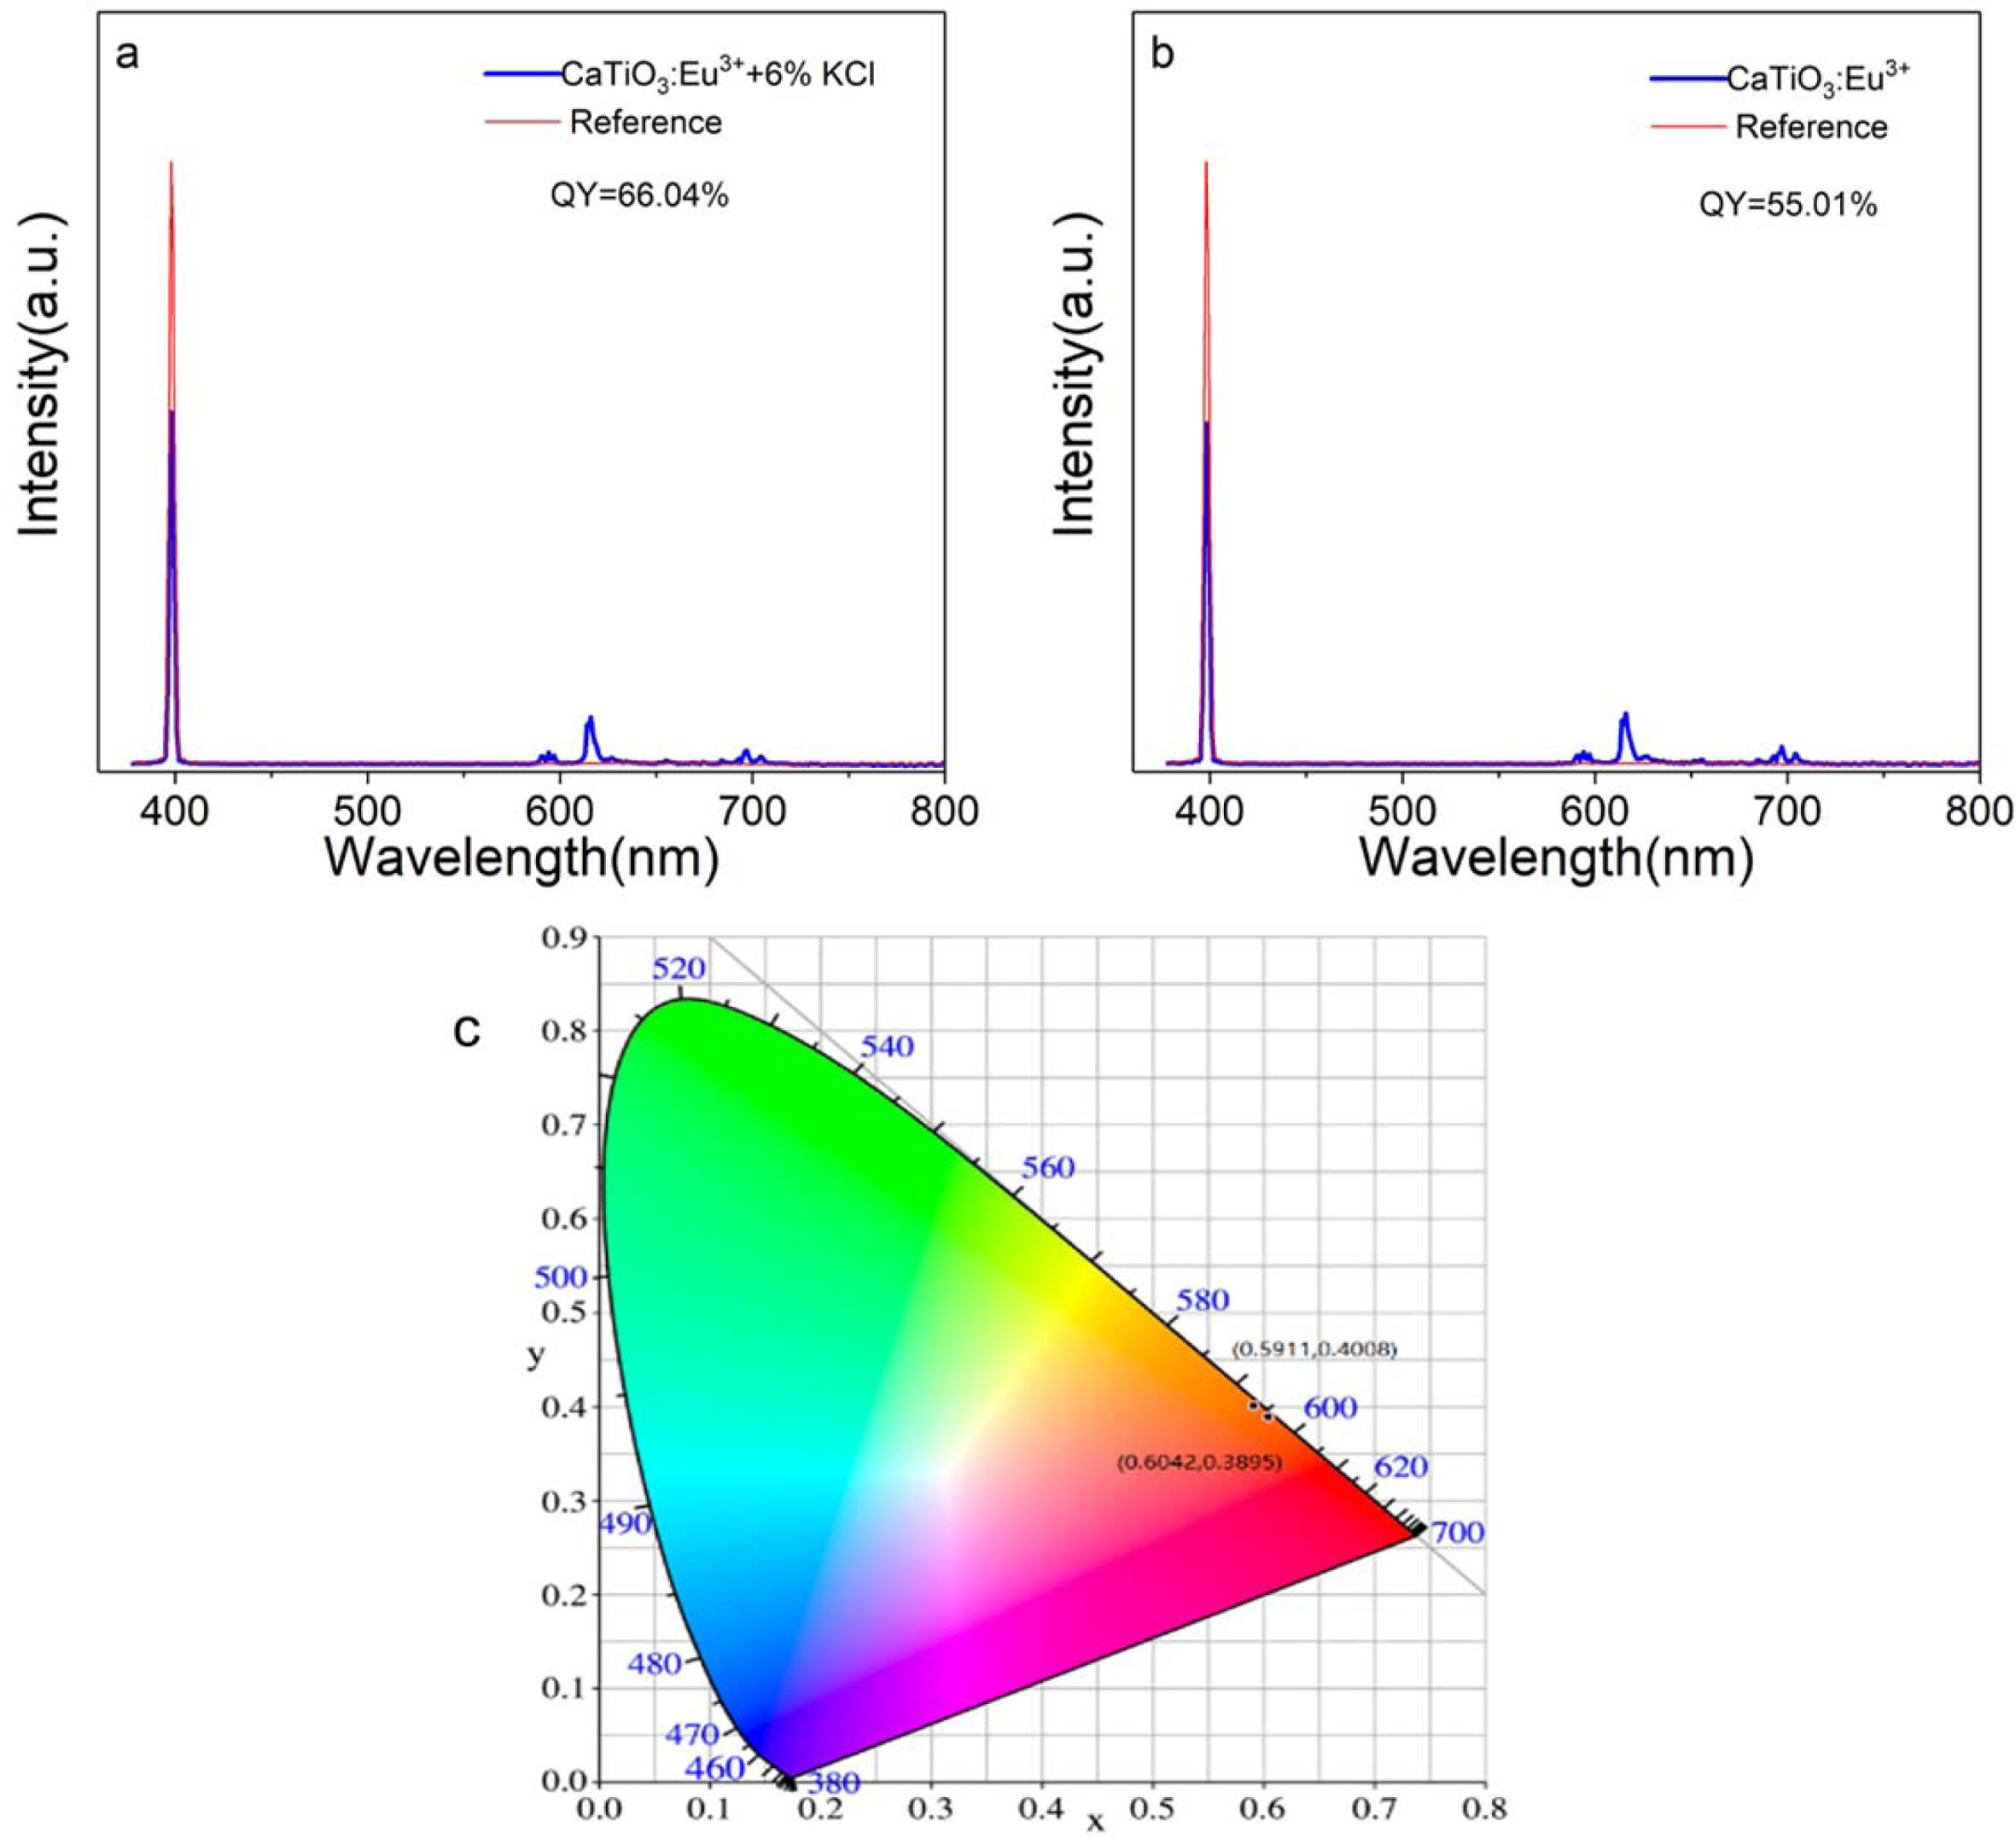
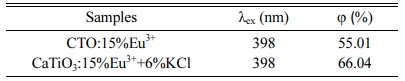
Where LS is the emission spectrum of sample; ES is the spectrum of the light used for exciting the sample; ER is the spectrum of the excitation light without the sample in the sphere; and all the spectra were collected using the sphere. Fig. 8(a) and (b) are excitation and emission spectra of samples CaTiO3:15%Eu3++6%KCl and CaTiO3:15%Eu3+ collected by using an integrating sphere. The quantum yield of CaTiO3:15%Eu3+ and CaTiO3:15%Eu3++6%KCl excited by 398 nm are listed in Table 2. Compared with the two samples, the sample CaTiO3:15%Eu3++6%KCl exhibits quantum yield of 66.04%, while that of the CaTiO3:15%Eu3+ is 55.01% under the same excitation wavelength of 398 nm. It is indicated that the quantum yield of the sample with flux is higher than that of the sample without flux.
Fig. 8(c) shows Commission Internationale De I'eclairage (CIE) chromaticity diagram of samples CaTiO3:15%Eu3+ and CaTiO3:15%Eu3++6%KCl excited at 398 nm. The color coordinate (x, y) of sample CaTiO3:15%Eu3+ is (0.5911, 0.4008) and the color coordinate (x, y) of sample CaTiO3:15%Eu3++6%KCl is (0.6042, 0.3895). As far as we know, the intensity and position of the main emitting peak affect the position of the coloring coordinate. The KCl flux facilitate the improvement of crystallinity of the phosphor CaTiO3: 15%Eu3++6%KCl, which leads to the enhancement of luminous intensity. It's what causes the color coordinates to move. The color purity of the samples can be calculated by the following formula (7):
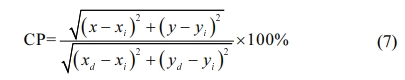
Where (x, y) is the color coordinate of the typical sample, (xi, yi) is the CIE coordinate of white illumination, and (xd, yd) is the CIE coordinate of the dominant wavelength. The color purity of sample CaTiO3: 15%Eu3+ is up to 97.7%, and the color purity of sample CaTiO3:15%Eu3++6%KCl is up to 98. 4%.
Temperature sensing
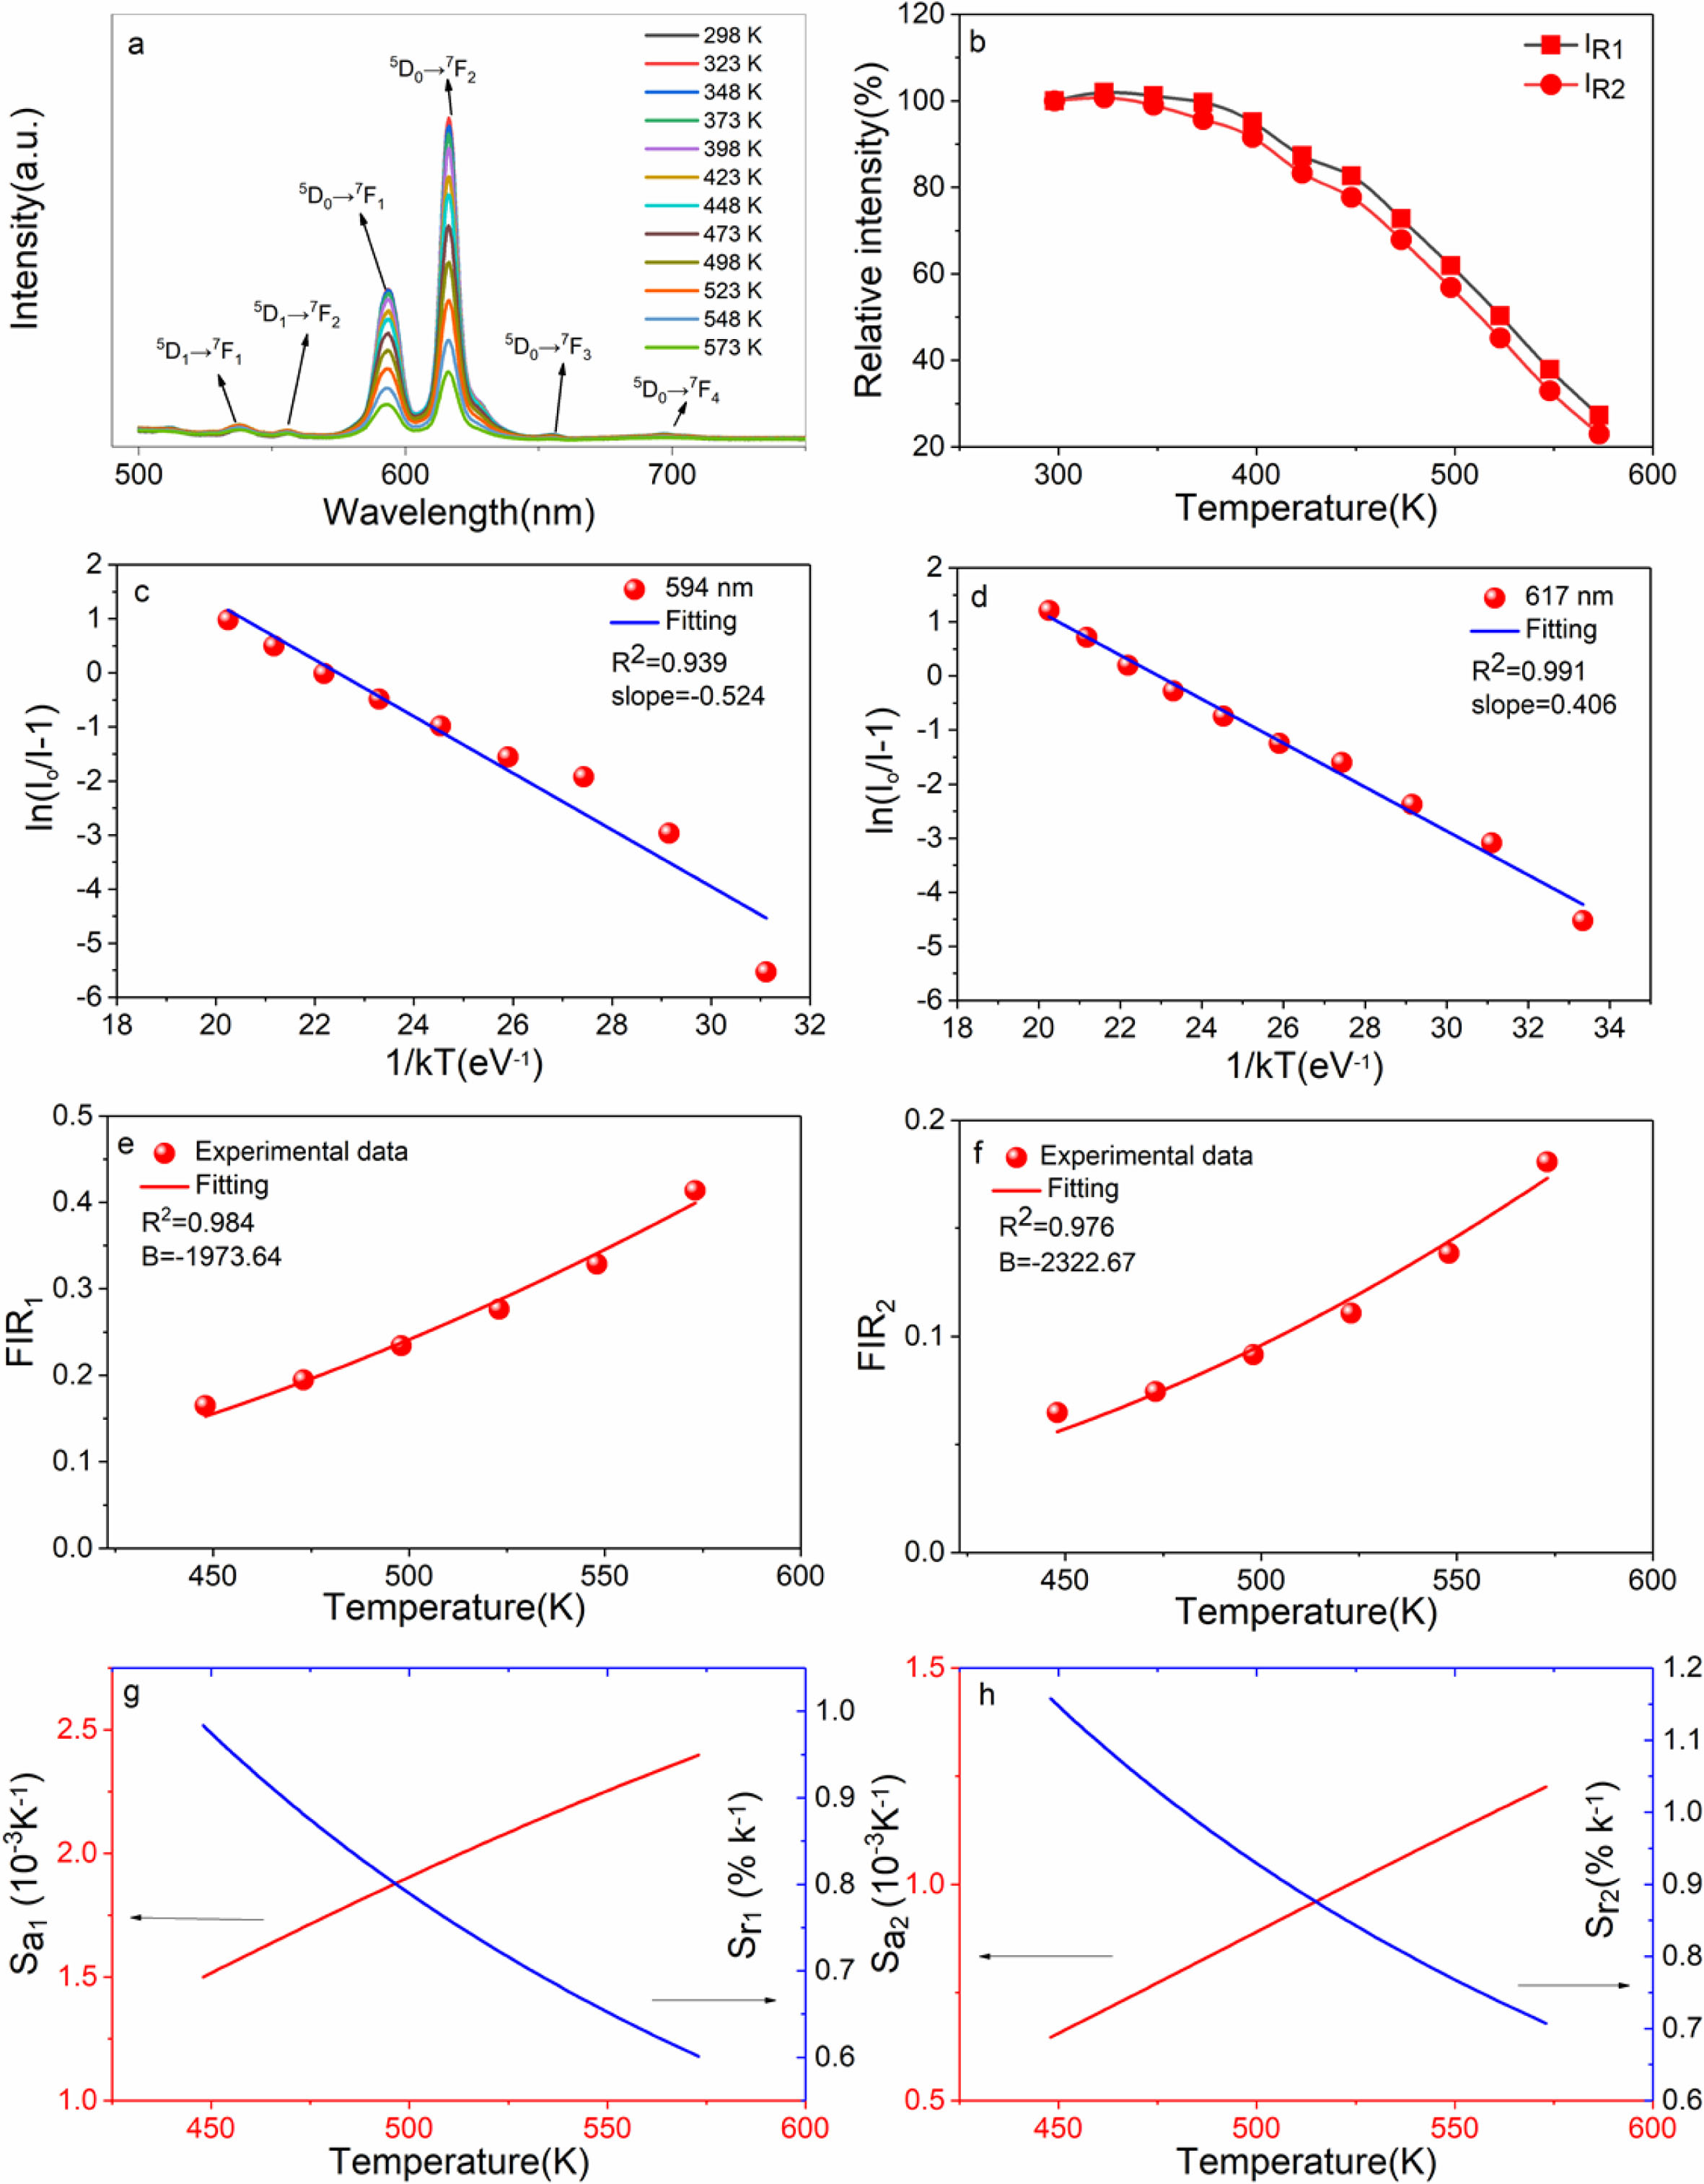
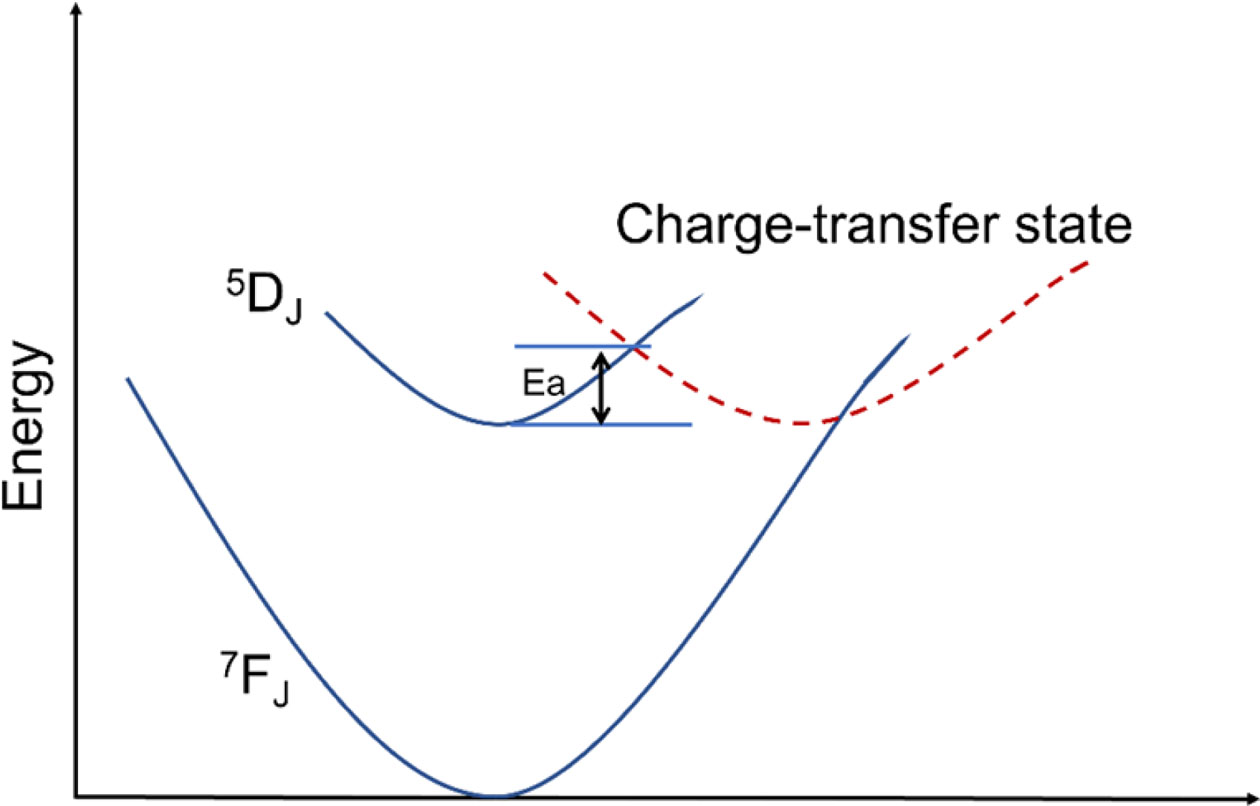
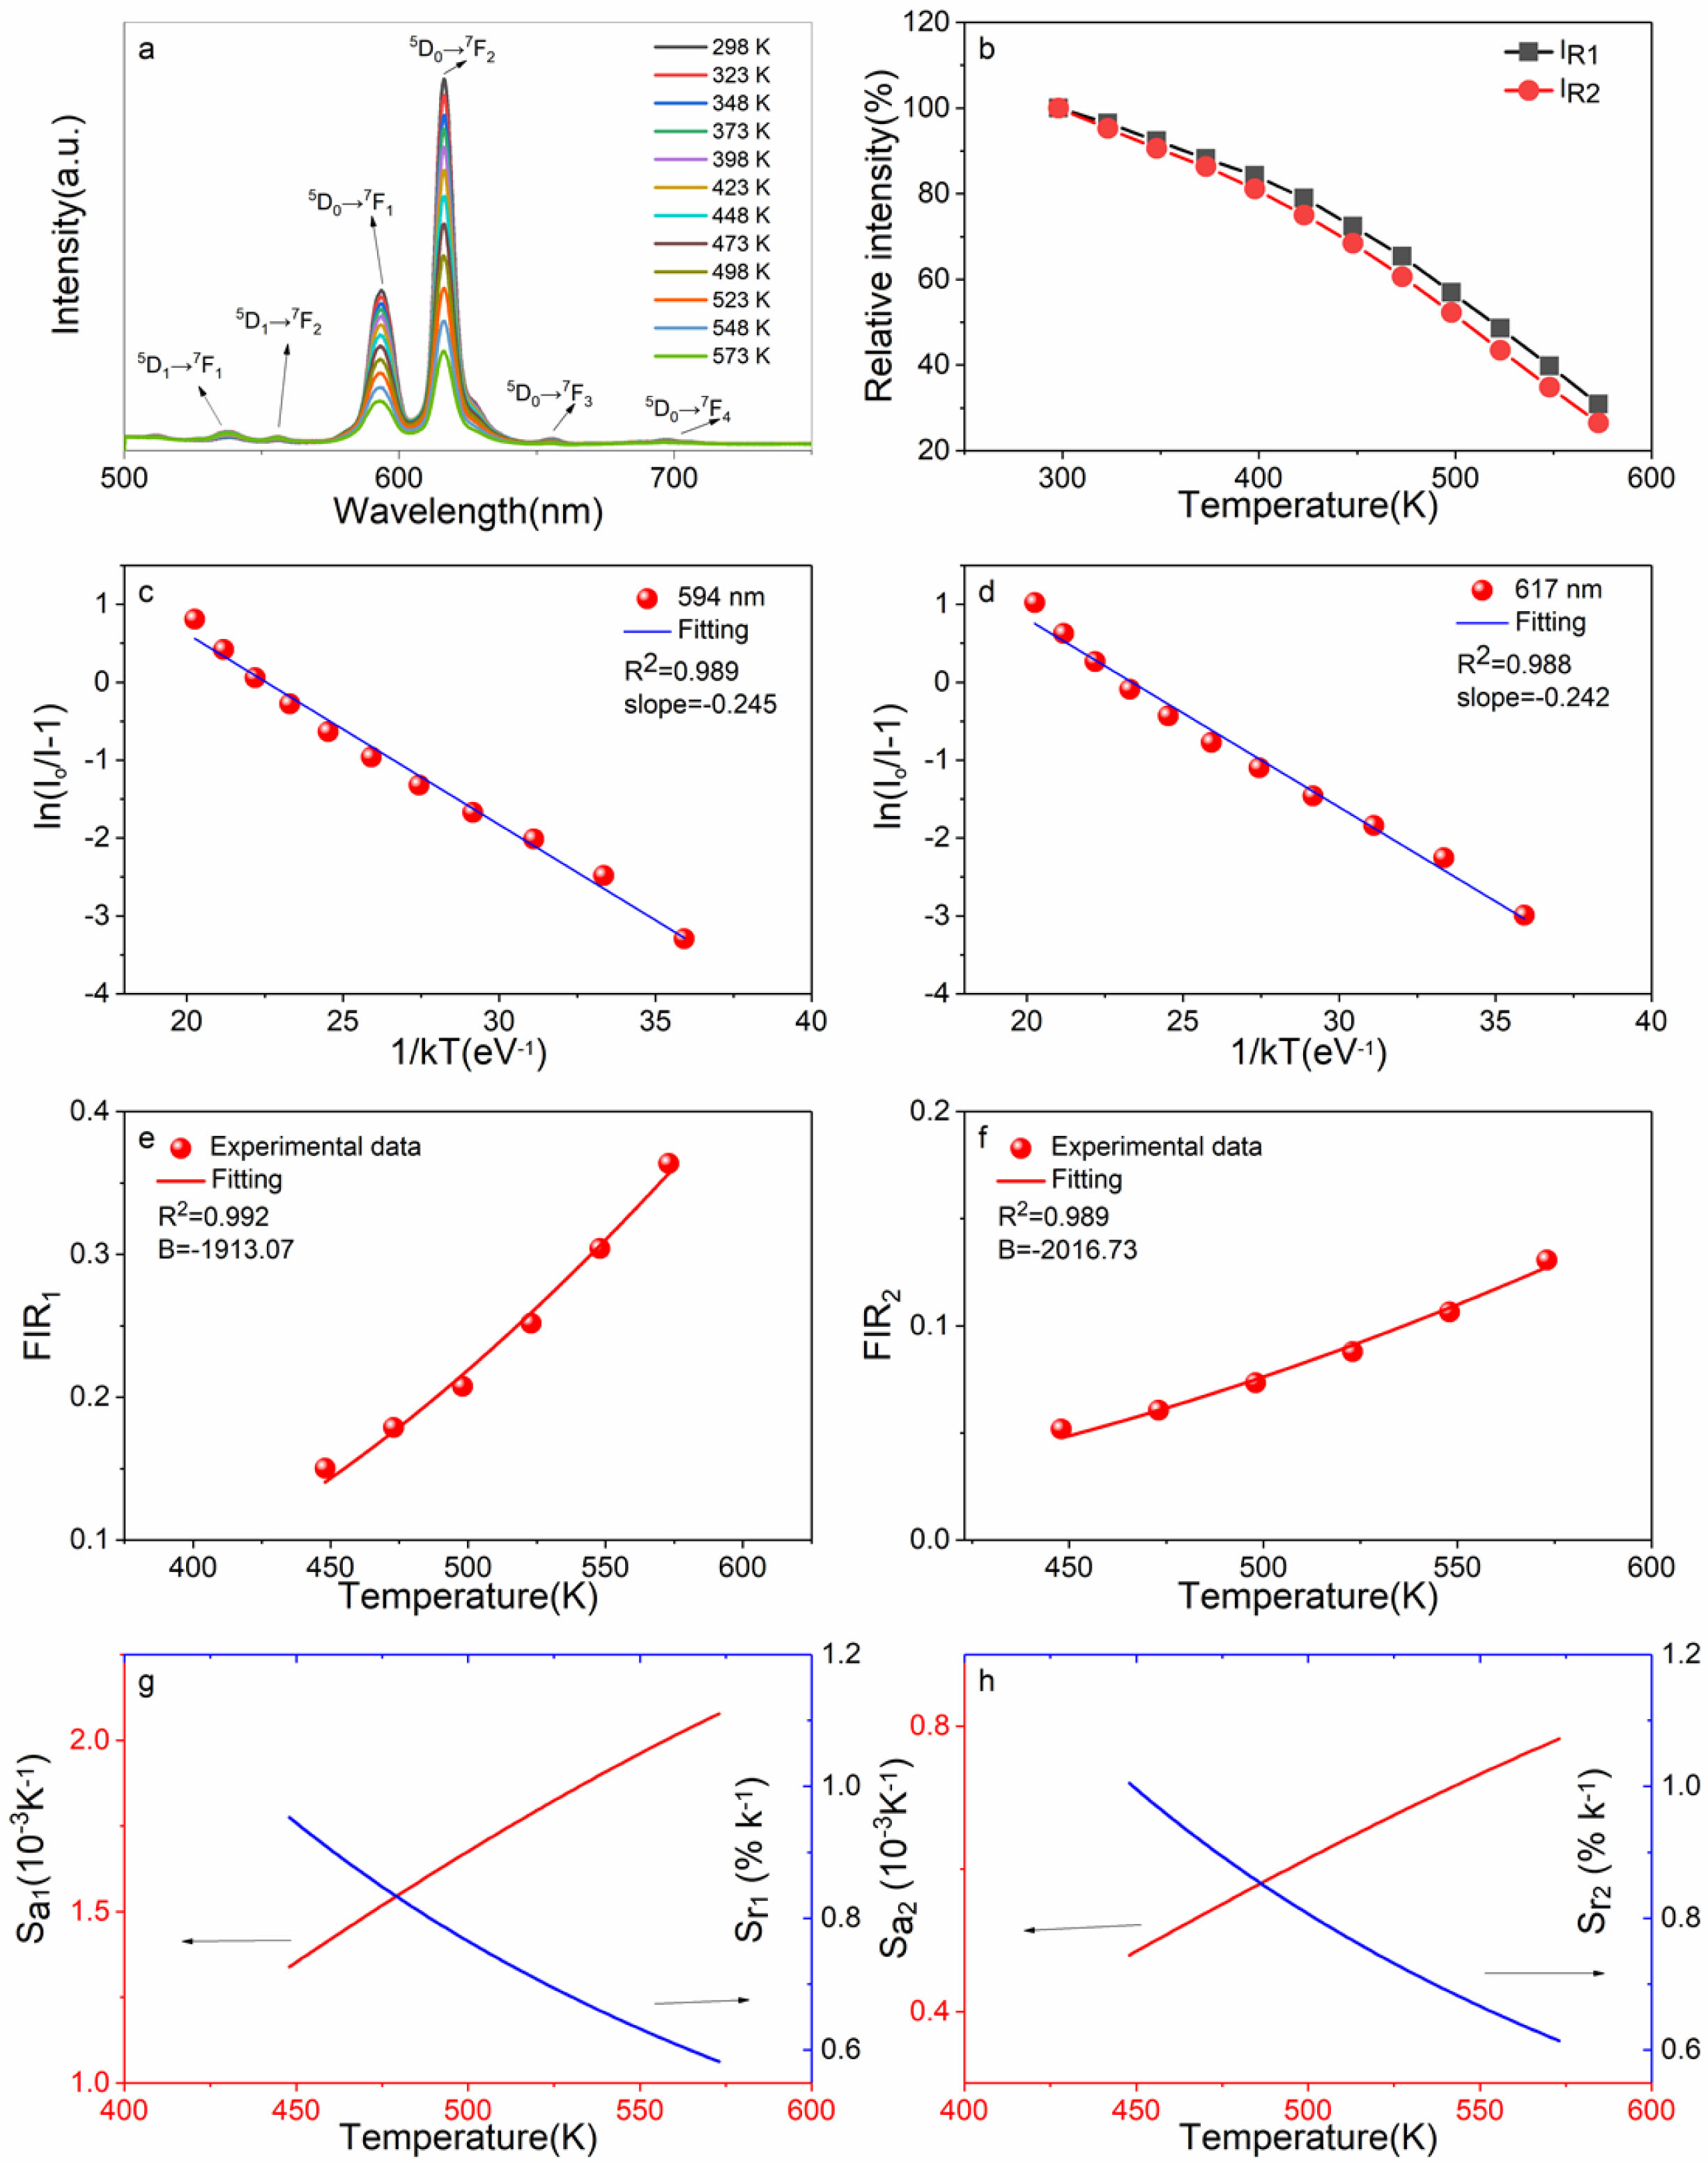
Fig. 9(a) is the temperature dependent PL spectra of sample CaTiO3:15%Eu3+ excited at 398 nm in the range of 298-573 K (temperature interval 25 K). The results show that the main emitting peaks at ~539 nm, ~556 nm, ~594 nm, ~617 nm, ~656 nm and ~698 nm were from 4f transitions of Eu3+( 5D1→7F1, 5D1→7F2, 5D0→7F1, 5D0→7F2, 5D0→7F3 and 5D0→7F4). The relative intensity IR1 or IR2 is the ratio of peak intensity at ~594 nm or ~617 nm at different temperatures to 298 K. In Fig. 9(b), when temperature is increasing, the relative luminescence intensity (IR1 and IR2) gradually decreases, resulting in the phenomenon of thermal quenching. As is known, phosphors in pc-WLEDs need to work at ~423 K for a long time, so intensity ratio (423 K/298 K) as an important parameter is used for evaluating its thermal stability. IR1 at 423 K of sample CaTiO3:15%Eu3+ is 87.29%, and IR2 at 423 K is 83. 22%. The results showed that the thermal stability of CaTiO3:15%Eu3+ for pc-WLEDs was acceptable. Moreover, the thermal quenching activation energy as another parameter is also used for evaluating thermal stability. The higher the activation energy value, the better the thermal stability of phosphors. Furthermore, in Fig. 10, the thermal quenching process can be explained by configuration coordinate diagram. When the excited state parabola of Eu3+ and the charge-transfer state parabola intersect at one point, because of thermal perturbation the electrons can reach the ground state via non-radiative transition. The energy gap from the bottom of the excited parabola to its intersection with the charge transfer parabola is activation energy. According to formula (8) [44], the data from ln(I0/I-1) vs 1/kT are fitted linearly, and Ea can be obtained, as shown in Fig. 9(c) and (d).
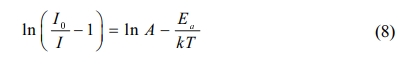
Where, I0 (298 K) is the initial PL intensity, and I is the intensity of different temperatures. A is a constant, the activation energy Ea is energy gap from bottom of 5D0 state to its intersection with the charge transfer state, and k is boltzmann constant (8.61733×10⁻⁵ eV∙K-1). Based on the peak intensity at ~594 nm, the slope is -0.524 = −Ea. Therefore, Ea is ~0.524 eV (~4,226 cm-1). Based on the peak intensity at ~617 nm, the slope is -0.406 = −Ea and therefore, Ea is ~0.406 eV (~3,274 cm-1). In addition, FIR1 and FIR2 values of 5D1→7F1/5D0→7F1, 5D1→7F2/5D0→7F2 have temperature-dependent characteristics. FIR values can be expressed by formula (9) as follows:
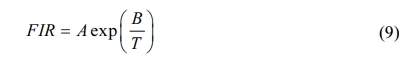
Here, A is a constant, B = ΔE/k, here ΔE is the difference between the TCLs 5D1 and 5D0, k is boltzmann constant of 8.61733×10⁻⁵ eV∙K-1∙. Fig. 9(e) and (f) are nonlinear exponential function fitting plots based on the values of FIR1 and FIR2 and temperatures, respectively. The B values can be obtained as -1,973.64 and -2,322. 67 K, thus, DE are ~0.170 eV (~1,371 cm-1) and 0.200 eV (~1,613 cm-1). However, absolute sensitivity (Sa) and relative sensitivity (Sr) as important parameters are used for optical thermometry and can be expressed by equations (10a and b).
Based on the values of FIR1 and FIR2, the functional relationship between Sa and Sr to temperature is shown in Fig. 9(g) and (h). As shown in Fig. 9(g), based on FIR1, the maximum value of Sa1 is ~2.4×10⁻³ K-1 at 573 K. As shown in Fig. 9(h), based on FIR2, the maximum value of Sa2 is ~1.23×10⁻³ K-1 at 573 K. As shown in Fig. 9(g), based on FIR1, Sr1max is ~0.983% K-1 at 448 K (1973.64/T2). As shown in Fig. 9(h), based on FIR2, Sr2max is ~1.157% K-1 at 448 K (2322.67/T2).
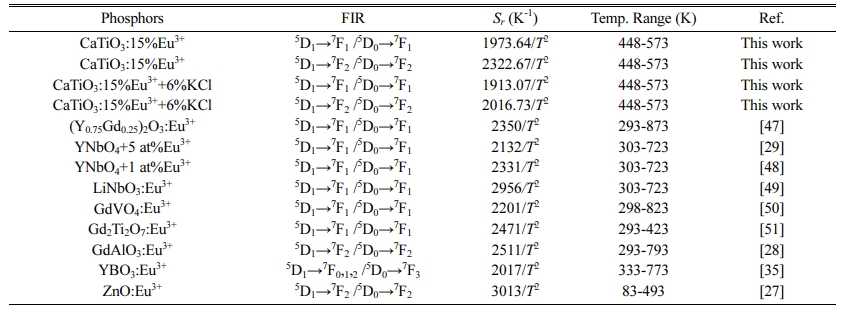
Fig. 11(a) is the temperature dependent PL spectra of sample CaTiO3:15%Eu3++6%KCl excited at 398 nm of 298-573 K at an interval of 25 K. The results shows that the main emitting peaks at ~539 nm, ~556 nm, ~594 nm, ~617 nm, ~656 nm and ~698 nm were from Eu3+ 4f transitions of 5D1→7F1, 5D1→7F2, 5D0→7F1, 5D0→7F2, 5D0→7F3 and 5D0→7F4. In Fig. 11(b), as temperature is increasing, the IR1 and IR2 value gradually decreases, resulting in the thermal quenching phenomenon. For sample CaTiO3:15%Eu3++6%KCl, IR1 at 423 K is 78.95%, and IR2 at 423 K is 75.01%. Compared with the sample CaTiO3:15%Eu3+, the thermal stability of CaTiO3:15%Eu3++6%KCl decreased, but for application for pc-WLEDs, its thermal stability is also acceptable. According to formula (8) [44], the data from ln(I0/I-1) versus 1/kT are also fitted linearly, and the values Ea can be also obtained, as shown in Fig. 11(c) and (d). Based on the peak intensity at ~594 nm, the slope is -0.245 = −Ea. Therefore, Ea is ~0. 245 eV (~1,976 cm-1). Based on the peak intensity at ~617 nm, the slope is -0.242 = −Ea and therefore, Ea is ~0.242 eV (~1,952 cm-1). In addition, FIR1 and FIR2 values of 5D1→7F1/5D0→7F1, 5D1→7F2/5D0→7F2 have temperature-dependent characteristics. FIR values versus temperature can be expressed by formula (9). Fig. 11(e) and (f) are nonlinear exponential function fitting plots based on the values of FIR1 and FIR2 versus temperatures, respectively. The B values can be obtained as -1,913.07 and -2,016.73 K. Therefore, ΔE are ~0.165 eV (~1,331 cm-1) and 0.174 eV (~1,403 cm-1). Based on the values of FIR1 and FIR2, the functional relationship between absolute sensitivity (Sa) and relative sensitivity (Sr) to tem- perature is shown in Fig. 11(g) and (h). As shown in Fig. 11(g) and (h), based on FIR1, Sa1max is ~2.08×10⁻³ K-1 at 573 K and based on FIR2, Sa2max is ~0.782×10⁻³ K-1 at 573 K. As shown in Fig. 11(g) and (h), based on FIR1, Sr1max is ~0.953%K-1 at 448 K (1913.07/T2) and based on FIR2, Sr2max is ~1.005%K-1 at 448 K (2016.73/T2), which is close to that of YBO3:Eu3+ phosphor reported by Zhao et al. (2017/T2) [35]. At present, the temperature sensing characteristics of Eu3+ doped luminescent materials are shown in Table 3. In conclusion, it can be seen that the 2322. 67 /T2 of sample CaTiO3: 15%Eu3+ is close to the 2350/T2 of (Y0.75Gd0.25)2O3: Eu3+:Eu3+ reported by Nikoli'c et al. [47]. It can be seen that the value is not the best, but pretty prominent [48-51]. In addition, by comparing the above samples CaTiO3:15%Eu3+ and CaTiO3:15%Eu3++6%KCl, it can be concluded that increasing its PL intensity does not necessarily improve its relative sensitivity. Therefore, CaTiO3:Eu3+ phosphors have great potential for optical thermometry. Our samples based on FIR have the advantages of high precision, long-distance controllability, high signal resolution and in-situ temperature measurement.
|
Fig. 1 (a) XRD pattern of CaTiO3:xEu3+(x=1%, 5%, 10%, 15%, 20%, 25% and 30%); (b) XRD pattern of CaTiO3:15%Eu3++ 6%KCl. |
|
Fig. 2 Particle size distributions and SEM images, EDS spectra and element mappings of samples CaTiO3:15% Eu3+(a, b, e and f) and CaTiO3:15%Eu3++6%KCl (c, d, g and h). |
|
Fig. 3 (a) UV-vis DR spectra and (b-h) plots of [F(R∝)hv)] versus photon energy (hv) of the CaTiO3:xEu3+(x=1%, 5%, 10%, 15%, 20%, 25%, 30%). |
|
Fig. 4 (a) UV-vis DR spectra and (b) plots of [F(R∝)hv)] versus photon energy (hv) of CaTiO3:15%Eu3++6%KCl. |
|
Fig. 5 (a) PLE spectra; (b) PL spectra of the CaTiO3:xEu3+(x=1%, 5%, 10%, 15%, 20%, 25%, 30%). |
|
Fig. 6 (a) PL intensity of CaTiO3:xEu3+(x=1%, 5%, 10%, 15%, 20%, 25%, 30%) excited by398 nm and (b) log(I/x) vs log(x) linear fitting of CaTiO3:xEu3+ (x > 15%) |
|
Fig. 7 (a) PLE spectra and (b) PL spectra of CaTiO3:15%Eu3++ yKCl (y=0, 0.5%, 1%, 1.5%, 2%, 3%, 4%, 5%, 6%). |
|
Fig. 8 Excitation and emission spectra of samples CaTiO3: 15%Eu3++ 6%KCl (a) and CaTiO3:15%Eu3+ (b) collected by using an integrating sphere; CIE chromaticity diagram (c) of CaTiO3: 15%Eu3++ 6%KCl and CaTiO3:15%Eu3+ excited by 398 nm |
|
Fig. 9 (a) The temperature-dependent PL spectra excited by 398 nm of CaTiO3:15%Eu3+ of 298-523 K in 25-K increments; (b) the relative intensity; (c) plot of ln(I0/I-1) vs 1/kT based on 5 D0→7 F1; (d) plot of ln(I0/I-1) vs 1/kT based on 5 D0→7 F2; (e) the relation of FIR1 based on TCLs of 5 D1→7 F1/ 5 D0→7 F1 and temperature; (f) the relation of FIR2 values based on TCLs of 5 D1→7 F2/ 5 D0→7 F2 and temperature; (g) the relation of Sa and Sr vs temperature based on FIR1 values; (h) the relation of Sa and Sr vs temperature based on FIR2 values of 448-573 K. |
|
Fig. 10 Schematic illustration of the thermal quenching process for Eu3+ through the 5 D0 state and charge-transfer state. |
|
Fig. 11 (a) The temperature-dependent PL spectra excited by 398 nm of 298−523 K of CaTiO3:15%Eu3++6%KCl in 25-K increments; (b) the relative intensity; (c) the plot of ln(I0/I-1) vs 1/kT based on 5 D0→7 F1; (d) plot of ln(I0/I-1) vs 1/kT based on 5 D0→7 F2; (e) the relation of FIR1 values based on TCLs of 5 D1→7 F1/ 5 D0→7 F1 to temperature; (f) the relation of FIR2 values based on TCLs of 5 D1→7 F2/ 5 D0→7 F2 to temperature; (g) plots of Sa and Sr to temperature based on FIR1 values; (h) plots of Sa and Sr to temperature based on FIR2 values of 448- 573 K. |
KCl flux assisted CaTiO3:Eu3+ red phosphors were synthesized by solid phase reaction method. The typical samples had rhombic perovskite phase. Sample CaTiO3: 15%Eu3+ had the irregular particle structure, with mean particle size of about 1.58 μm, while CaTiO3:15%Eu3+ +6%KCl also had the irregular particle structure, with mean particle size of about 2.25 μm. We found that KCl flux could increase the particle size and crystallinity, which was beneficial to luminescence property. When Eu3+ ion concentration was 15mol%, concentration quenching took place. The critical Eu3+-Eu3+ distance is ~8.93 Å, and types of non-radiative energy transfer can be dipole-dipole interaction. We found that a certain amount of KCl flux could improve its intensity of photo- luminescence. The sample CaTiO3:15%Eu3++6%KCl exhibits quantum yield of 66.04%, while that of the CaTiO3:15%Eu3+ is 55.01% under the same excitation wavelength of 398 nm. It is indicated that the quantum yield of the sample with flux is higher than that of the sample without flux. Based on the PL spectra excited at 398 nm, the color coordinates of CaTiO3:15%Eu3+ were (0.5911, 0.4008) and the color purity was 97.7%, while the color coordinates of sample CaTiO3:15%Eu3++ 6%KCl were (0.6042, 0.3895) and the color purity was 98.4%. Based on the thermally coupled energy level fluorescence intensity ratio FIR2, the relative sensitivity of sample CaTiO3:15%Eu3+ was 2322.67/T2, which was expected to be used for optical temperature sensing.
This work was supported by Scientific Research Foundation of Hunan Provincial Education Department of China (Grant Nos. 20A274 and 18B450); Natural Science Foundation of Hunan Province of China (Grant No. 2019JJ50282); the Double First-Class Discipline Construction Program of Hunan Province of China (Grant No. Xiang Jiao Tong [2018]469); Undergraduate Innovation and Entrepreneurship Training Program of Hunan Province of China (Grant No.S202110553020) and the Planned Science and Technology Project of Hunan Province of China (Grant No.2016TP1028).
- 1. P. Du, W. Ran, W. Li, L. Luo and X. Huang, J. Mater. Chem. C 7[35](2019) 10802-10809.
-

- 2. B. Joshi and G. Gyawali, J. Ceram. Process. Res. 21[6](2020) 705-711.
-
- 3. C. Wang, W. Ran, P. Du, W. Li, L. Luo and D. Wang, Inorg. Chem. 59[16](2020) 11801-11813.
-
- 4. P. Du, J. Tang, W. Li and L. Luo, Chem. Eng. J. 406(2021) 127165.
-
- 5. P. Du, X. Huang and J.S. Yu, Chem. Eng. J. 337(2018) 91-100.
-
- 6. Y. Wu, F. Yang, H. Zhang, F. Yan and R. Zuo, J. Ceram. Process. Res. 22[4](2021) 436-440.
-
- 7. F. Li, X. Liu, and T. He, Chem. Phys. Lett. 686 (2017) 78-82.
-
- 8. T.M. Mazzo, L. Mendonça Da Rocha Oliveira, L.R. Macario, W. Avansi Jr, R.D. Silveira André, I.L. Viana Rosa, J.A. Varela, and E. Longo, Mater. Chem. Phys. 145[1-2] (2014) 141-150.
-
- 9. L.H. Oliveira, J. Savioli, A.P. De Moura, I.C. Nogueira, M.S. Li, E. Longo, J.A. Varela, and I.L.V. Rosa, J. Alloys Compd. 647 (2015) 265-275.
-
- 10. T.M. Mazzo, M.L. Moreira, I.M. Pinatti, F.C. Picon, E.R. Leite, I.L.V. Rosa, J.A. Varela, L.A. Perazolli, and E. Longo, Opt. Mater. 32[9] (2010) 990-997.
-
- 11. Z. Sun, G. Cao, Q. Zhang, Y. Li, and H. Wang, Mater. Chem. Phys. 132[2] (2012) 937-942.
-
- 12. Y. Wu, F. Zhao, K. Ruan, H. Zhang, and X. Piao, Chem. Phys. Lett. 633 (2015) 234-240.
-
- 13. X. Xu, Y. Tang, F. Mo, L. Zhou, and B. Li, Ceram. Int. 40[7 PART B] (2014) 10887-10892.
-
- 14. J. Zhang, Y. Fan, Z. Chen, J. Wang, P. Zhao, and B. Hao, J. Rare Earth. 33[10] (2015) 1036-1039.
-
- 15. S. Som, S. Dutta, V. Kumar, A. Pandey, V. Kumar, A.K. Kunti, J. Priya, S.K. Sharma, J.J. Terblans, and H.C. Swart, J. Alloys Compd. 622 (2015) 1068-1073.
-
- 16. Y. Wu, Z. Sun, K. Ruan, Y. Xu, and H. Zhang, J. Lumin. 155 (2014) 269-274.
-
- 17. Y. Wu, F. Zhao, X. Piao, and K. Ruan, Luminescence 31[1] (2016) 152-157.
-
- 18. T. Orihashi and S. Adachi, J. Alloys Compd. 646 (2015) 1116-1123.
-
- 19. P.J. Zeng, L.P. Yu, Z.X. Qiu, J.L. Zhang, C.Y. Rong, C.Z. Li, Z.H. Fu, and S.X. Lian, J. Sol-Gel Sci. Technol. 64[2] (2012) 315-323.
-
- 20. X. Chen, Y. Xu, C. Zhao, L. Wang, S. Wen, Y. Shi, Q. Xia, M. Shi, Y. Chu, F. Li, F. Chen, and K. Liu, J. Electron. Mater. 49 (2020) 1969-1979.
-
- 21. P. Huang, Y. Wu, C. Cui, and J. Guo, J. Rare Earth. 29[4] (2011) 340-344.
- 22. P. Liu, J. Yin, X. Mi, L. Zhang, and L. Bie, J. Rare Earth. 31[6] (2013) 555-558.
-
- 23. X. Tian, C. Wang, J. Wen, S. Lian, C. Ji, Z. Huang, Z. Chen, H. Peng, S. Wang, J. Li, J. Hu, and Y. Peng, J. Lumin. 214 (2019) 116528.
-
- 24. X. Tian, S. Lian, C. Ji, Z. Huang, J. Wen, Z. Chen, H. Peng, S. Wang, J. Li, J. Hu, and Y. Peng, J. Alloys Compd. 784 (2019) 628-640.
-
- 25. C. Manjunatha, B.M. Nagabhushana, D.V. Sunitha, H. Nagabhushana, S.C. Sharma, G.B. Venkatesh, and R.P.S. Chakradhar, J. Lumin. 134 (2013) 432-440.
-
- 26. L. Zhao, J. Cai, F. Hu, X. Li, Z. Cao, X. Wei, Y. Chen, M. Yin, and C.K. Duan, RSC Adv. 7[12] (2017) 7198-7202.
-
- 27. S. Senapati and K.K. Nanda, J. Mater. Chem. C 5[5] (2017) 1074-1082.
-
- 28. V. Lojpur, S. Ćulubrk, M. Medić, and M. Dramicanin, J. Lumin. 170 (2016) 467-471.
-
- 29. L.R. Dačanin, S.R. Lukić-Petrović, D.M. Petrović, M.G. Nikolić, and M.D. Dramićanin, J. Lumin. 151 (2014) 82-87.
-
- 30. S. Zhou, X. Li, X. Wei, C. Duan, and M. Yin, Sens. Actuators, B 231 (2016) 641-645.
-
- 31. M.G. Nikolić, Ž. Antić, S. Ćulubrk, J.M. Nedeljković, and M.D. Dramićanin, Sens. Actuators, B 201 (2014) 46-50.
-
- 32. X. Tian, F. Zhou, X. Liu, H. Zhong, J. Wen, S. Lian, C. Ji, Z. Huang, Z. Chen, H. Peng, J. Li, J. Hu, and Y. Peng, J. Solid State Chem. 280 (2019) 120997.
-
- 33. X. Tian, T. Zhou, J. Wen, Z. Chen, C. Ji, Z. Huang, S. Lian, X. Liu, H. Peng, C. Li, J. Li, J. Hu, and Y. Peng, Mater. Res. Bull. 129 (2020) 110882.
-
- 34. S. Zhou, K. Deng, X. Wei, G. Jiang, C. Duan, Y. Chen, and M. Yin, Opt. Commun. 291 (2013) 138-142.
-
- 35. L. Zhao, Z. Cao, X. Wei, M. Yin, and Y. Chen, J. Rare Earth. 35[4] (2017) 356-360.
-
- 36. P. Du, X. Huang, and J.S. Yu, Inorg. Chem. Front. 4[12] (2017) 1987-1995
-
- 37. D.T.M. Huong, N.H. Nam, L.V. Vu, and N.N. Long, J. Alloys Compd. 537 (2012) 54-59.
-
- 38. S. Kumar, R. Prakash, V. Kumar, G.M. Bhalerao, R.J. Choudhary, and D.M. Phase, Adv. Powder Technol. 26[4] (2015) 1263-1268.
-
- 39. R. Cao, J. Zhang, W. Wang, Q. Hu, W. Li, W. Ruan, and H. Ao, Luminescence 32[6] (2017) 908-912.
-
- 40. D. Liu and Z. Zhu, J. Alloys Compd. 583(2014) 291-294.
-
- 41. G. Blasse, J. Solid State Chem. 62[2] (1986) 207-211.
-
- 42. M. Shang, S. Liang, H. Lian, and J. Lin, Inorg. Chem. 56[11] (2017) 6131-6140.
-
- 43. K. Li, M. Shang, D. Geng, H. Lian, Y. Zhang, J. Fan, and J. Lin, Inorg. Chem. 53[13] (2014) 6743-6751.
-
- 44. H. Ren, W. Zhao, L. Wang, S.O. Ryu, and C. Gu, J. Alloys Compd. 653 (2015) 611-618.
-
- 45. J.Q. Qi, J.X. Chang, R.Q. Zhang, Q.Q. Zhang, B.D. Liu, J. Chen, and X.M. Han, Ceram. Int. 44[12] (2018) 14342-14347.
-
- 46. Y. Xu, X. Zhang, S. Dai, B. Fan, H. Ma, J.-l. Adam, J. Ren, and G. Chen, J. Phys. Chem. C 115[26] (2011) 13056-13062.
-
- 47. M.G. Nikolić, V. Lojpur, Ž. Antić, and M.D. Dramićanin, Phys. Scr. 87[5] (2013) 055703.
-
- 48. L.R. Dačanin, M.D. Dramićanin, S.R. Lukić-Petrović, D.M. Petrović, and M.G. Nikolić, Radiat. Meas. 56 (2013) 143-146.
-
- 49. Z. Liang, F. Qin, Y. Zheng, Z. Zhang, and W. Cao, Sens. Actuators, A 238(2016) 215-219.
-
- 50. M.G. Nikolić, D.J. Jovanović, and M.D. Dramićanin, Appl. Opt. 52[8] (2013) 1716-1724.
-
- 51. V. Lojpur, S. Ćulubrk, and M.D. Dramićanin, J. Lumin. 169 (2016) 534-538.
-
 This Article
-
2021; 22(5): 555-567
Published on Oct 31, 2021
- 10.36410/jcpr.2021.22.5.555
- Received on Feb 28, 2021
- Revised on May 10, 2021
- Accepted on May 14, 2021
Services
- Abstract
introduction
experimental
results and discussion
conclusions
- Acknowledgements
- References
- Full Text PDF
Shared
Correspondence to
- Xiuying Tian
-
Hunan Provincial Key Laboratory of Fine Ceramics and Powder Materials, School of Materials and Environmental Engineering, Hunan University of Humanities, Science and Technology, Loudi,417000, China
Tel : +86-0738-8325065 Fax: +86-0738-8326910 - E-mail: xiuyingt@yahoo.com
Clean-Energy Research Institute(CRI), Hanyang University, 222, Wangsimni-ro, Seongdong-gu, Seoul, 04763, Korea
E-mail: jcpr@hanyang.ac.kr