


- Research on grain composition, grain size and electrical conductivity of the CuCr1-xMgxO2 (0 ≤ x ≤ 0.08)
Yanyan Tanga,b, Yiding Hua, Yi Lia, Haorong Wua, Liangwei Chena and Lan Yua,*
aFaculty of Material Science and Engineering, Kunming University of Science and Technology, Kunming, Yunnan, 650093, P.R. China
bFaculty of physics and photoelectric engineering, Weifang University, Weifang, Shandong, 261061, P.R. ChinaThis article is an open access article distributed under the terms of the Creative Commons Attribution Non-Commercial License (http://creativecommons.org/licenses/by-nc/4.0) which permits unrestricted non-commercial use, distribution, and reproduction in any medium, provided the original work is properly cited.
A series of layered CuCr1-xMgxO2 (0 ≤ x ≤ 0.08) polycrystalline ceramics were prepared. The effects of substituting Mg2+ cations for Cr3+ cations on the grain composition, grain size, grain quantity, and electrical conductivity were investigated. When x = 0–0.04, the distinct layered structure grain grew rapidly with the increase of magnesium in the composition, and the average grain size increased from 2.5 μm (x = 0) to 15 μm (x = 0.04) due to the decrease of activation energy. Furthermore, the bulk density and lattice constant also reached the maximum and minimum values of 4.367 g/cm3 and 17.083 respectively at x = 0.04. When x = 0.05–0.08, the average grain size slightly decreased due to the grown-up second-phase MgCr2O4 hindering of grain growth. The results showed that the average size of the second-phase MgCr2O4 had reached 1.3 μm when x = 0.04. In general, the larger the grain size of polycrystalline ceramics, the more defects in the grain boundaries, and the better its electrical conductivity. Therefore, the solid-phase reaction, which can obtain larger grain size and more grain boundary defects, was chosen here to prepare CuCr1-xMgxO2 polycrystalline ceramics, so as to obtain a highly conductive CuCr1-xMgxO2 ceramic material. The minimum resistivity of the obtained CuCr0.6Mg0.4O2 polycrystalline ceramic is only 0.091 Ω·cm, which is of great significance for the development of transparent conductive oxides
Keywords: CuCr1-xMgxO2 grain composition grain size grain quantity electrical conductivity
Since the discovery of p-type CuCr1-xMgxO2 materials, studies have primarily focused on their thermoelectric, photoelectric, and catalytic properties [1-7], while the crystal structure of CuCr1-xMgxO2 and the second phase have been less frequently studied. As a p-type transparent conductive oxide, CuCr1-xMgxO2 ceramics have been prepared by hydrothermal synthesis, solid-state reaction, et al. [1, 4, 5, 7, 8], and CuCr1-xMgxO2 films have been prepared by reactive magnetron sputtering deposition, sol-gel processing, ALD (atomic layer deposition), et al. [3, 9, 10]. Maignan et al. [1] obtained the microstruc- ture images of CuCr1-xMgxO2 ceramics and measured its composition using energy-dispersive X-ray spectro- scopy. Yu et al. [3] obtained the microstructure images of CuCr1-xMgxO2 films and analyzed their surface topography, root mean square roughness, and optical and electrical properties. Kaya et al. [4] compared the images, resistivity and calculated particle-size distribu- tions of Mg- and Fe-doped CuCrO2 nanocrystals prepared by hydrothermal synthesis. Furthermore, Okuda et al. published a series of research papers on the properties of doped CuCrO2 ceramics [5, 7 ,8]. H.-Y. Chen et al. [9] analyzed the morphologies, and the optical, electrical properties. In this paper, we summarized the statistical grain distribution of the main-phase CuCr1-xMgxO2 and second-phase MgCr2O4 based on electron microscope images. Moreover, we analyzed the characteristics of the grain structure and its correlation with electrical resistivity.
The CuCr1-xMgxO2 ceramic samples were prepared in two steps using a standard solid-state reaction in air. First, the raw materials (Cu2O [99.9%], Cr2O3 [99.95%], and MgO [99.99%]) were weighed according to the stoichiometric ratio, mixed well, and ground. Then, the powders were pressed into pellets and pre-sintered at 1,100 oC for 12 h. In the second step, the sintered pellets were ground and pressed into pellets again, sintered at 1,100 oC for 12 h, and finally, cooled to room temperature.
The polycrystalline structures of the obtained samples were characterized by BDX3200 X-ray diffraction (XRD). The microstructures were observed using an XL30E scanning electron microscope (SEM). The resistivity-temperature (ρ–T) curves were studied using the four-probe method between 100 and 300 K.
Phase structure
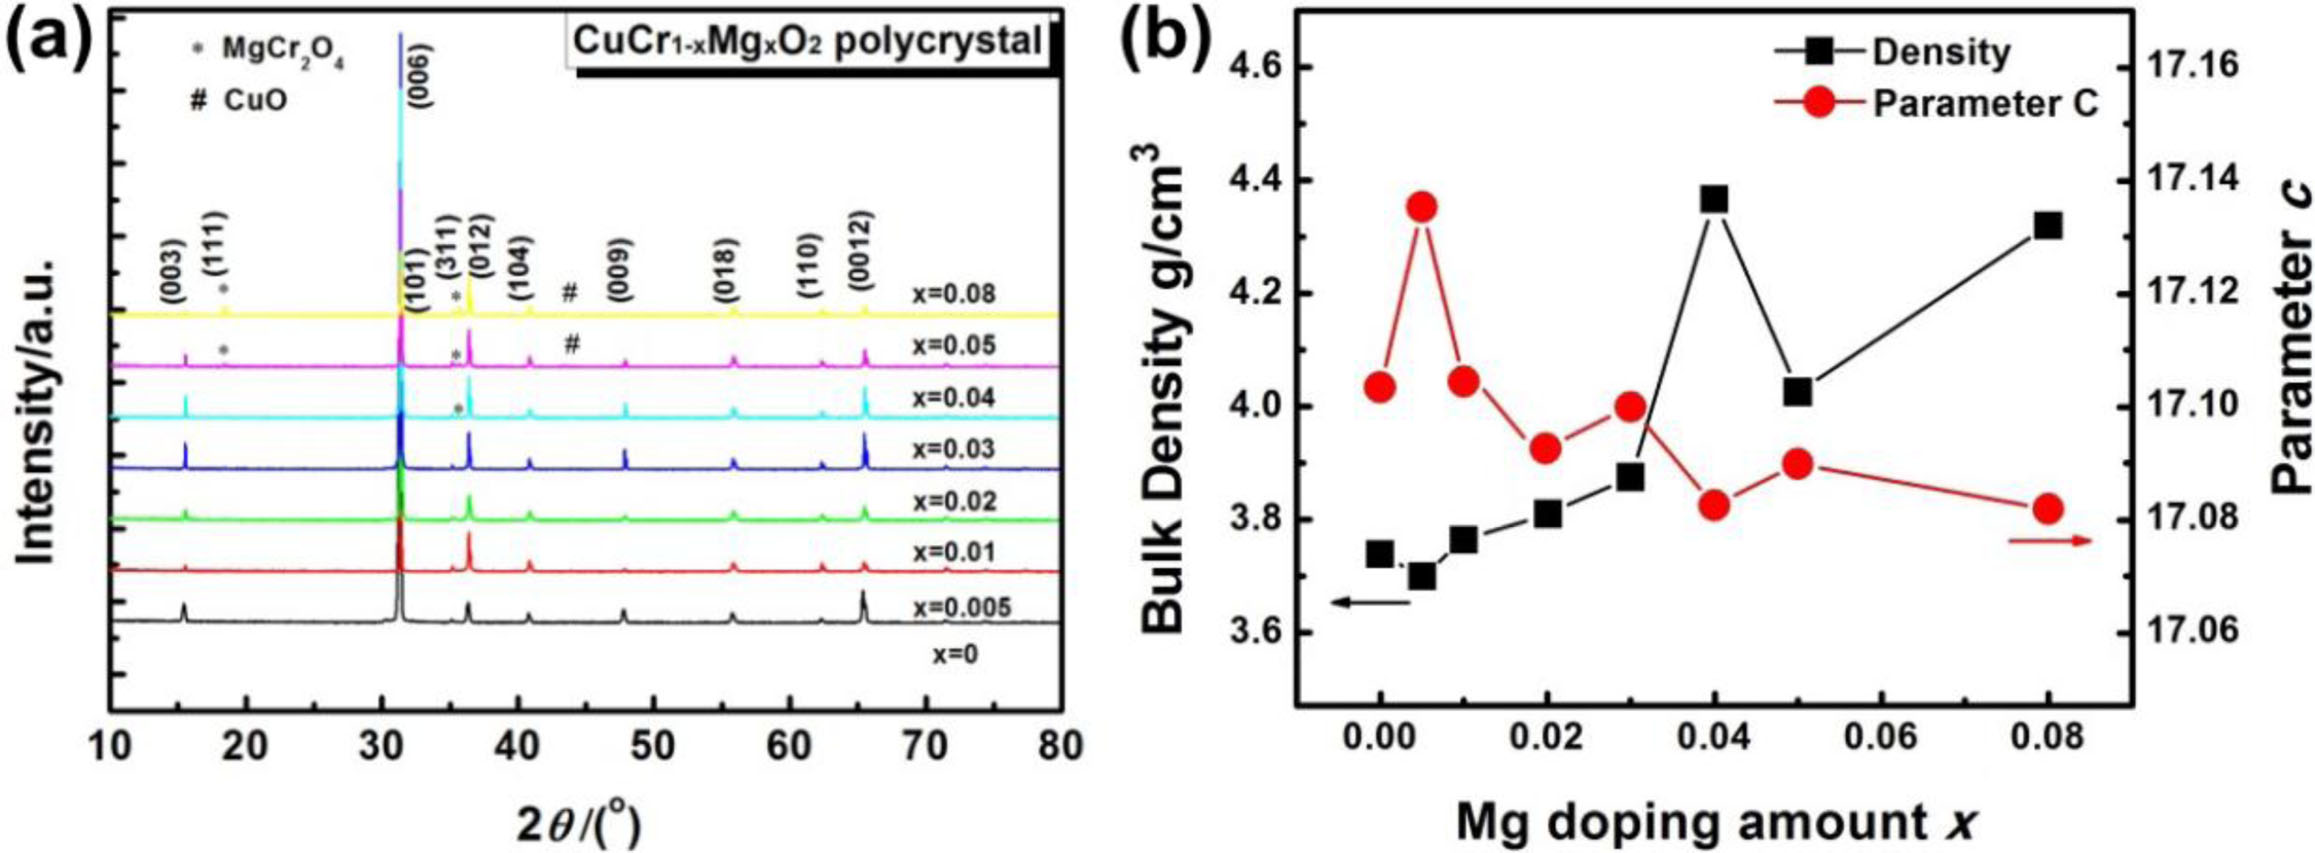
The XRD patterns of CuCr1-xMgxO2 (x = 0, 0.005, 0.01, 0.02, 0.03, 0.04, 0.05, 0.08) are shown in Fig. 1(a). The figure shows that bulk ceramics comprise a 3R-delafossite structure and a high c-axis orientation. Compared to the CuCrO2 standard spectrum (PDF 89-0539), the strongest (006) diffraction peaks indicate a shift to the right. This implies that the lattice parameter c has a decreasing trend. In addition, The spinel phase of MgCr2O4 with a (311) peak at 2θ = 35.674o was detected in some of the samples (x = 0.04–0.08). These results are in good agreement with existing studies [5, 6]. Fig. 1(b). shows the relationship between bulk density, lattice parameter c and the magnesium doping amount x. As you can see from the Fig. 1(b), substituting magnesium for chromium will produce more crystallizable CuCr1-xMgxO2 phase. With the increase of the doping amount of magnesium, the bulk density displayed an increasing trend, while the lattice constant displayed a decreasing trend. When x = 0.04, the bulk density and lattice constant reached the maximum and minimum values of 4.367 g/cm3 and 17.083 respectively, which is consistent with the reports [1, 11]. This may be mainly due to the saturation of magnesium doping.
Vertical section morphology observation
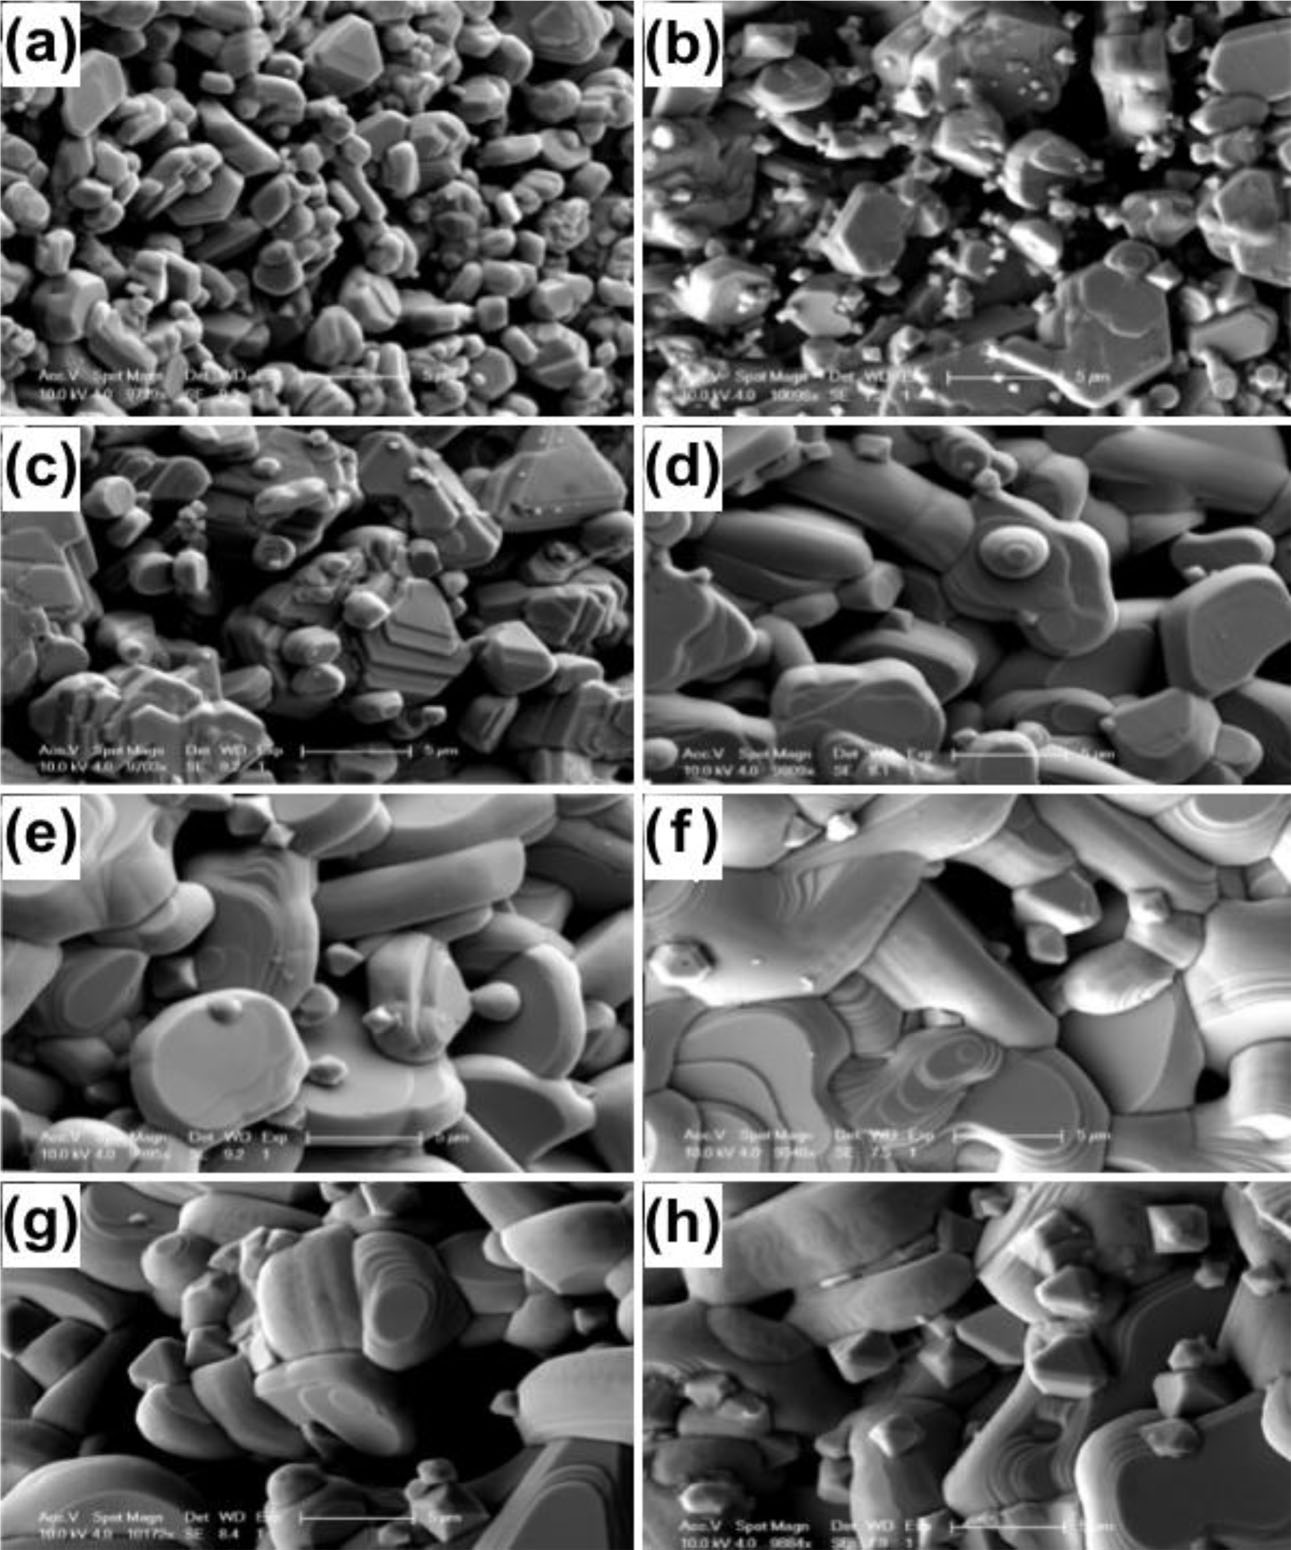
Scanning electron microscope (SEM) images of CuCr1-xMgxO2 samples are shown in Fig. 2. As you can see from the Fig. 2, all samples have layered grains. At a low doping level (x≤ 0.04), small grains are loosely distributed and sufficiently grow in the ab-plane with a reduction in grain boundaries and pores; At a high doping level (x= 0.05 and 0.08), the grains size and grain boundaries hardly changed. Similar results have previously been reported for Fe- and Mg-doped CuCrO2 nanocrystals [4]. At the same time, the doping of magnesium also introduces the second phase of MgCr2O4 spinel [1]. When x = 0.005–0.03, fine second-phase MgCr2O4 grains are observed among the CuCr1-xMgxO2 grains; When x = 0.04–0.08, MgCr2O4 grains have obviously grown in size and reach maximum average value at x = 0.08.
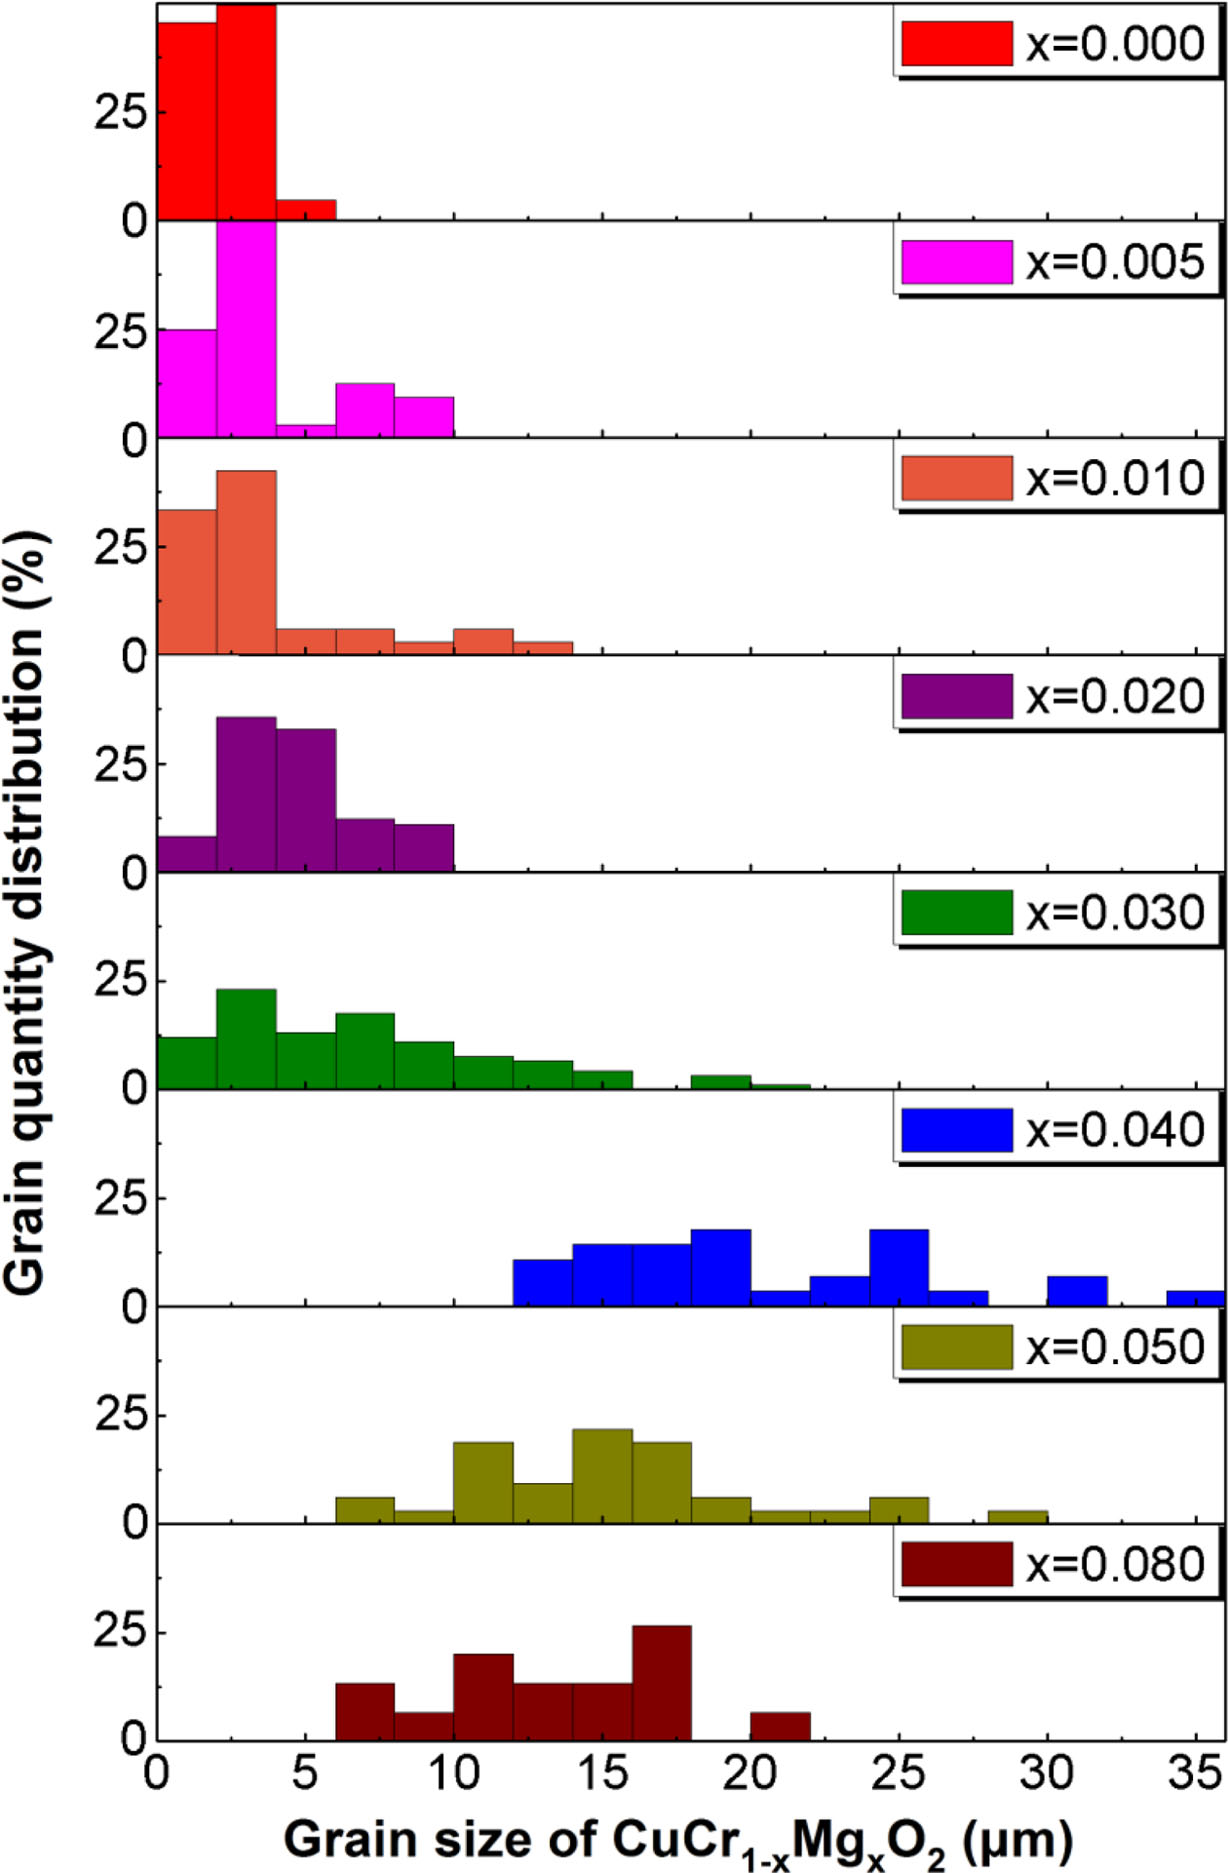
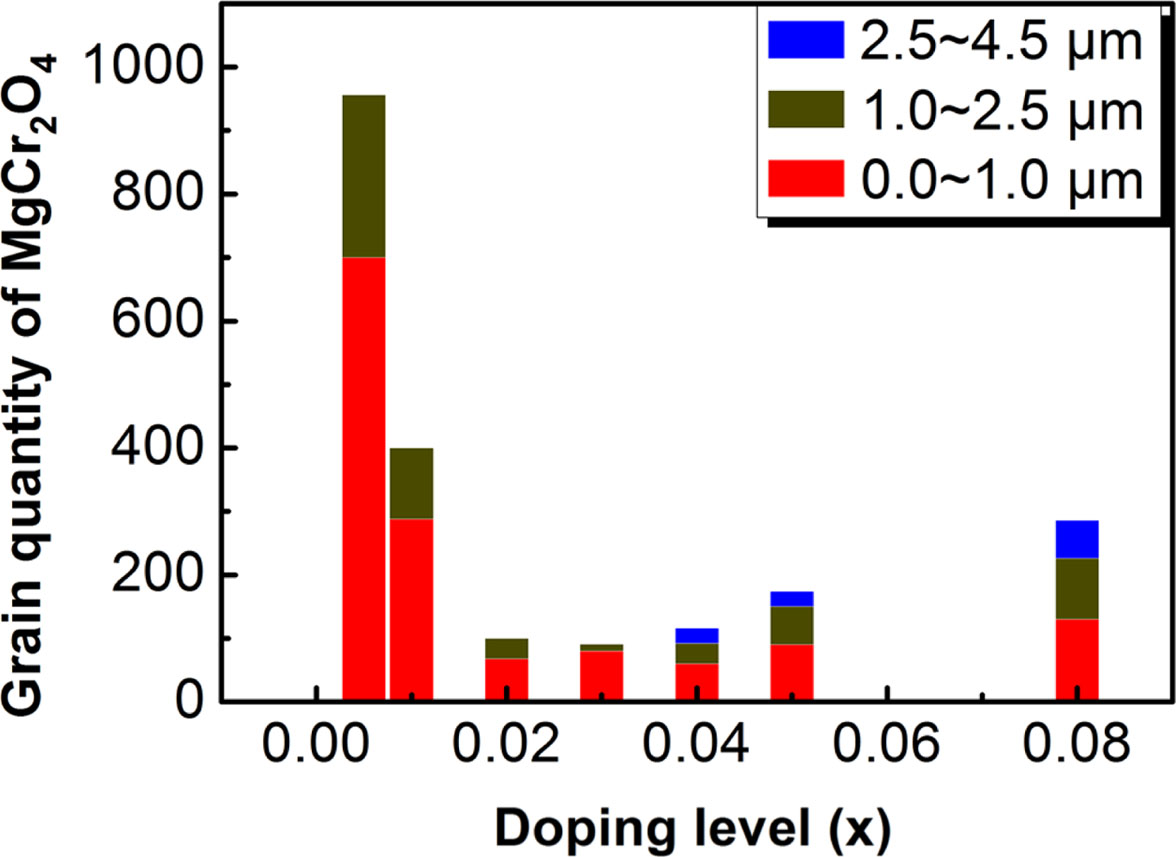
In order to quantitatively describe the crystallization of the CuCr1-xMgxO2 samples. The grain size and quantity of CuCr1-xMgxO2 phase and MgCr2O4 phase are counted. Fig. 3 shows the grain size distribution of CuCr1-xMgxO2 (0 ≤ x ≤ 0.08) samples. As you can see from Fig. 3, the average grain size is about 2.5 μm at low doping (x = 0, 0.005, 0.01), increase to 15 μm at moderate doping (x = 0.02, 0.03, 0.04), and fall to 11 μm at high doping (x = 0.05, 0.08). When x = 0.04, the average size of CuCr1-xMgxO2 phase reaches maximum value (15 μm). Further, in order to clarify the reasons for affecting the grain size distribution of the main-phase CuCr1-xMgxO2, the associated second-phase MgCr2O4 was studied. Fig. 4 shows the grain quantity of MgCr2O4 phase. As you can see from Fig. 4, although the grain quantity is the largest when x = 0.005, the average grain size is only about 0.8 μm, which hardly hinders the growth of CuCr1-xMgxO2 grains. But when x = 0.04, the average size of the second-phase MgCr2O4 has reached 1.3 μm, and the hindrance to the average grain size of CuCr1-xMgxO2 gradually appears. We speculate that this may be the reason why CuCr1-xMgxO2 phase has the largest size when x = 0.04. In addition, this may be the reason why the bulk density and lattice constant reached extreme when x = 0.04. This follows the kinetic grain-growth equation, Gn - G0n = At exp (- (Q/RT)), and it is in good agreement with existing reports [12-14]. Changes in the apparent activation energy Q and kinetic grain-growth exponent n in CuCr1-xMgxO2 with increase of the magnesium content are thought to be responsible for the crystalline grains size distribution. As the main-phase CuCr1-xMgxO2 increases, the acute angles of the grains turned into obtuse angles, indicating a decrease in the crystalline melting point and the liquid precipitation of the polycrystalline grains, which can explain the reason for the increase of CuCr1-xMgxO2 grain size too.
Electric transport properties
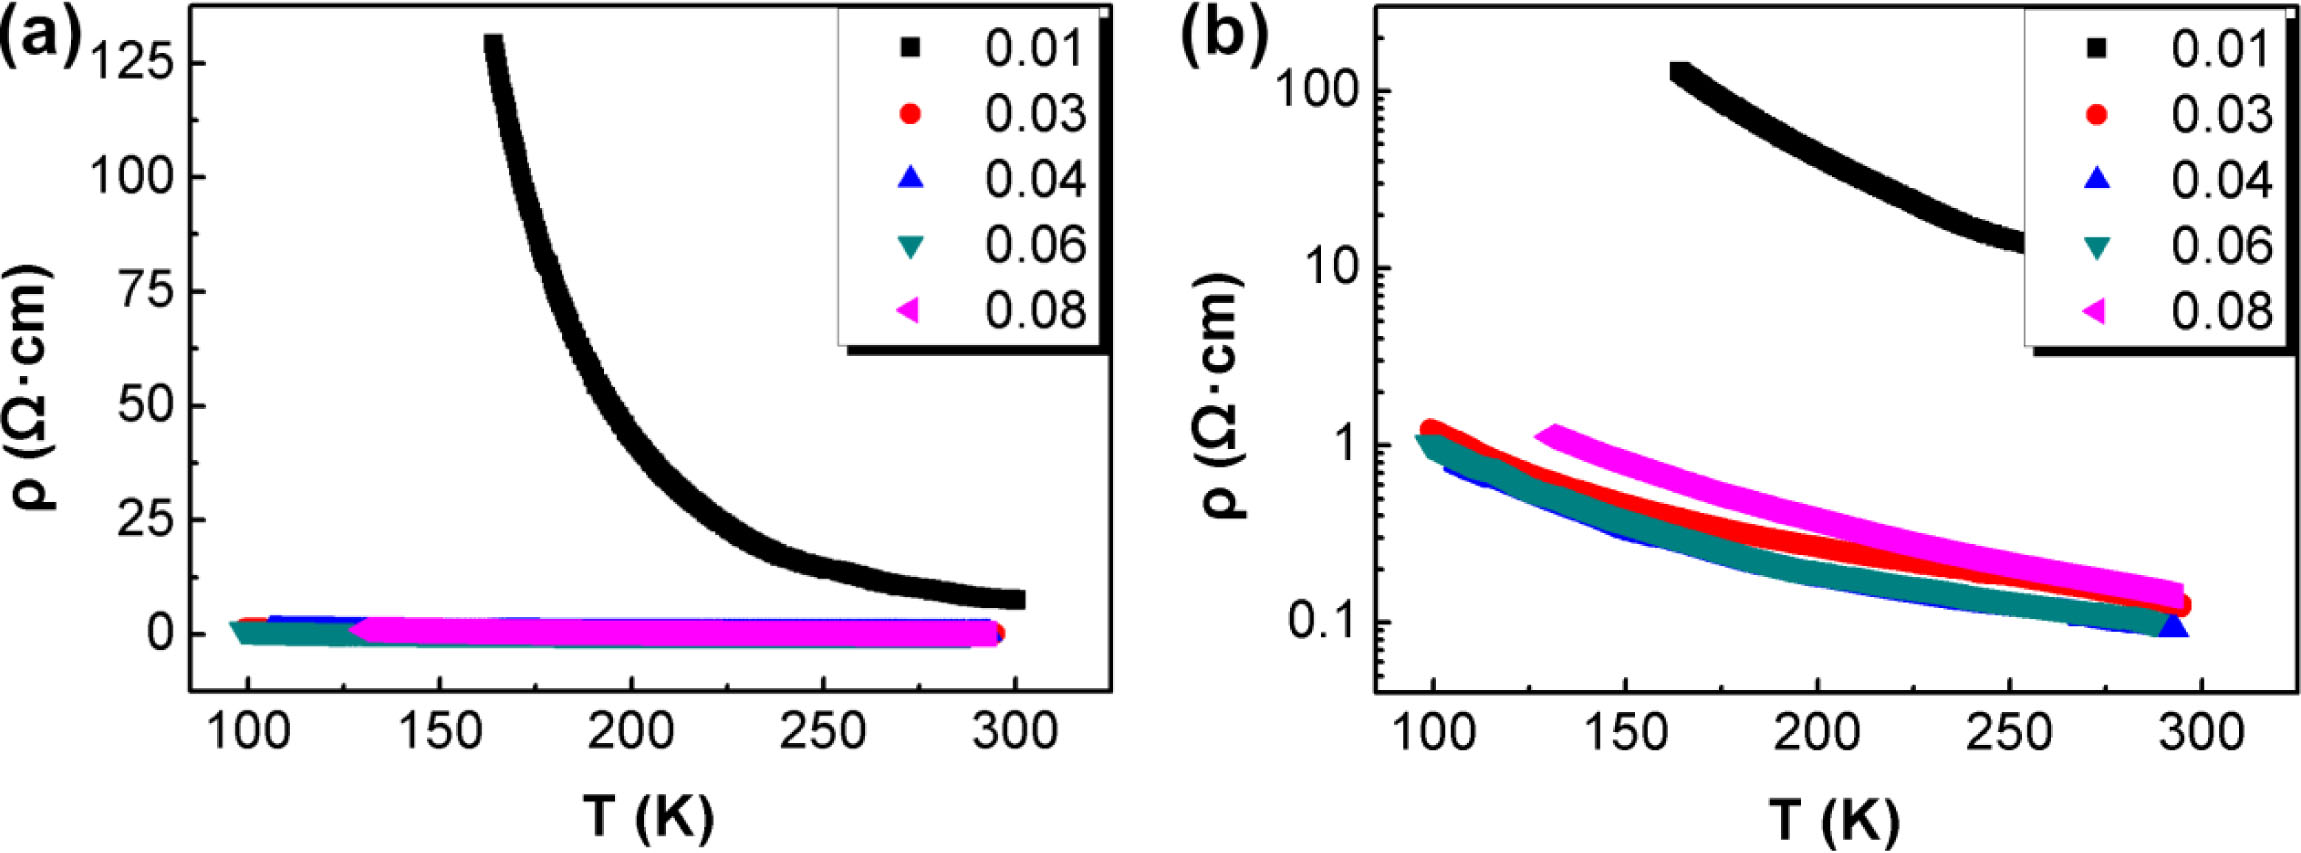
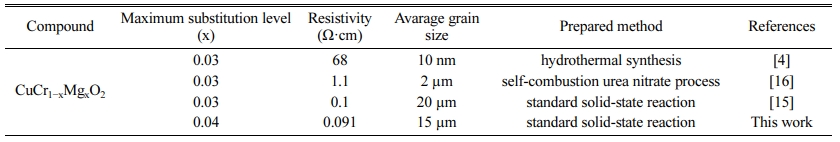
Fig. 5 shows the resistivity-temperature (ρ-T) curves of CuCr1-xMgxO2 (0.01 ≤ x ≤ 0.08) polycrystals. The resistivity is measured by a four-probe method and the resistivity is calculated by formula for volume resistivity (ρ = RS/L, where R is the resistance, S is the area, and L is the length). All the samples show semiconducting electrical transport behavior. When x = 0–0.04, the re- sistivity rapidly decreases with the increase of magnesium doping amount. The room-temperature resistivity reaches a minimum of 0.091 Ω·cm at x = 0.04, which is com- parable to the results of existing reports shown in Table 1 [4, 15, 16]. When x = 0.05–0.08, the resistivity is almost unchanged. This is because the grain size reaches its highest level, resulting in the best integrity of the lattice at x = 0.04. Thus, the reduction of grain boundaries may also have been responsible for the decrease in resistivity.
|
Fig. 1 (a) XRD patterns of CuCr1-xMgxO2; (b) relationship between bulk density, lattice parameter and the magnesium doping amount. |
|
Fig. 2 SEM image of CuCr1-xMgxO2 samples: (a) x = 0; (b) x = 0.005; (c) x = 0.01; (d) x = 0.02; (e) x = 0.03; (f) x = 0.04; (g) x = 0.05; and (h) x = 0.08. |
|
Fig. 3 Grain size distribution of CuCr1-xMgxO2 (0 ≤ x ≤ 0.08) samples |
|
Fig. 4 Grain quantity of MgCr2O4 phase. |
|
Fig. 5 ρ-T curves of CuCr1-xMgxO2 (0.01 ≤ x ≤ 0.08) polycrystals: (a) linear ordinate; (b) logarithmic ordinate. |
In this study, CuCr1-xMgxO2 (0 ≤ x ≤ 0.08) polycry- stalline ceramics were prepared using a solid-state reaction. And the effects of magnesium doping on lattice constant c, bulk density, average grain size, resistivity and associated second phase of CuCr1-xMgxO2 polycry- stalline ceramics were also discussed. It was found that the increase of magnesium content in CuCr1-xMgxO2 polycrystalline ceramics led to the decrease of activation energy and the growth of the second-phase MgCr2O4 grains, which in turn affected the size and number of CuCr1-xMgxO2 grains. Furthermore, the electrical con- ductivity of CuCr1-xMgxO2 polycrystalline ceramics was affected. The results show that CuCr0.6Mg0.4O2 polycrystalline ceramics had the smallest lattice constant c (17.083), the highest bulk density (4.367 g/cm3), the largest average grain size (15 μm), and the smallest resistivity (0.091 Ω·cm). This is one of the best results reported so far. It has important guiding significance for the development of transparent conductive oxides with high conductivity.
- 1. A. Maignan, C. Martin, R. Frésard, V. Eyert, E. Guilmeau, S. Hébert, M. Poienar, and D. Pelloquin, Solid State Commun. 149[23-24] (2009) 962-967.
-

- 2. M.A. Marquardt, N.A. Ashmore, and D.P. Cann, Thin Solid Films. 496[1] (2006) 146-156.
-
- 3. R.S. Yu and C.M. Wu, Appl. Sur. Sci. 282 (2013) 92-97.
-
- 4. I.C. Kaya, M.A. Sevindik, and H. Akyıldız, J. Mater. Sci., Mater. Electron. 27[3] (2016) 2404-2411.
-
- 5. T. Okuda, N. Jufuku, S. Hidaka, and N. Terad, Phys. Rev. B. 72[14] (2005) 1-5.
-
- 6. Y. Tang, M. Qin, Y. Hu, K. Cui, J. Zeng, L. Chen, and L. Yu, J. Asian Ceram. Soc. 8[2] (2020) 537-541.
-
- 7. T. Okuda, Y. Beppu, Y. Fujii, T. Onoe, N. Terada, and S. Miyasaka, Phys. Rev. B. 77[13] (2008) 134423.
-
- 8. H.Y. Chen, K.P. Chang, and C.H. Yang, Appl. Sur. Sci. 273 (2013) 324-329.
-
- 9. T.S. Tripathi and M. Ka.rppinen, Adv. Electron. Mater. 3[6] (2017) 160341.
-
- 10. Y. Ono, K. Satoh, T. Nozaki, and K. Tsuyoshi, Jpn. J. Appl. Phys. 46[3A] (2007) 1071–1075.
-
- 11. Y. Wang, L. Yu, J. Wang, L. Chen, W. Gao, X. Du, and L. Biao, Mater. Lett. 75 (2012) 39-41.
-
- 12. S.K. Kurtz and F.M.A. Carpay, J. Appl. Phys. 51[11] (1980) 5725-5744.
-
- 13. T. Senda and R.C. Bradt, J. Am. Chem. Soc. 73[1] (1990) 106-114.
-
- 14. M.A. Marquardt, N.A. Ashmore, and D.P. Cann, Thin Solid Films 496[1] (2006) 146-156.
-
- 15. W. Koshibae, K. Tsutsui, and S. Maekawa, Phys. Rev. B. 62[11] (2000) 6869-6872.
-
- 16. Q. Meng, S. Lu, S. Lu, Y. Xiang. and J. Sol-Gel, Sci. Technol. 63 (2012) 1-7.
-
- 17. J.F.H.L. Monteiro, F.C. Monteiro, A.R. Jurelo, and D.H. Mosca. Ceram. Int. 44[12] (2018) 14101-14107.
-
 This Article
-
2021; 22(5): 543-546
Published on Oct 31, 2021
- 10.36410/jcpr.2021.22.5.543
- Received on Mar 14, 2021
- Revised on Jul 21, 2021
- Accepted on Aug 28, 2021
Services
Shared
Correspondence to
- Lan Yu
-
Faculty of Material Science and Engineering, Kunming University of Science and Technology, Kunming, Yunnan, 650093, P.R. China
Tel : +18987169597 - E-mail: yulan000@hotmail.com
Clean-Energy Research Institute(CRI), Hanyang University, 222, Wangsimni-ro, Seongdong-gu, Seoul, 04763, Korea
E-mail: jcpr@hanyang.ac.kr