


- Effect of metal transfer modes on metallurgical properties of DSS FCAW joint
M. Palpandia,* and G. Magudeeswaranb
aAssistant Professor, Department of Mechanical Engineering, PSNA College of Engineering and Technology, Dindugal, Tamilnadu, India
bProfessor, Department of Mechanical Engineering, PSNA College of Engineering and Technology, Dindugal, Tamilnadu, India.This article is an open access article distributed under the terms of the Creative Commons Attribution Non-Commercial License (http://creativecommons.org/licenses/by-nc/4.0) which permits unrestricted non-commercial use, distribution, and reproduction in any medium, provided the original work is properly cited.
The present work involves the flux cored arc welding of a duplex stainless steel joint and the investigating for influences of the input welding transfer modes on the joint. The aim of this investigation is to identify the best input welding transfer mode and conditions to obtain a homogenous grain structure and defect free joint. The investigation incorporates experimental welding of the duplex stainless steel joint under constant current, pulsed current and surface tension transfer modes on the welding specimens. Subsequently the analyses of metallurgical characteristics and mechanical properties of the specimen were performed. Optical microscopy was utilized to characterize the weld metal identify grain boundaries, phase boundaries, inclusion distribution present in the specimen layer. The analysis revealed the microstructure of the weld region showing relative uniformity in the surface tension transfer mode in comparison to the constant current and pulsed current modes in the present investigation. The scanning electron micrograph with field emission analysis was utilized for investigating the presence of austenite and ferrite in the welded specimen. The results revealed sparsely distributed ferrite in the weld specimen with surface tension transfer mode when compared to specimens welded under constant and pulsed current mode resulting in higher concentration of austenite in the weld zone. Energy-dispersive X-ray analysis was performed to identify the element composition in the weld specimen. The surface tension transfer mode weld specimen exhibited similar composition of ferrite as with as specimens of constant and pulsed current mode. The X-ray diffraction analysis was performed to identify the element-chemical composition in the weld zone of the weld specimens. Electron back scatter diffraction analysis was made to discriminate the dissimilar phases by means of equating the inter-planar angles taken from the pattern of diffraction. The results obtained in terms of grain size and associated mechanical strength of the specimens, surface tension transfer mode yields better results
Keywords: Metal composites, Stainless steel, Ferrite, Austenite, Metallurgical characterization
In recent years, FCAW process is optimal for onsite or outdoor fabrication because fumes produced during welding have been found to be in higher volumes than GMAW process and thus creating an effective shield of the weld metal especially in stainless steel fabrication [1]. The use of FCAW process is more economical than GMAW process when self-shielded flux cored wires are used especially during onsite structural fabrication [2-4]. However, use of pulsed current (PC) for the FCAW process will have two-fold benefits of both pulsed current parameters and the flux-cored welding process for joining of structural materials. A very few investigations have been carried out in the above context in various aspects of joining of materials and there is no reported literature on DSS. Surface Tension Transfer (STT) is also another mode of metal transfer which gives less heat input compared to CC mode of metal transfer and STT also uses solid wire [5]. The equivalent proportions of austenite and ferrite in DSS results in the metal`s high resistance to chloride corrosion and can function at high temperatures upto 150 oC devoid of cracks [6, 7]. It is high strength and flexible charac- teristics make the DSS desirable in industries involved in harsh operating environments. The austenite-ferrite proportion undergoes changes during high temperatures of welding processes [8-10]. The loss in innate char- acteristics of the DSS during welding can be rectified by selection of appropriate welding technology and process conditions [11-13]. As industries explore for appropriate welding technologies, traditional gas welding practices are phased out with adoption of modern arc welding techniques. The electrode potential and carrying current conditions control the heat generated in the weld zone. Flux cored arc welding is a specialized welding technique that utilizes precise heat control procedures to produce sufficient weld joints. This technology is much favoured for its flexibility and ease of precise control enabling high quality welds devoid of defects and failure criteria. The type of current control decides the modes of operation and the modes at which FCAW is used are the Constant Current (CC), Pulsed Current (PC), and Surface Tension Transfer (STT) modes. The novel approach of the present work involves welding of DSS by FCAW with CC, PC and STT metal transfer modes followed by investigation of metallurgical, mechanical (micro-hardness and tensile) and corrosion properties.
Materials
Duplex Stainless Steel (DSS) has superior properties like corrosion resistance, high weld ability and high mechanical strength. It also contains a high amount of chromium, which increases its resistance to corrosion. It is also very cost effective when compared to other steels with similar properties like 904L stainless steel and hence DSS will be used for the welding process in this work. DSS 2205, also known as SAF 2205 (14) is a type of duplex stainless steel developed by steel manufacturing company, Sandvik (registered trademark Sandvik 2017). DSS 2205 has similar properties to 904L stainless steel. The composition of the alloy has been given in Table 1.
Methods
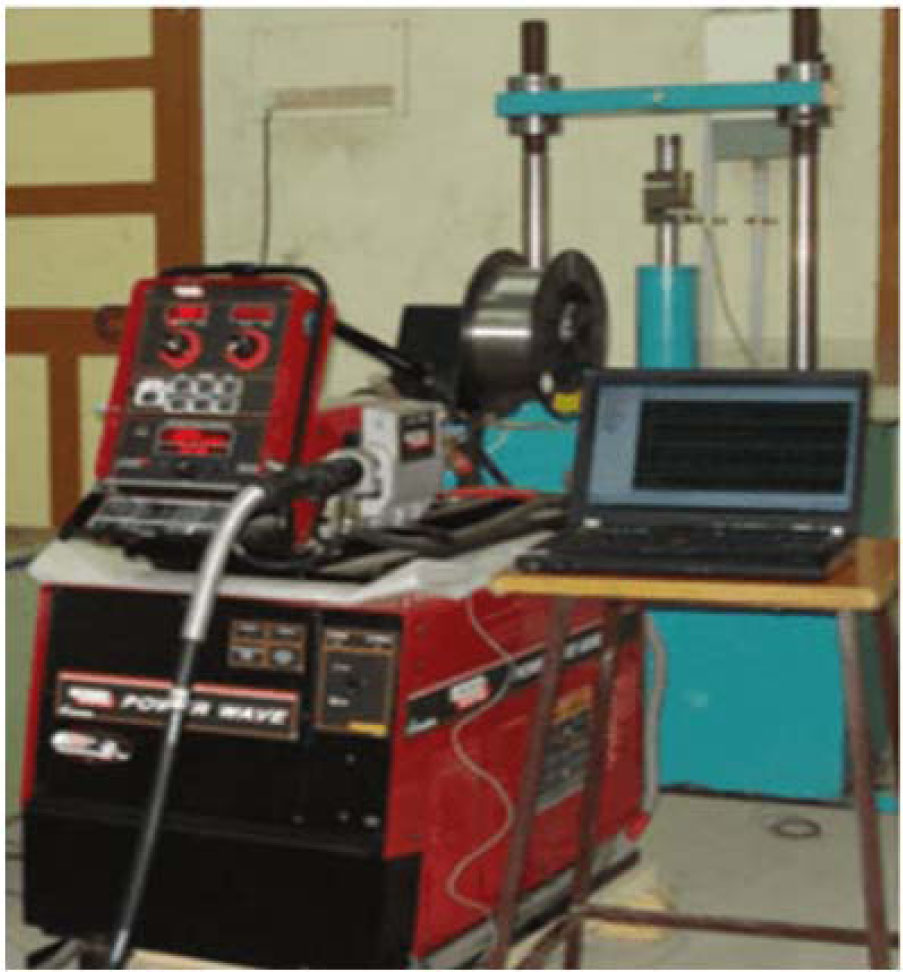
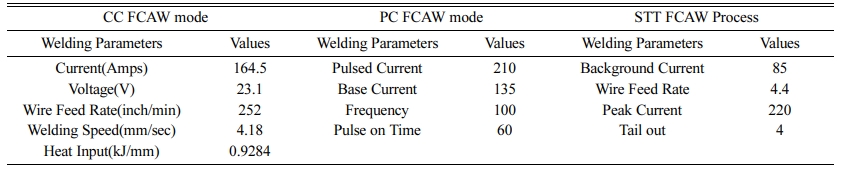
Flux Cored Arc welding operates in several modes according to the requirements and applications and precise heat control is possible with combining new kind of advanced waveform controlled welding technology. The power source selected for the welding process is Lincoln Electric Wave 455M/STT (Fig. 1). This system offers the desired high speed and is capable of con- trolling the complex waveform modes through digital controlled switches. The three different modes used are; Constant Current (CC), Pulsed Current (PC) and Surface Tension Transfer (STT) modes. The core wire is directed to the welding gun using the wire feeder in an automatic manner. The measurements corresponding to the metal transfer modes are instantaneous; the digital readouts display the readings promptly. The Flux Cored Arc Welding (FCAW) exhibits improved output in comparison to other existing methods of fusion welding associated with DSS joints (Majid & Shahi 2018). Thus FCAW is used to make the joints of DSS following CC, PC and STT modes. The welding parameters observed under the three modes are detailed in Table 2.
Metallurgical Characterization
Metallurgical Characterization of the welded joint before and after welding process, the cross-sectional specimens were ground using a series of abrasive papers with 280 grit to 2000 grit and were polished to a mirror finish using diamond pastes (particle sizes of 2.5 and 0.5 μm). For differentiation between ferrite and austenite by Optical Microscopy, the polished specimens were chemically etched for a time of 10 seconds using Keller`s reagent. Furthermore, to reveal the secondary austenite (γ2), specifically intergranular γ2, the polished specimens were electro-chemically etched in 10 wt.% oxalic acid solution for 10-20 seconds.
Ferrite Measurement
The Ferritoscope is utilized so as to quantify the amount of ferrite as Ferrite Number (FN) measurements in 10 points selected uniformly on the weld metal along the 150 mm length weld seam. Measurements of ferrite number were executed by the following ASME Section II C (SFA 5.4/5.4M) standard. As a percentage from phase and volume analysis, the amount of ferrite was also measured which was done by quantitative image analyzing method as per ASTM E562 and E1245.The ferrite percentage is calculated as a product of FN and 0.7 for the duplex stainless steel with 22% chromium. This conversion is needed for analyzing the phase balance with respect to ferrite and austenite proportion.
|
Fig. 1 Experimental Setup. |

Optical microscopic analysis
OM analysis of base metal
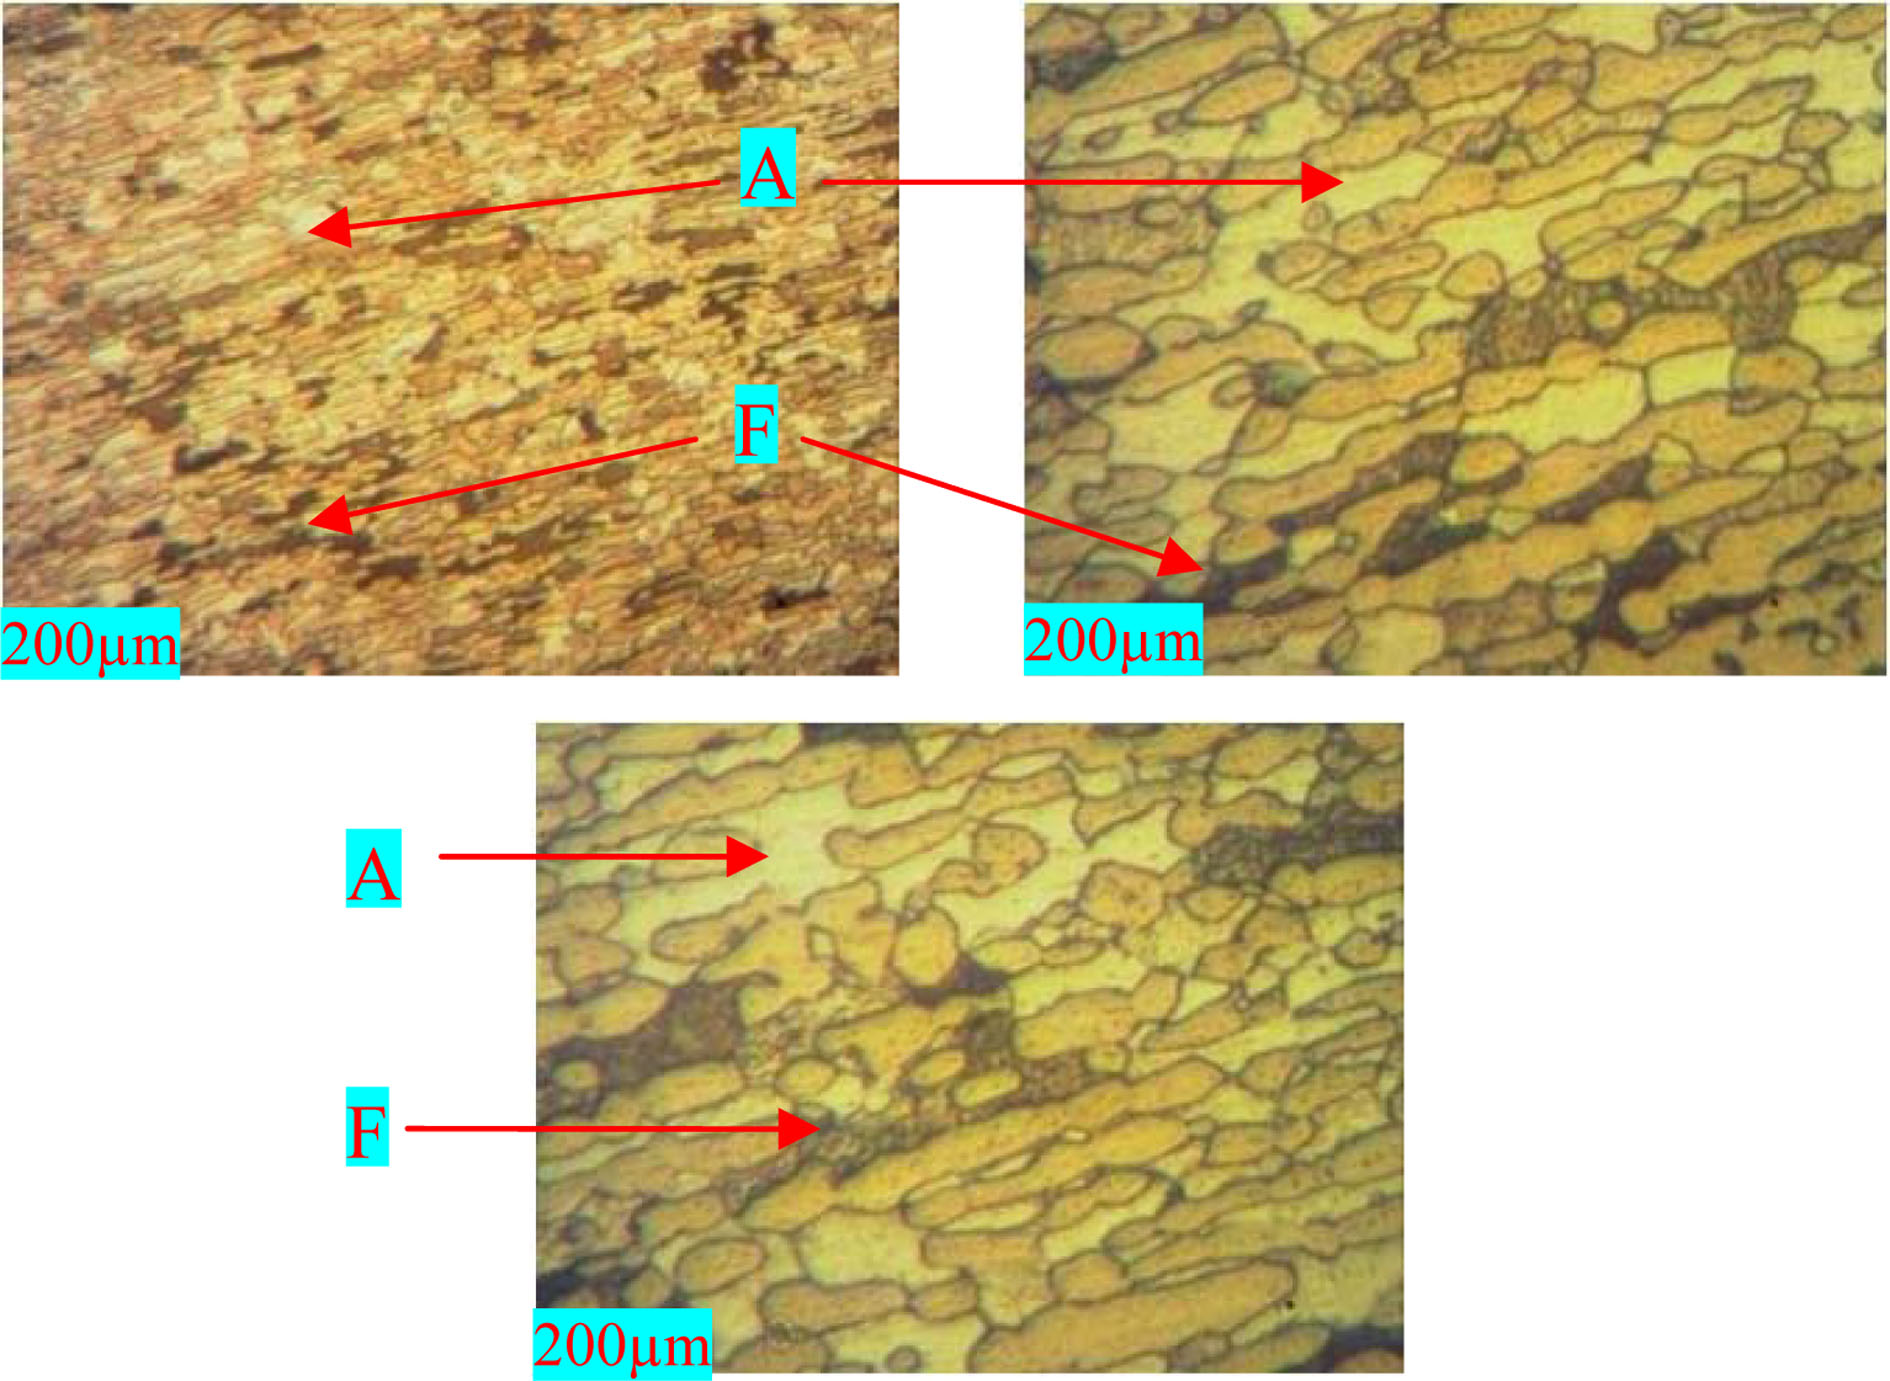
The microstructure of the DSS base metal contained alternating ferrite and austenite bands as inferred from Fig. 2(a-c). The images show the ferrite and austenite presence in the microstructure represented by dark and light regions respectively.. The analysis was carried out characterize the base metal structure for revealing grain boundaries, phase boundaries, inclusion distribution present in the specimen layer. The microstructural in- vestigations were made on the base metal specimen at varying magnification levels of 50´, 100´ and 200´. The presence of Austenite and ferrite phases on the base metal is observed. This is observed for all the magnification levels that were investigated in the present work. It can be inferred from the observation that the distribution of the ferrite and austenite content on the base metal of duplex stainless steel (DSS) evenly match each other thereby contributing two halves of the entire specimen composition.
OM Analysis of welded joints
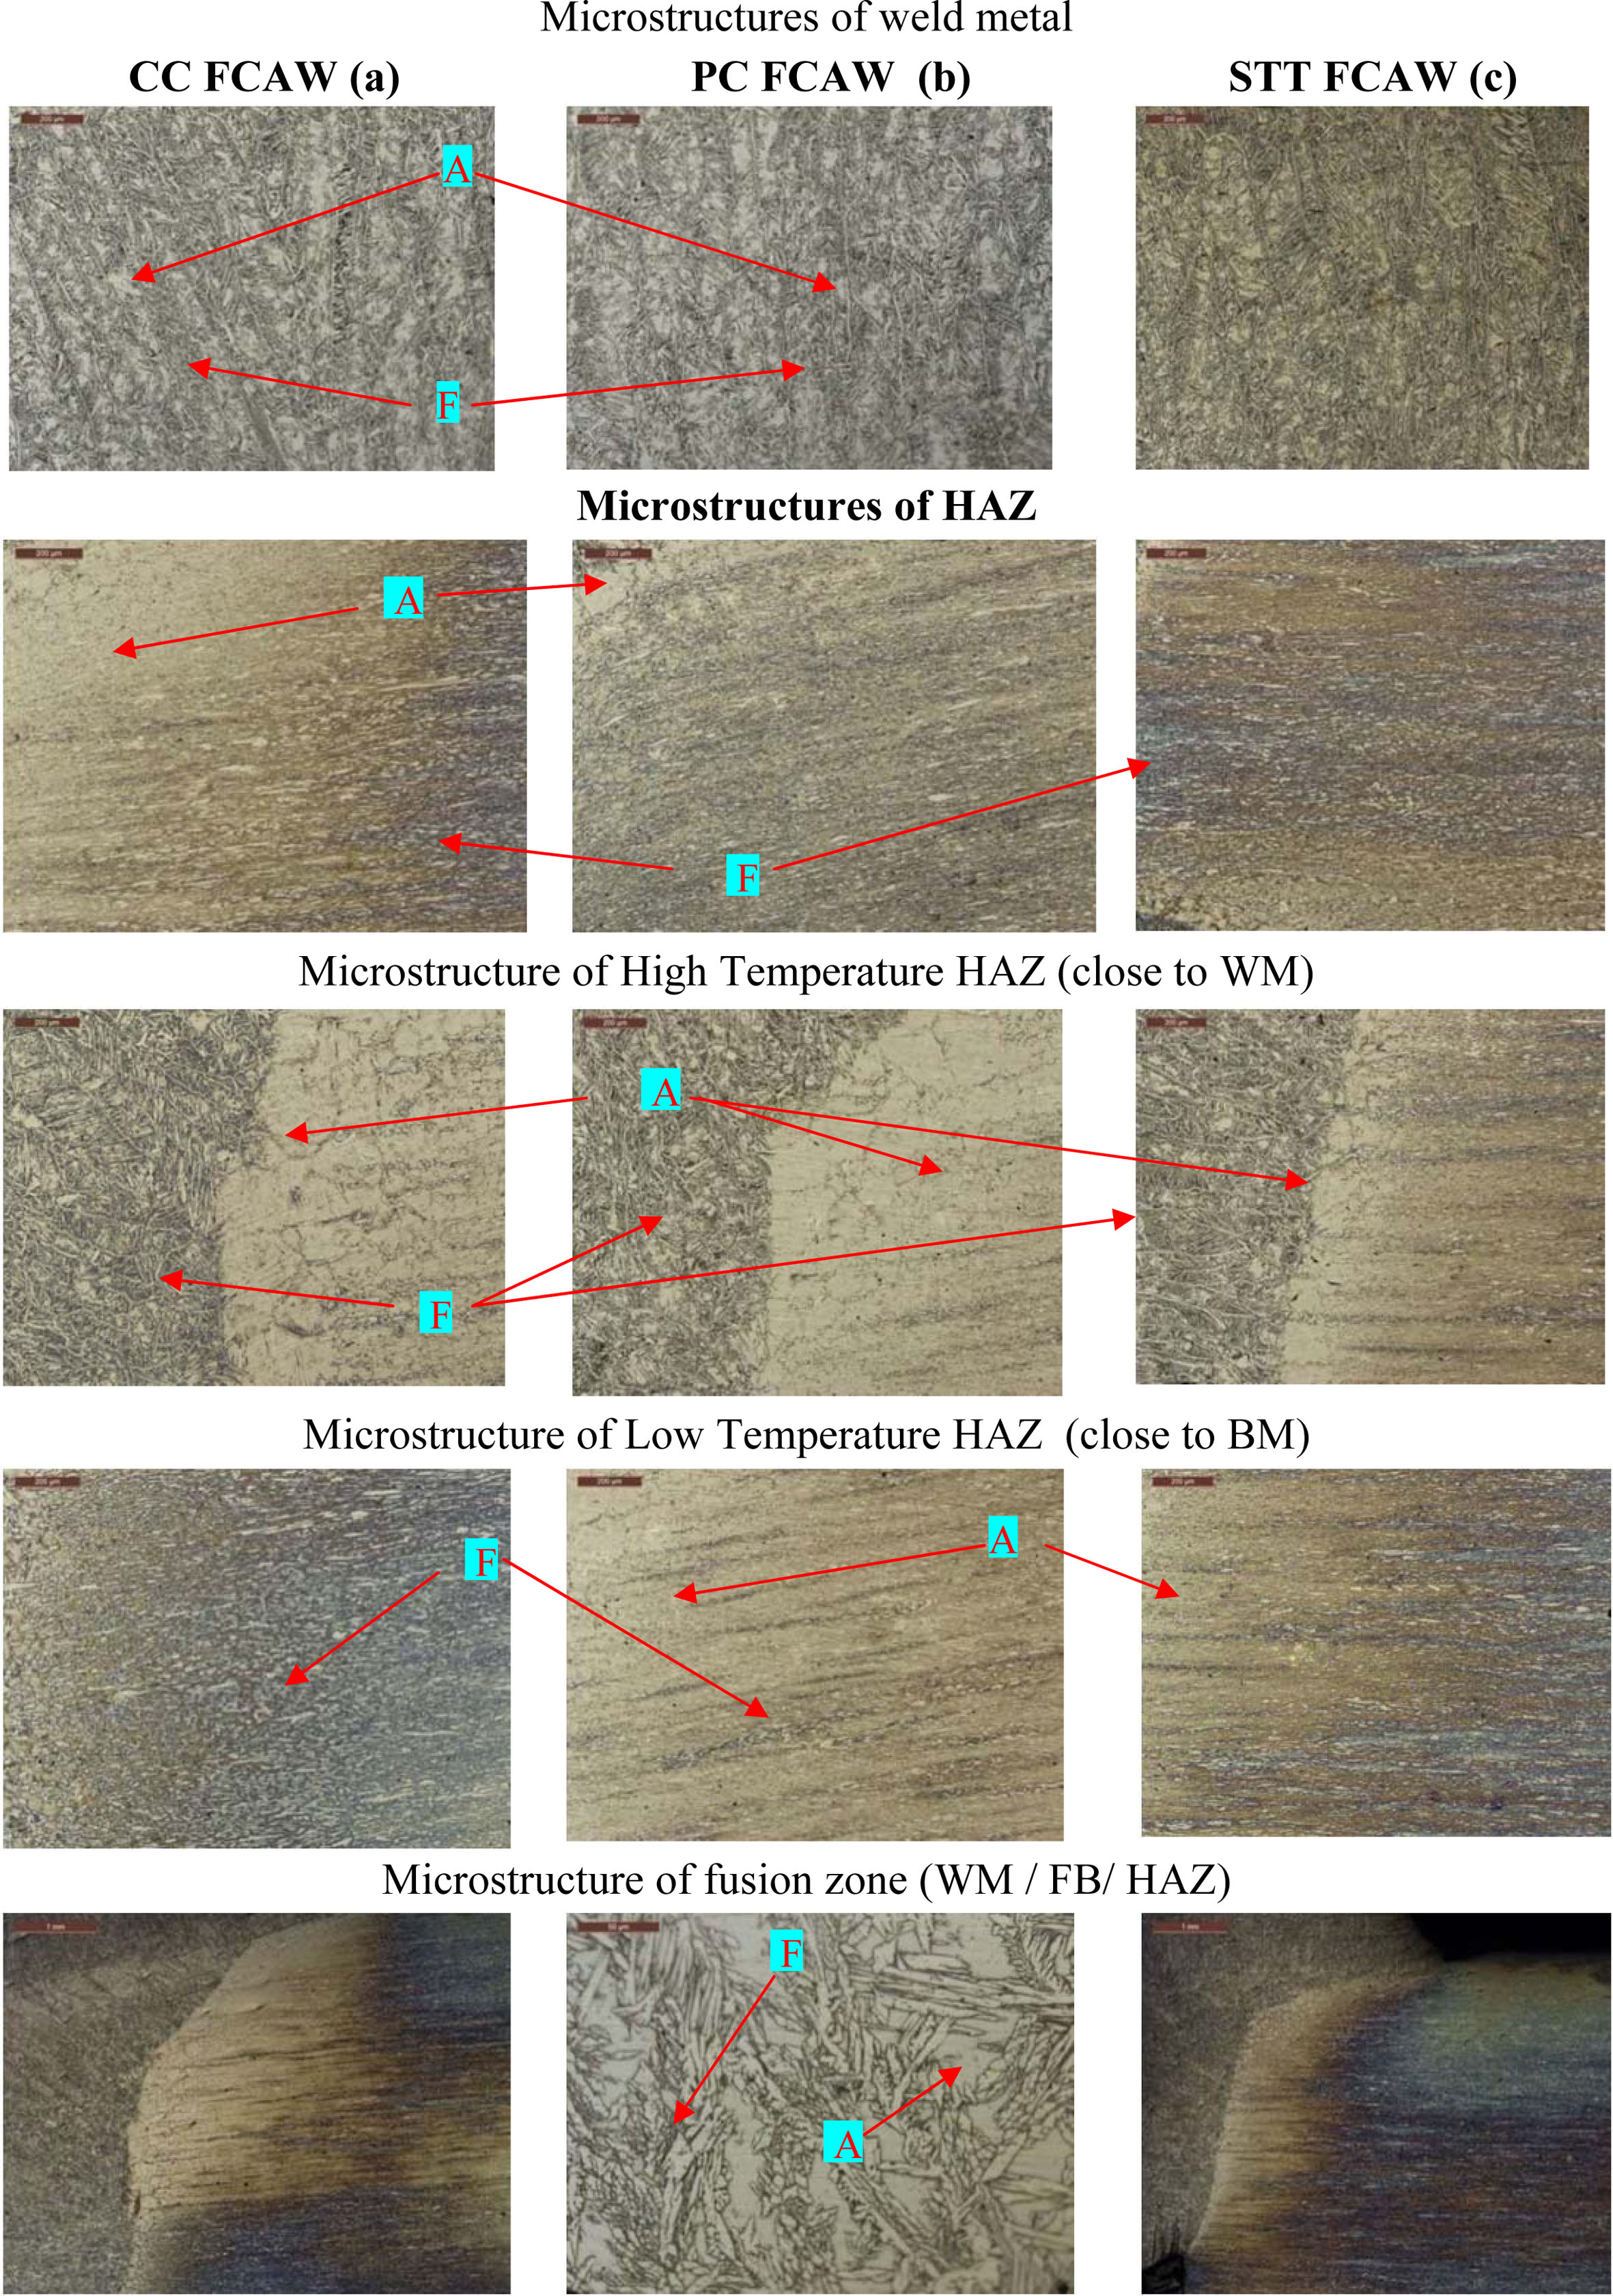
The OM analysis is performed to investigate the phase and microstructure analysis of the weld joint (Fig. 3). The analysis is done separately for each specimen under these conditions so as to observe the effect of these conditions on the (WZ). Thus the OM analysis was done to obtain information on the following zones of the specimens: Microstructure of base and Weld Metal (WM), Microstructure of Heat Affected Zone (HAZ), Microstructure of High Temperature HAZ (close to WM), Microstructure of Low Temperature HAZ (close to BM), Microstructure of fusion zone (WM/FB/HAZ). The different modes of welding conditions offer different heat input during welding process due to the varying electric current intensity of the modes. The uniformity thus existing in the base metal and weld metal gradually changes to states depending on the temperature which it receives during the process of welding. The increase in temperature in the weld zone leads to phase combination in the metal and disappearance of few metal phases. The microstruc- ture of the weld region shows relative uniformity in the STT process in comparison to the CC and PC process in the present investigation.
The width of the weld is 1.5 mm in approximation, thus the HAZ was hardly recognizable in OM. Severe phase formations are observed in HAZ near weld zone and this may be due to the increased temperature which is sufficient for phase formation in the weld zone. The phase formation is seen with distinctness in each zone by viewing the image of fusion zone. For the HAZ close to weld metal, it is noticed that the constant current mode is highly prone to cracking than the other two methods. The possibility is comparatively lesser in case of surface tension transfer mode. The chance for crack is there in pulsed current mode but it is not as predominant as in the case of constant current mode.
SEM and FESEM analysis of ferrite formation in weld joints
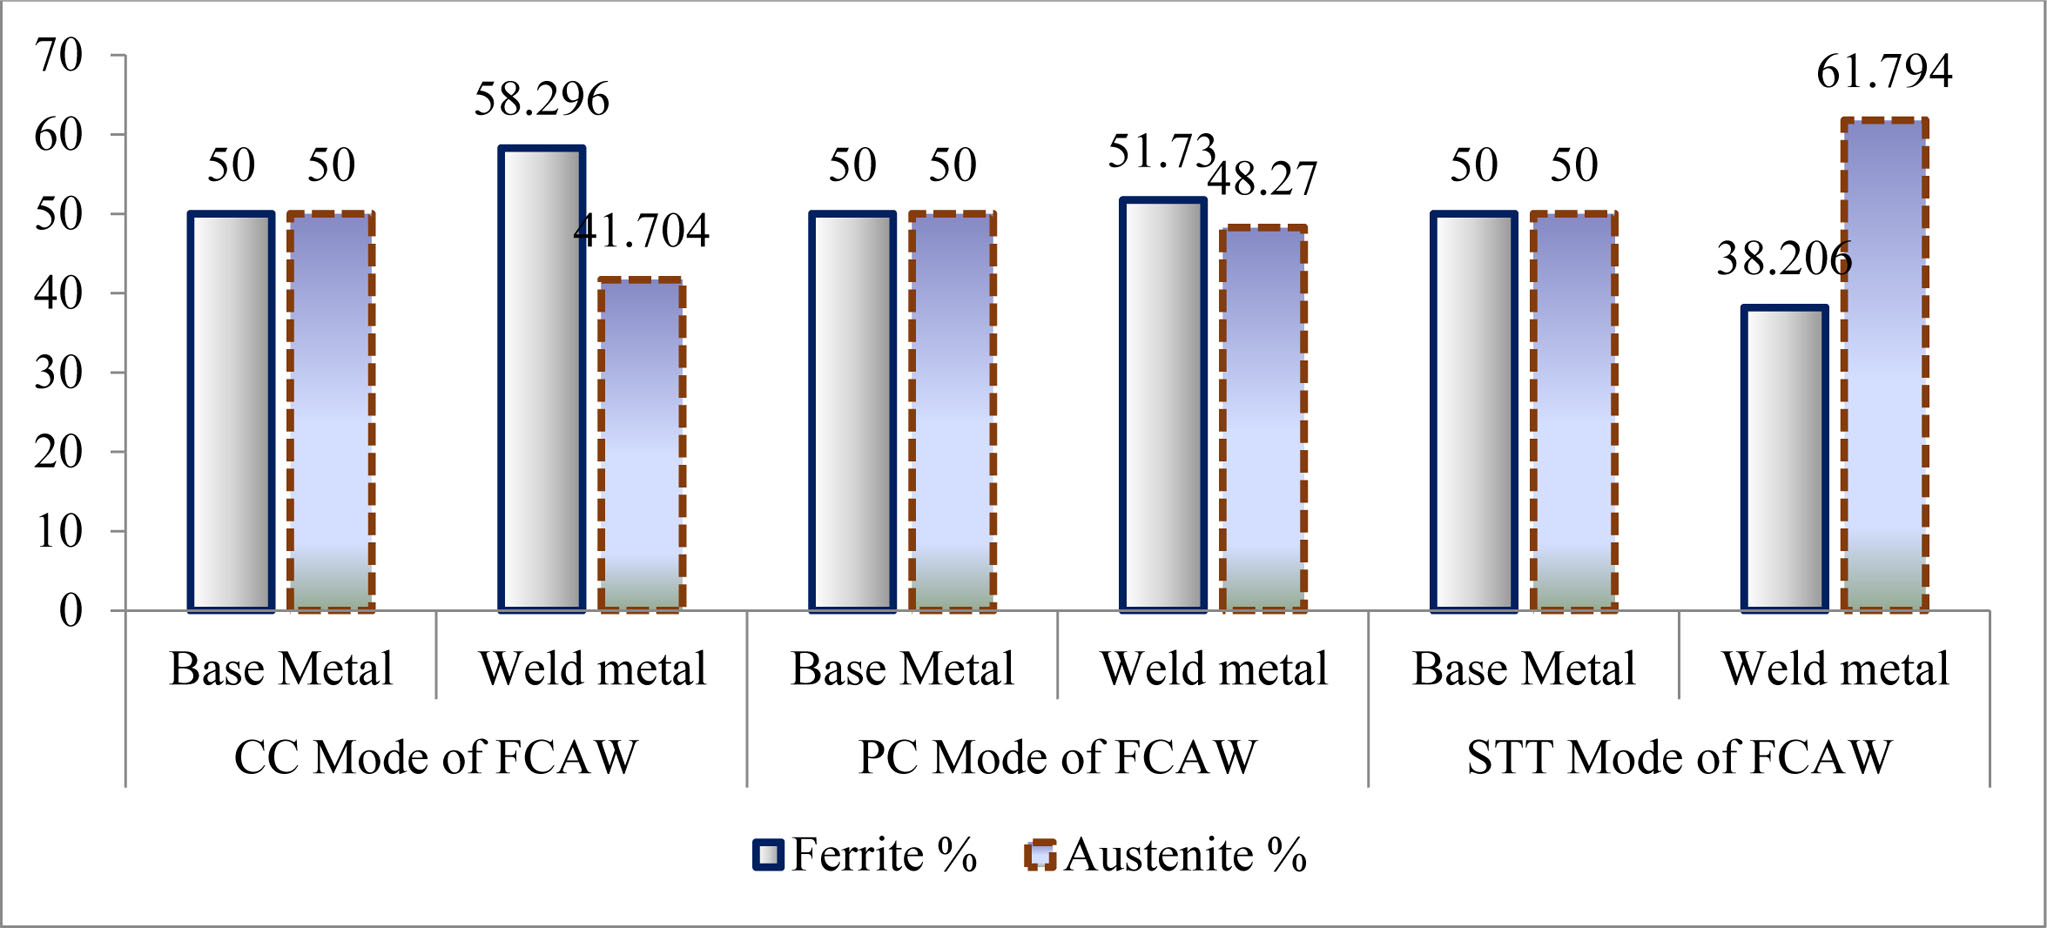
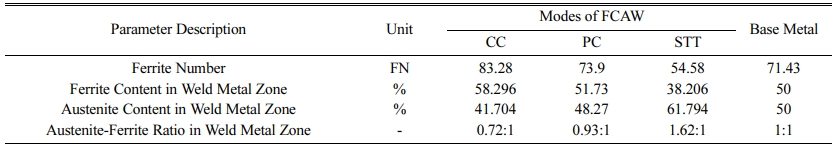
The SEM and Field Emission SEM analysis are made for investigation of the ferrite and austenite content in the FCAW DSS welded specimen. The analysis is done for obtaining the surface morphology of the weld zone specimen welded under three current modes (CC, PC and STT). The observations are made in varying magnifications in accordance for better inference. The ferrite percentage is calculated as a product of FN and 0.7 for the duplex stainless steel with 22% chromium. This conversion is needed for analysing the phase balance with respect to ferrite and austenite proportion. The ferrite number and the corresponding ferrite per- centage for three modes are compared in Table 3. Fig. 4 graphically represents the trend of the ferrite distribution in the FCAW welded specimen. The corresponding graphical representation is given in. As can be observed from the table the ferrite content distribution between the three modes varies considerably.
The ferrite content in the base metal is equal to the austenite content forming the rest of the microstructure. It is observed that the ferrite percentage of 30 to 60% is maintained in the WZ of all the considered modes. The ferrite content in CC mode is 58.296% greater than PC mode and STT mode. Increasing the heat input further may initiate crack in CC mode. A proper cooling rate is needed for austenite formation. However the ferrite content percentage in STT mode is less than PC mode, with PC mode having ferrite content of 51.73% in the WZ. Thus the ratio is maintained near to 1:1 in case of pulsed current mode. In the case of STT mode the ferrite content is very much lower than the austenite. A further variation of heat cycle may reduce the corrosion resistance in STT mode. Thus, in terms of ferrite measurement and corresponding ratio measurement, the pulsed current mode provides better results.
Effect of ferrite measurement in CC, PC and STT mode
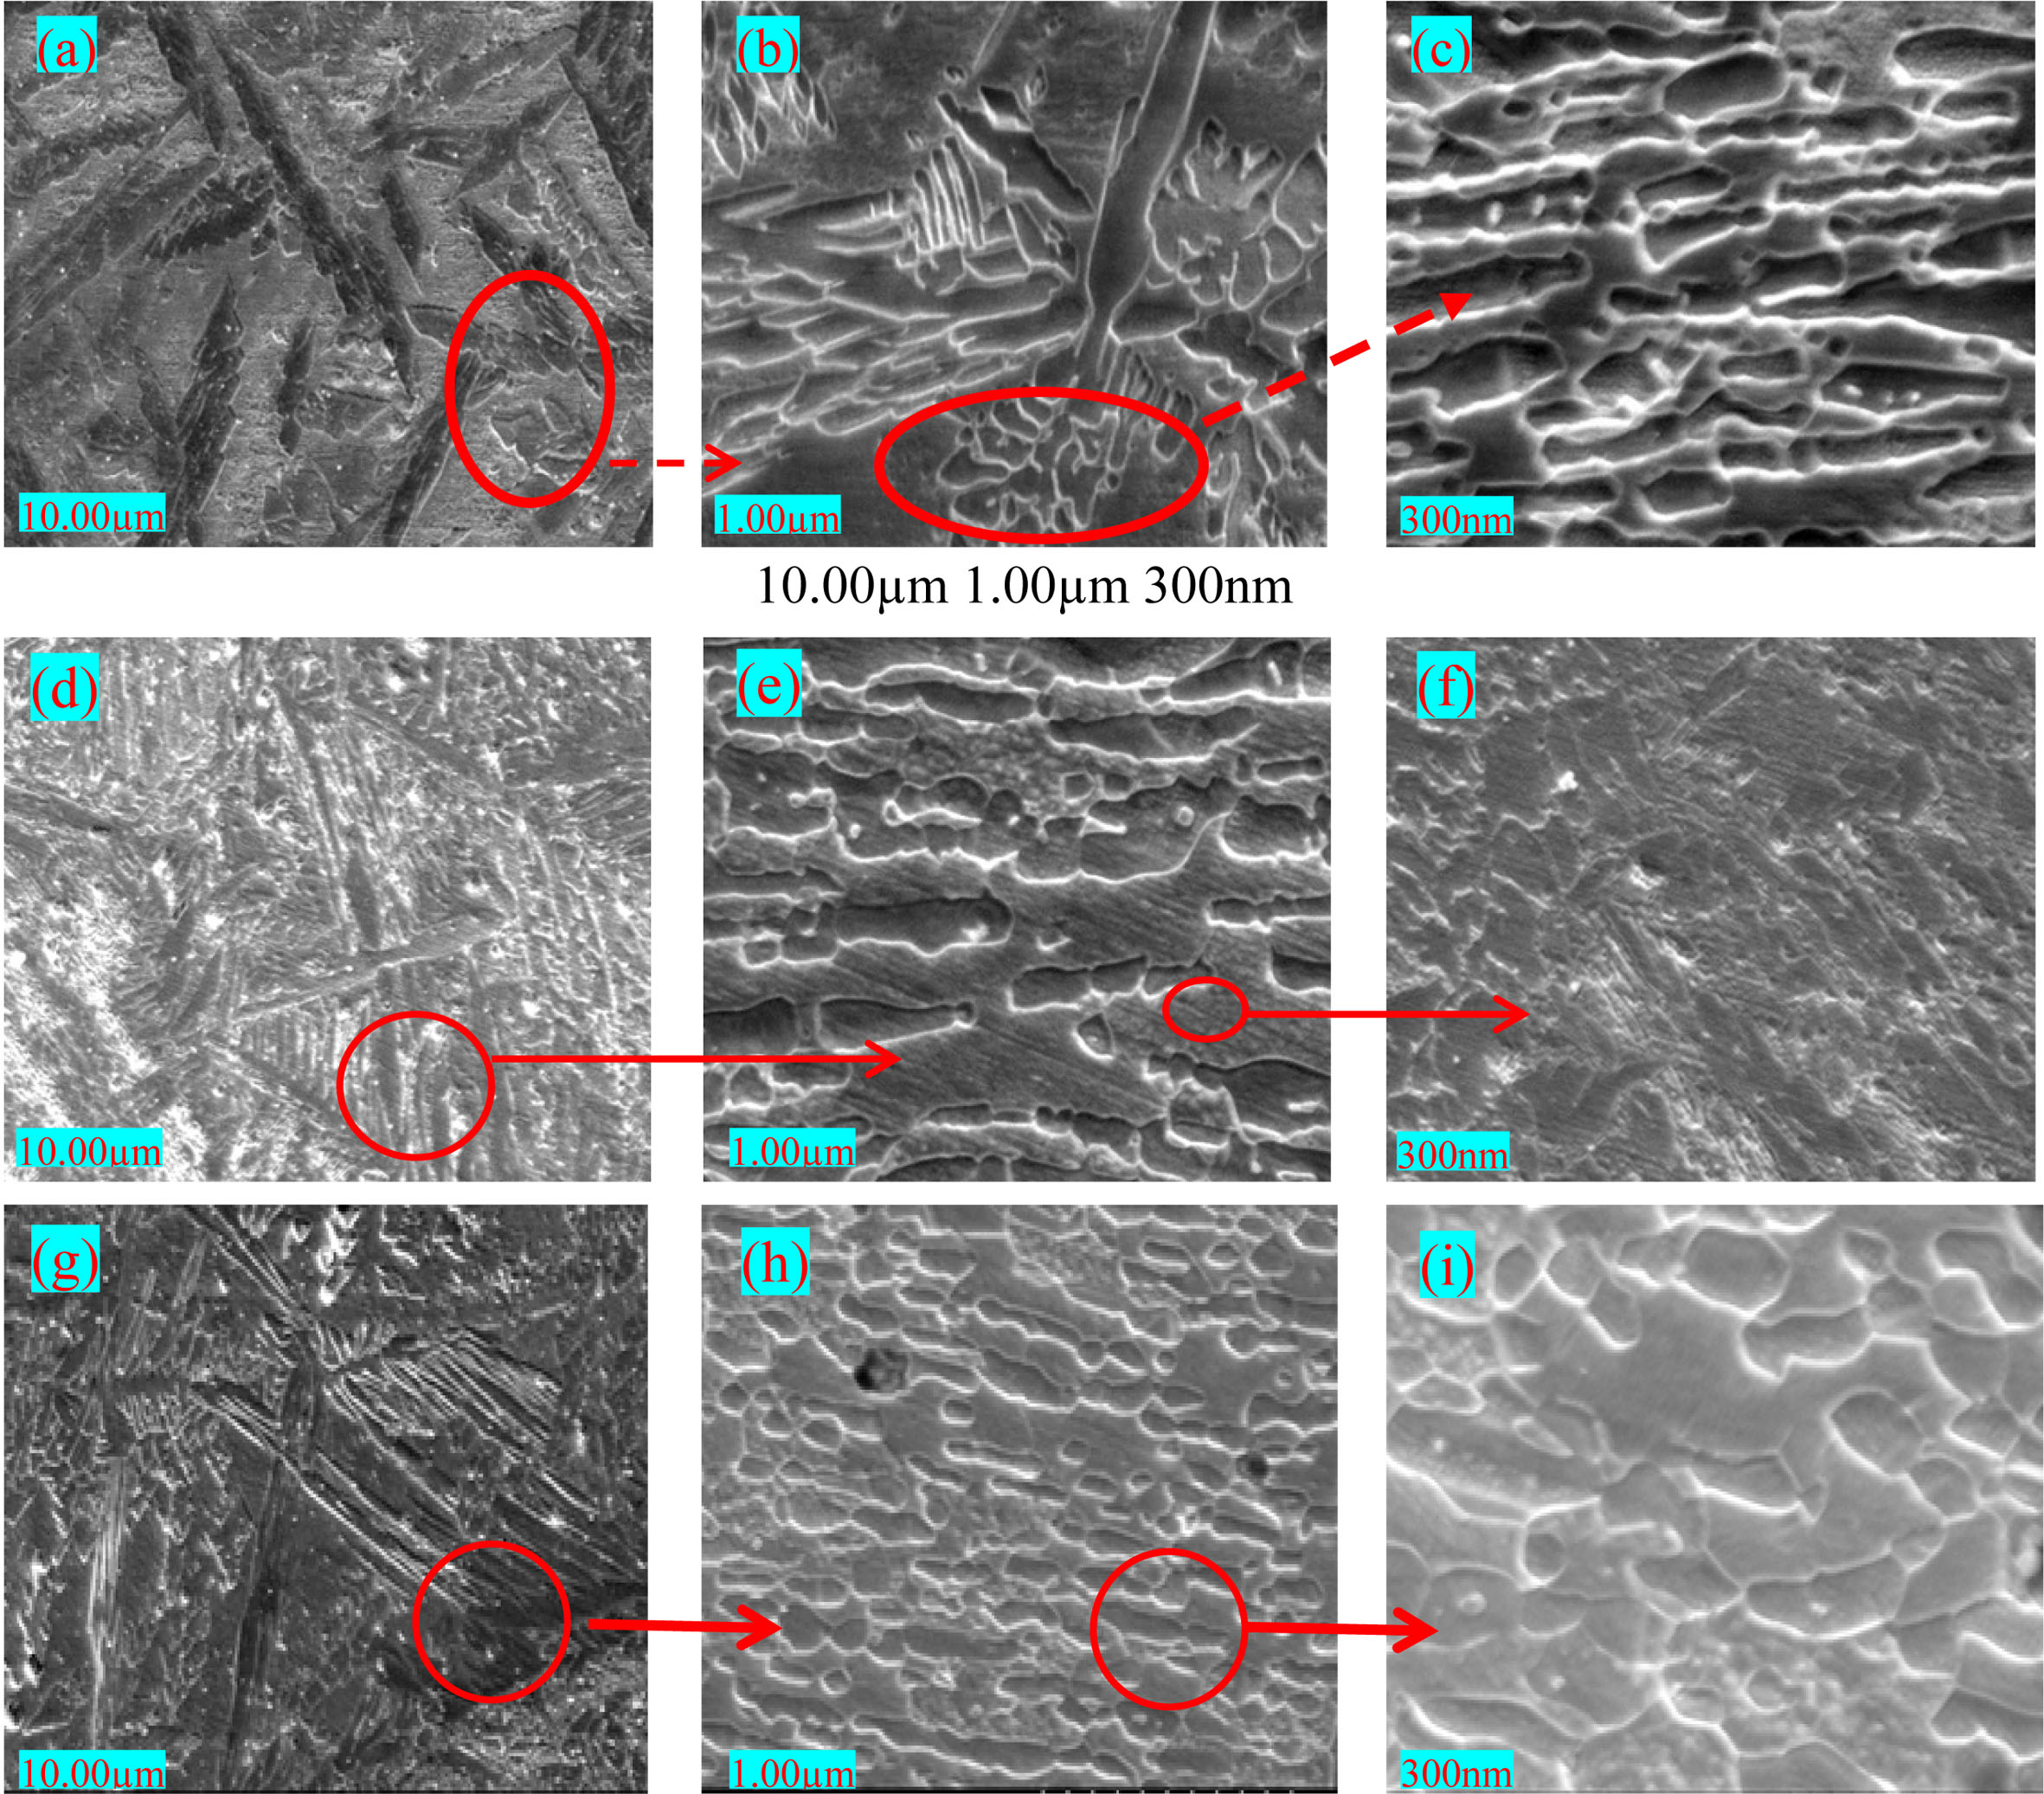
As can be observed from the Fig. 5(a-c), the FCAW weld specimen under CC mode is subjected to FESEM analysis for obtain surface morphology results detailing the ferrite concentration in the WZ. The observations are made in magnifications of the order of 500´, 1,000´ and 2,000´. It can be observed that ferrite is much more concentrated in the WZ due to high heat generated in CC mode as observed in Table 3. As inferred from the Fig. 5(d-f), the FCAW weld specimen under PC mode is analysed by FESEM method to obtain surface morphology results detailing the ferrite concentration in the WZ. The analysis is made in the magnifications of 500´, 1,000´ and 2,000´. It can be observed that ferrite is evenly distributed in the WZ due to the stepped high low current combination produced in the PC mode and the subsequent high generated in the WZ. This observation validates the result obtained using ferritoscope analysis in Table 3 showing that specimen under PC mode welding condition has lesser ferrite content than the specimen welded under CC mode condition.
As inferred from the Fig. 5(g-h), the FCAW specimen under SST mode is analysed by FESEM method to observe the ferrite and austenite content concentration. It can be observed that the ferrite is sparsely distribution in comparison to specimens welded under CC and PC conditions. This means more concentration of austenite leading to lesser concentration of ferrite in the WZ. This observation also falls in accordance with the observed values from Table 3.
SEM and EDAX analysis of CC, PC and STT mode
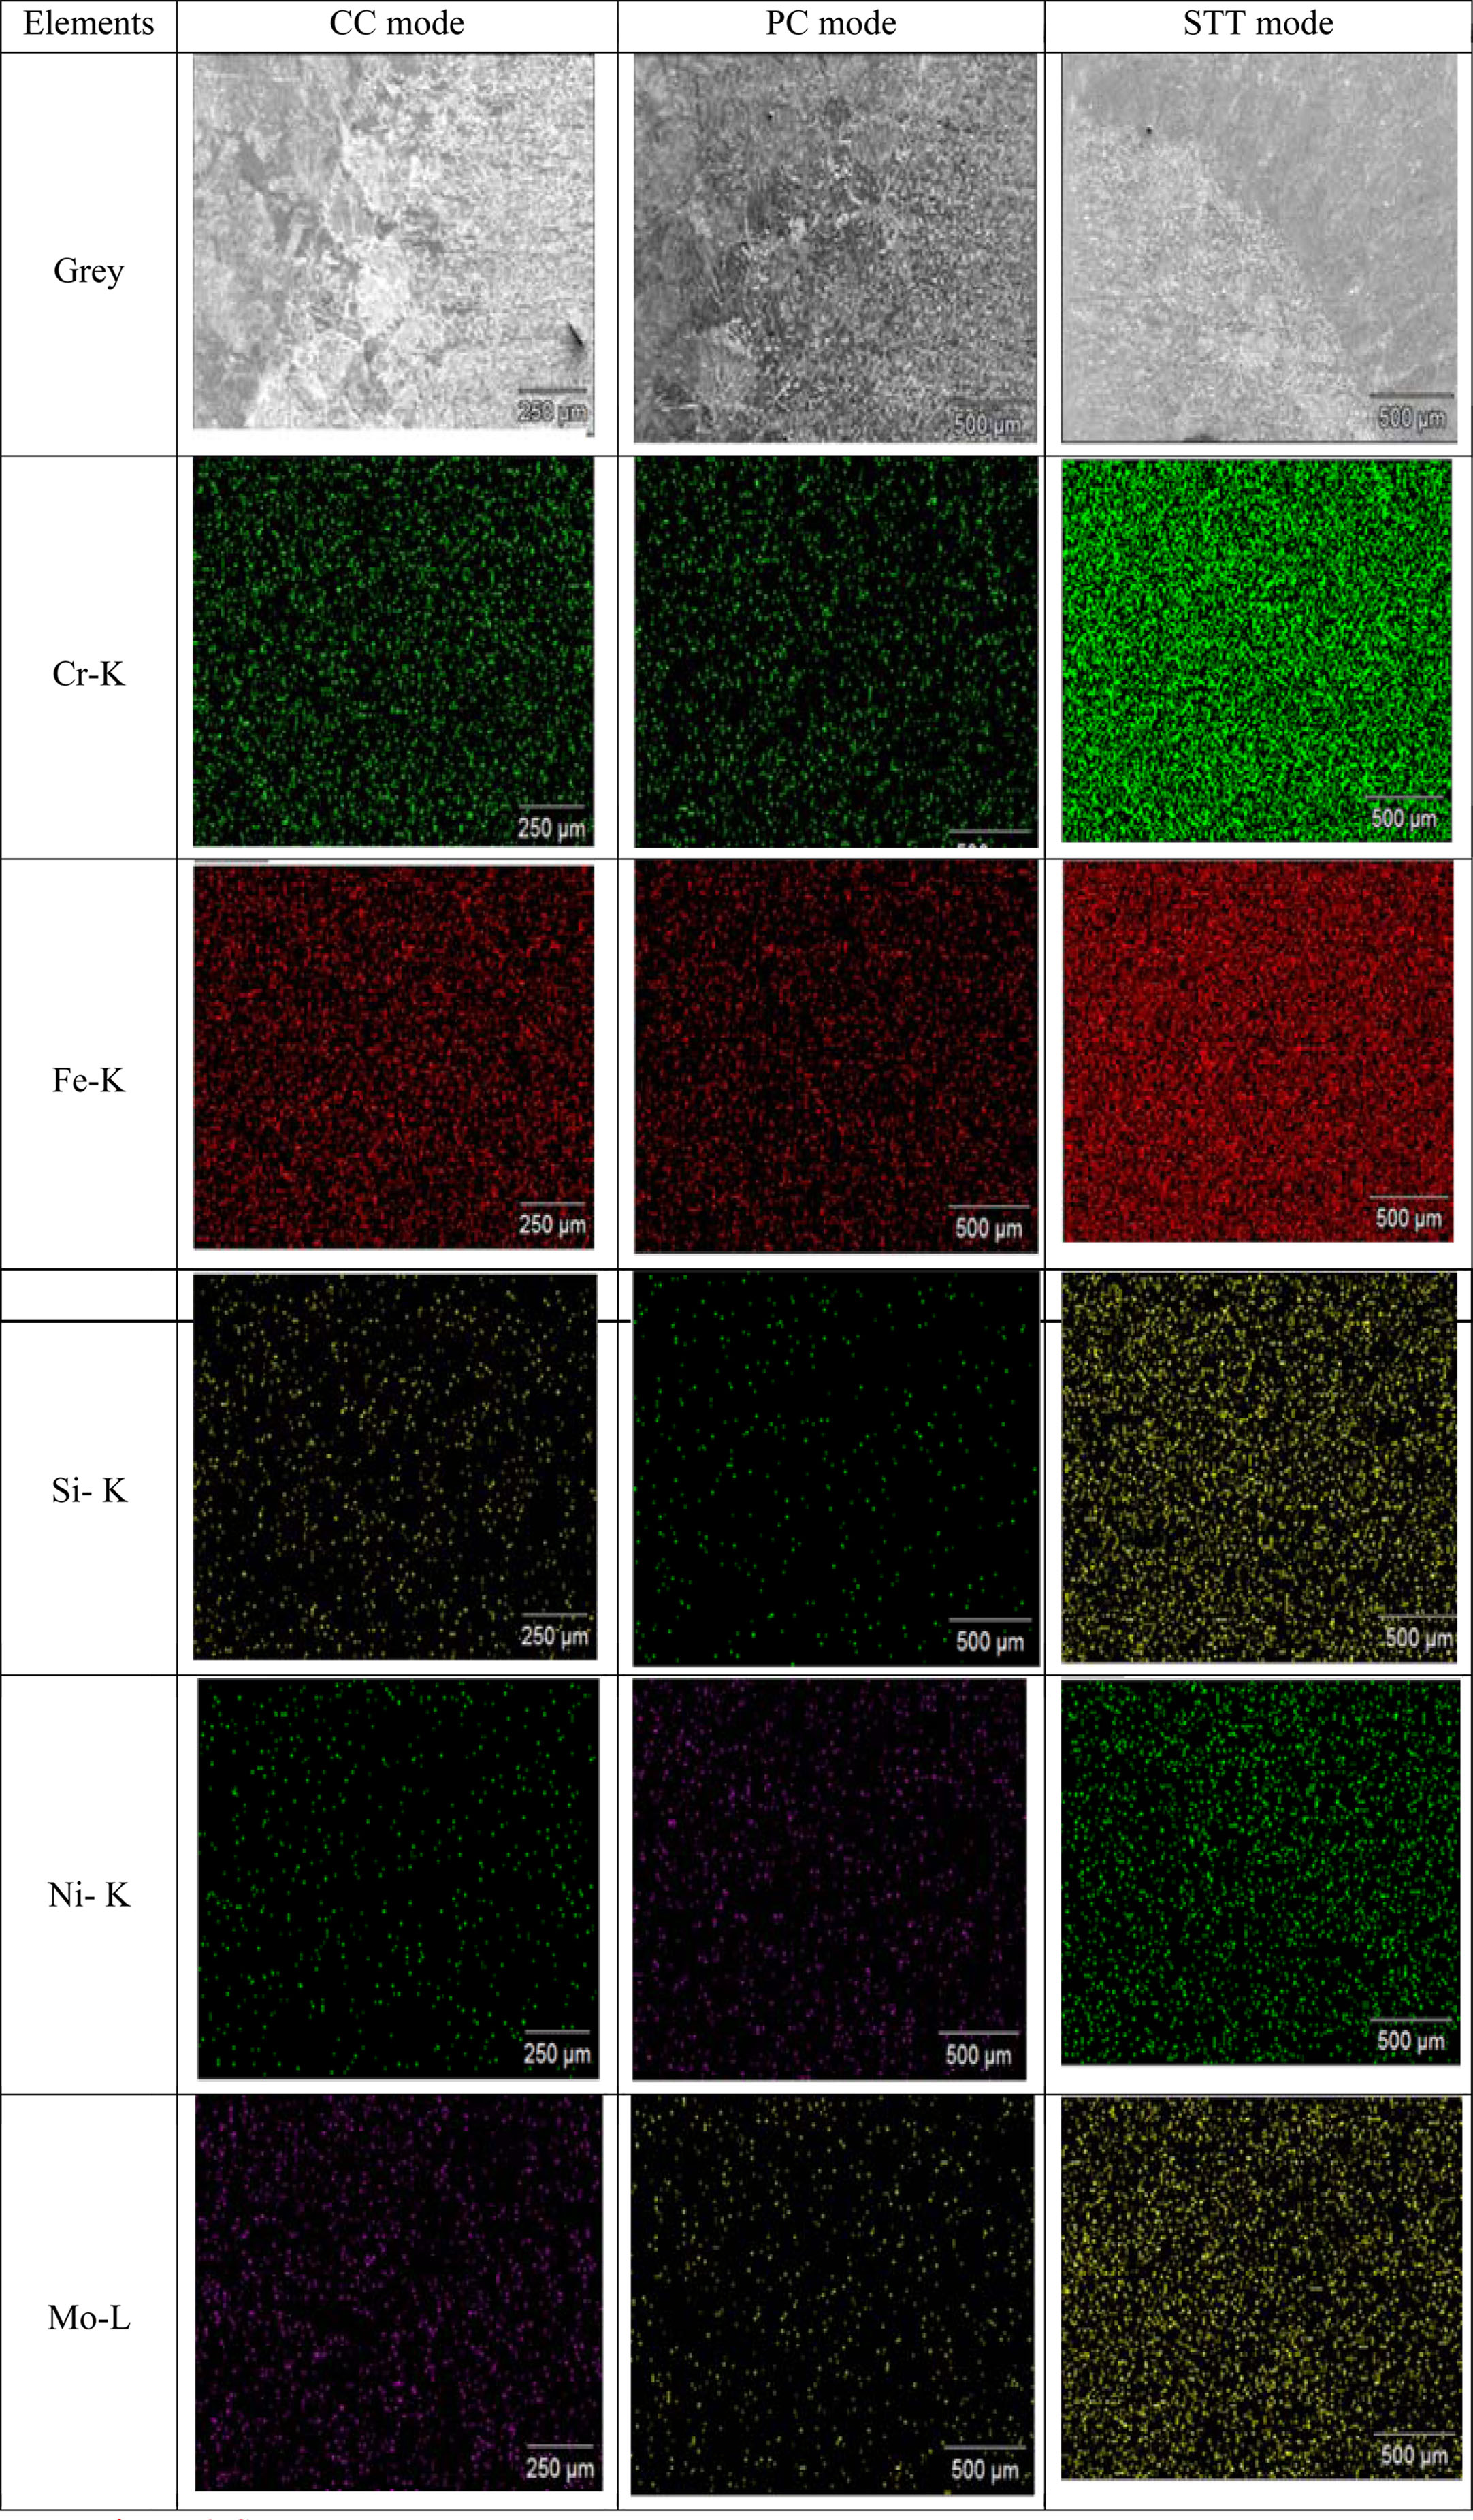
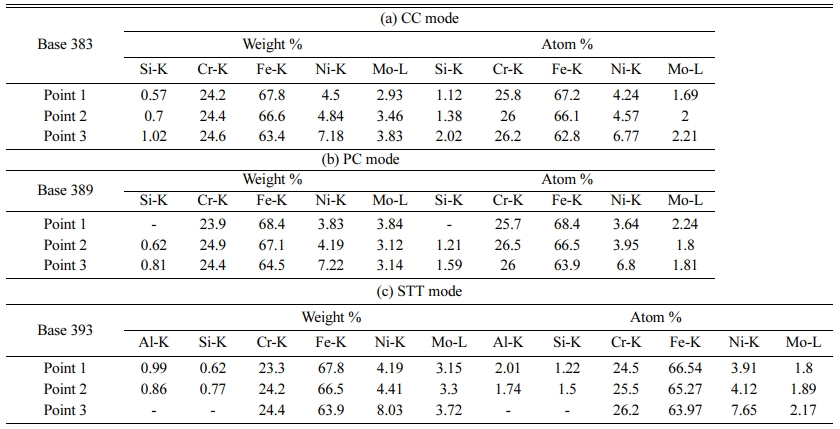
The FESEM analysis, EDAX analysis is carried out to identify the material composition on the three points of interest in the FCA welded specimen. The EDAX analysis imagery of the specimen is can be seen from Fig. 6. The concentration of ferrite and austenite in the WZ was identified along with the composition of other various materials present in the specimen. Each specimen from different welding mode conditions were analysed and tabulated in Table 4. It shows the excess accumulation of chromium that may lead to depletion of nearby region.
The EDAX analysis imagery of the specimen is can be seen from Fig. 6. The concentration of ferrite, austenite and other composition elements in the WZ was identified along with the composition of other various materials present in the specimen. The element details for all the three points is given in Table 4. It shows the excess accumulation of chromium that may lead to depletion of nearby region. A similar kind of increased value of chromium is observed. The element distribution in pulsed current mode is shown in Fig. 6. The EDAX analysis for the FCAW specimen welded under STT mode condition revealed similar composition of ferrite as seen on EDAX analysis from CC and PC mode specimens. This holds together the fact that concentration of ferrite in the WZ is the influencing factor. The element details for all the three points is given in Table 4. An identical observation of increased value of chromium is noticed. The element distribution in surface tension transfer mode is shown in Fig. 6.
X-ray diffraction analysis (XRD)
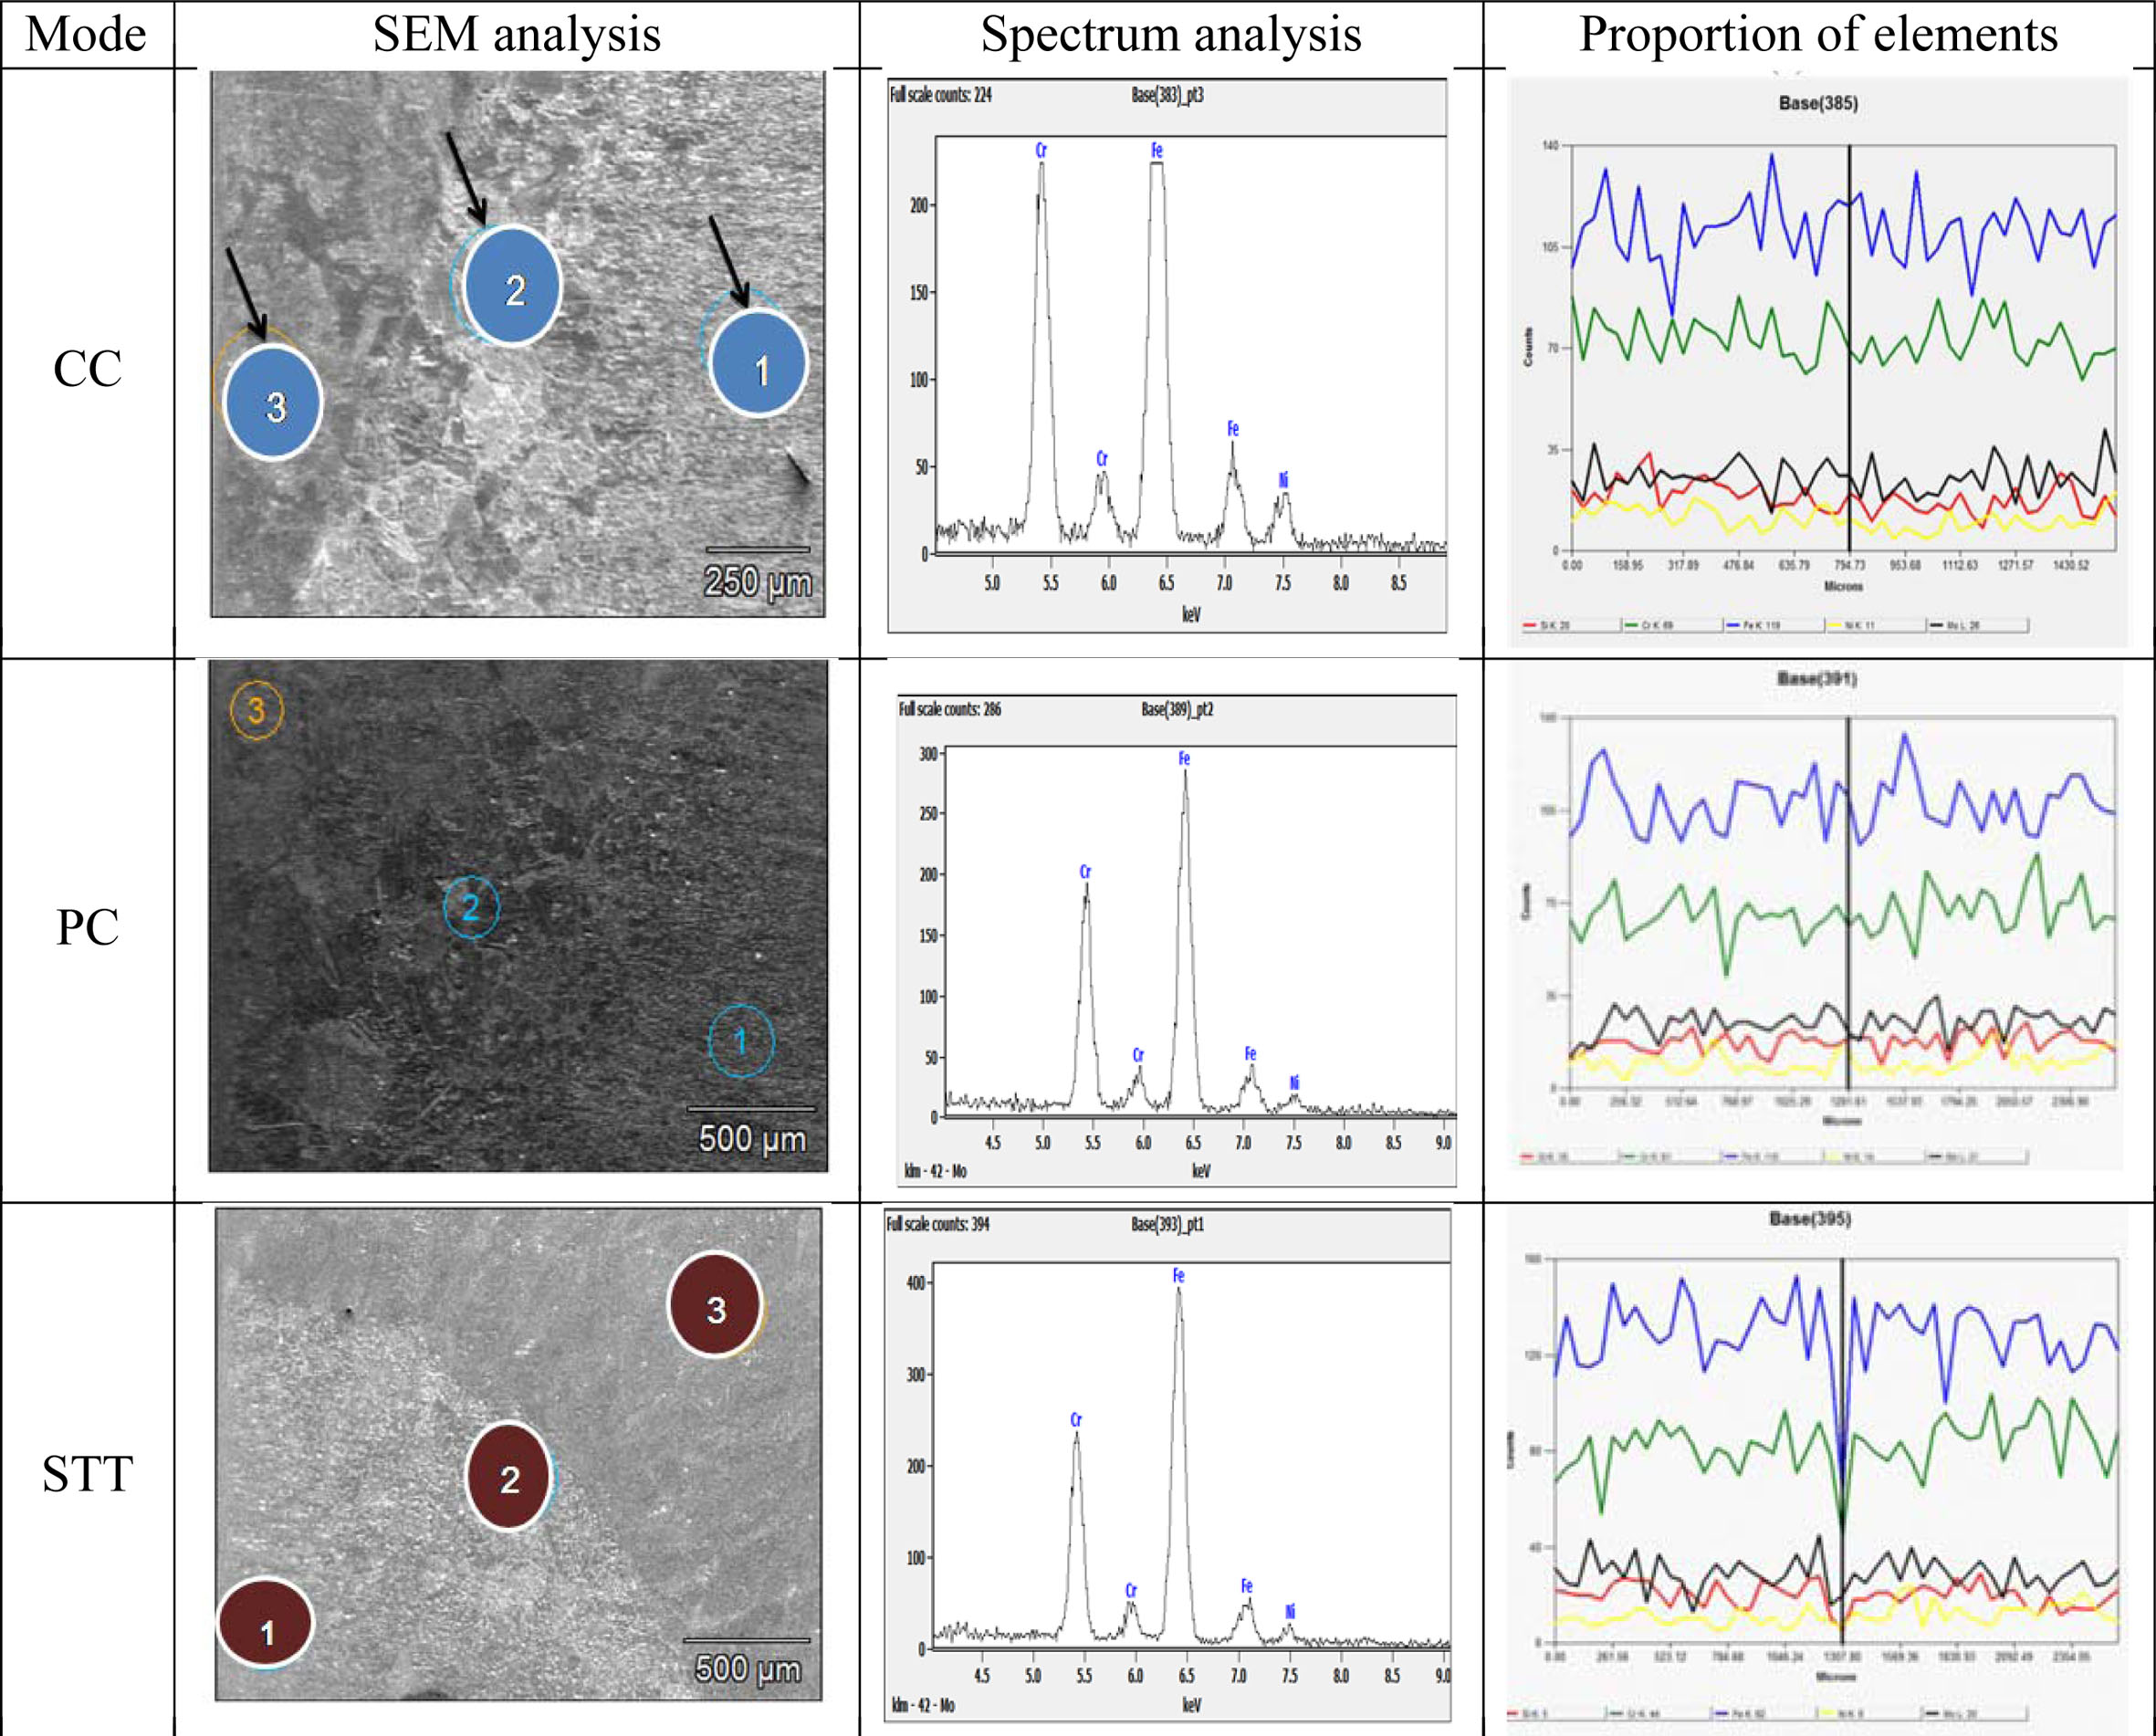
The XRD analysis is used to analyse the element-chemical composition of the WZ of the FCAW specimen. The analysis, similar to those above is done for different specimens welded at CC, PC and STT FCA welding modes. The analysis is done at three different points in the specimen at the WZ.The XRD analysis is performed on the CC mode specimen, which revealed the formation of phases detected three different points inferred from Fig. 7. The intensity variation of elements with respect to keV is shown in the graph for point 3 in the specimen in Fig. 7.
The phase formation spotted during the XRD analysis at three different points for pulsed current mode can be observed in Fig. 7. The intensity variation of elements with respect to keV for point 2 and variation of elements in the PC mode FCAW specimen are shown in the graph. The phase creation noticed by means of XRD at three various points for surface tension transfer mode. The intensity variation of elements with respect to keV for point 1 and variation of elements in the STT mode FCAW specimen are shown in the graph. The uniformity and identical nature of pulsed current mode and the base metal could be a better solution for its use of the welded material for post fabrication and machining. These advantages could well serve as a potential candidate for oil and refinery applications.
Electron back scatter diffraction (EBSD)
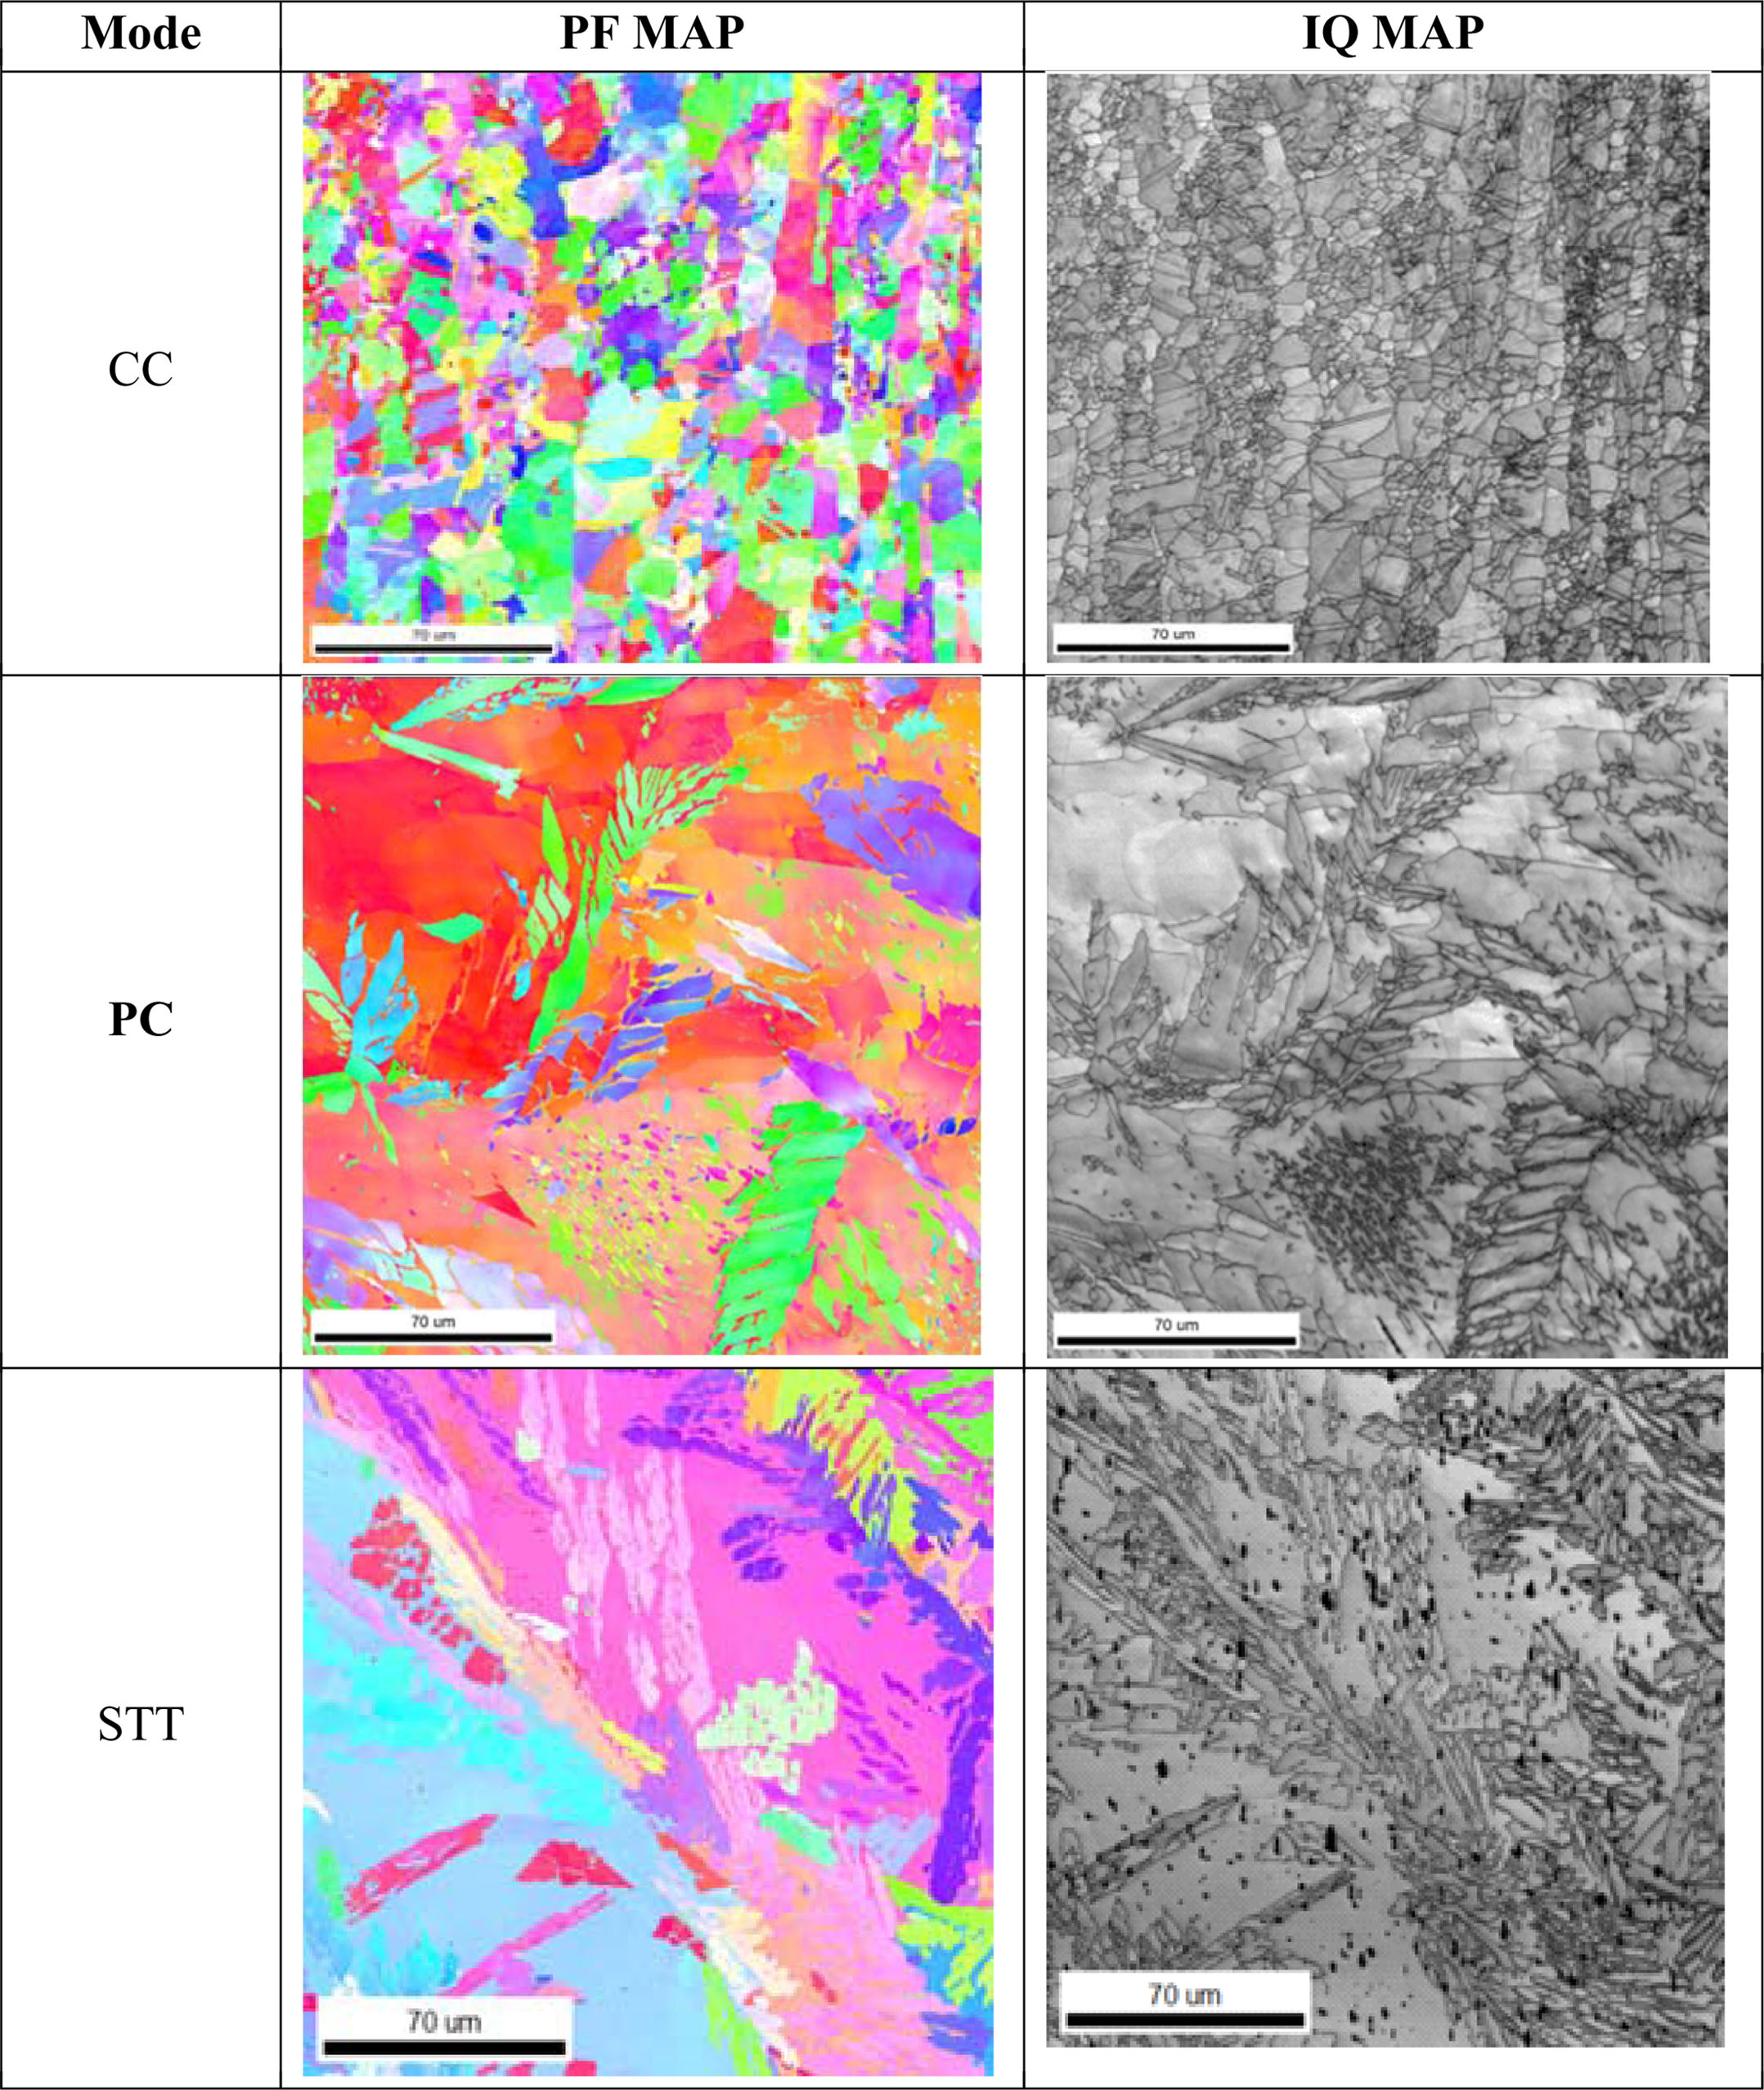
Different maps are created depending on the sample directions (normal, rolling, transverse). At every point of the map, a crystallographic direction related to the direction of the sample is computed and a specific colour is assigned based on the position in Inverse Pole Figure (IPF). EBSD can be applied to discriminate the dissimilar phases by means of equating the inter-planar angles taken from the pattern of diffraction.
Image Quality (IQ) is another significant factor in EBSD method. The IQ factor provides a qualitative report of dissemination of strain in a microstructure (EDAX, 2013). The IPF and IQ maps for those samples are shown in Fig. 8.The colour variations in the interior of grain indicate crystal distortion.
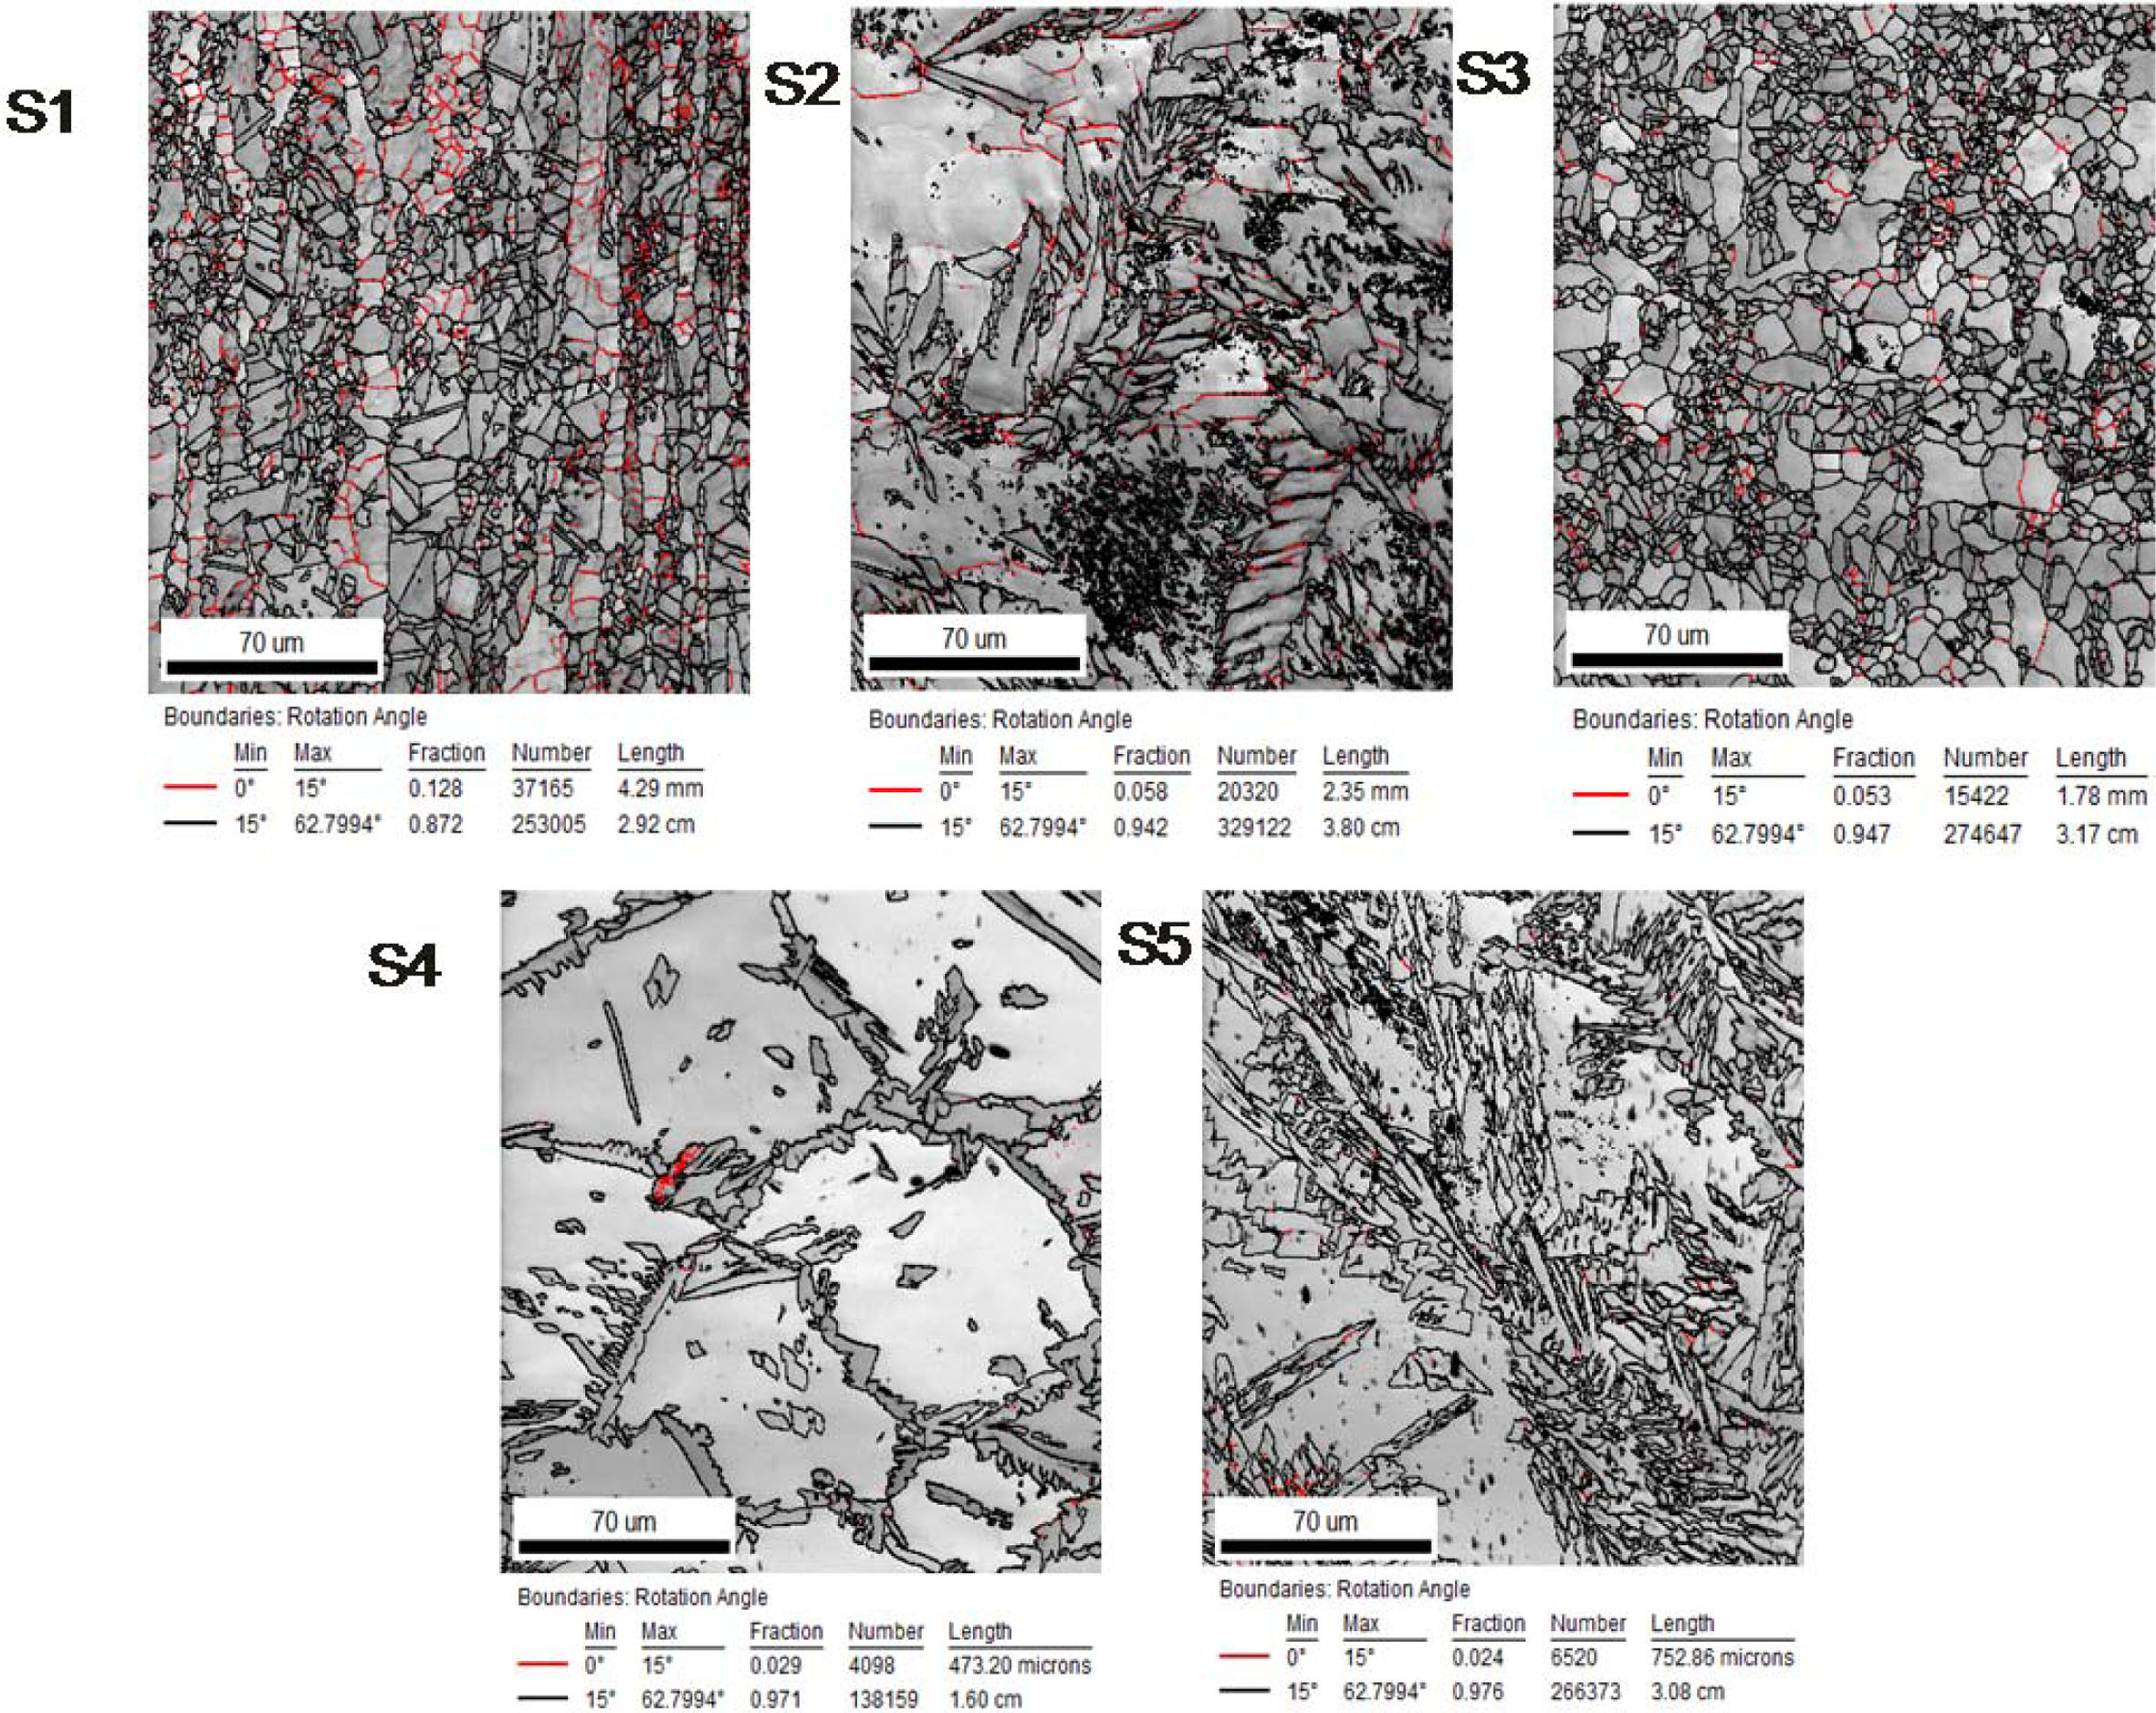
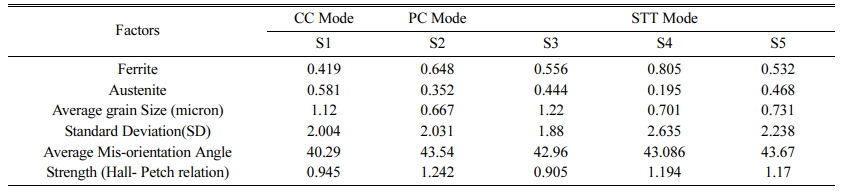
A better ferrite-austenite ratio is observed in sample 3 and sample 5. That is, with STT mode in EBSD. The low and high angle boundaries fraction of samples is shown in Fig. 9.
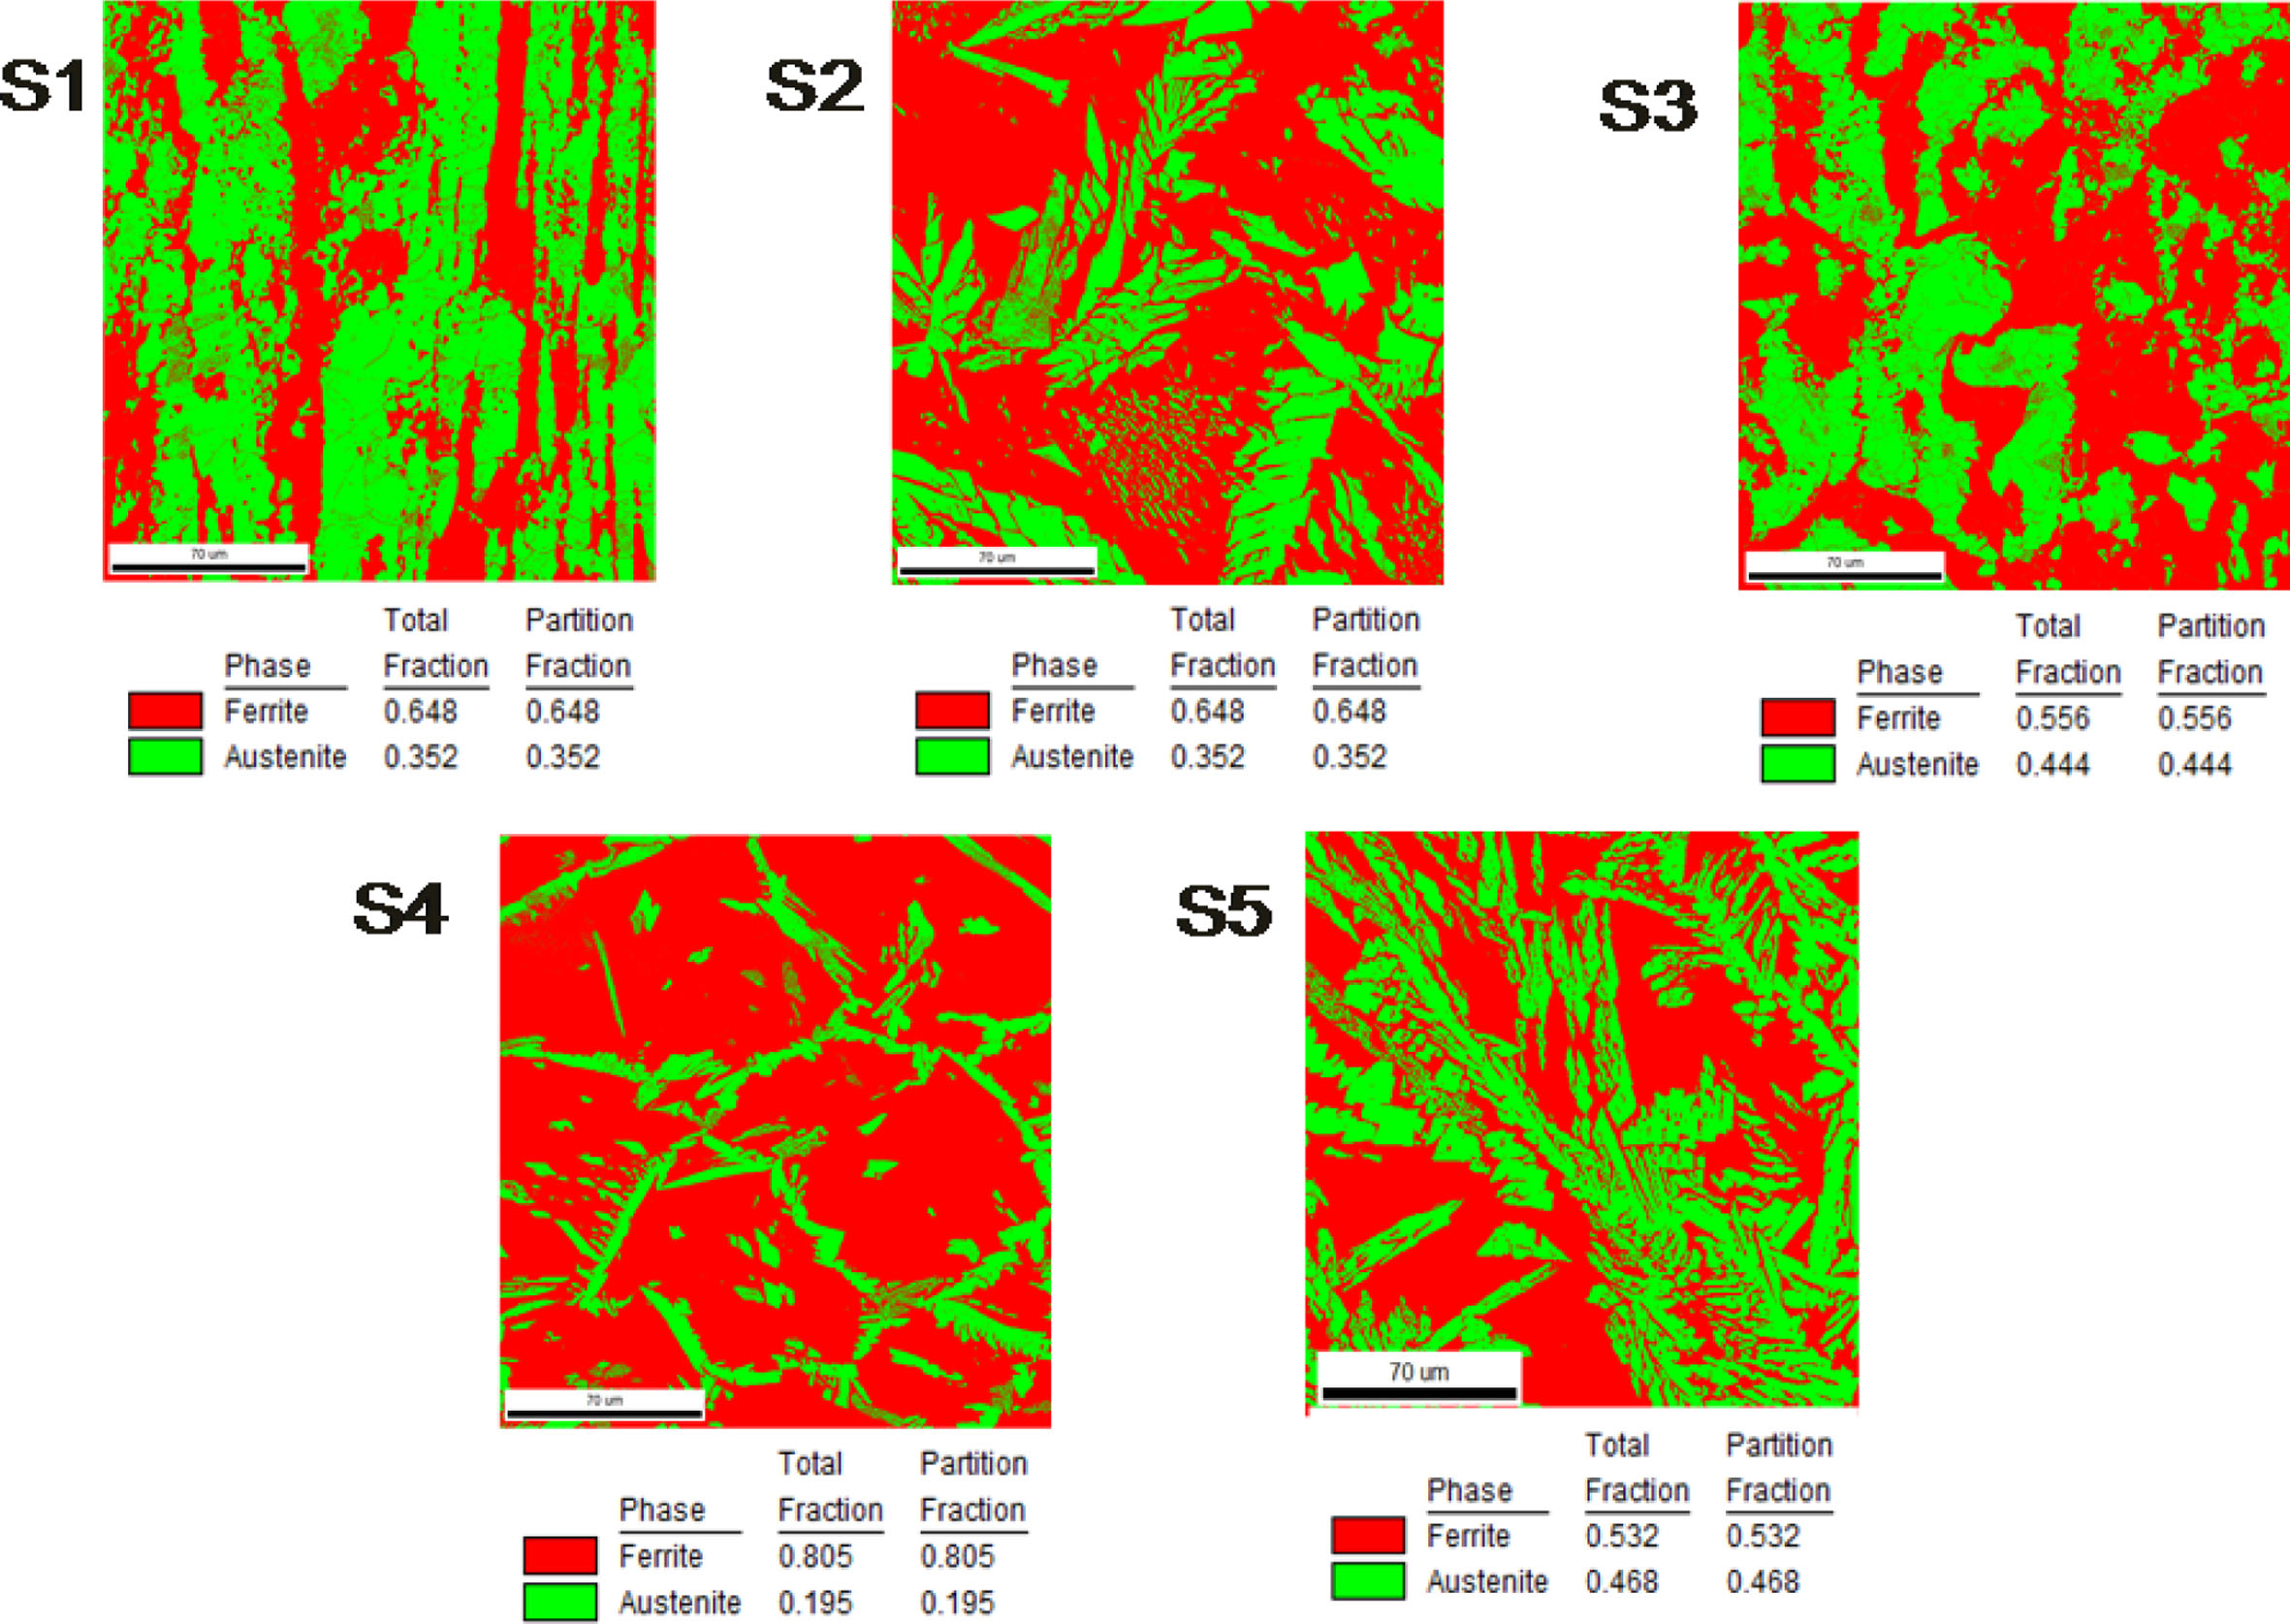
In this work, a point pair (grain) with mis-orientation angle more than 2 degrees is considered as boundary. The results of EBSD analysis in terms of grain size is given in Table 7. The ferrite-austenite fraction identified using EBSD for various modes are depicted in Fig. 10.
The grain size is very less in case of PC mode and hence the mechanical strength is more for sample 2. Likewise, the next best option in terms of mechanical strength is found for specimen 4 with a grain size of 0.701 micron. Thus, in terms of grain size and associated mechanical strength of the specimens 2 and 4 are yielding better results. That is, the pulsed current mode and surface tension transfer modes are considered better. But the grain boundaries increase with reduced grain size. The probability of corrosion and precipitation is higher with reduced grain size.
|
Fig. 2 (a-c) The microstructure of base metal at various magnifications of 50, 100 and 200 (A: Austenite; F: Ferrite). |
|
Fig. 3 (a-c) OM Images at Various Zones of FCAW at 200X (A: Austenite; F: Ferrite). |
|
Fig. 4 Ferrite – Austenite Ratio of Various Modes of FCAW. |
|
Fig. 5 FESEM analysis, (a-c) CC mode, (d-f) PC mode (g-h) STT mode. |
|
Fig. 6 SEM image and EDAX results from designated area for Element mapping of the CC, PC and STT FCAW weldment. |
|
Fig. 7 XRD elements analysis CC, PC and STT mode FCAW specimen. |
|
Fig. 8 IPF MAP and IQ MAP for various modes of FCAW using EBSD |
|
Fig. 9 Low and high angle boundaries fraction – EBSD. |
|
Fig. 10 Ferrite-Austenite Fractions through EBSD |
The metallurgical characterization was done for the three types of FCAW specimen under CC, PC and STT conditions. The OM analysis was done for the base metal and the specimen to observe the microstructure formation to understand the changes induced during the respective welding processes. Similarly the SEM and FESEM analysis were also done to gauge the concen- tration of ferrite in the weldment of the specimens. This was followed up by EDAX analysis to ascertain the material composition to corroborate for the observation made from the SEM analysis. The EDAX analysis revealed the presence of ferrite component is more in PC mode specimen similar to that of the base metal in the WZ in comparison to both CC and STT mode specimen. Whereas, the STT mode specimen has higher austenite content making up the composition of the WZ. The EDAX analysis was followed up by EBSD analysis. The results obtained highlighted the concentrations of the various elements present in the base metal, HAZ and the WZ and their grain size. Here it was observed STT mode specimens offered better results.
- 1. A.M. El-Batahgy, A.F. Khourshid, and T. Sharef, Mater. Sci. Appl. 2[10] (2011) 1443-1451.
-

- 2. M. Atapour, H. Sarlak, and M. Esmailzadeh, Int. J. Adv. Manuf. Technol. 83 (2015) 721-728.
-
- 3. G. BansalRajkumar, and N. Murugan, Indian J. Eng. Mater. Sci. 21[2] (2014) 149-154.
- 4. G.C. de Souza, A.L. da Silva, S.S.M. Tavares, J.M. Pardal, M.L.R. Ferreira, and I.C. Filho, Weld. Int. 30[6] (2016) 432-442.
-
- 5. C. Muthusamy, K. Lingadurai, P. Sathiya, D. Kandasami, and R. Kandhasamy, Mater. Res. 19 (2016)572-579.
-
- 6. F. Gao, Q. Gao, P. Jiang, Z. Liu, and Z. Liao, Vacuum 146 (2017) 136-141.
-
- 7. G. Bai, S. Lu, D. Li, and Y. Li, Corros. Sci. 90 (2015) 347-358.
-
- 8. M. Hazra, K.S. Rao, and G.M. Reddy, J. Mater. Res. Technol. 3[1] (2014) 90-100.
-
- 9. H.-Y. Ha, M.-H. Jang, T.-H. Lee, and J.O. Moon, Corros. Sci. 89 (2014) 154-162.
-
- 10. D. Hofe von, in proceeding of the German welding Society (DVS). (2015)16-21
- 11. H.L. Li, D. Liu, Y.T. Yan, N. Guo, Y.B. Liu, and J.C. Feng, J. Manuf. Process. 31 (2018) 833-843.
-
- 12. Hosseini, Bermejo, Gardstam, Hurtig, and Karlsson, Weld.in the Wor. 60[2] (2016) 233-245.
-
- 13. M. Manapparai, and A. Elango, J. Prod. Eng. 19[1] (2016) 87-90.
- 14. G.R. Mohammed, M. Ishak, S.N. Aqida, and H.A. Abdulhadi, in Proceedings of the 2nd International Conference on Automotive Innovation and Green Veh icle, August 2016, edited by S.A. Che Ghani (Curran Associates, Inc., 2017) p.8.
- 15. M. Indira Rani, and R.N. Marpu, Inter. J. Eng. Sci. 1[1] (2012) 01-05.
 This Article
-
2021; 22(5): 527-537
Published on Oct 31, 2021
- 10.36410/jcpr.2021.22.5.527
- Received on Feb 20, 2021
- Revised on Jun 20, 2021
- Accepted on Jul 17, 2021
Services
Shared
Correspondence to
- M. Palpand
-
Assistant Professor, Department of Mechanical Engineering, PSNA College of Engineering and Technology, Dindugal, Tamilnadu, India
Tel : +919843046150 Fax: +0451- 2554249 - E-mail: palpandi.m@gmail.com
Clean-Energy Research Institute(CRI), Hanyang University, 222, Wangsimni-ro, Seongdong-gu, Seoul, 04763, Korea
E-mail: jcpr@hanyang.ac.kr