


- Effect of glass cooling rate on the crystallization behavior and structure of Al2O3-SiO2-Na2O-CaF2 oxyfluoride glass-ceramics
Mengxuan Lia, Jinxin Zoub,*, Guangping Guoa, Jianxiang Liua and Guicheng Wangb
aGuizhou Metallurgical Chemical Industry Research Institute, GuiZhou-550007, China
bGuizhou Research Institute of Chemical Industry, GuiZhou-550007, ChinaThis article is an open access article distributed under the terms of the Creative Commons Attribution Non-Commercial License (http://creativecommons.org/licenses/by-nc/4.0) which permits unrestricted non-commercial use, distribution, and reproduction in any medium, provided the original work is properly cited.
The glass cooling rate during molding process has significant effect on the crystallization behavior and structural uniformity of Al2O3-SiO2-Na2O-CaF2 oxyfluoride glass-ceramics. Abaqus Finite Element Analysis indicated that at room temperature cooling environment, the cooling rate of 8mm thick glass was notably lower than that of 3 mm thick glass. The interior temperature of 8 mm thick precursor glass was still above 710 oC even after the sample was cooled for 15 s, which caused the formation of “crystal stones” in precursor glass. The microstructure of oxyfluoride glass and glass-ceramics with different thickness was analyzed by using DTA, XRD, IR and SEM. Since the 8 mm thick glass was cooled slowly, the initial crystal nucleation generated in the interior of glass, mixed crystal phases were formed in the interior after heat treatment, while single CaF2 crystal phase formed on the surface. On the contrary, there was only uniform CaF2 crystal phase generating in the 3 mm thick precursor glass after heat treatment, as a result of high cooling rate during molding process. Besides, the mechanism and ways to optimize the structure uniformity of glass ceramics were also be discussed
Keywords: Oxyfluoride glass-ceramics, Finite element analysis, Cooling rate, Microstructure
Recently, oxyfluoride glass ceramics has became the focus of researchers in the field of glass ceramic, for it combines the advantages of fluoride and oxide, which gives it promising application in optical devices of telecommunication [1, 2], such as fibers, optical ampli- fiers and solid-state lasers [3-5]. Currently, the preparation of oxyfluoride glass ceramics usually through powder melting, formation of precursor glass and heat treatment process [6]. Obviously, the forming process of precursor glass has an un-ignoring influence on the structure uniformity of glass ceramics. In our experiments, we found that “crystal stones” was generated if precursor glass was long enough stay in conditions which is beneficial to the formation and growth of crystals. The structural inhomogeneous phenomenon has a harmful effect on the appearance, structure and properties of glass ceramics, which also caused unexpected devitrifi- cation [7, 8]. So it’s important and meaningful to exploring the reason of this phenomenon.
Numerical simulation is flexible and efficient, it can not only shorten the production cycle of precursor glasses, but also directly visualize the temperature variation inside of the precursor glass. Abaqus is a powerful engineering finite element simulation software which can take static and quasi-static analysis effectively, besides, some physics steady-state and transient analysis also can be carried out such as, physics of heat, electricity and magnetism etc. Thus, the temperature variation of precursor glass during molding process was simulated by Abaqus in our work to adjunctively study the effect of the cooling rate on crystallization behavior, microstructure of oxyfluoride glass-ceramics systematically. Besides, the mechanism and way to optimize the structure uniformity of glass ceramics also were discussed in this paper according to the analysis results of DTA/XRD/SEM/IR.
Numerical Simulation
Using Abaqus Finite Element Analysis software (Supplier : HuaMeng Technology Co. Ltd) to simulate the variation of temperature which is related to cooling time at molding process, the simulation was implemented on precursor glass with different thickness (3 mm and 8 mm), basic steps are as follows:
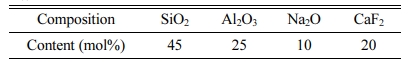
1) According to the ternary phase diagram of SiO2-Al2O3-Na2O and early experiments, the precursor glass samples used in this study have the following chemical composition (Table 1).
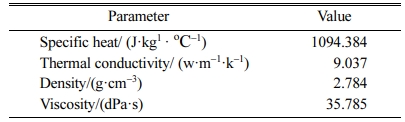
First, calculate the performance parameters of the precursor glass (Table 2);
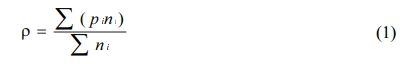
The density of precursor glass is calculated by formula (1), where the ρ is density; pi is density plus coefficient of precursor glass; and ni is the mole fraction of composition;
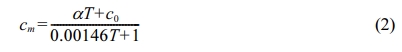
The specific heat is calculated by formula (2), where α = Σωiαi , c0 = Σωici, ωi is mass fraction of compo- nents of precursor glass, αi is calculation factor, ci is calculation factor of precursor glass’s specific heat and T is temperature;
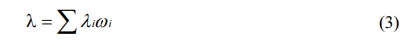
The thermal conductivity is calculated by formula (3), where λi is expansion factor of precursor glass composition, ωi is mass fraction of components of precursor glass;
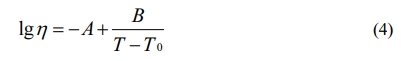
The viscosity is calculated by Fulcher Equation (4),where η is viscosity, A, B is constant of precursor glass; T0 is room temperature (25 oC); T is the actual temperature (1,450 oC)of the molten glass;
2) Modeling (Part): run the Abaqus software, create a Three-dimensional model (3D / Deformable / shell / Exclusion) to simulate the temperature field at different cooling time;
3) Create a material, definite its properties (Property function) and the boundary condition (Load) (hot junction temperature load is 1450 oC, cold junction temperature load is 25 oC (room temperature));
4) Assembly, using Assembly function to connect the material and the model which was built at step 2);
5) Create analysis step (Step function);
6) Meshing the network components (Mesh function), the cell property is definited as thermal analysis cell;
7) Create job and submit it (Job function);
8) Results output (Visualization function).
Preparation of Al2O3-SiO2-Na2O-CaF2 oxyfluoride glass-ceramics
The oxyfluoride glasses used in this study have chemical composition which was listed in Table 1, the samples were obtained by melting the thoroughly mixed composition in an electric furnace at 1,450 oC for 2 h and then quickly cast the melt into a slab by pressing two stainless steel plates, the thickness are 3 mm and 8 mm respectively. Then put them into muffle furnace to anneal at 560 oC for 1 h, in order to eliminate the thermal stress of precursor glasses. Then, transparent glass ceramics was obtained after a thermal treatment of the precursor glass at 650 oC for 3 hrs.
The curves of Differential Thermal Analysis (DTA) obtained at the heating rate of 10 oC/min were recorded by a thermal analyzer (Dz3320A); XRD patterns were determined by an X’Pert PA Nalytical Diffractometer on a solid sample by using Cu-kα radiation (Scanning speed: 15o/min, Step size: 0.02o/s, voltage: 40 kV, Current: 20 mA, scan range: 10~90o), which was used to identify the crystallization phase; Near infrared optical absorption spectra were recorded by a Transform Infrared spectro- photometer (FTIR Nicolet 5700); The distribution of crystal grains in the glass ceramics was observed by a Scanning Electron Microscopy (SEM) (FEI Sirion200), (The sample surface was treated by HF solution (5 vol%), 1 min).
Abaqus finite element simulation of the precursor glass
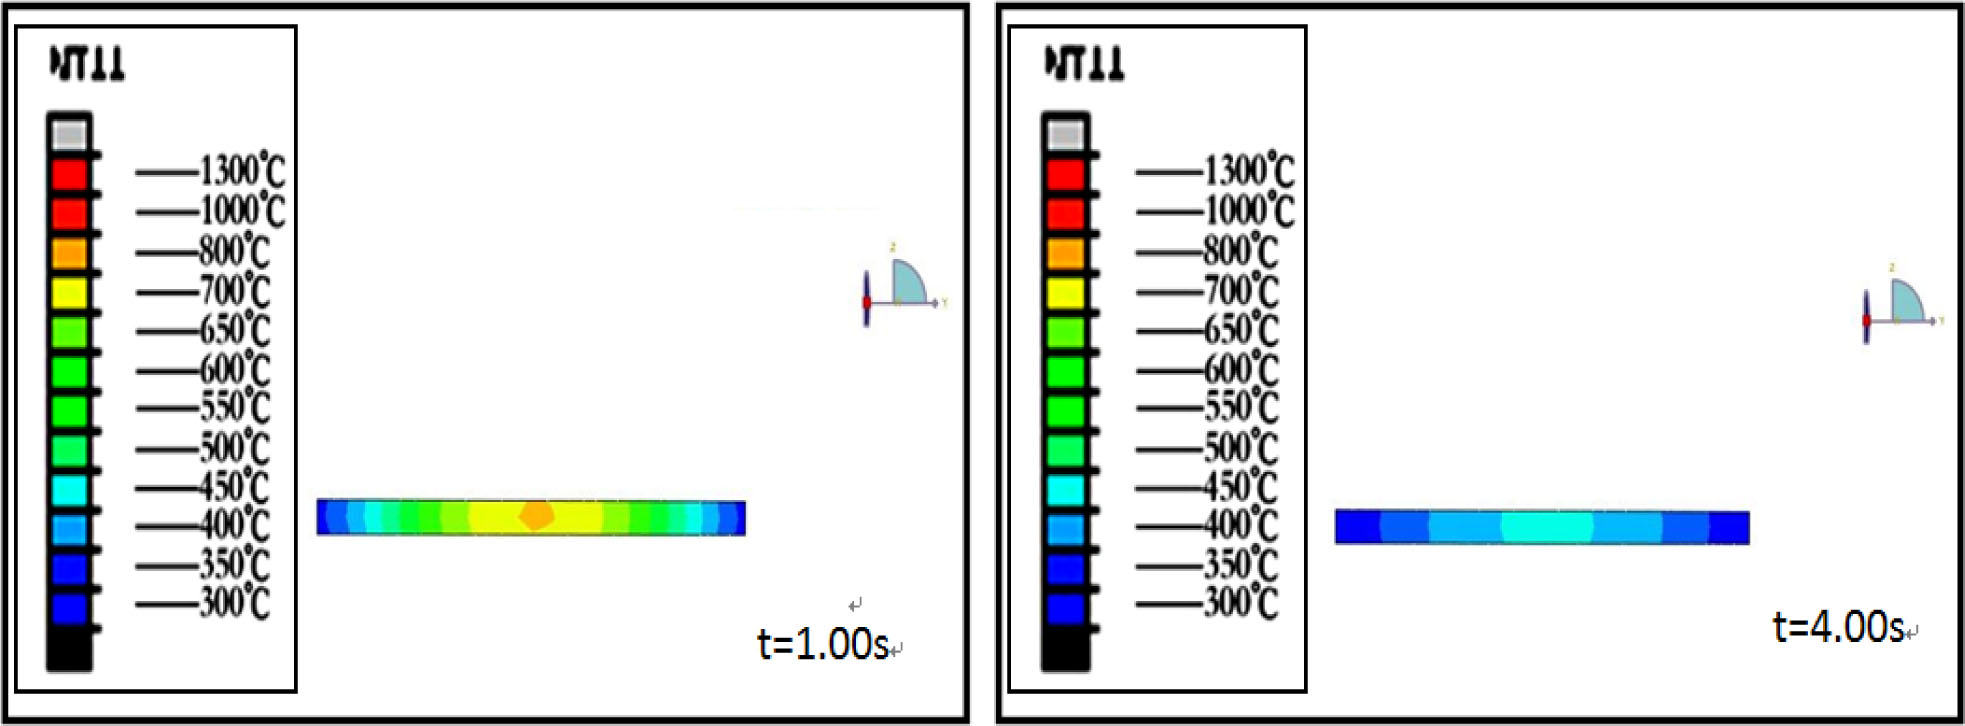
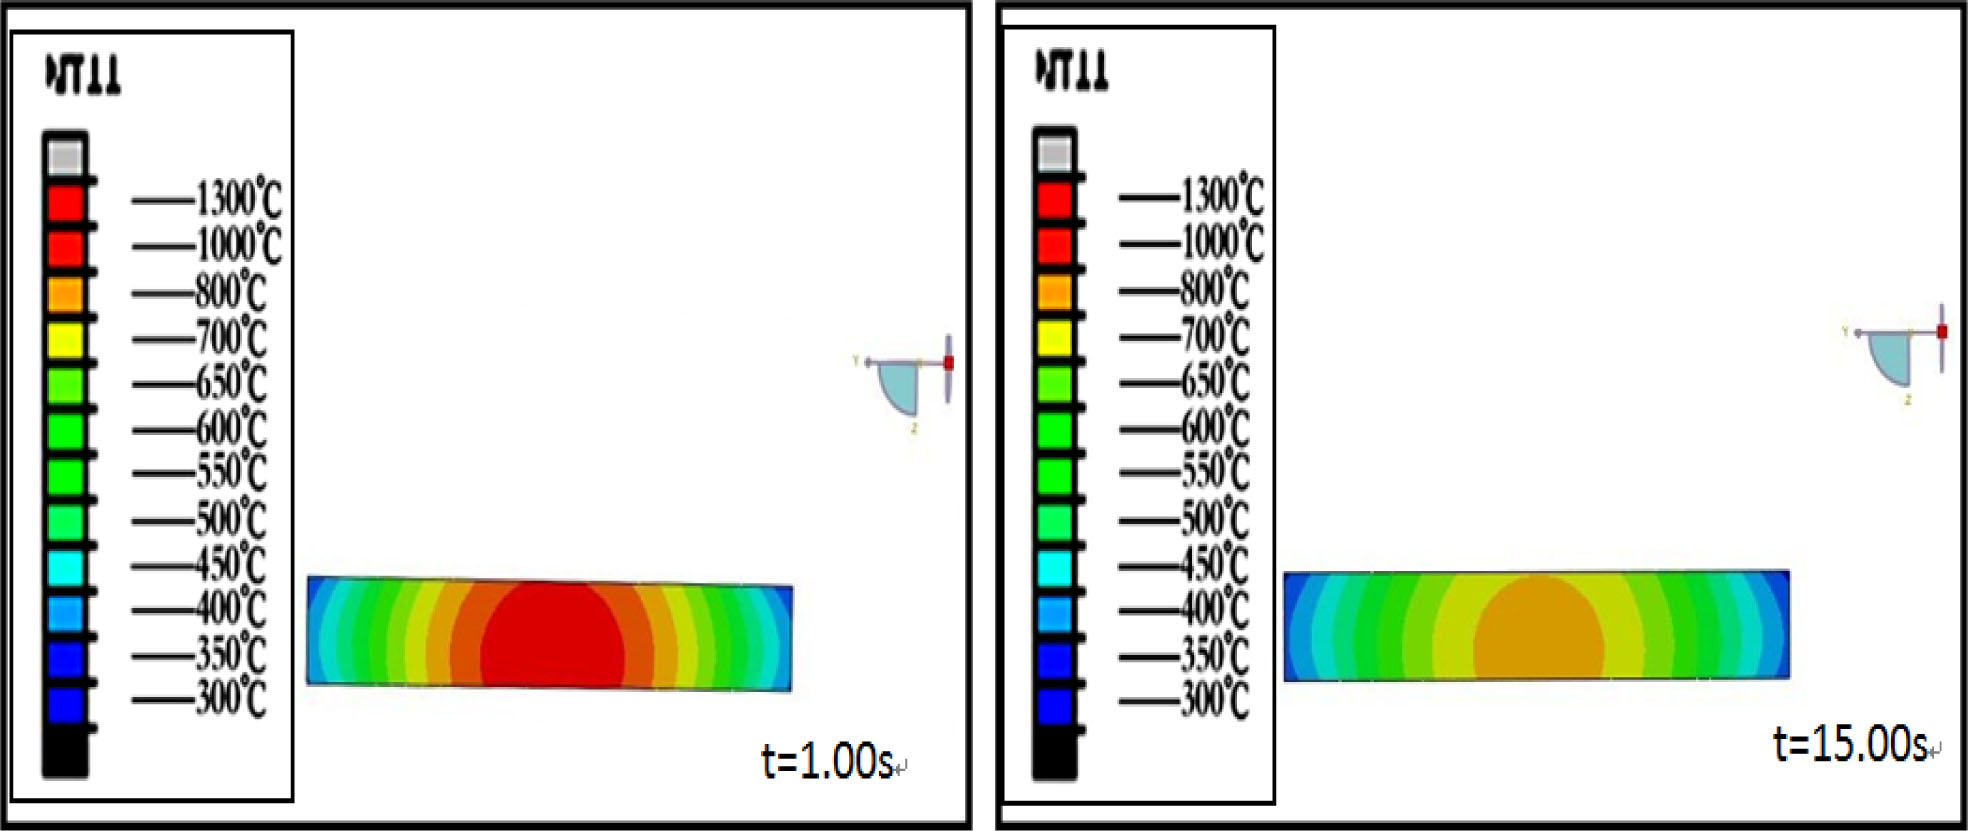
Fig. 1 and 2 are the temperature field simulation results of 3 and 8 mm thick precursor glass during molding process which was taken by Abaqus Finite Element Analysis. It can be seen from the figures that the temperature of precursor glass decreases with the prolongation of cooling time. The core temperature of 3mm thick glass dropped to 500 oC after molding for 4s, but the core temperature of 8 mm thick glass is still as high as 710 oC after molding for 15 s.
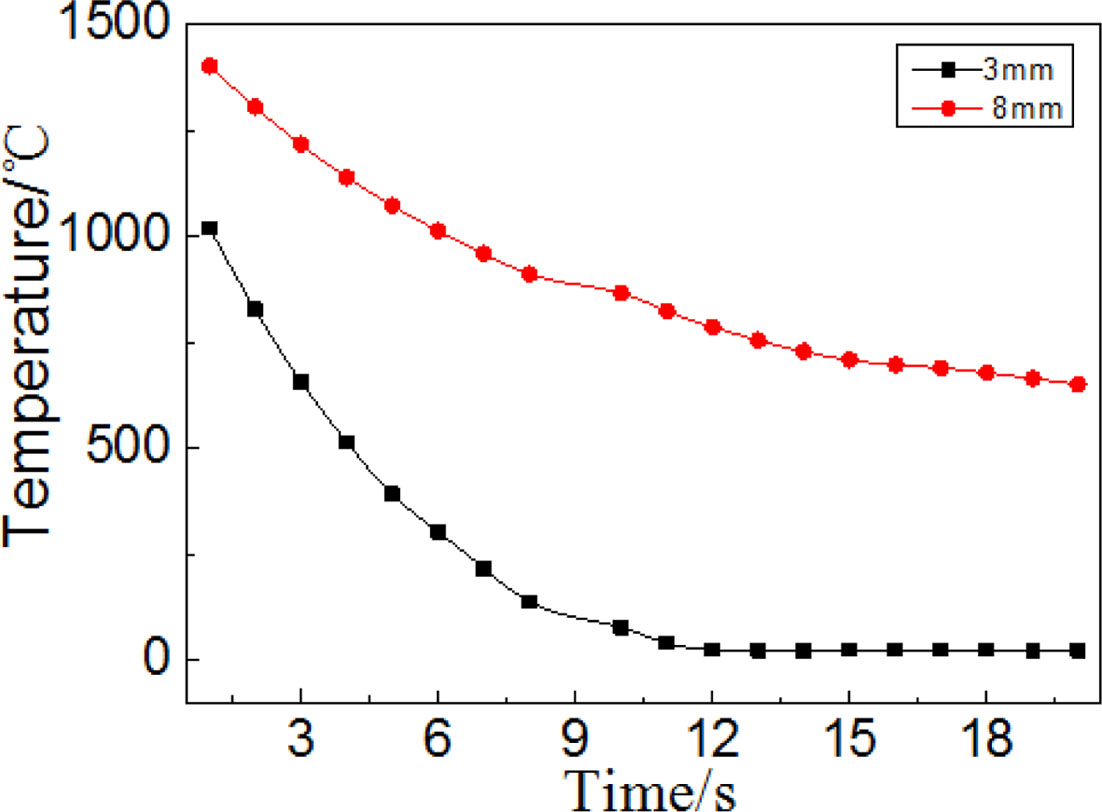
Fig. 3 is a curve of temperature variation related with cooling time, as can be seen, the cooling rate of 8mm thick precursor glass is obviously slower than that of 3mm thick glass. The center temperature of 3 mm thick precursor glass tend to stabilize when the cooling time exceeds for 8 s, which is far below the crystallization temperature; on the contrary, the center temperature of 8 mm thick precursor glass still maintain high (>650 oC) for it has a poor heat dissipation property. Due to the crystallization temperature of precursor glass is 650 oC (Fig. 4), so the initial nucleation will generate when the interior temperature of precursor glass is above the crystallization temperature. Then, the initial nucleation will grow up preferentially during the next heat treatment processes, which has a serious impact on the structure uniformity and the appearance of precursor glass. Therefore, the preparation process should be adjusted so that the integrated temperature of the pre- cursor glass can rapidly decrease to below the crystalli- zation temperature, in order to prevent the occurrence of interior crystallization phenomenon.
Structure and crystallization behavior of the pre- cursor glass
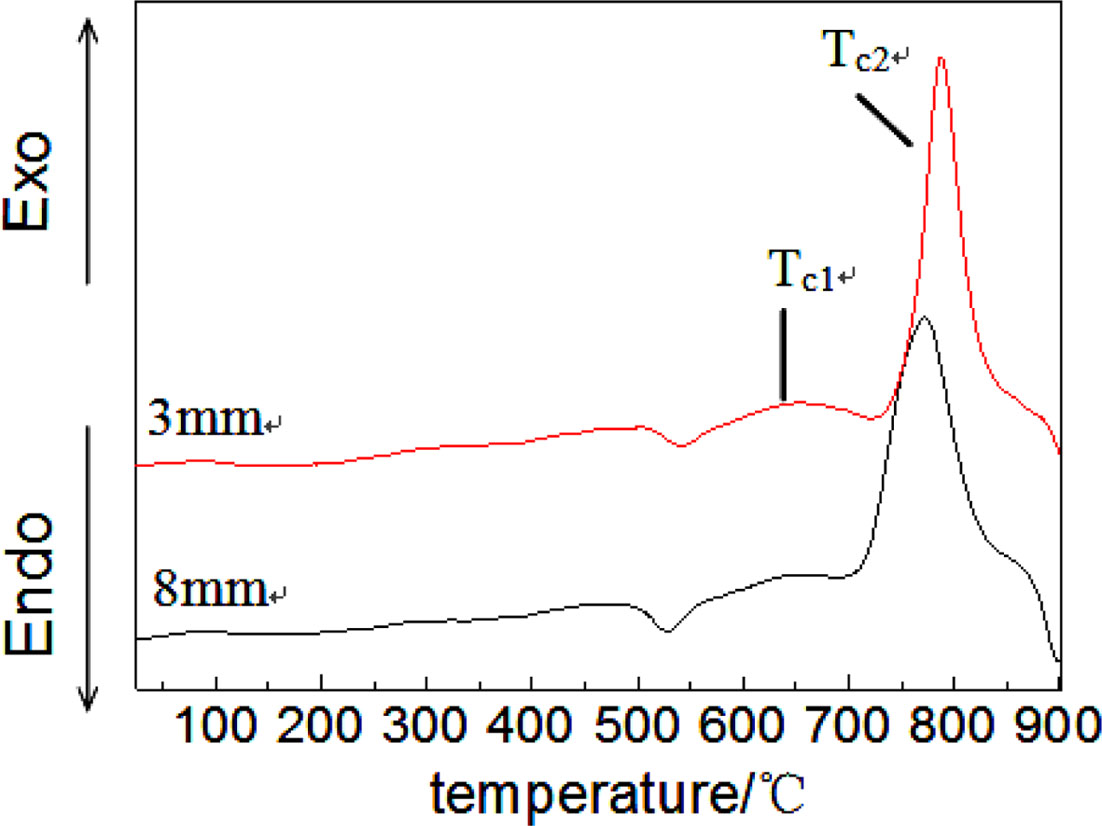
Fig. 4 shows the DTA curves of different thickness precursor glass, in which two exothermic peaks can be observed. The first peak (Tc1) and second peak (Tc2) are corresponding to the precipitation of single CaF2 crystal phases and the integrated crystallization process of precursor glass respectively. This paper aims to obtain CaF2 nano-crystalline enriched glass ceramics, so we choose Tc1 as the crystallization temperature in our experiments, thus, as what can be found, the crystallization temperature of 3 mm and 8 mm thick precursor glass is 653 oC, 650 oC respectively, and the crystallization peak intensity of 3mm is higher than that of 8 mm thick precursor glass. Studies have shown that crystallization peak intensity is relevant to the number of nucleation in precursor glass [9], thus the DTA results can be used as a basis to analyze the crystallization behavior of glass. It’s can be known, combining the results of Abaqus finite element simulation and IR spectroscopy, due to the lower cooling rate of 8 mm thick glass, the temperature in the interior region is higher than the crystallization temperature, the initial nucleation was generated, which leads to lower intensity of crystallization peak.
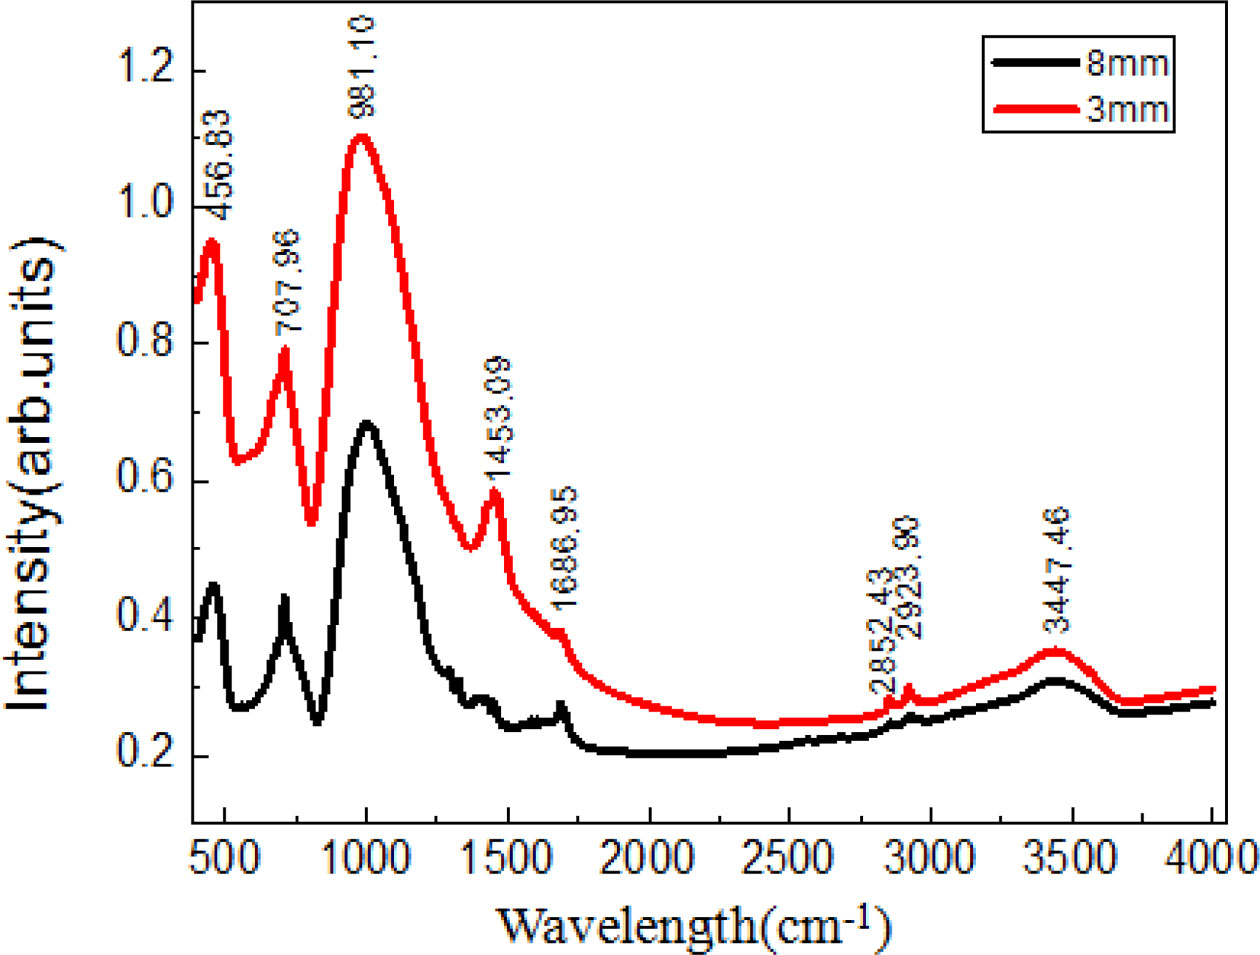
Fig. 5 shows the infrared optical absorption spectra of Al2O3-SiO2-Na2O-CaF2 precursor glass with different thickness, where the absorption peak at 1,686.95 cm-1 is caused by hydroxyl(-OH) which cling to glass surface; besides, absorption peak at 1,453 cm-1 is corresponding to the dissymmetry vibration of bond (Si-O-Si) and stretching vibration of bond (O-Si-O). The Si−O−Al bond’s absorption peak is at 1000~600 cm-1, and the absorption peak at 456 cm-1 is corresponding to the vibration of [SiO4]4-. Studies [10, 11] have shown that Al3+ and Ca2+ ions will replace the Si4+ ion of [SiO4]4− when the precursor glass transforms into glass-ceramics, which causes the vibration of O−Al bond. The infrared absorption band of 8 mm thick glass that with lower cooling rate is significantly wider than that of 3 mm thick glass, which indicates that the microstructure of precursor glass has been changed. The reason is that the electron negativity of Al3+ and Si4+ is lower and part of Al3+ ions will substitute the Si4+ ions in the [SiO4]4-, while the polarity and the vibration frequency of Si-O-Si bond are increasing, which leads to the bandwidth of the corresponding infrared absorption peak and lower intensity. The substitution of Al3+ ion is proof contribute to the generation of initial nucleus inside precursor glass, which means the amorphous structure of the precursor glass has been destroyed. Due to larger thickness precursor glass has a lower cooling rate, the internal temperature is higher than the crystallization temperature, which is beneficial to the formation and growth of crystals. Thus conclusion is consistent with the results of finite element analysis.
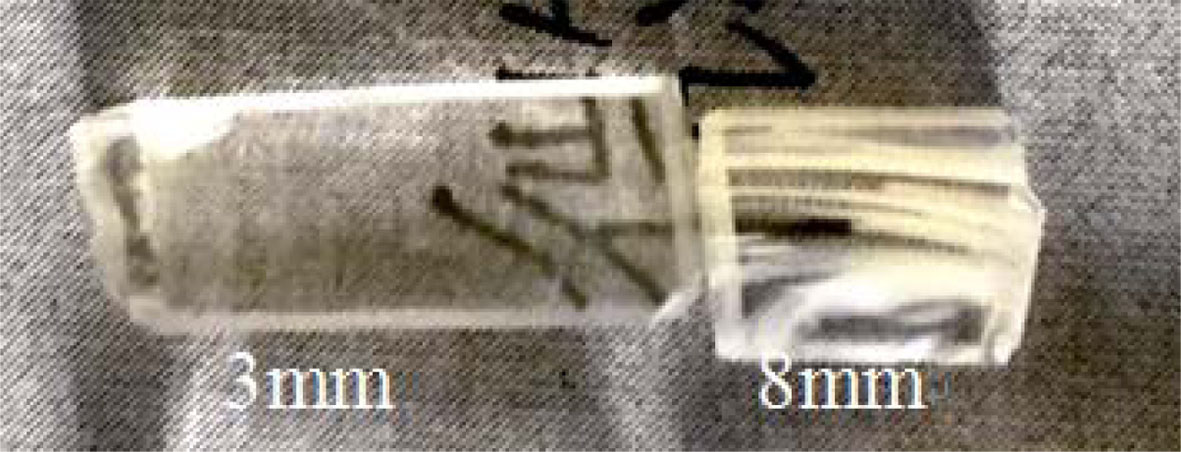
Glass ceramics is obtained by thermal treatment at 650 oC for 3 hrs, the appearance digital pictures of glass ceramics are shown in Fig. 6. Obviously, the glass ceramic that was produced by 3 mm thick precursor glass remains transparent, differently, as can be seen from the ceramic glass prepared by 8mm thick precursor glass, there are some milky stripes in the glass ceramic, which caused devitrification.
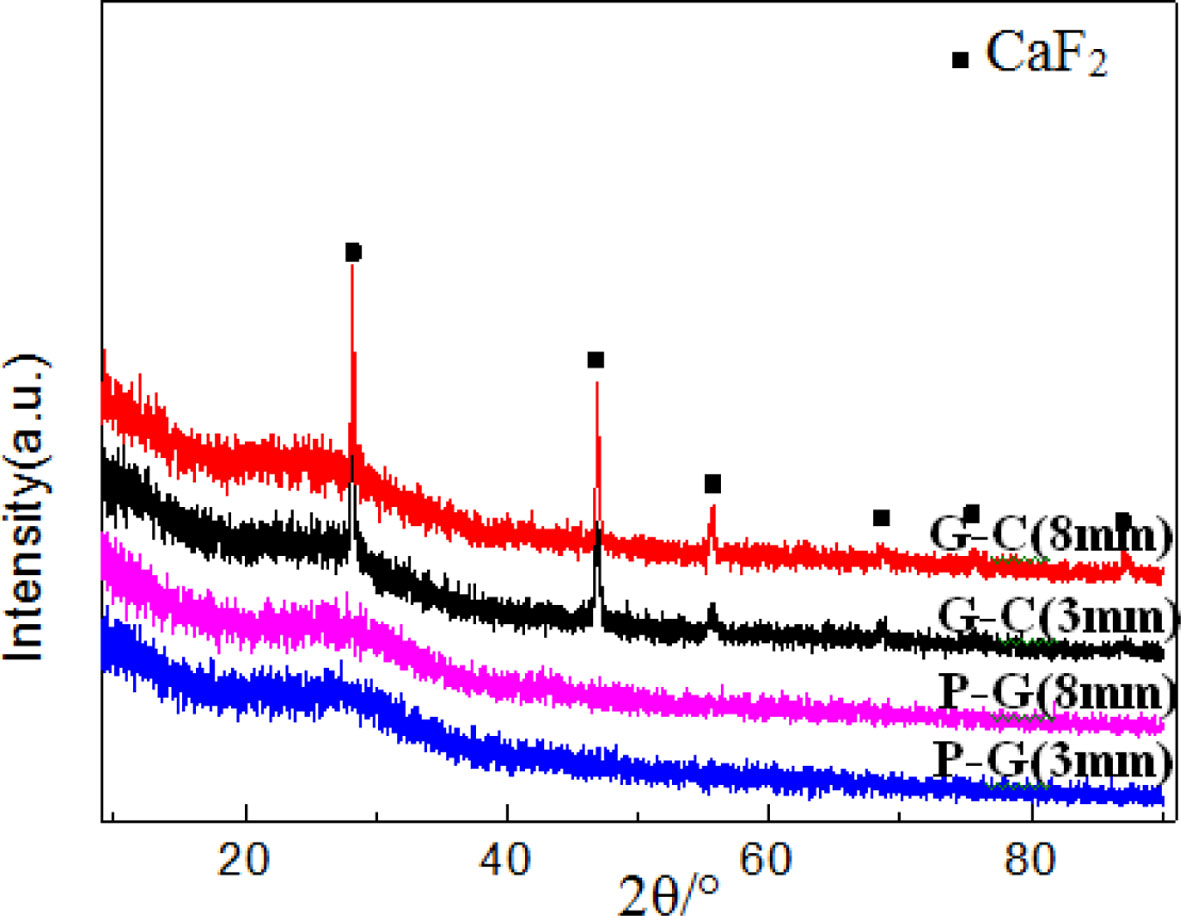
XRD patterns of glass ceramics with different thickness are showed in Fig. 7, we can find, amorphous phase of precursor glass has been transformed to crystal phase of glass ceramic after heat treatment, it can be known from the patterns that the crystal phase in transparent areas of 3 mm thick and 8mm thick glass ceramic are CaF2 crystal phase.
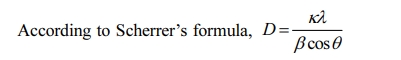
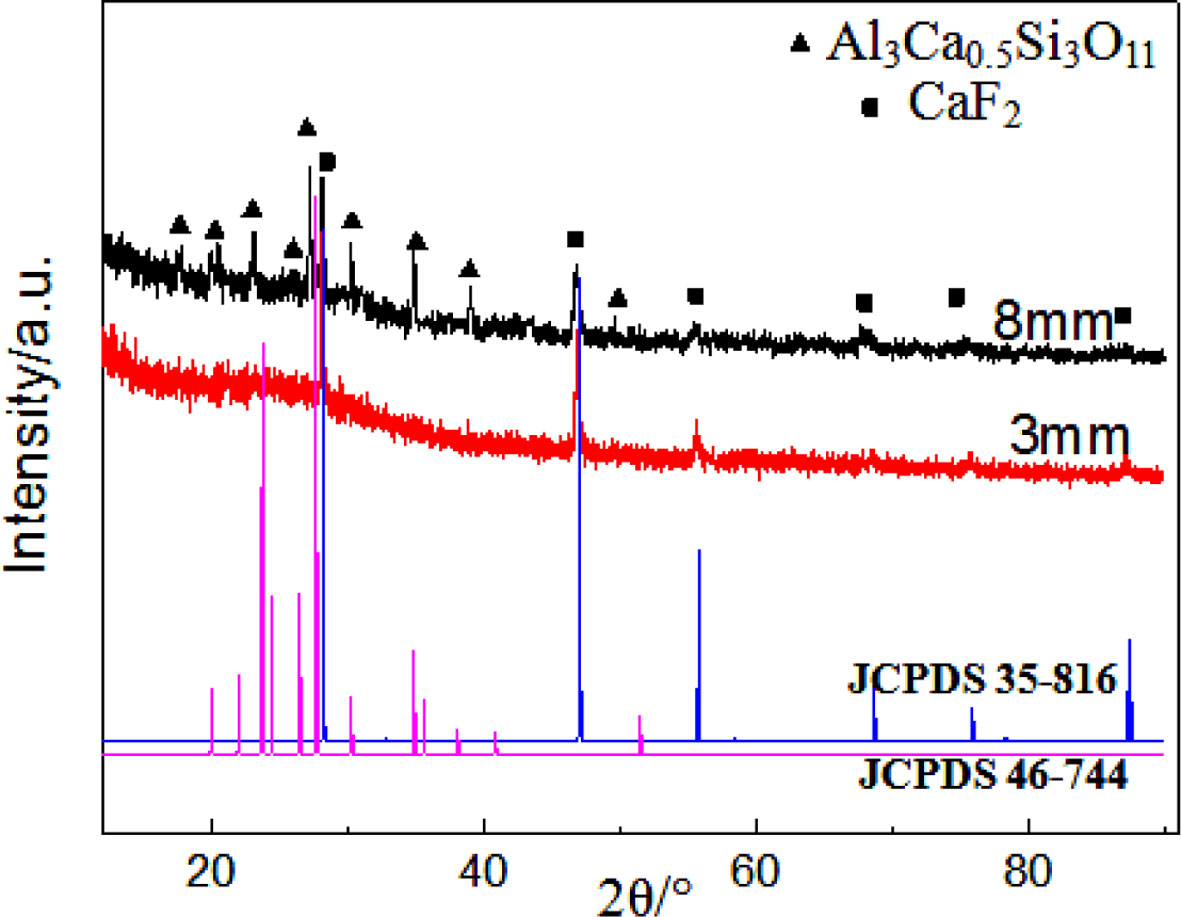
Where D is grain size, k is the Scherrer constant taken to be 0.89, λ is the wavelength of X-ray, β is the width of half height, and θ is the angle of diffraction. The grain size of ceramic glass with different thickness (8 mm, 3 mm) is approximately 50 nm and 20 nm; in order to analysis the internal phase composition of the glass ceramic, we precisely cut the 8 mm thick glass ceramics, so does 3 mm thick glass ceramic for com- parison. We found the XRD patterns (Fig. 8) about the milky area of 8 mm thick glass ceramic is interesting, it can be learned, in addition to larger grain size (60 nm) CaF2 nanocrystalline precipitated in interior, it also precipitated Calcium Aluminum Silicate (Al3Ca0.5Si3O11) phase; but for glass ceramic of 3 mm, there was only CaF2 crystal phase inside it. So, it’s identified the microstructure and phase composition of inner and surface of 8mm thick glass ceramic are different, which is harmful to materials.
Microstructure of glass ceramics
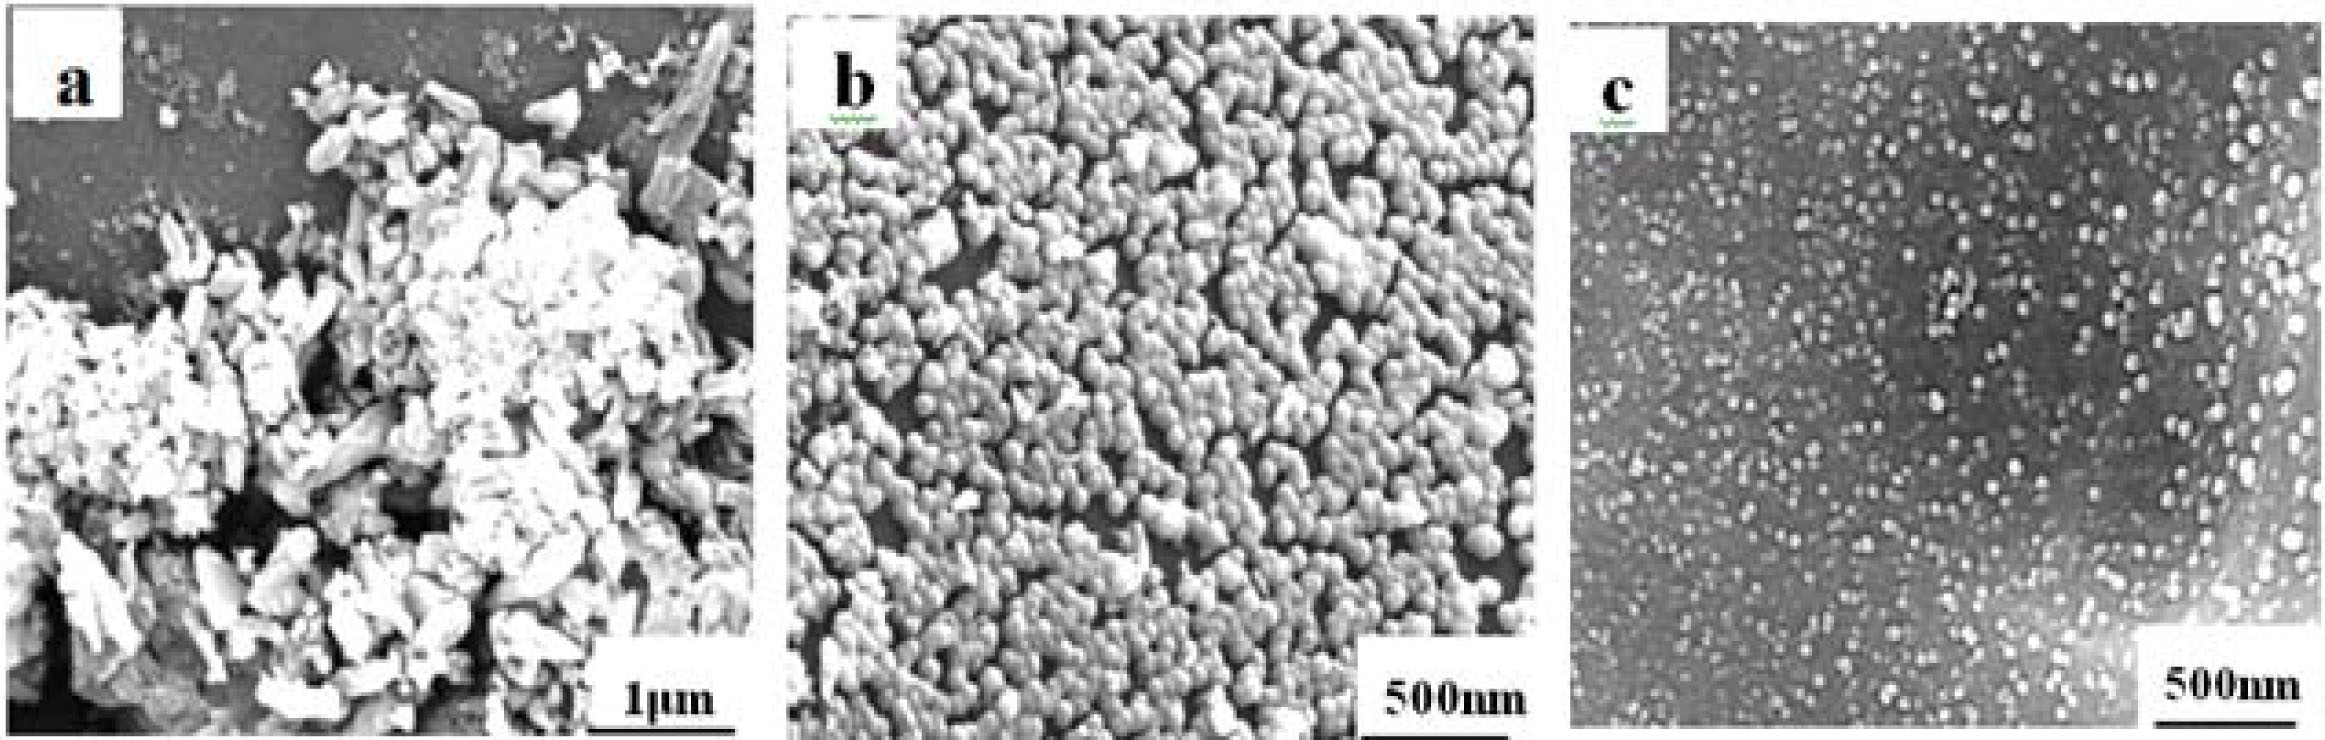
Fig. 9 is the FE-SEM images of different thick glass ceramics, where Fig. 9(a) is the milky area of 8mm thick glass ceramic, it can be shown that there are still a large number of rod-like crystal phases with large grain size approximately to 0.5 μm, in addition to some spherical nano-crystalline phase; besides, some cracks between crystal phase and glass phase are easy to find, the gray-black portion in image is the glass phase of glass ceramic, and the black hole among the crystal phase is the glass phase(inter space leaved by HF corrosion), on the contrary, the SEM images of its transparent surface (Fig. 9(b)) is relatively simple, it is only consist of connected spherical nano-crystalline and glass phase, the gain sizes of nano-crystalline are around 50 nm. The gap among crystals phases is relatively narrow which means less glass phase in glass ceramic. The microstructure of 3 mm thick glass ceramic is similar to that of 8 mm thick glass ceramic, but the distribution of crystal and grain size is more uniform. Also, the grain size is finer which approximately 20 nm (Fig. 9(c)), which is beneficial to its optical properties.
According to the XRD analysis results mentioned above, the phase composition of colorless transparent surface of glass-ceramic and interior milky region of 8 mm thick glass ceramic is different, which results in stratification phenomenon, even caused cracks at the junction interface of the phases, due to the big difference of its thermal expansion coefficient; This is consistent with the difference between the two regions which is revealed by SEM analysis, therefore it can be indicated the phases composition of the interior of the 8mm thick glass ceramic, including glass phase, rod-like Calcium Aluminum Silicate (Al3Ca0.5Si3O11) crystal phase and partial spherical calcium fluoride nano-crystalline phase (CaF2), but there is only uniform CaF2 nano-crystalline phase located in the transparent area of its surface, except for some glass phases. For 3 mm thick glass ceramic, due to the thin thickness after molding, the cooling rate is high, as a consequence, the temperature decreases rapidly and there is no generation of initial nucleation in its interior, therefore, it has a homogeneous composition whether in interior or surface after heat treatment processes.
Thus, it’s worth noting that there are two glass-ceramic crystallization mechanism for the 8 mm thick glass ceramic that have a lower cooling rate during heat treatment process, transparent surface layer mainly cling to surface crystallization mechanism and integral crystallization mechanism for its interior field [12, 13], this difference results in a discrepancy of grain morphology and microstructure for glass ceramic. This also depicts the crystallization mechanism for 3 mm thick glass ceramic is surface crystallization, due to its high cooling rate during molding which prevent the formation of initial nucleation.
Therefore, the key to preparing transparent and uniform structure oxyfluoride glass ceramics (Al2O3-SiO2-Na2O-CaF2 system) is to improve the cooling rate of precursor glass, and maintain the temperature uniformity of both interior and surface of the precursor glass, so that the temperature can rapidly decrease below the crystallization temperature during molding process of precursor glass, which avoids the occurrence of integral crystallization phenomenon at next heat treatment process. Because the integral crystallization phenomenon will result in defects such as larger grain size, split-phase and difference of refractive index between each phase in the glass ceramic, which leads to the occurrence of opalescence even devitrification.
|
Fig. 1 Temperature distribution in 3 mm thick glass with different cooling time |
|
Fig. 2 Temperature distribution in 8 mm thick glass with different cooling time. |
|
Fig. 3 Relationship between the glass central temperature with different thicknesses and the cooling time. |
|
Fig. 4 DTA curves of precursor glasses with different thicknesses. |
|
Fig. 5 Infrared absorption spectra of precursor glass with different thicknesses. |
|
Fig. 6 Digital picture of glass-ceramics with different thicknesses. |
|
Fig. 7 XRD patterns of precursor glass and glass-ceramics with different thicknesses (G-C/Glass Ceramic, P-G/Precursor Glass). |
|
Fig. 8 XRD patterns of White portion of 8mm thick glassceramics and planing surface of 3 mm thick glass-ceram |
|
Fig. 9 SEM images of glass-ceramics, a. Milky portion of 8 mm thick glass-ceramics; b .Transparent portion of 8 mm thick glass-ceramics; c. 3 mm thick glass-ceramics |
1) Abaqus finite element analysis results shows that the core temperature of 3 mm thick glass dropped to 500 oC after molding for 4 s, but the core temperature of 8 mm thick glass was still as high as 710 oC after molding for 15 s, which is above the crystallization temperature of precursor glass, that is prone to the generation of “crystallization stone”;
2) The cooling rate of thicker precursor glass is lower, which contributes to the generation of initial nucleus inside precursor glass during molding process, this difference result in a discrepancy of grain morphology and microstructure for glass ceramic, which leads to stratification even devitrification phenomenon of Al2O3-SiO2-Na2O-CaF2 glass-ceramics;
3) The key to preparing transparent and uniform structure oxyfluoride glass ceramics (Al2O3-SiO2-Na2O-CaF2 system) is to improve the cooling rate of precursor glass, and maintain the temperature uniformity of both interior and surface of the precursor glass, to ensure that the glass ceramic with homogeneous structure will be prepared by precursor glass during heat treatment process.
The research was financially supported in part by the Guizhou Academy of Sciences Youth Fund (No. Qzjz [2019] No.23).
- 1. H. Rahimian, H. Mokhtari, S.P. Shirmardi, J. Lumin. 187 (2017) 535-539.
-

- 2. R. Stefan, L.C. Bolundut, L. Pop, G. Borodi, E. Culea, P. Pascut, J. Non-Cryst. Solids 505 (2019) 9-17.
-
- 3. I. Hussain, E.K. Barimah, Y. Iqbal, G. Jose, R. Muhammad, Trans. Indian Ceram. Soc. 78[3] (2019) 125-130.
-
- 4. W.J. Zhang, Q.J. Chen, Q. Qian, Q.-Y. Zhang. J. Am. Ceram. Soc. 95[2] (2012) 663-669.
-
- 5. P. Babu, K.H. Jang, C.S. Rao, L. Shi, C.K. Jayasankar, V. Lavín, and H.J. Seo, Opt. Express 19[3] (2011) 1836-1841.
-
- 6. F.K. Muhammed, S. Pollington, Y. Liu, Trans. Indian Ceram. Soc. 77[4] (2018) 181-187.
-
- 7. A. de Pablos-Martín, A. Herrmann, C. Patzig, B. Oberleiter, T. Rainer, T. Höche, J. Non-Cryst. Solids 484 (2018) 105-110.
-
- 8. S.E. Elsaka, A.M. Elnaghy. Dent. Mater. 32[7] (2016) 908-914.
-
- 9. W. Holand, G.H. Beall, in “Glass-ceramic technology” (John Wiley & Sons, 2019) p.101.
-
- 10. T.M. Gross, J. Lahiri, A. Golas, J. Luo, F. Verrier, J.L. Kurzejewski, D.E. Baker, J. Wang, P.F. Novak, M.J. Snyder, Nat. Commun. 10[1] (2019) 1-8.
-
- 11. T. Kimura, A. Kato, C. Hotehama, A. Sakuda, A. Hayashi, M. Tatsumisago, Solid State Ionics 333 (2019) 45-49.
-
- 12. T. Benitez, S.Y. Gomez, A.P.N. de Oliveira, N. Travitzky, D. Hotz, Ceram. Int. 43[16] (2017) 13031-13046.
-
- 13. K. Biswas, S. Balaji, D. Ghosh, A. Kalyandurg, Int. J. Appl. Glass Sci. 8[2] (2017) 204-215.
-
 This Article
-
2021; 22(5): 504-509
Published on Oct 31, 2021
- 10.36410/jcpr.2021.22.5.504
- Received on Nov 6, 2020
- Revised on Nov 30, 2020
- Accepted on May 6, 2021
Services
- Abstract
introduction
experimental
results and discussions
conclusions
- Acknowledgements
- References
- Full Text PDF
Shared
Correspondence to
- Jinxin Zou
-
Guizhou Research Institute of Chemical Industry, GuiZhou-550007, China
Tel : +86 18984142735 Fax: 0851-84863159 - E-mail: zoujinxin_hgy@yeah.net
Clean-Energy Research Institute(CRI), Hanyang University, 222, Wangsimni-ro, Seongdong-gu, Seoul, 04763, Korea
E-mail: jcpr@hanyang.ac.kr