


- Sintering and electric conductivity of (Fe,Mn,Sm) codoped CeO2-δ
Ting-Yi Yang, Chieh Chiu and Wen-Cheng J. Wei*
Department of Materials Science and Engineering, National Taiwan University, Taipei, 10617, Taiwan, R.O.C
This article is an open access article distributed under the terms of the Creative Commons Attribution Non-Commercial License (http://creativecommons.org/licenses/by-nc/4.0) which permits unrestricted non-commercial use, distribution, and reproduction in any medium, provided the original work is properly cited.
Two ceria-based samples, Sm0.1Ce0.9O2 (ST00) and Fe0.005Mn0.005Sm0.09Ce0.9O2 (S9HH) were synthesized by EDTA-citrate method to achieve molecular-scale homogeneity. The solubility limits of the (Fe, Mn) dopants were determined by quantitative X-ray diffraction (QXRD). The microstructure of samples after sintering were analyzed by SEM and TEM. The conductivity was measured by 2-probe DC and AC impedance methods. The results showed no solubility limit of Mn and Fe with 5-9 mol% Sm in CeO2. Two ceria-based samples, ST00 and S9HH could be densified at 1,500 oC and 1,250 oC respectively in 1 h to full density. The electrical conductivity results showed that densified 9HH performed higher electrical conductivity at 800 oC, i.e. 7.15 x 10⁻² S·cm-1 with an ionic transference ratio (ti) 0.76 at 600 oC. Sm-segregation near grain boundary was found in SDC, but amorphous submicron-domains in (Fe, Mn, Sm) co-doped grains were responsible for the ease of the sintering at 1,250 oC
Keywords: ceria, sintering, Sm, Fe, Mn
Solid oxide fuel cells (SOFCs) have developed for decades and attracted great attentions from energy development field, due to the high efficiency and wide fuel feasibility. The operating temperatures of SOFCs with zirconia-based electrolytes (e.g. yttria-stable zirconia (YSZ)) are typically between 800 - 1,000 oC. The high operating temperatures limit commercialization and lifetime of the SOFCs, especially on the issues of high thermal stress and possible interfacial reactions after long-term operation [1-4]. Several approaches have been proposed to overcome these problems, such as reducing the thickness of electrolyte [5], replacing the YSZ electrolyte by the materials of higher oxygen ionic conductivity [6, 7], or using an ionic material with electronic and ionic (called “mixed”) conductivity as the cathode [8].
Several potential mixed materials for intermediate-temperature solid oxide fuel cells (IT-SOFCs) with operating temperatures around 600 oC to 800 oC are reported, e.g. rare-earth doped ceria (RDC) [9, 10]. The electrical performance of RDCs at 800 oC is roughly equal to that of YSZ at 1,000 oC [8]. Doping cases in CeO2 electrolyte are reported in literature with samarium (Sm) [8,10], gadolinium (Gd) [11], or co-doped with neodymium (Nd) [12-14], due to the formation of oxygen vacancy The defect reaction is shown below.
where M represents trivalent ions. Each mole of added M2O3 creates one mole of oxygen vacancy VO**, which contributes ionic conductivity of the CeO2.
The ceria-based materials are hardly densified unless the sintering temperature is higher than 1,400 oC [15, 16]. Zhang et al.[17] investigated sintering behavior and electrical properties of multiple doping, i.e. Mn, Fe, and Co, in Ce0.8Gd0.2O2-d. Their results indicated the densification temperature was decreased more than 150 oC after the addition of the transition metal oxides. In addition, they also reported that Fe has the potential to scavenge SiO2 impurity at grain boundary, and improved the electrical conductivity. However, the authors did not clear explain sintering mechanisms and ionic/electronic effect of the co-doped CeO2-based materials.
One possible sintering mechanism of the CeO2 materials is liquid phase sintering. Liquidus curves of ceria with Mn or Fe species have been reported by Wartenberg et al. [18] and the lowest liquidus tempera- ture of CeO2-Fe2O3 or CeO2-Mn3O4 is higher than 1,520 oC.Kilner et al. [19] reported that the sintering behavior of Mn-doped CeO2 by the conventional solid-state method might formed a thin amorphous film between grains,*1) for which no high-resolution images are provided by the authors. But they still claimed that the film reduced the particle friction during the rearrangement stage of the sintering (in first stage of sintering), thus promoting the densification rate of doped CeO2 in the early stage. In addition, the lattice distortion due to the ionic radius mismatch between Mn ions and Ce ions possibly reduced the grain boundary mobility, thus led to a rapid densification and a higher grain boundary resistance.
In the case of Fe-doped GDC, the authors [20, 21] investigated and reported that the solubility of Fe in the as-synthesized CeO2 was as high as 20 mol% if using citric salts and force precipitation method. But a Fe-based phase (hematite, Fe2O3) appeared after aged in hydrogen atmosphere at sintering temperature. In the temperature range of 1,200 oC to 1,600 oC, the actual solid solubility of Fe2O3 in CeO2 might be less than 1 %. They reported that Fe3+ occupied in the interstitial sites of the fluorite CeO2 structure because the radius of Fe3+ was significantly smaller than Ce4+. Small cation (Fe3+ or Mn3+) might perform a solid-state sintering in the GDC, but no direct evidences of the sintering were provided.
Several works have reported that the electrical con- ductivity of co-doped ceria might be higher than that of single-doped ceria due to the increase of configuration entropy and restraining the oxygen ordering in fluorite structure [3, 22-24]. None of those doped CeO2 materials offer solid evidence how the Fe and Mn help the den- sification of SDC, and how the ionic/electric properties are changed.
In this study, (Sm, Fe, Mn) multiple-doped CeO2 are made by an EDTA-citric acid method, to produce mixed electro-ionic CeO2. Two transition oxides, Fe and Mn, of 0.5% are homogeneously added, and used to reduce the sintering temperature and improve the ionic/electronic conductivity of Sm-doped CeO2. Detail high resolution TEM images and related microstructures are conducted, so we are able to investigate the grain boundary and the electrical properties.
Sample preparation
Two Sm-doped powders were synthesized by a modified EDTA-Citric acid method, including 0.5 mol% Mn and 0.5 mol% Fe co-doping in 9 mol% Sm-CeO2 (abbreviated as S9HH2)), and 10 mol% Sm-CeO2 (abbreviated as ST00) for comparison. The chemicals, Ce(NO3)3·6H2O (99.9%, Aurora Applied Materials Co., LTD., Taiwan), Fe(NO3)3·9H2O (99%, SHOWA, Japan), Mn(NO3)3·4H2O (98%, SHOWA, Japan), and Sm2O3 (99.9%, Yung Sung Stoneware Co., LTD., Taiwan) were respectively used as the sources of Ce, Fe, Mn and Sm species. The nitrates were separately dissolved in nitric acid solution according to the stoichiometric ratio of the elements in S9HH and ST00. After diluted by de-ionic water and mixed for 20 min, homogeneous solutions can be obtained. Citric acid (C6H8O7·H2O, 99.5% pure, SHOWA, Japan) and ethylene diamine tetra-acetic acid (EDTA, C10H16N2O8, 99% pure, ACROS, USA) were drop-by-drop added into the precursor solutions. The molar ratio of citric acid, EDTA, total metal ions was kept at 2.0:1.0:1.0. The pH value of the precursor solutions were adjusted to ~7 by ammonium hydroxide solution (NH4OH, 28-30 wt%, J. T. Baker, USA). After mixing, the precursors were heated to 180 oC until the water entirely evaporated to get sticky gels. The gels were then moved to an oven heated at 200 oC to initiate self-combustion. The powders after the self-combustion were calcined at specified temperature for 2 h at a heating rate of 5 oC·min-1 for the following processes and characterization. The calcined powders after sieved were formed into tablet-shape with a diameter of 30.0 mm by a die-pressing method. The pressure of the die-pressing was controlled at 10 kg·cm-2 held for 20 s. The tablet samples were then sintered at various temperatures ranged from 1100 to 1,500 oC for 5 h at a heating rate of 10 oC·min-1.
Characterization
The crystalline phases of the calcined powders ground from pellets were identified by using a X-ray diffractometer (XRD, TTRAX 3, Rigaku, Japan). The Cu Kα radiation (λ = 0.15406 nm) is the X-ray source and operated by the conditions of 20 kV and 300 mA. The microstructures of sintered samples were analyzed by a scanning electron microscope (SEM, JSM 6510, JEOL, Japan) and a field-emission-gun transmission electron microscope (FEG-TEM, FEI Tecnai G2 F30, Philips Co., Netherlands) equipped with EDX. The bulk density was measured by Archimedes’ method. The electrical conductivities were measured by either a two-probe method or AC impedance method by an electrochemical workstation (EIS, ZAHNER IM6eX, Germany) [7, 25, 26]. The applied frequency range was conducted from 100 mHz to 1 MHz. The samples were interconnected with the workstation by Ag wires and Ag paste.
Crystalline phases of (Fe, Mn, Sm) co-doped CeO2 powders
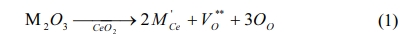
XRD data on Ce0.9(SmxFe0.1-x)O2 and Ce0.9(SmxMn0.1-x)O2 powders calcined at 700 oC for 2 h are shown in Fig. 1(a), that the testing samples in a quantity of ca. 1.0 gm appear only cubic fluorite structure (Fm3m, PDF #34-0394) without any second phases. However, another series, i.e. (Ce1-xFex)O2 with x>0.15 shown in Figs. 1(b) and 1(c) depict one additional diffraction peak at 2 q 35.7o. The impurity phase very likely belong to Fe3O4 (PDF #26-1136). According to the reported in literatures [20, 21], the highest solid-solution limit of Fe species in the CeO2 is less than 10 mol%. But <1 mol% solid solution was reported in literature [27].
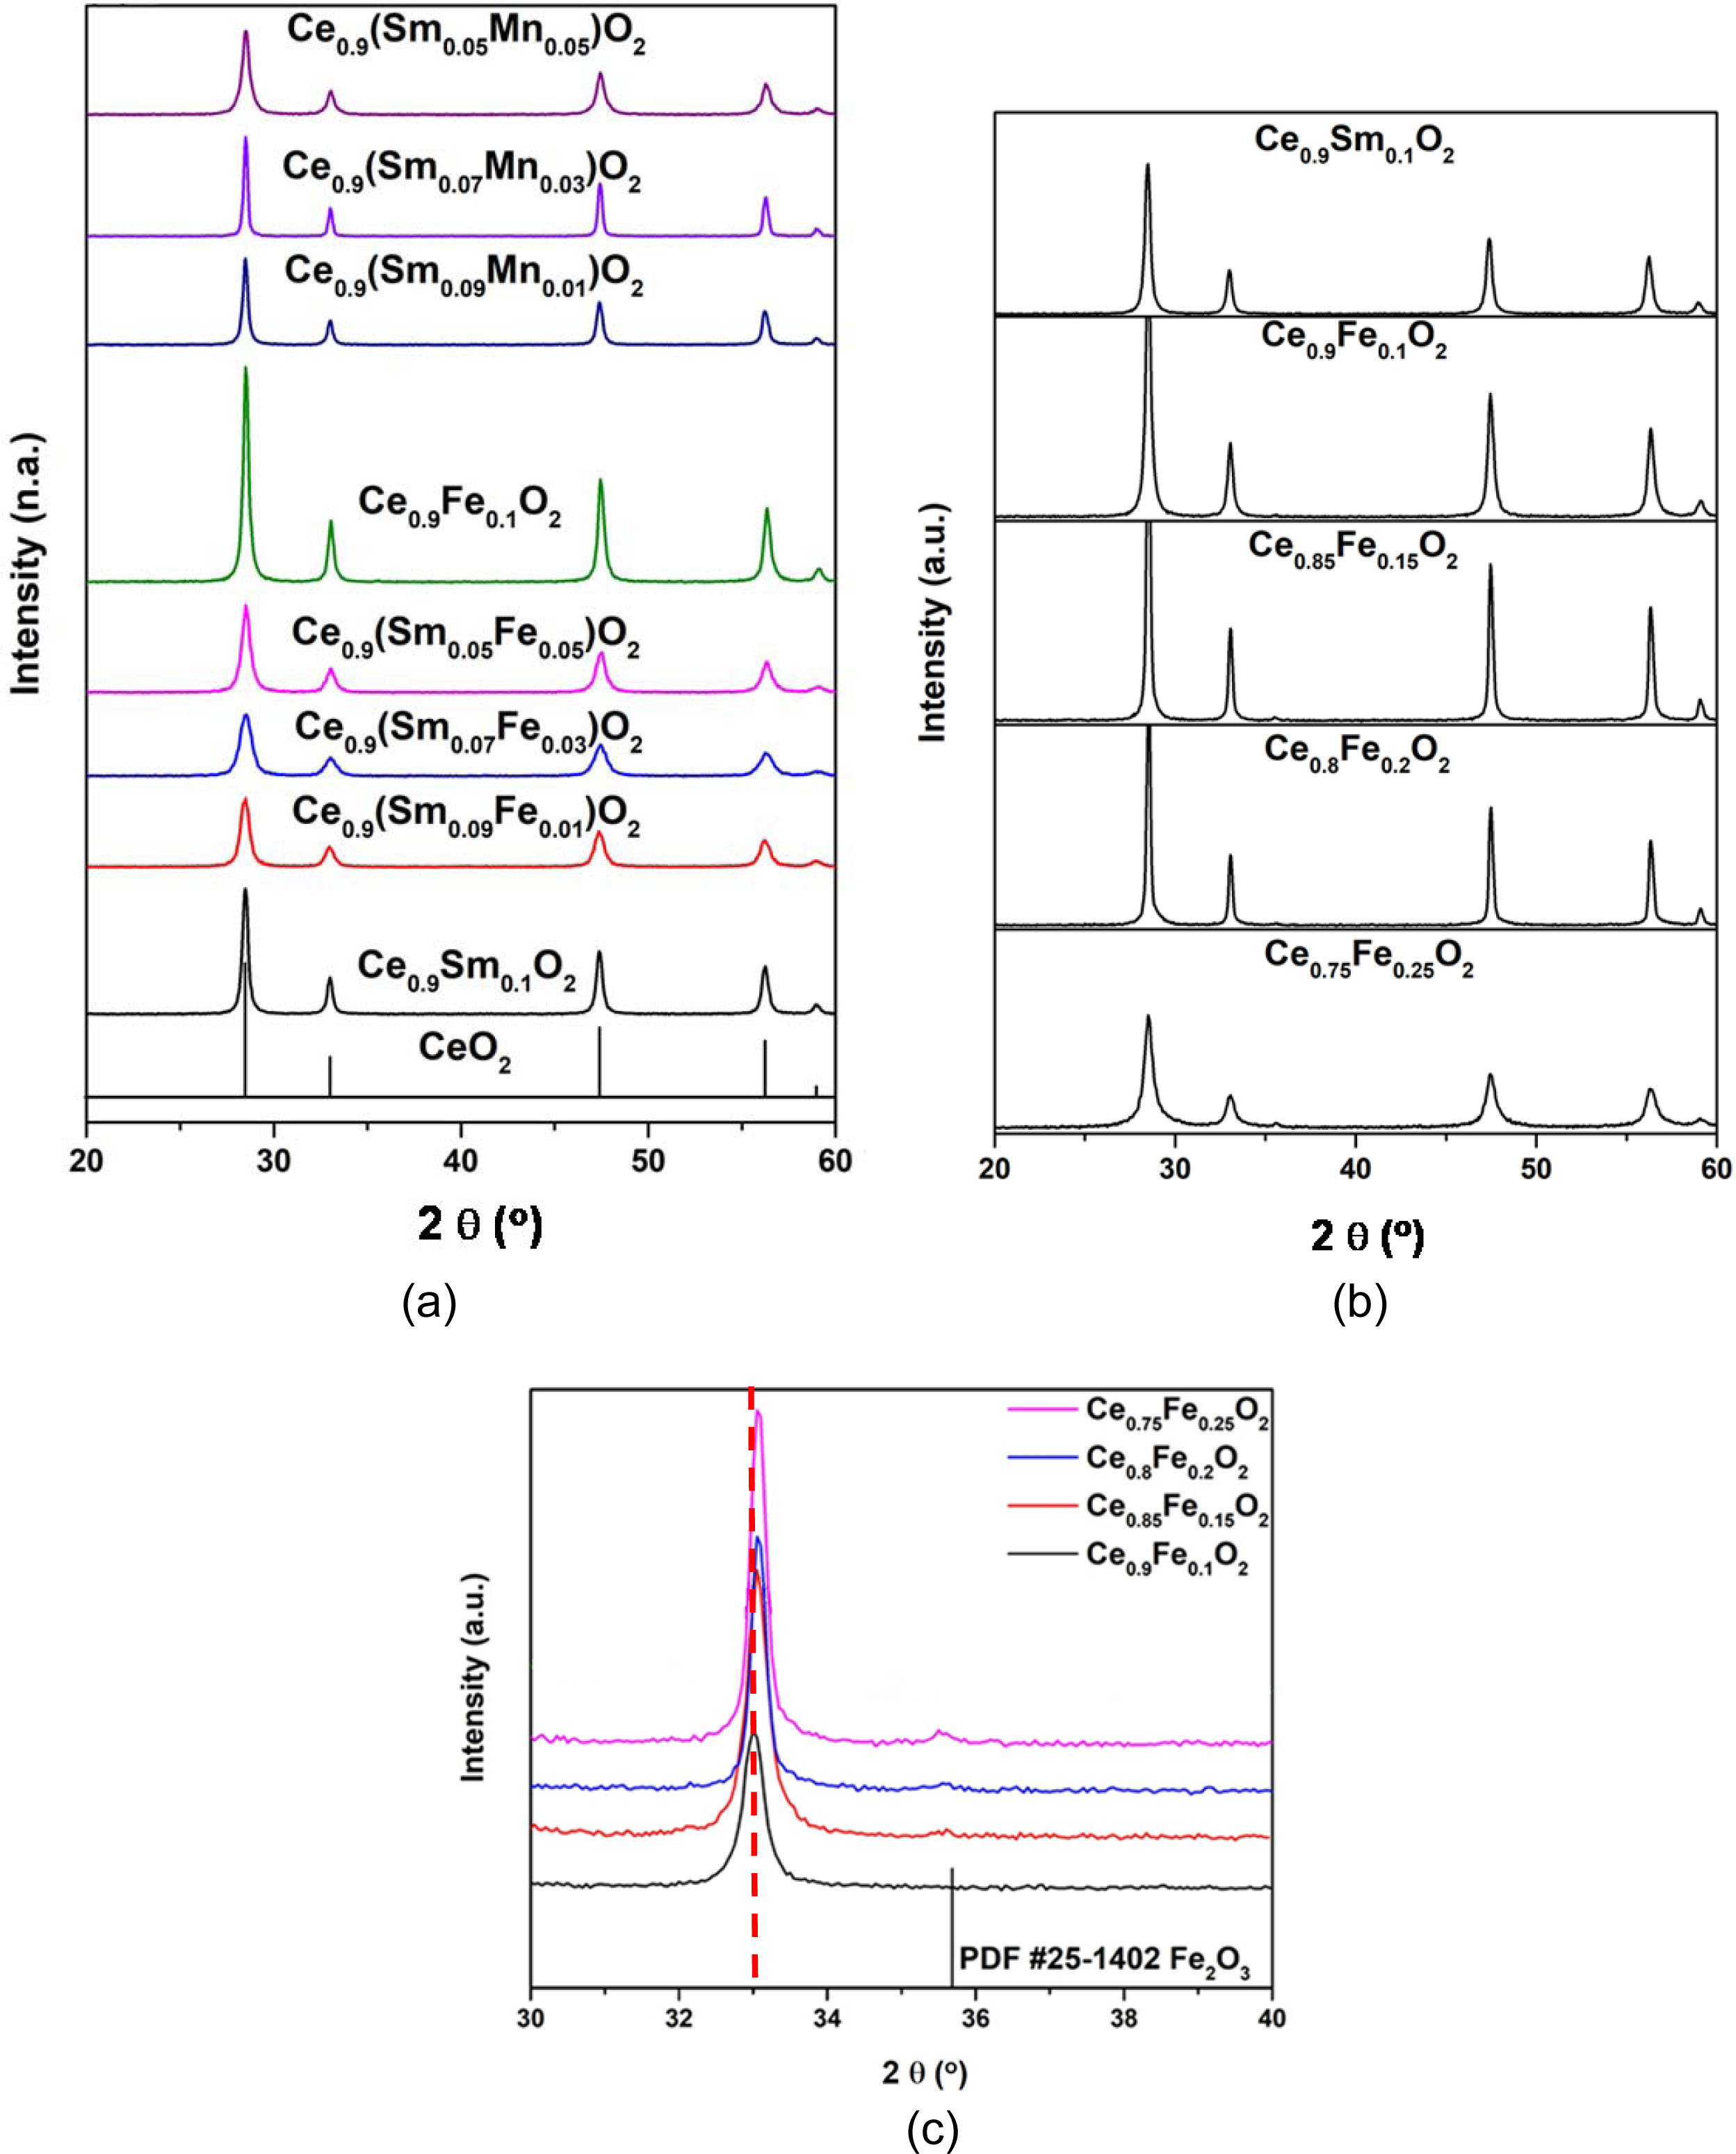
The XRD results of the (Mn,Fe) doped SDC are shown in Fig. 2. The impurity phase of S9HH if calcined at 600 oC was identified as Fe3O4 (PDF #26-1136), but disappeared if calcined at >700 oC. No iron oxide phases were found when ST00 and S9HH were treated at higher temperatures.
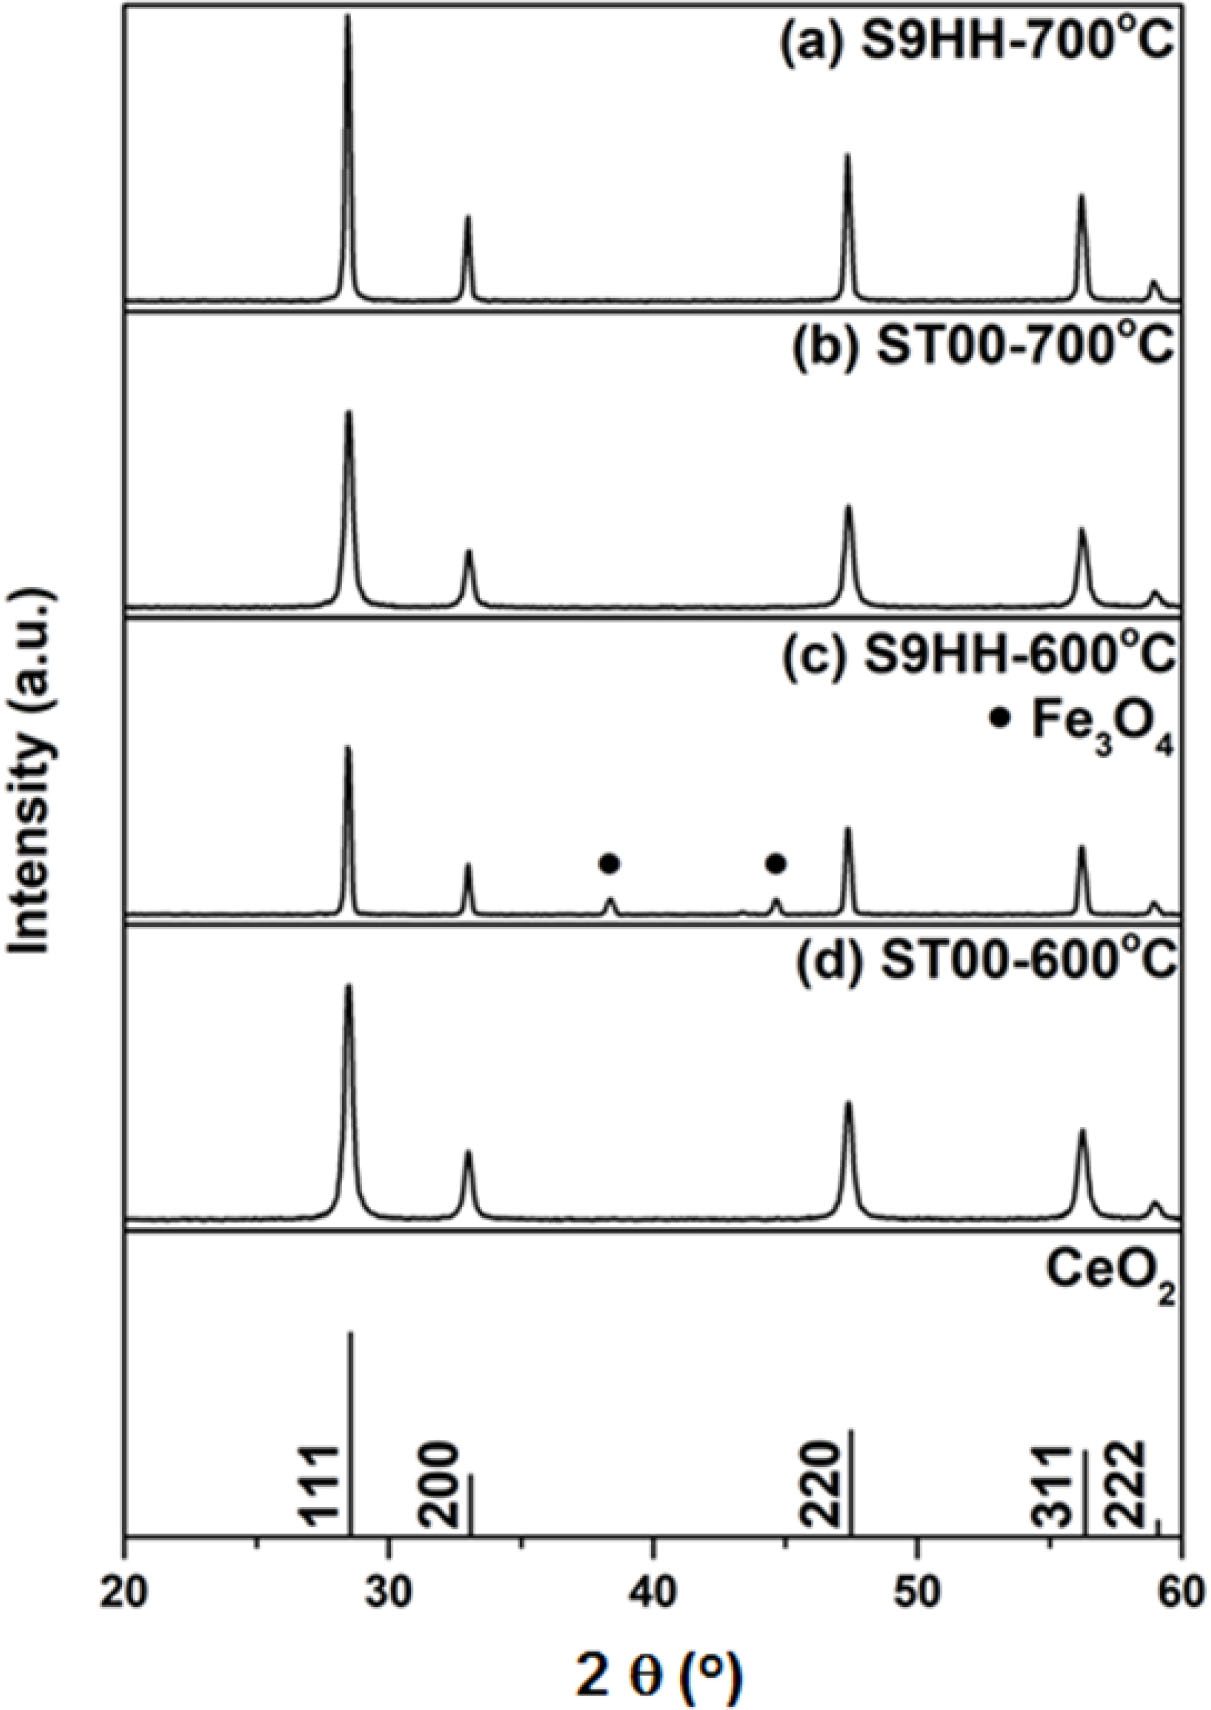
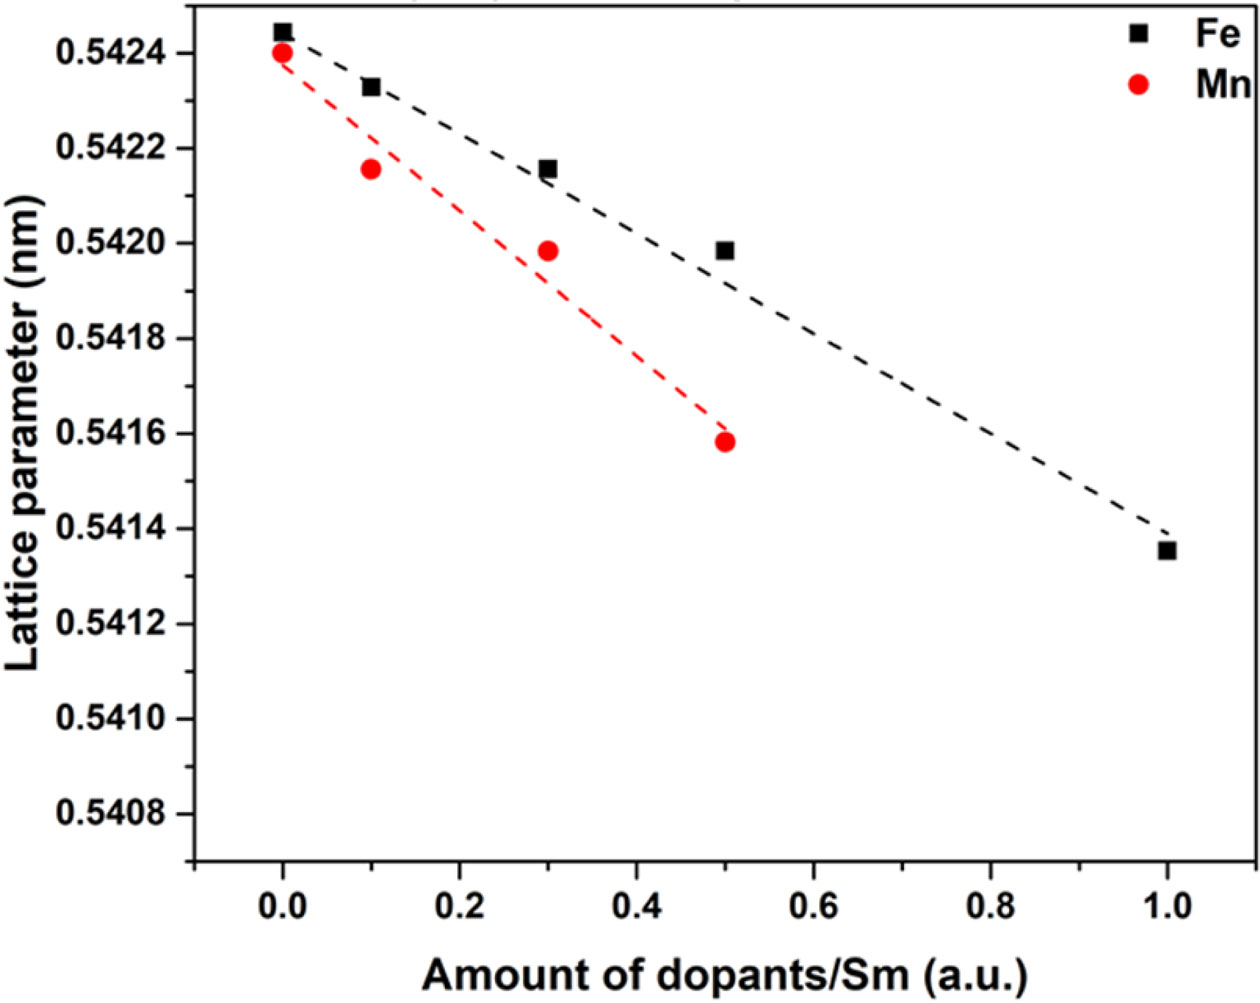
Fig. 3 shows the lattice constant of Ce0.9(SmxFe1-x)0.1O2 and Ce0.9(SmxMn1-x)0.1O2 samples after calcined at 700 oC for 2 h plotted against the ratio of Fe or Mn dopant to SDC. The ionic radius of Ce4+, Fe2+, Fe3+, Mn3+, Sm3+ in octa-coordination to oxygen ions is 0.097 nm, 0.092 nm, 0.078 nm, 0.096 nm, 0.108 nm, respectively [28]. Therefore, 10 mol% Sm in fluorite structure of CeO2 made the lattice constant close to 0.5424 nm, and the constant was gradually decreased as the Fe2+ or Mn3+ replace Sm/Ce in the structure. The results clearly depicted that the lattice constant decreased as the dopant/Sm ratio increased. The ionic radius of Fe and Mn ions are smaller than that of Ce and Sm ions, so 0.5% Fe and 0.5% Mn shall form complete solid solution in 9 mol% Sm-CeO2, and make the lattice slightly shrink accordingly.
Sintering of Co-doped CeO2
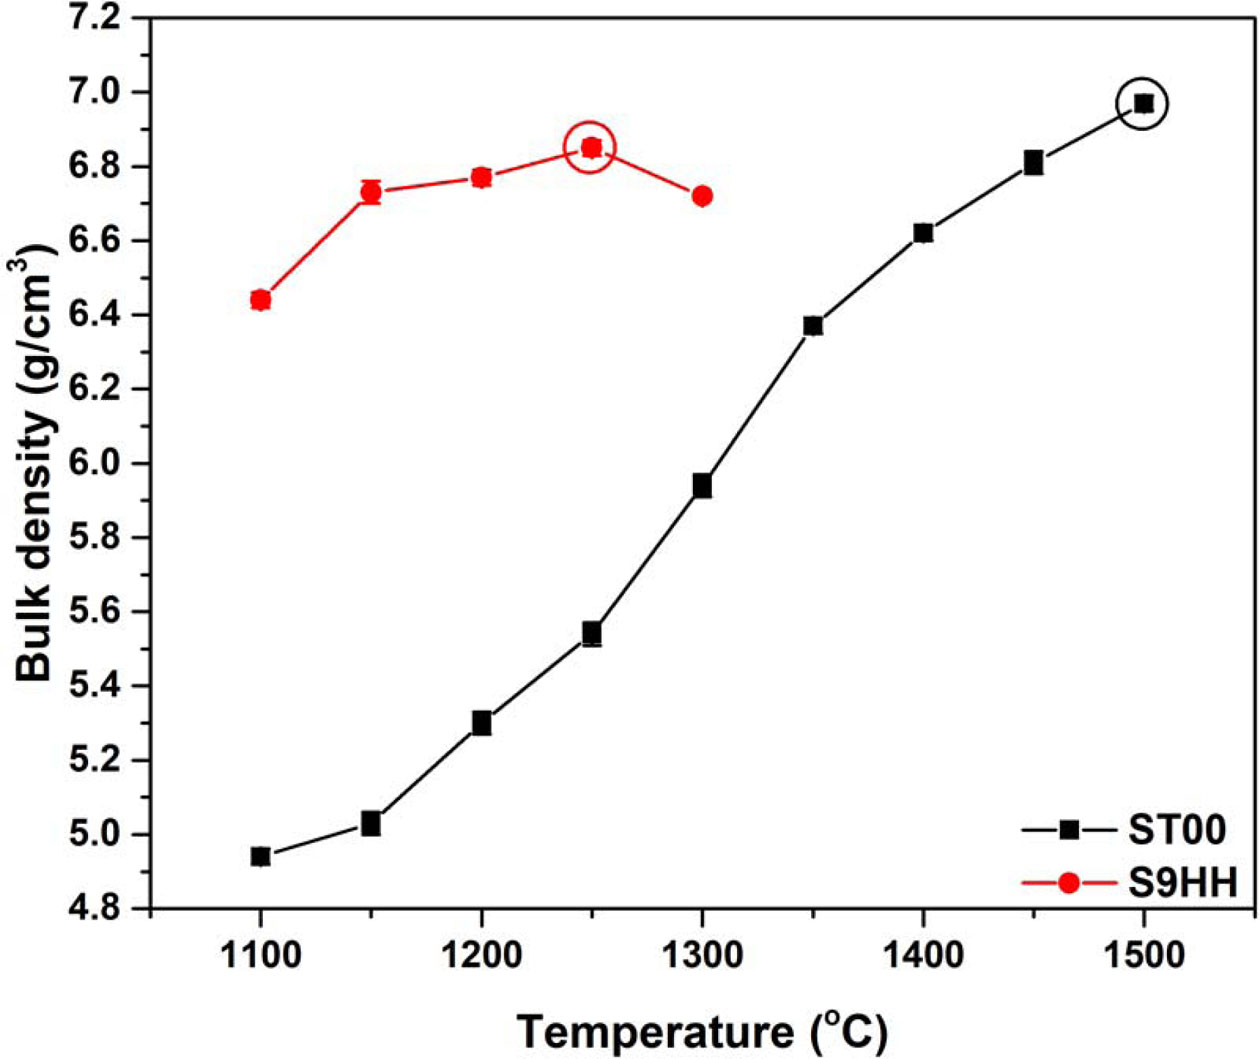
Fig. 4 shows the bulk densities of ST00 and S9HH samples after sintered from 1,100 to 1,500 oC for 5 h. For the ST00 samples, the highest bulk density could be achieved as the sintering temperature up to 1,500 oC. But, the highest bulk density for S9HH samples was achieved at at 1,250 oC. By co-doping the Fe and Mn species into Sm doped CeO2, the sintering temperature was significantly decreased to 1,250 oC.
The densification of Fe and Mn has been reported in literature [29-32]. Both elements are undersized ions to Ce4+. The formation of oxygen vacancies may facilitate defect migration (as Eq. (1)), and retarded grain boundary mobility [32, 33] by a solute-dragging effect when appreciable amount of charged defects/doping ions segregation at grain boundary. Later, more detail micro- structural evidences on the ST00 and S9HH samples will be reported to support the points.
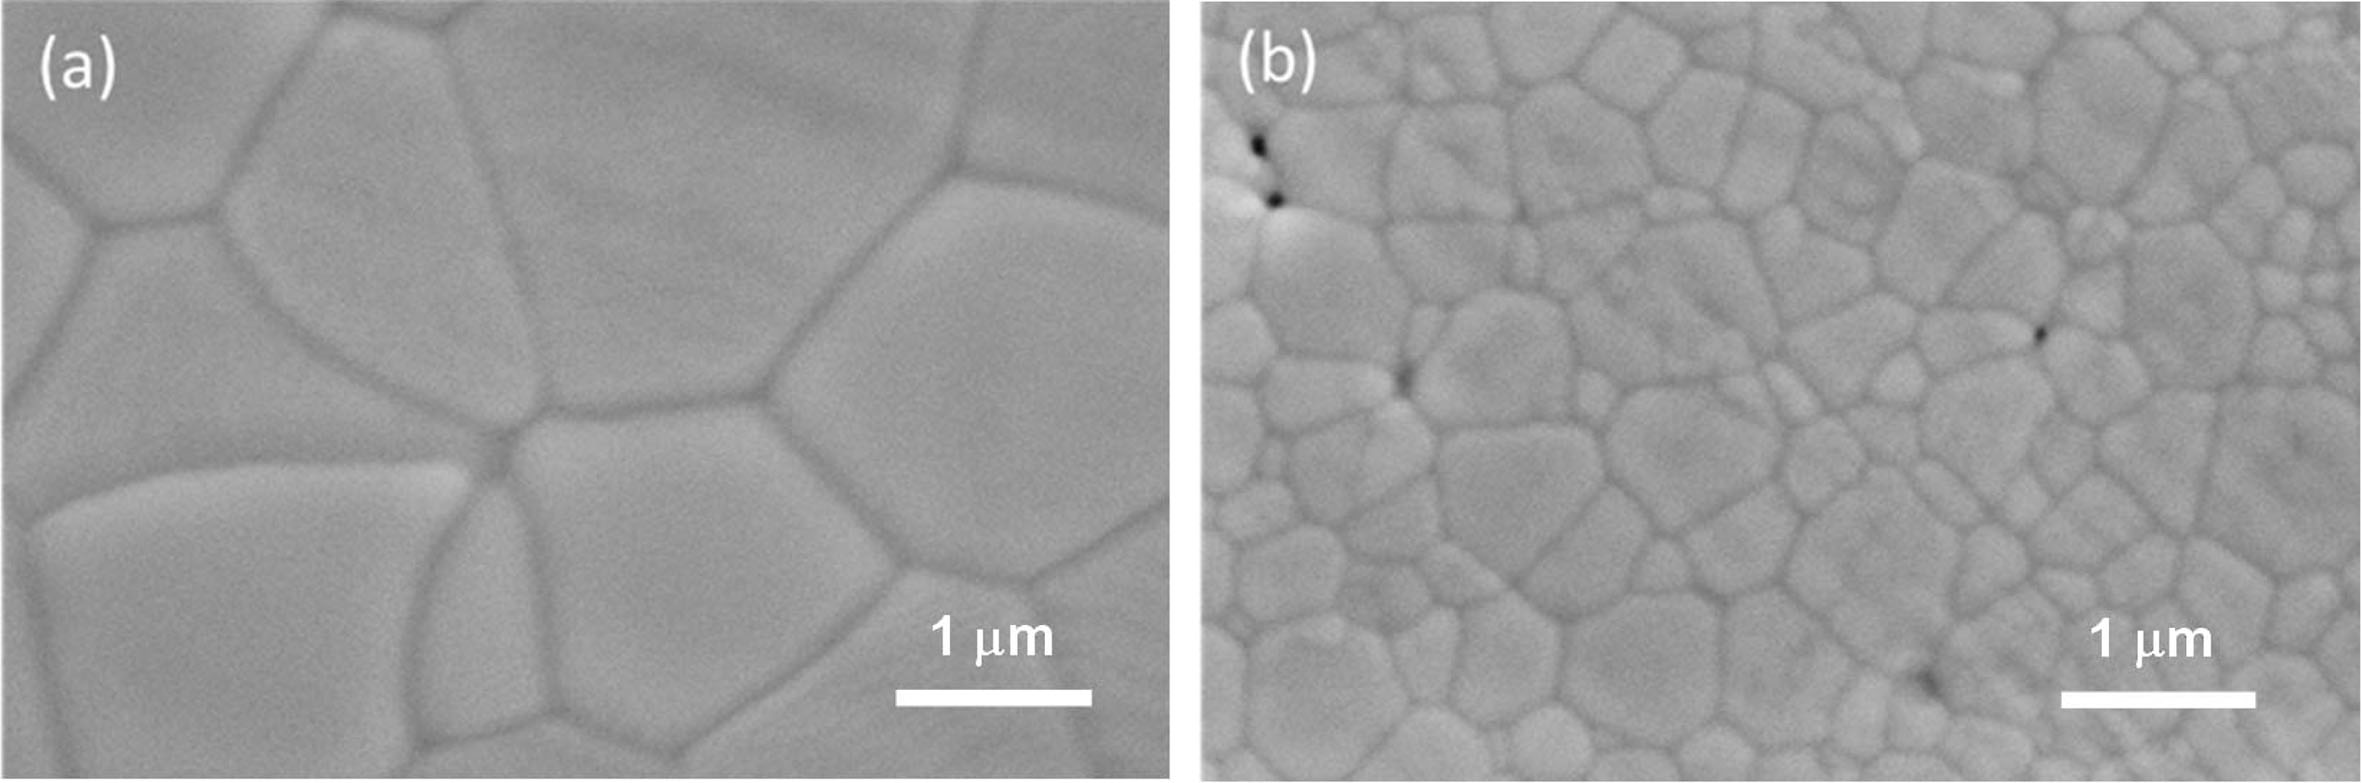
Figs. 5(a) and 5(b) shows the polished and thermally etched surfaces of ST00 after sintered at 1,500 oC for 5 h, and S9HH samples after sintered at 1,250 oC for 5 h. The microstructures of these two samples are almost fully dense. Only a few tiny closed pores been observed. The average grain sizes of the ST00 and S9HH samples calculated from more than 200 grains by a linear intercept method are 2.75 mm and 0.72 mm, respectively.
The theoretical density (T.D.) of ST00 and S9HH calculated from XRD results in Fig. 2 are 7.17 and 7.14 g/cm3, respectively. The relative density (R.D.) of ST00 and S9HH according to the microstructures are determined to be 99.9% T.D and 99.8% T.D, respectively. That are all dense enough for following conductivity tests.
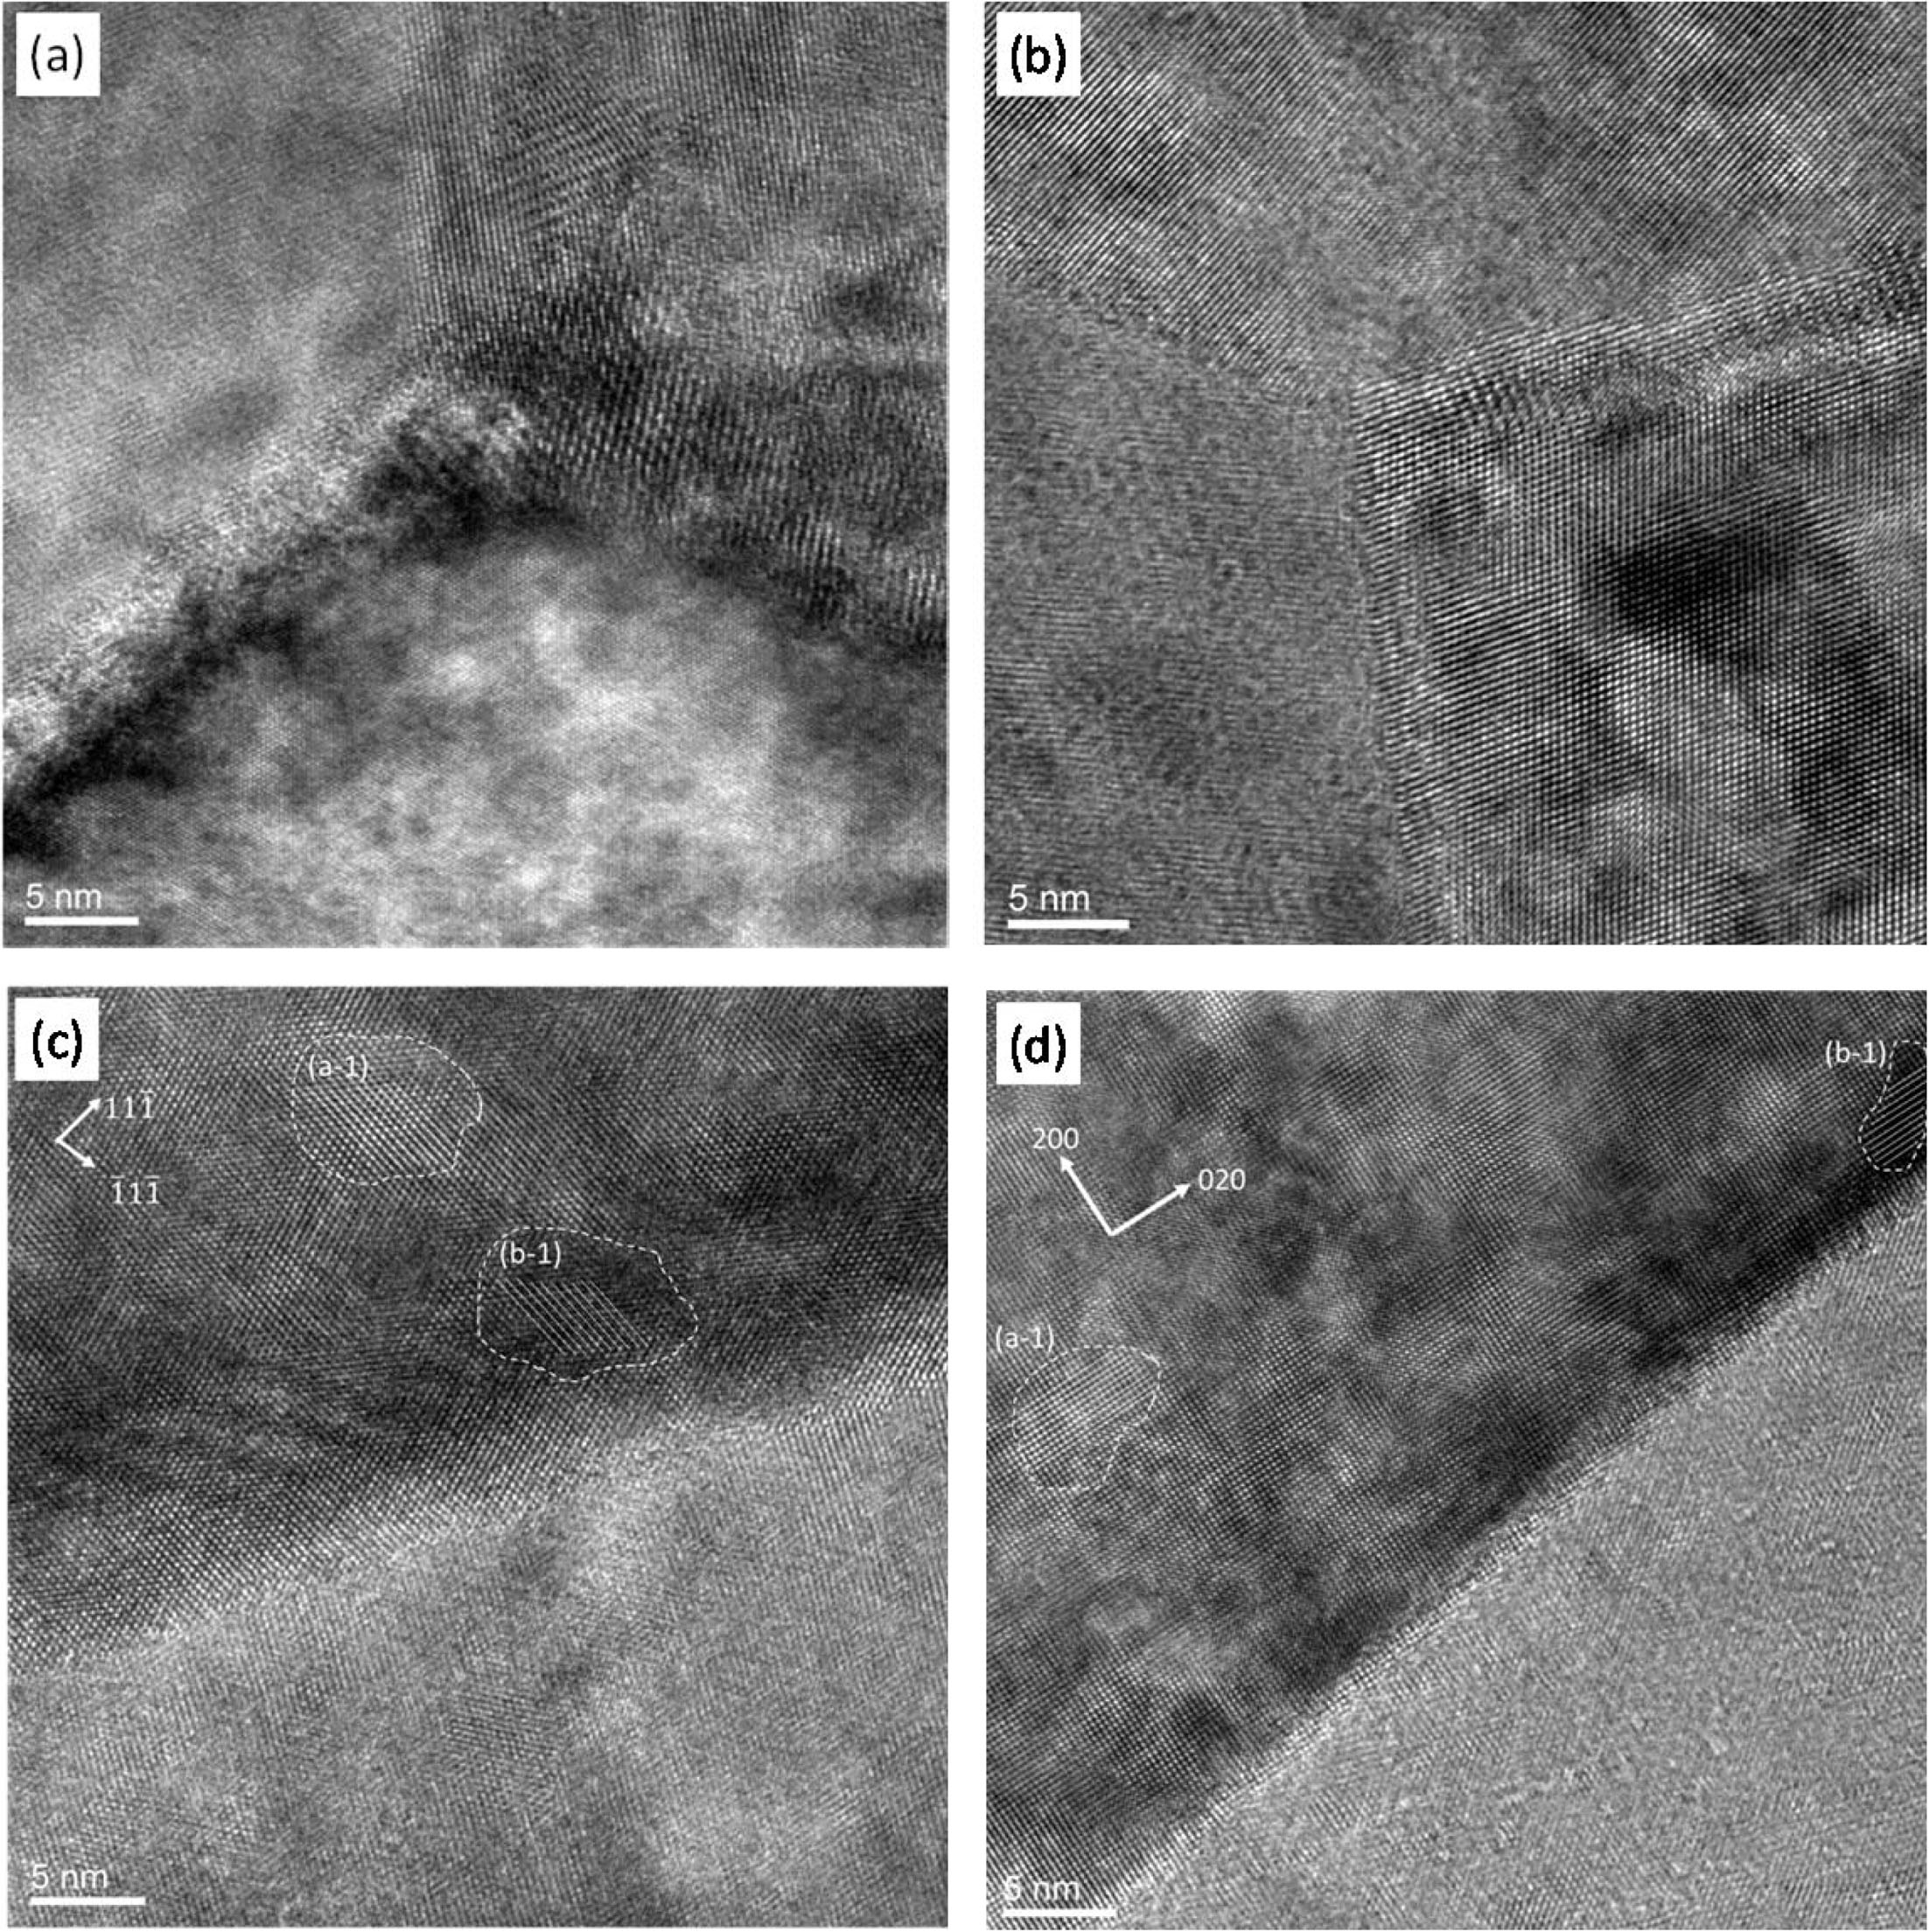
Figs. 6(a) and 6(b) show the High-Resolution TEM (HRTEM) micrographs of triple junction of the grains. The lattice images cross the grain boundaries in both samples show that all grain boundaries were still crystalline. No glassy phase in the grain boundaries and no impurity phases at triple-phase junction regions of ST00 and S9HH samples are found.
The homogeneity of dopant would affect the contrast of High Resolution (HR)-TEM image. The atomic image of the contrast would be attributed mainly by cation atomic number (Z) effect, minor by focusing condition and orientation of the crystal to beam direction [33]. It means that the intensity absorption of transmitted beam is in a sequence of Sm > Ce > Fe > Mn if the other absorption factors are constant. In other words, a darker region in the micrographs tends to contain more Sm.
Figs. 6(c) and 6(d) show the microstructures of grain boundaries of the ST00 and S9HH samples, in which two marked regions are selected to calculate the lattice distances, i.e. (a-1) and (b-1) regions in Fig. 6(c). The distances of the (111) lattice spacing of (a-1) and (b-1) regions are 0.394 and 0.401 nm, respectively. A shorter lattice spacing means a less content of Sm elements. The same analysis step was also executed on aged S9HH sample, as shown in Fig. 6(d). The (100) lattice spacing of the regions (a-1) and (b-1) in Fig. 6(d) is 0.295 and 0.311 nm, respectively. Therefore, the regions with a bright contrast (e.g. (a-1) region) contain the cations of a lower average Z number [34]. Those segregated Sm-rich CeO2 regions are in sizes of ten nm and obviously less significant in the aged S9HH sample. Those nano-scale domains next to grain boundaries are possibly responsible for the decrease of electrical conductivity as it is aged at 650 oC for 500 h.
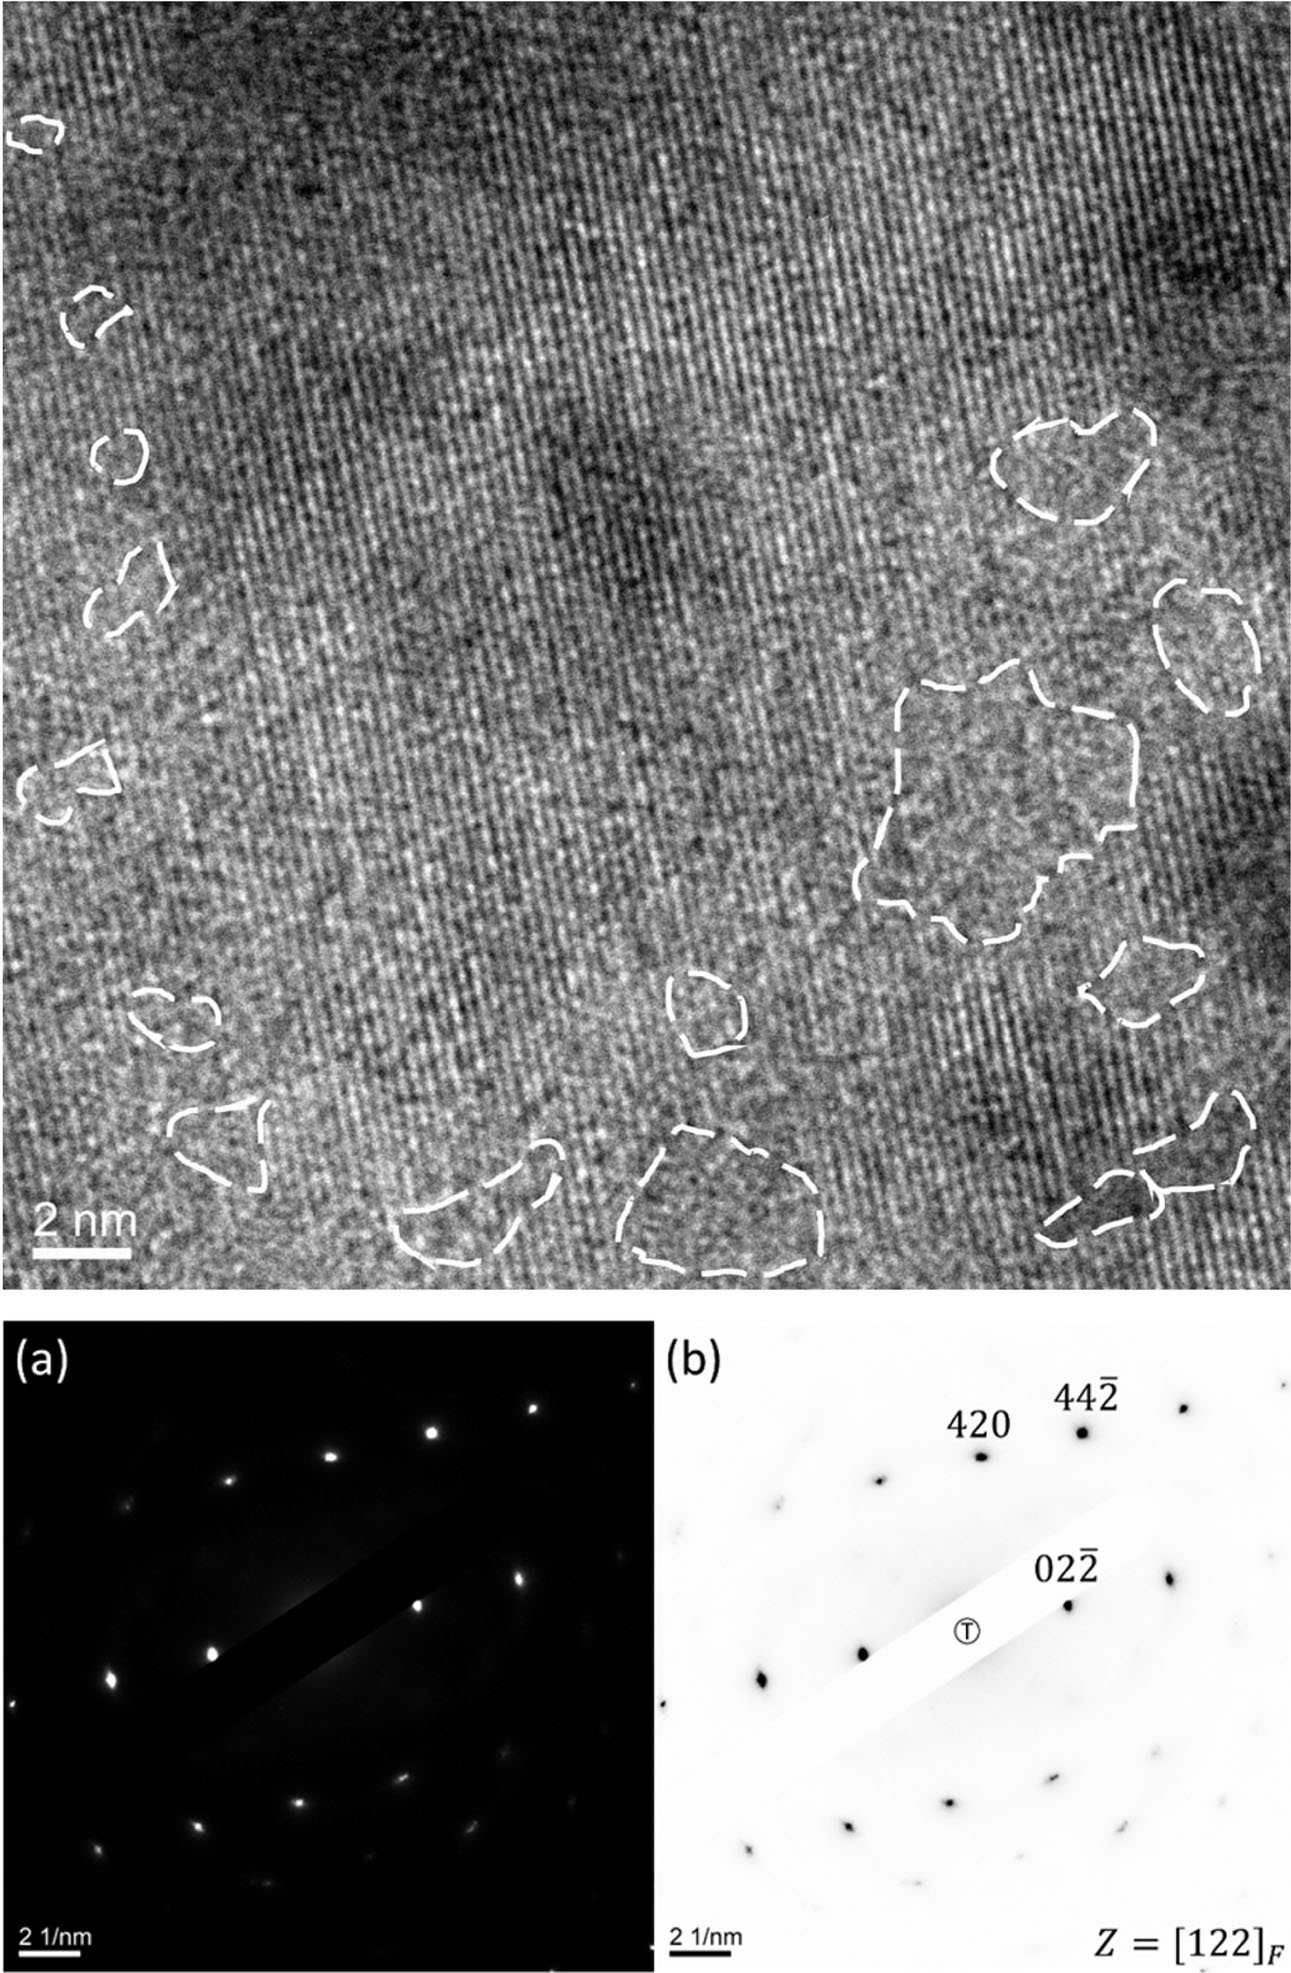
A high resolution TEM images and the diffraction patterns of as sintered 9HH are shown in Fig. 7. There are some nano-domains circled in the lattice image taken from g=(011) vector, appearing non-order structure. In other words, the domains are amorphous [35]. Besides, the lattice is fully of point defects, i.e. oxygen vacancies and the 9HH grain is still a cubic fluorite structure. The diffraction patterns taken from <1 2 2> zone axis or other high index zone*3) are free of extra diffraction spots, implying the structure does not contain any super-lattice.
Electric Conductivity of Fe, Mn, Sm co-doped CeO2
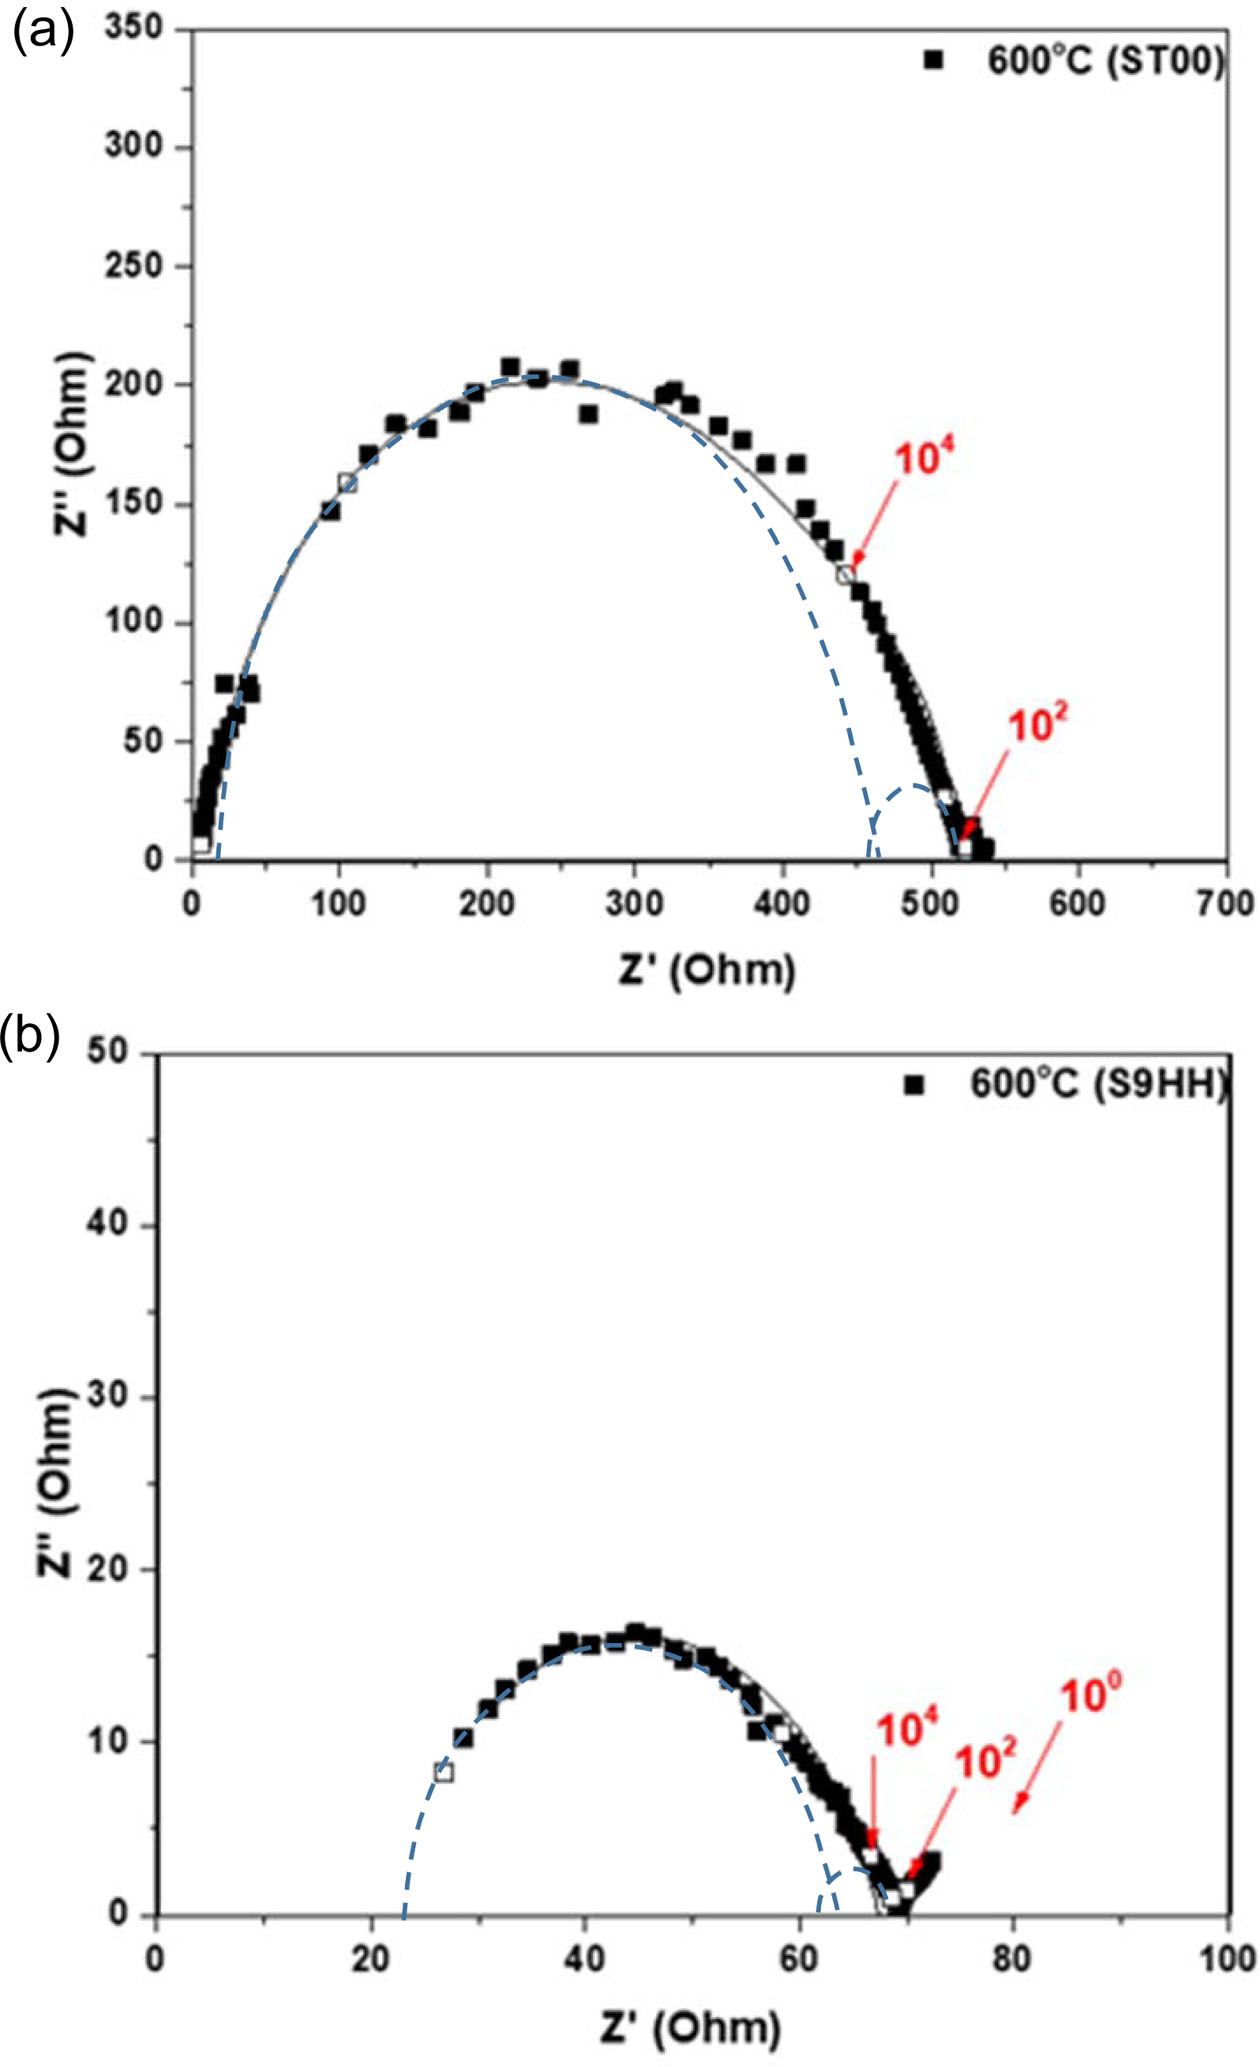
A few typical examples of the Nyquist plots of ST00 and S9HH samples tested at 600 oC in air are shown in Fig. 8. The data were further analyzed using the equivalent circuit model combination of R0-(Rgi/Cgi)-(Rgb/Cgb), where “-” means components in series, “/” means components in parallel. The subscripts of “Rgi”, “Rgb”, and “R0”, represented the resistances from grain interior, grain boundary, and ohmic resistance from electrolyte and electrodes, respectively. The detail resistance results are shown in Table 1, which clearly depict great differences between the SDC and 1% (Fe, Mn) doped SDC. The 9HH shows mixed electro-ionic conductivity, and has a ti value around 0.695.
Fig. 8 shows that the arcs of fittings show imperfect semicircles. The reasons of the depression of semi-circle arcs are attributed by the effects of local charge distribution at pores or impurity phases [1, 2, 4, 36]. The detail results after de-convoluted are shown in Fig. 8, the measured values of the conductivity are shown in Table 2. As the testing temperature increasing, both of the Rgi and Rgb decreased in both ST00 and S9HH samples. That is a typical behavior of ionic conduction.
The brick layer model [36] is introduced to analyze the data from impedance spectroscopy. There are two main microstructural factors in this model, including grain interior and grain boundary. The dot lines in Figs. 8(a) and 8(b) are the deconvoluted data of grain-interior resistance (Rgi) and grain-boundary resistance (Rgb). The fitted values are shown in Table 1. The conductivity at 600-750 oC shows a mixed conductivity (included ionic and electronic conductivity). The ionic transference ti of 9HH is less than 0.826, which is not good to be an electrolyte as YSZ for SOFC.
The resistivity of grain boundary is lesser than that of grain interiors [36]. That can be also confirm from the resistance data of ST00 and S9HH samples in Table 2. As the testing temperature raising, the total resistance (Rt = R0 + Rgi + Rgb) decreases. The total resistance of S9HH sample is much smaller than that of ST00. From the results of grains size calculation in Fig. 4, the grain size in S9HH sample is roughly ten times smaller than that of ST00. Normally, the grain boundary in S9HH sample is less defects than that of ST00 sample. This might be one of the reasons that the electrical (ionic and electronic) performance of S9HH sample is better than ST00 sample.
Effects of aging at 650 oC
The change of grain size after aging at 650 oC for 500 h was not significant, but a degradation of electrical conductivity was found in both samples. The resistance of aged S9HH sample was still smaller than that of correspondent ST00 samples between 400 to 600 oC. In addition, the degradation of electrical conductivity (increase of the resistances) of these two doped CeO2 materials are attributed by both of grain interior and grain boundary resistances.
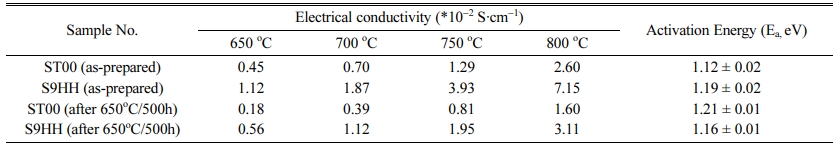
The electrical conductivities of as-prepared ST00 and S9HH samples were 2.60*10-2 S·cm-1 and 7.15*10-2 S·cm-1 at 800 oC, respectively. The electrical conducti- vities of S9HH are higher than that of ST00 in the temperature range. However, the bulk electrical con- ductivities of ST00 and S9HH samples after annealed were lower to 1.60*10-2 S·cm-1 and 3.11*10-2 S·cm-1 at 800 oC, respectively. Both of annealed ST00 and S9HH samples show the conductivity degradation. The electrical conductivity degradation of ST00 samples is worse than that of S9HH samples, which has doped Fe and Mn, possibly due to an increase of mixing entropy. Because the electrical conductivity S9HH after aging is still better than that of as-prepared ST00 sample, the S9HH sample shows a higher potential as an electrode for IT-SOFCs comparing with that of Sm-doped CeO2 (ST00) in long-term utilization.
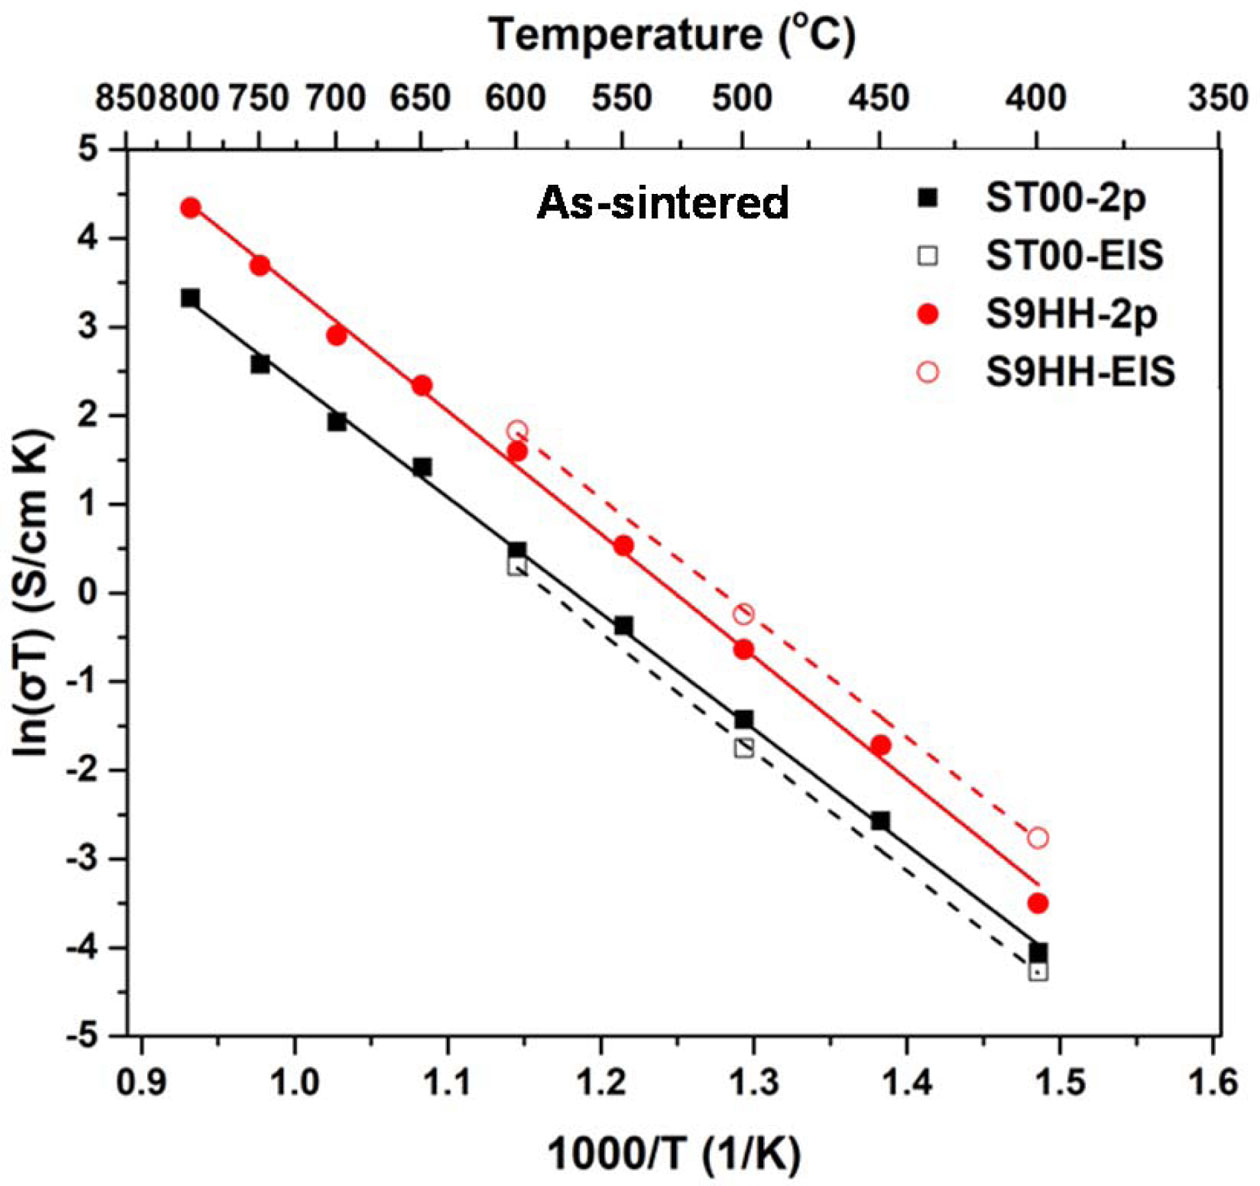
Fig. 9 shows Arrhenius plots of the electrical conduc- tivities of as-prepared ST00 and S9HH. Both, including the data measured either by 2-probe or EIS methods, have a linear dependence to the reciprocal of the tem- perature (1/T). The activation energy of the electrical conductivity of multiple-doped (Sm, Mn, Fe) ceria materials are calculated from the slope of the conductivity lines for the Arrhenius equation [37-40]. The energies of ST00 and S9HH are in the same range of 1.1-1.2 eV, indicating that ST00 and S9HH have the similar con- ductive mechanism (i.e. oxygen vacancy diffusing in CeO2 lattice) at 650-800 °C. The difference of electrical conductivities measured by EIS and two-probe methods is not significant, implying consistency of the conductivity results.
Our previous work [24] has studied the conductivity and cell performance of (Bi, Mn, Fe) co-doped CeO2 material. We reported that the electrical conductivity of Bi-doped CeO2 was 1.3*10-2 S·cm-1 at 800 oC in air, and the conductivity of (Bi, Mn, Fe) co-doped CeO2 was 5.15*10-2 S·cm-1 at 800 oC. The conductivities of two samples are lower than that of this study. The activation energies of Bi-doped CeO2 and (Bi, Mn, Fe) co-doped CeO2 are in the same range of 1.3-1.4 eV, which is higher than 1.1-1.2 eV of this study.
The electrical conductivity is dominated by many factors, such as ionic radius, defect type and structure, and bonding energy in the oxide [40]. Inabaet al.[41] claimed that the optimal ionic radius of doped-ceria material is 0.111 and 0.104 nm for divalent and trivalent cations. The ionic radius of Ce4+, Bi3+, and Sm3+ in octa-coordination is 0.097 nm, 0.117 nm, and 0.108 nm, respectively [28]. The radius of Sm3+ is closer to the optimal radius than Bi3+. Besides, we also reported that the Bi3+ might diffuse to surface and segregate to form γ-Bi2O3 at the surface of Bi-doped CeO2 as a single doped system. The segregation of dopants in Bi- or Sm-added CeO2 might cause the degradation of electrical conductivity.
|
Fig. 1 XRD patterns of (a) Ce0.9(SmxFe1-x)0.1O2 and Ce0.9(SmxMn1-x)0.1O2 samples calcined at 700 oC for 2 h, (b) (CexFe1-x)O2 samples calcined at 700 oC for 2 h, (c) enlarged 2θ between 30~40o in Fig.1(b). |
|
Fig. 2 XRD patterns of ST00 and S9HH powders calcined at 600 oC or 700 oC for 2 h. Note that (c) spectrum appears an impurity phase belonging to Fe3O4. |
|
Fig. 3 Lattice constant of Ce0.9(SmxFe1-x)0.1O2 and Ce0.9(Smx Mn1-x)0.1O2 as a function of the ratio of dopants/Sm in CeO2 powder samples after calcined at 700 oC for 2 h. |
|
Fig. 4 Bulk density of ST00 and S9HH samples after sintered from 1,100 to 1,500 oC for 5 h. |
|
Fig. 5 SEM micrographs of polished samples of (a) ST00 sample after sintered at 1,500 oC for 5 h, and (b) S9HH sample after sintered at 1,250 oC for 5 h. |
|
Fig. 6 HRTEM microstructures of as-prepared samples of (a) ST00, (b) S9HH, and the samples of (c) ST00, (d) S9HH after aged at 650 oC for 500 h |
|
Fig. 7 HRTEM image of S9HH sintered at 1,250 oC for 5 h, (a) is the electron diffraction pattern, (b) indexed patterns of the grain. Note that no supper-lattice and amorphous diffraction pattern are found in the patterns. |
|
Fig. 8 Typical Nyquist plots of as-sintered (a) ST00 and (b) S9HH sample. All samples are tested at 600 oC in air. The dot lines are the deconvoluted data of grain-interior resistance (Rgi) and grainboundary resistance (Rgb). The fitted values are shown in Table 1. |
|
Fig. 9 Electrical conductivity of (a) as-prepared ST00 and S9HH samples, and (b) aged ST00 and S9HH samples as a function of testing temperature. The samples are tested by 2-probe and EIS methods. |
|
Table 1 De-convoluted resistances of as-prepared samples of ST00 and S9HH or after annealed at 650 oC for 5 h from the AC impedance analysis |
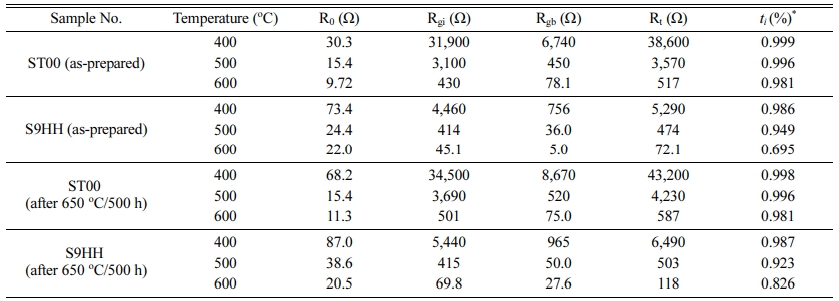
*Note: ti (%) = (Rt - Ro)/Rt] x100% and Rt= Ro+ Rgi+Rgb |
|
Table 2 Electrical conductivities of the as-prepared samples of ST00 and S9HH and after aged at 650oC for 500 h tested by the 2-probe method |
Two doped CeO2 powders, including Ce0.9Sm0.1O2 (ST00) and Ce0.9Sm0.09Fe0.005Mn0.005O2 (S9HH), were prepared by EDTA-citric acid method to achieve good homogeneity. After calcined, both remained a cubic fluorite structure and kept within solid solution limit. Nearly dense S9HH disc is obtained by sintering at 1,250 oC for 5 h, of which the sintering temperature to full density decreased about 250 oC than that of ST00 (10%Sm-doped CeO2). The single-doped ceria (e.g. ST00) also achieves a high density after sintered at 1,500 oC for 5 h. The sintering mechanism of S9HH is possible by reducing the grain boundary mobility when the boundary is dragged by Fe and Mn solute at the sintering temperatures.
The electrical conductivities of ST00 and S9HH have a linear dependence to the reciprocal of the temperature (1/T). The sample of S9HH exhibits relative higher electrical conductivity and a low ionic ratio (ti < 0.75) than ST00. The activation energies of both ceria-based materials are around 1.10-1.20 eV between 400-800 oC, indicating similar mechanism of oxygen ionic conductivity. The sintered S9HH sample having a higher electrical conductivity is attributed by mixed-ionic and electronic conduction.
The authors gratefully acknowledge the financial support from the Ministry of Science and Technology (MOST), Taiwan through contract No. 107-2221-E-002-019-MY2.
- 1. Z. Gao, X. Liu, B. Bergman, and Z. Zhao, J. Power Sources 208 (2012) 225-231.
-

- 2. Y.-C. Wu, C.-H. Chien, and G. Xu, Ceram. Int. 43 (2017) S747-S757.
-
- 3. Y.-C. Wu and Y.-Y. Liao, Int. J. Hydrogen Energy 41[31] (2016) 13591-13602.
-
- 4. S. Ramesh and K.C.J. Raju, Int. J. Hydrogen Energy 37[13] (2012) 10311-10317.
-
- 5. N.Q. Minh, J. Am. Ceram. Soc. 76[3] (1993) 563-588.
-
- 6. S.C. Singhal and H. Iwahara, in “Solid Oxide Fuel Cells” (Elsevier, 1993) p.665-677.
-
- 7. Y.-Y. Chen and W.-C.J. Wei, Solid State Ionic 177[3-4] (2006) 351-357.
-
- 8. H. Li, C. Xia, M. Zhu, Z. Zhou, and G. Meng, Acta Mater. 54[3] (2006) 721-727.
-
- 9. D.R. Ou, T. Mori, F. Ye, M. Takahashi, J. Zou, and J. Drennan, Acta Mater. 54[14] (2006) 3737-3746.
-
- 10. M. Kahlaoui, A. Inoubli, S. Chefi, A. Kouki, A. Madani, and C. Chefi, Ceram. Int. 39[6] (2013) 6175-6182.
-
- 11. B. Li, Y. Liu, X. Wei, and W. Pan, J. Power Sources 195[4] (2010) 969-976.
-
- 12. M. Dudek, A. Rapacz-Kmita, M. Mroczkowska, M. Mosiałek, and G. Mordarski, Electrochim. Acta, 55[14] (2010) 4387-4394.
-
- 13. B. Li, X. Wei, and W. Pan, 35[7] (2010) 3018-3022.
-
- 14. Z. Tianshu, P. Hing, H. Huang, and J. Kilner, Solid State Ionics, 148[3-4] (2002) 567-573.
-
- 15. X. Zhang, C. Decès-Petit, S. Yick, M. Robertson, O. Kesler, R. Maric, and D. Ghosh, J. Power Sources, 162[1] (2006) 480-485.
-
- 16. H. Yoshida and T. Inagaki, J. Alloys Compd. 408-412 (2006) 632-636.
-
- 17. T.S. Zhang, J. Ma, Y.J. Leng, S.H. Chan, P. Hing, and J.A. Kilner, Solid State Ionic 168[1-2] (2004) 187-195.
-
- 18. H.V. Wartenberg and K. Eckhardt, Z. Anorg. Allg. Chem. 232[2] (1937) 179-187
-
- 19. T. Zhang, P. Hing, H. Huang, and J. Kilner, Mater. Lett. 57[2] (2002) 507-512.
-
- 20. H. Lv, H. Tu, B. Zhao, Y. Wu, and K. Hu, Solid State Ionics 177[39-40] (2007) 3467-3472.
-
- 21. M.O. Mazan, A.F. Craievich, E.B. Halac, M.C.A. Fantini, D.G. Lamas, and S.A. Larrondo, Ceram. Int. 41[10] (2015) 13721-13730.
-
- 22. Y.-C. Wu and Y.-Y. Liao, J. Electroceramics, 38 (2017) 81-91.
-
- 23. Y.-C. Wu and C.-C. Lin, Int. J. Hydrogen Energy 39[15] (2014) 7988-8001.
-
- 24. Y.-H. Cheng and W.C.J. Wei, J. Ceram. Proc. Res. 20[2] (2019)198-203
-
- 25. P.-S. Cho, Y.H. Cho, S.-Y. Park, S.B. Lee, D.-Y. Kim, H.-M. Park, G. Auchterlonie, J. Drennan, and J.-H. Lee, J. Electrochem. Soc. 156[3] (2009) B339-B344.
-
- 26. P.-S. Cho, S.B. Lee, Y.H. Cho, D.-Y. Kim, H.-M. Park, and J.-H. Lee, J. Power Sources 183[2] (2008) 518-523.
-
- 27. P. Singh and M.S. Hegde, J. Solid State Chem. 181[12] (2008) 3248-3256.
-
- 28. R. Shannon, Acta Cryst. A 32[5] (1976) 751-767.
-
- 29. T.S. Zhang, J. Ma, Y.J. Leng, S.H. Chan, P. Hing, and J.A. Kilner, Solid State Ionic 168[1-2] (2004) 187-195.
-
- 30. Z. Tianshu, P. Hing, H. Huang, and J.A. Kilner, Mater. Sci. Eng. B 83[1-3] (2001) 235-241.
-
- 31. Z. Tianshu, P. Hing, H. Huang, and J.A. Kilner, J. Mater. Sci. 37[5] (2002) 997-1003.
-
- 32. J.-E. Hong, S. Ida, and T. Ishihara, Solid State Ionic 262 (2014) 374-377.
-
- 33. J.W. Cahn, Acta Met. 10[9] (1962) 789.
-
- 34. M.I. Mendelson, J. Am. Ceram. Soc. 52[8] (1969) 443-446.
-
- 35. Y.-W. Bai, in “Scientific forensics of Ru-porcelain” (National Taiwan University, 2018) p.97-100.
- 36. D.B. Williams and C.B. Carter, in “Transmission Electron Microscopy: A Textbook for Materials Science” (Springer, 1996) p.40-75.
- 37. G.M. Christie and F.P.F. van Berkel, Solid State Ionic 83[1-2] (1996) 17-27.
-
- 38. X. Guo, and R.-Z. Yuan, Solid State Ionic 80[1-2] (1995) 159-166.
-
- 39. E. Barsoukov and J.R. Macdonald, in “Impedance Spec- troscopy: Theory, Experiment, and Applications” (John Wiley & Sons, 2018) p.122-205.
-
- 40. C.-C.T. Yang, W.-C.J. Wei, and A. Roosen, Mater. Chem. Phys. 81[1] (2003) 134-142.
-
- 41. H. Inaba, and H. Tagawa, Solid State Ionic 83[1-2] (1996) 1-16.
-
 This Article
-
2021; 22(5): 490-498
Published on Oct 31, 2021
- 10.36410/jcpr.2021.22.5.490
- Received on Aug 8, 2020
- Revised on Jun 9, 2021
- Accepted on Jul 17, 2021
Services
- Abstract
introduction
experimental
results and discussion
conclusions
- Acknowledgements
- References
- Full Text PDF
Shared
Correspondence to
- Wen-Cheng J. Wei
-
Department of Materials Science and Engineering, National Taiwan University, Taipei, 10617, Taiwan, R.O.C
Tel : +886-2 33661317 Fax: +886-2 23634562 - E-mail: wjwei@ntu.edu.tw
Clean-Energy Research Institute(CRI), Hanyang University, 222, Wangsimni-ro, Seongdong-gu, Seoul, 04763, Korea
E-mail: jcpr@hanyang.ac.kr