


- Synthesis of Ce2O3 and characterization of hydrogen insertion using neutron diffraction and spectroscopic methods
Ki-Woong Chaea, Ta-Ryeong Parkb and Jeong Seog Kima,*
aDept. of Materials Science and Engineering, Hoseo University, Asan, Chungnam 31499, Korea
bDept. of Display Engineering, Hoseo University, Asan, Chungnam 31499, KoreaThis article is an open access article distributed under the terms of the Creative Commons Attribution Non-Commercial License (http://creativecommons.org/licenses/by-nc/4.0) which permits unrestricted non-commercial use, distribution, and reproduction in any medium, provided the original work is properly cited.
The catalytic activity of ceria originates from oxygen vacancies. Ce2O3 is the most oxygen-deficient end-member of non-stoichiometric ceria, CeO2-x. A new method of synthesizing air-stable Ce2O3 from the micron- and nano-sized CeO2 powder was developed. The key part of this synthetic process is to reduce the sample in a low-pressure H2 gas (10 Torr) under vacuum at 1300°C. The percentage of the Ce2O3 phase in the reduced sample ranges from 55% ~ 96 wt.% according to the powder size and reduction time. Hydrogen incorporation in reduced ceria was confirmed by secondary ion mass spectrometry depth profile analysis and vibrational spectroscopic techniques, such as Raman and Fourier transform infrared spectroscopy. The surface region (zero depth) showed the highest H concentration that decreased with increasing profiling depth. The locations of hydrogen incorporated in the Ce2O3 phase in the reduced sample were revealed by calculating the nuclear density distribution. The maximum entropy method-based pattern fitting and Dysnomia program were combined to calculate the nuclear density map using the neutron diffraction data
Keywords: ceria, hydrogen insertion, structural analysis, nuclear density distribution, spectroscopy
Interaction of hydrogen with CeO2-x is an area of increasing importance as the interest in low-cost hydrogen production and cost-effective catalysts to replace the Pt-based catalysts increases [1-4]. Water splitting (2H2O → 2H2 + O2) and water-gas shift (CO + H2O → CO2 + H2) reactions are typical potential applications of ceria-based catalysts. Ceria has remarkable applications in diverse fields, such as hydrogen storage [5], hydrogenation of organic alkynes [6], photocatalysts [7, 8], oxygen ion electrolyte for solid oxide fuel cells [9-11], and three-way catalysts (oxygen storage capacity) [12-15] for automobiles.
Oxygen vacancies near the ceria surface play a key role in the catalytic reactions involved in the above-mentioned fields [3, 16-19]. Because the free-surfaces of CeO2 thin films and particles are a defective layer, where Ce-O, O-O bonds are terminated, they provide a catalytically active state [3, 15, 19]. For example, surface oxygen vacancies provide a pathway for H2 production through oxygen uptake from water molecules during the water-gas shift reaction. With increasing oxygen deficiency in nonstoichiometric CeO2-x, the cubic structure at x = 0 (space group (SG) Fm3m) undergoes a phase transition to intermediates, such as Ce11O20 (triclinic), Ce7O12 (rhombohedral), CeO1.68 (Cubic, SG Ia3), and Ce2O3 (trigonal, SG P-3m1) in accordance with oxygen-vacancy ordering. The end member (x=0.5, Ce2O3) is the most oxygen deficient, and the Ce3+ ion in the structure is coordinated by seven O2- ions instead of eight O2- in cubic CeO2 [20].
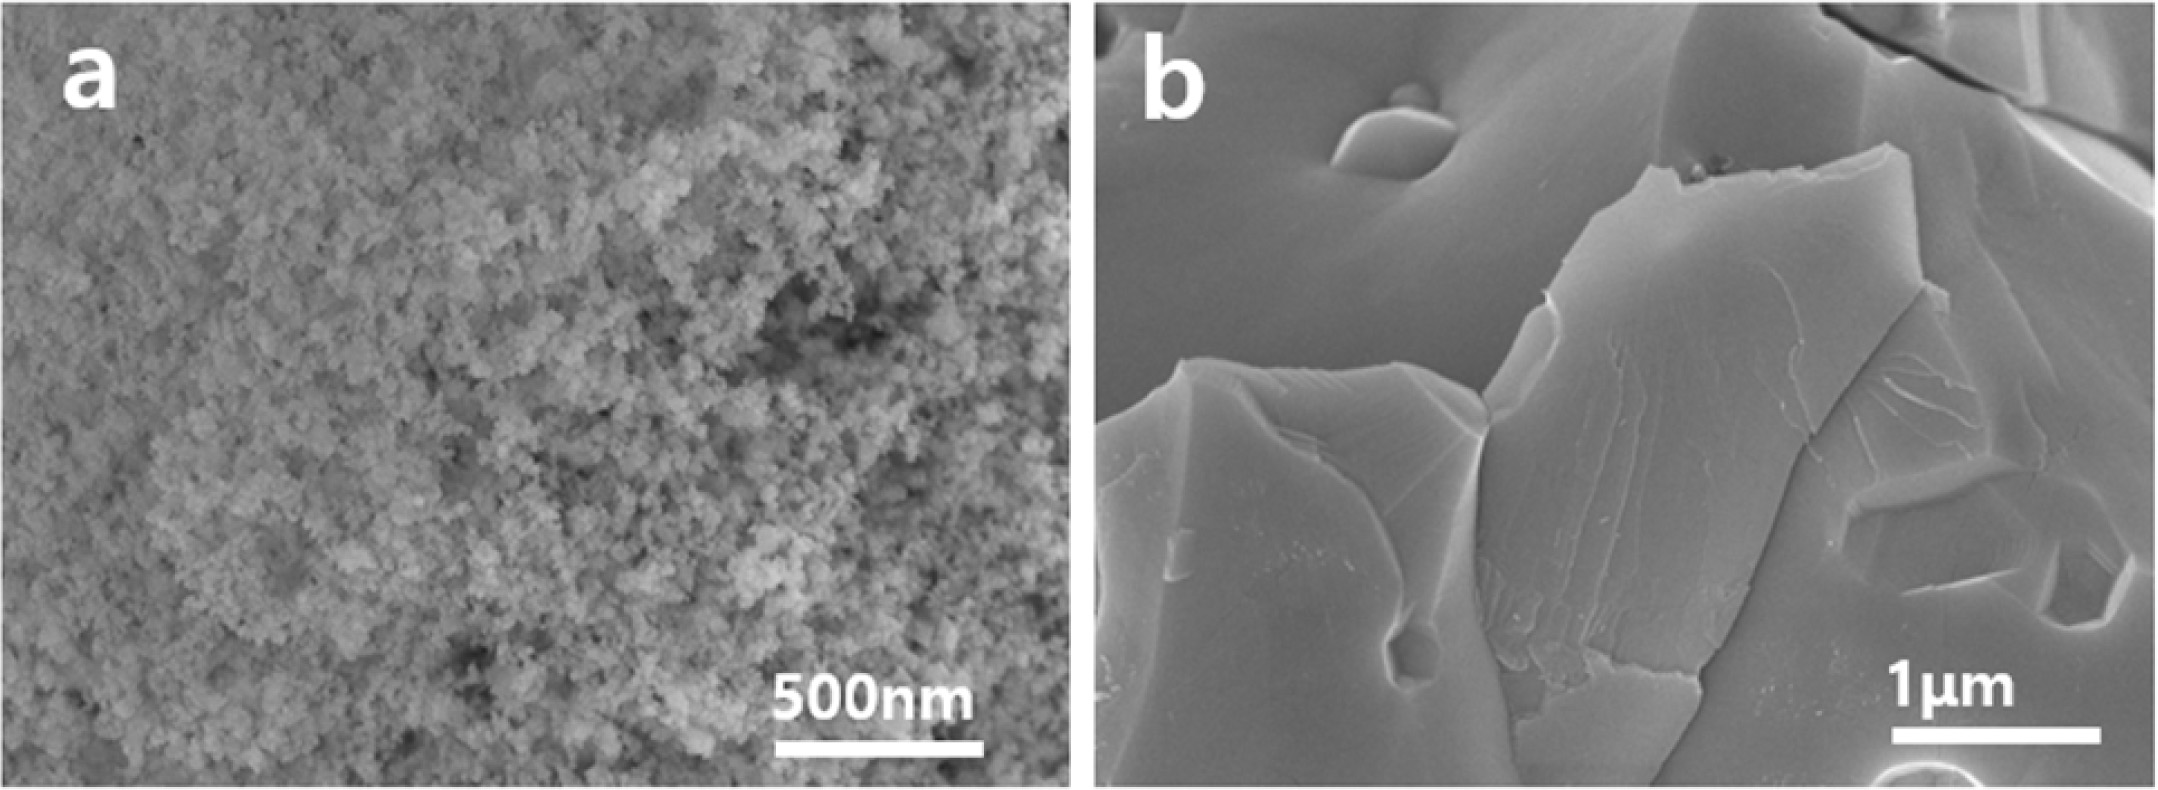
The end member Ce2O3 can have a very strong catalytic activity because the catalytic activity originates from oxygen vacancies. Indeed, Ce2O3 has potential applications in several fields, such as hydrogen produc- tion and hydrogenation reactions of organic alkynes to alkenes [3, 21-23]. Matz et al. [21] and García-Melchor et al. [23] carried out density-functional theory (DFT) calculations for H2 dissociation on Ce2O3 surfaces. The energy barrier for H2 dissociation on Ce2O3 surfaces was significantly lower than that on the CeO2 surfaces. Dvorák et al. [3] carried out experimental and ab initio calculations of the role of the oxygen vacancies on epitaxial film surfaces of CeO2-x (x = 0~0.5) during the water-splitting reaction. They observed a tremendous increase in hydrogen production on Ce2O3 surfaces. The ordered oxygen vacancies in Ce2O3-incorporate massive hydroxyl groups (OH) and emit H2 after a further thermal treatment. Hydrogen production (2H2O → 2H2 + O2) using the Ce2O3 phase has been demon- strated by Abanades et al. [24], Ishida et al. [25], and Valle-Hernández et al. [26]. They proposed a two-step water-splitting cycle driven by solar energy without using a reducing agent as follows:
The phase transition phenomena of CeO2 to Ce2O3 in the nanoscale have been reported [3, 21-23, 27]. On the other hand, only a few studies on the synthesis of pure Ce2O3 bulk powder and its properties have been carried. Several decades ago, Sata et al. [28] examined the phase stability and physical properties of Ce2O3 bulk powder. They synthesized Ce2O3 by reducing CeO2 powder in dry hydrogen at temperatures above 1400 oC. The H2-reduced sample was quenched in iced water to prevent partial oxidation to an intermediate phase. The hydrogen reduction of CeO2 below 1000 oC resulted in a cubic or intermediate phase [28-32]. Hamm et al. [33] reported a method for preparing Ce2O3 from metal Ce and CeO2: metal Ce was used as a reducing agent for the reduction of CeO2.
This study reports a new method to synthesize air-stable Ce2O3 oxide powder from CeO2 using low-pressure H2 gas (~10 Torr) under vacuum at 1300 oC. The crystal structure of the reduced powder and hydrogen insertion into the Ce2O3 crystal phase were characterized by neutron diffraction and vibrational spectroscopic techniques, respectively.
Two types of CeO2 oxides with > 99.9% chemical purity were used as the starting materials: nano- and micron-sized raw powders. The powder characteristics of raw materials are described below. The raw oxide was placed on an alumina plate and reduced in a vacuum chamber with 0 ~ 10 Torr H2 gas;the H2 gas-pressure was kept constant at 0.1 or 10 Torr H2 during the reduction process. The reduction treatment was carried out over the temperature range, 500~1340 oC, for 3~6 hr. The reduced sample was cooled inside the vacuum chamber to ~80 oC. Quantitative phase analysis for the reduced samples was carried out by X-ray diffraction (XRD) and neutron diffraction using the Rietveld refinement method (RIETAN-FP). Hydrogen atoms incorporated in the reduced sample were characterized by Raman spectroscopy, Fourier transform infrared (FT-IR) spectroscopy, secondary-ion mass spectrometry (SIMS), and the MEM (maximum entropy method)-based pattern fitting (MPF) method [34-36]. SIMS analysis was carried out under the following instrument conditions:
Cs+ gun, 1.5 keV impact energy, 40 nA current, 180 mm×180 mm raster size, 30 µm (Φ) analysis area, and negative ion detection (1H-, 16O-, and 140Ce-) with an electron neutralizer.
The Raman spectra were collected in a back-scattering geometry. They were recorded on a JY LabRam HR with a liquid nitrogen-cooled CCD detector under ambient conditions using the 523 nm line of an argon-ion laser maintained at 50 mW. X-ray photoelectron spectroscopy (XPS, AXIS NOVA, Kratos) was performed to analyze the valence states of Ce ions on the reduced samples using the Al Kα line (1486.6 eV). The spectra were recorded using a high-resolution analyzer with a 20 eV pass energy. The neutron diffraction data were collected at the HANARO Center in the Korea Atomic Energy Research Institute. The neutrons from the HANARO reactor were monochromatized by a vertically focusing composite Ge-monochromator to a wavelength of 1.8348 Å. The powder sample was contained in a 6 mm cylindrical vanadium can. The Debye-Scherrer geometry was used to collect the neutron data.
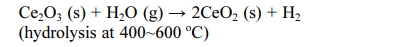
The SEM images in Fig. 1(a~d) show the micro- structural evolution of the micron-sized ceria powder with increasing reduction temperature (800~1300 oC) under 10 Torr H2 gas in a vacuum chamber for 3 hr. Fig. 1(a) shows micron-sized CeO2 agglomerated particles consisting of a large number of primary particles. At the reduction temperature of 800 oC (Fig. 1b), small discrete crystals were formed from the primary particles by the recrystallization process. At 1100 oC, crystals grow to the submicron-scale size with faceted crystal surfaces. With further increases to 1300°C, the crystal surfaces produce well-ordered terraces and straight step-edges in a hexagonal motif in accordance with the trigonal structure of Ce2O3. The reduced sample at 1300 oC showed a dark green color, while that of raw CeO2 showed a white color. Fig. 1(e) shows the micron-sized CeO2 oxidized at 1300 oC in air to reveal the effects of the atmosphere on the microstructure. Heat treatment in air produced rounded-shape crystals, and the crystal size was much smaller than that reduced under 10 Torr H2 gas.
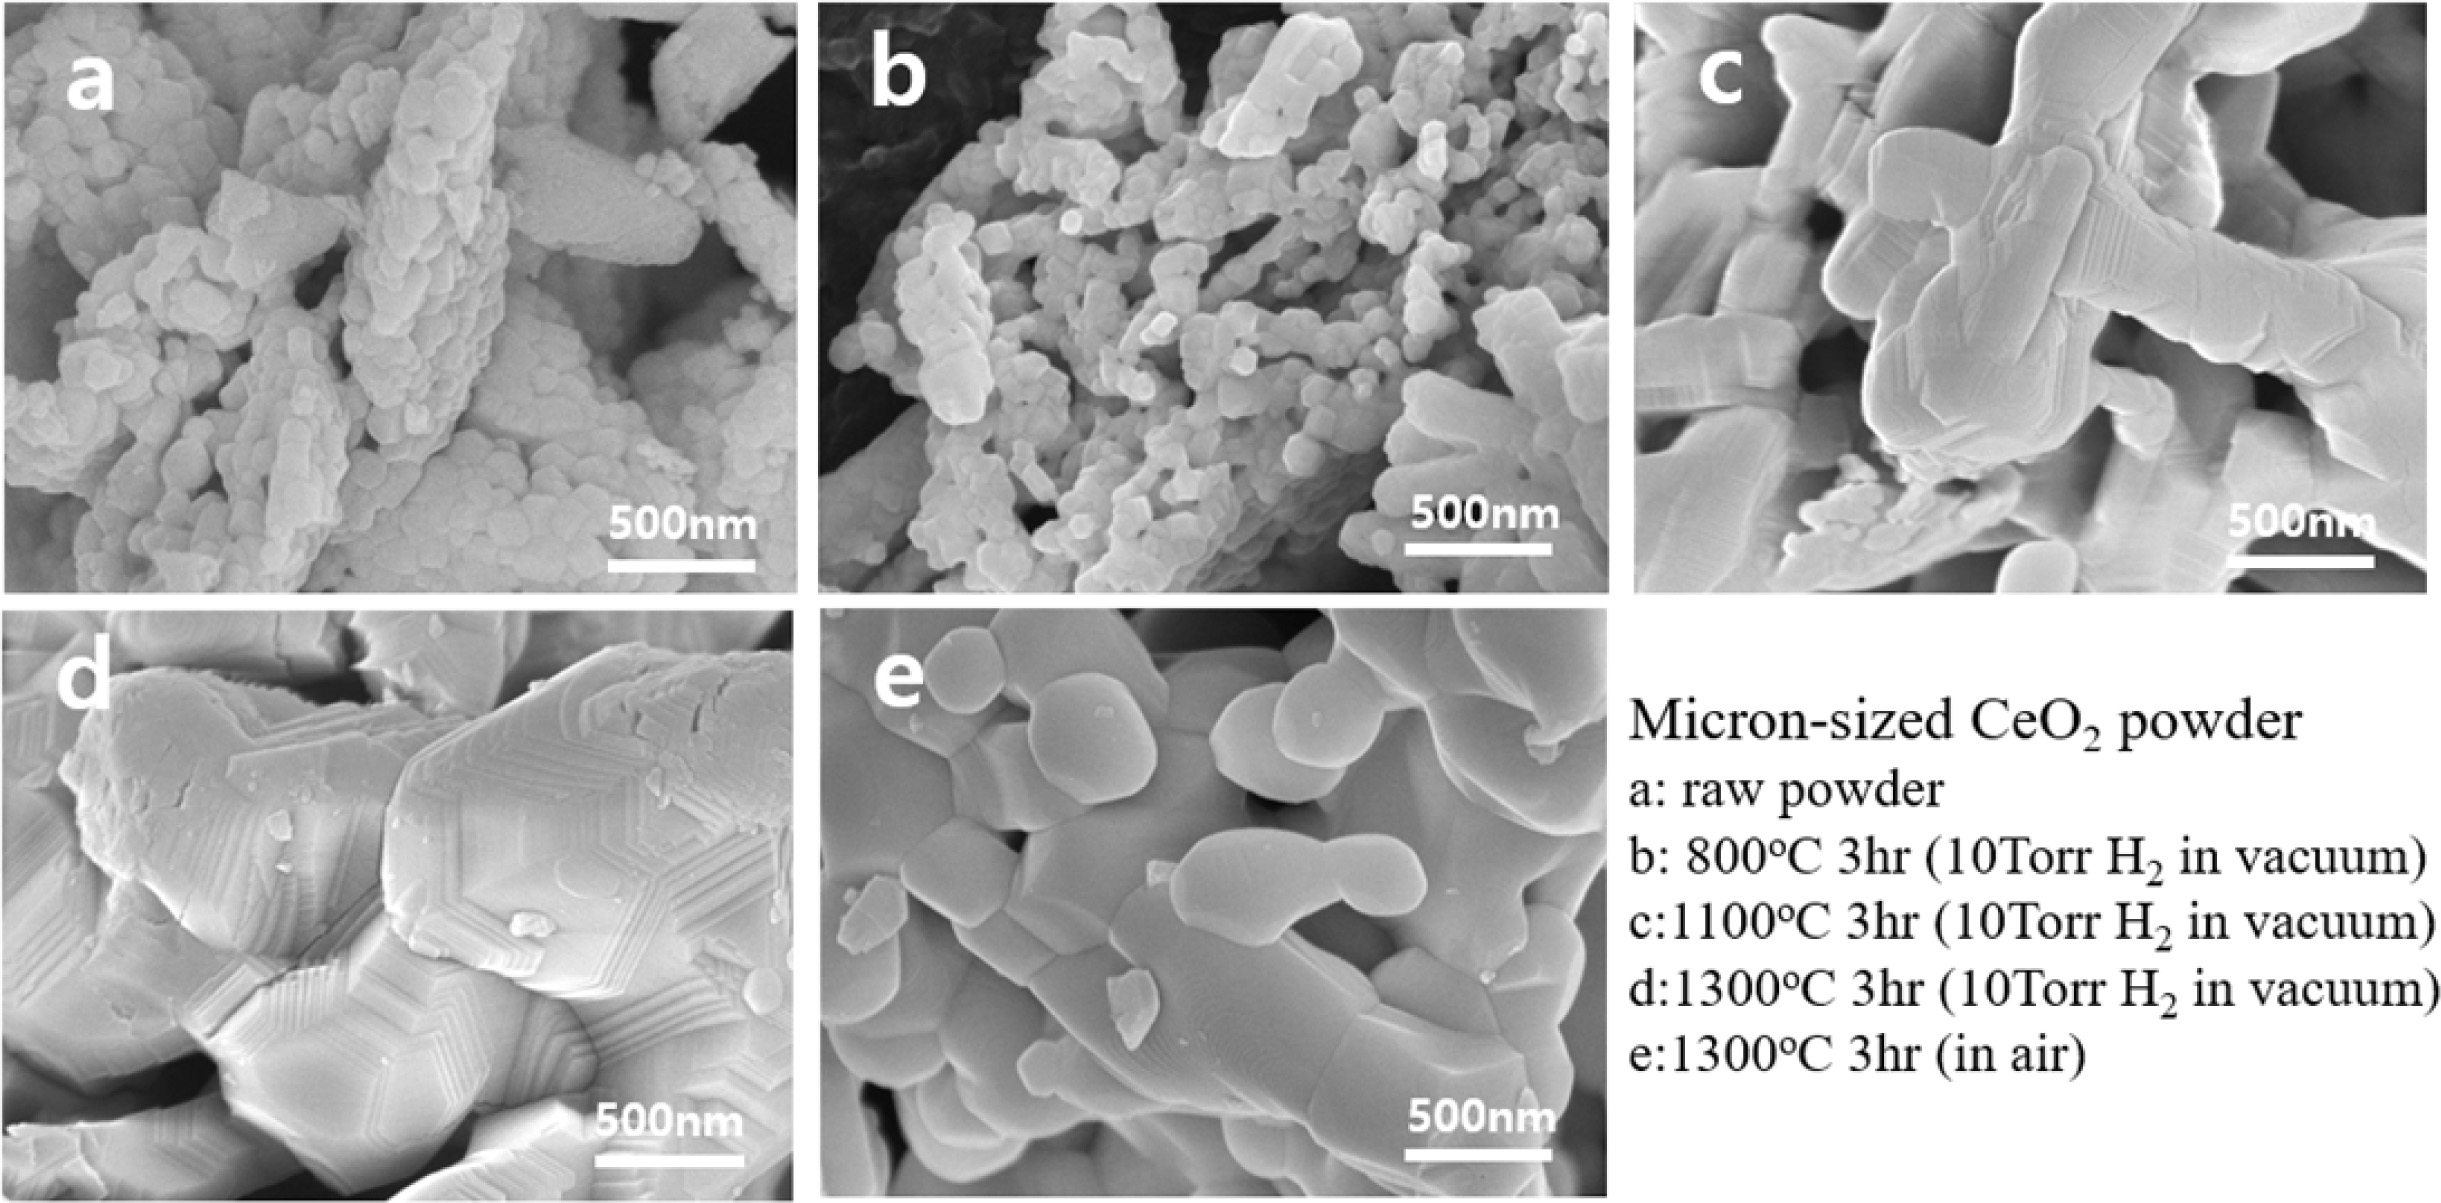
Fig. 2 shows SEM images of nano-sized raw CeO2 powder before and after the reduction treatment at 1300 oC under 10 Torr H2 gas in a vacuum chamber for 3 hr (hereafter called “10T3HR”). Nano CeO2 powder was recrystallized to very large crystals (several microns) and formed a dense structure compared to that of the micron-size CeO2 powder reduced under the same conditions. On the other hand, the characteristic surface morphology, i.e., well-ordered terraces in a hexagonal motif produced in the micron-sized ceria (see Figs. 1c, 1d), was not observed.
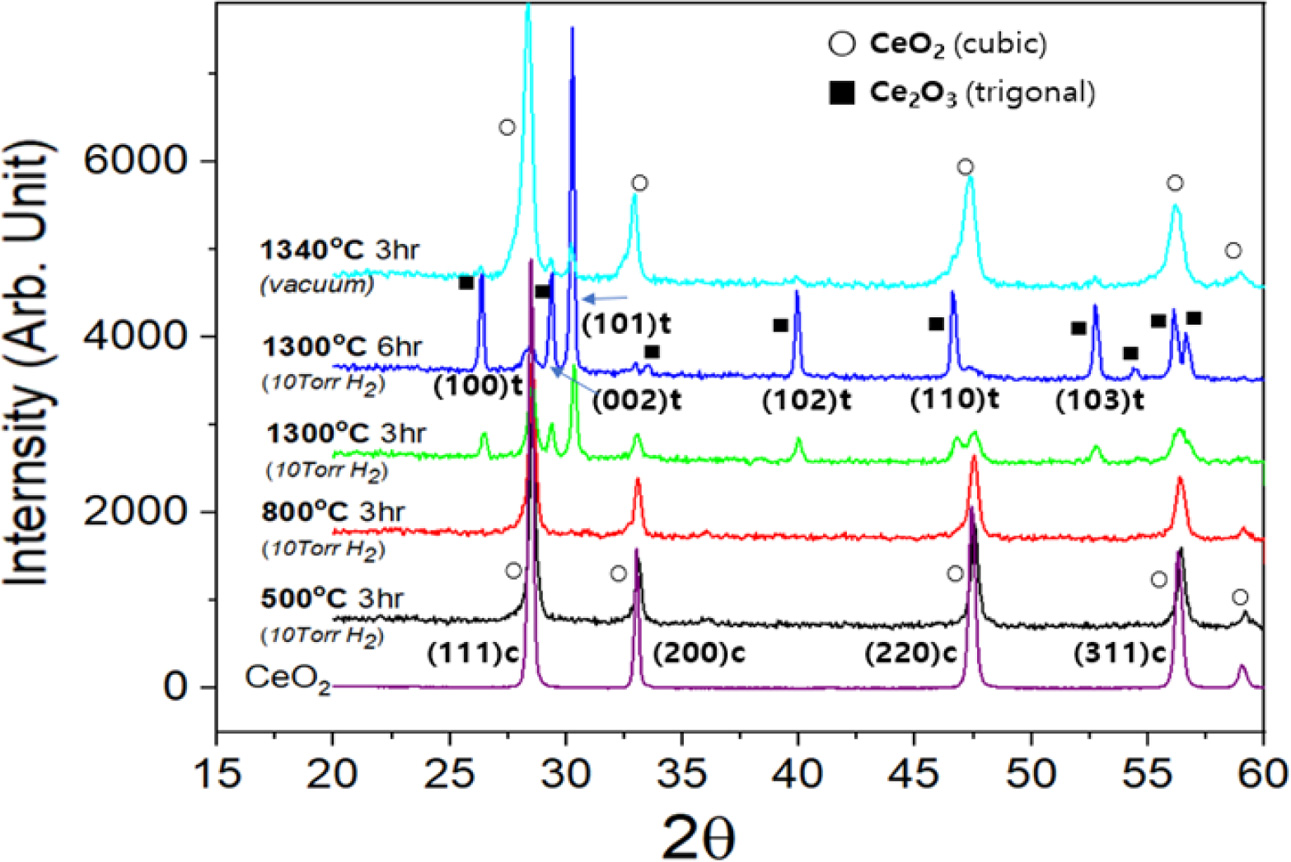
Fig. 3 presents XRD powder patterns of the micron-sized CeO2 powder before and after the heat-treatments. Raw CeO2 has a cubic structure (a ≈ 5.41 Å, SG Fm-3m), and its pattern is shown at the bottom. The samples reduced at 500 or 800°C under 10 Torr H2 gas in a vacuum also showed a cubic phase pattern. The ceria powder reduced at 10T3HR showed cubic and trigonal Ce2O3 (a = b ≈ 3.89 Å, c ≈ 6.05 Å, SG P-3m1) phases. Quantitative phase analysis of the reduced samples was carried out using the Rietveld refinement method from the XRD data. The crystal phase ratio of the trigonal to cubic was 55:45 (wt.%) in a micro-sized powder sample. Rietveld analysis and refined profile are represented in the supplementary information (Fig. S1 and Table S1). As the reduction time at 1300 oC was increased to 6 hr under 10 Torr H2 gas in a vacuum chamber (hereafter called “10T6HR”), the trigonal phase composition increases in the micro-sized powder sample to 85 wt.%. The nano-sized CeO2 powder showed a much faster transformation rate than the micro-sized powder: 96 wt.% Ce2O3 at 10T3HR. Details about the quantitative phase analysis will be discussed later.
When reduction was carried out without H2 gas under a 0.1 Torr vacuum (1340 oC for 3 hr), only ca. 8 wt.% of the Ce2O3 phase was produced, as shown in the uppermost pattern in Fig. 3. The vacuum-reduced phase showed XRD peaks with much larger FWHMs than raw CeO2 (at the bottom). The color of the vacuum-treated sample at 1340 oC changed from white for raw CeO2 to dark grey. Both the peak broadening and color change were attributed to oxygen defects produced by vacuum heat-treatment.
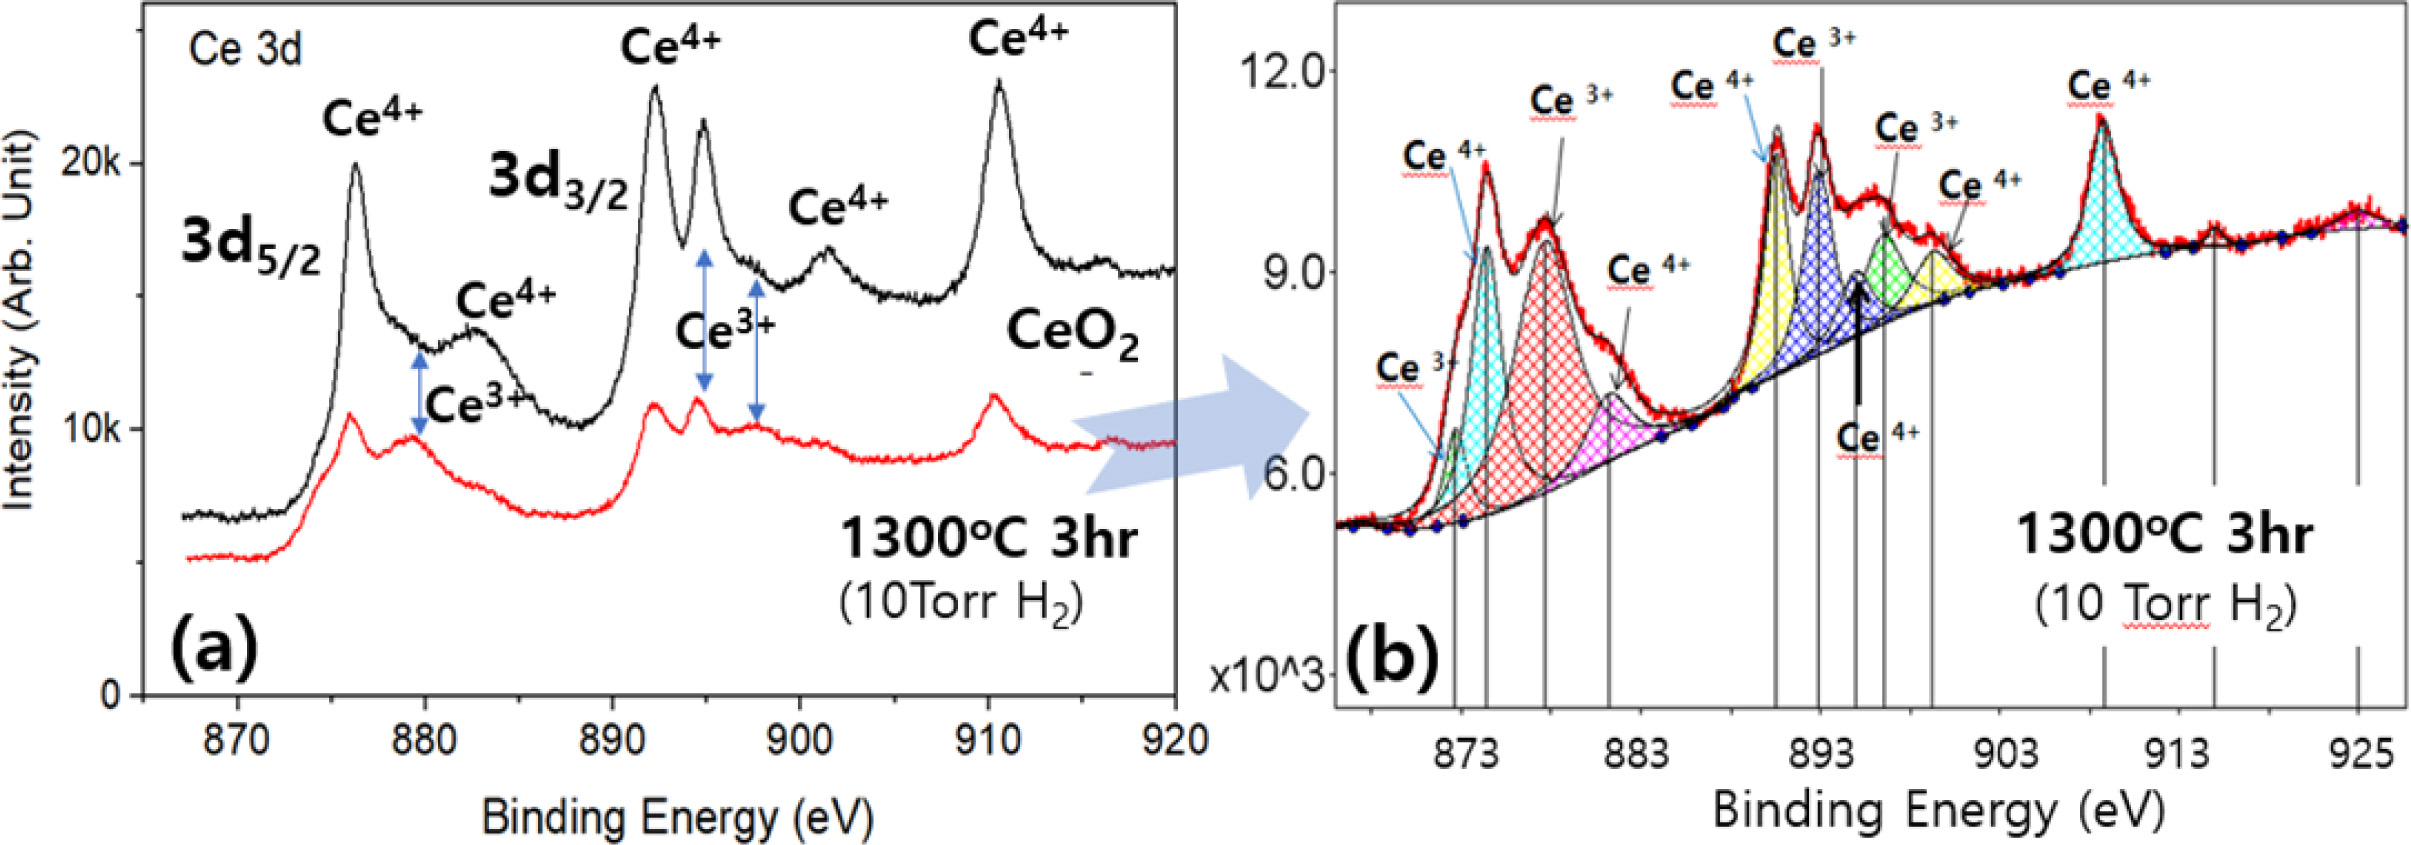
XPS analysis was carried out to confirm the change in the valence states of the Ce ions on the powder surface after the reduction treatments. Figure 4a shows the spectra for Ce (3d) collected from the CeO2 powder oxidized at 1300 oC for 3hr in air (upper one) and from the reduced ceria in a vacuum chamber at 10T3HR (lower one). The XPS spectra were charge-corrected with respect to the C(1s) binding energy at 284.6 eV. Fig. 4(b) shows the deconvoluted spectrum for the lower spectra in Fig. 4(a). The spectrum was deconvoluted using the characteristic peaks of Ce4+–O2− and Ce3+–O2− binding energies [37]. The deconvoluted peak area can provide information on the relative ratio of Ce3+/Ce4+ ions in the samples, even though XPS represents mostly surface characteristics. The complexity of the XPS spectrum comes from both the mixed-valence states and the spin-orbital doublet components, 3d3/2 and 3d5/2 of Ce ions. A prominent increase in the Ce3+ peak intensity can be seen in the reduced sample (10T3HR). The XPS results conformed to the quantitative Rietveld analysis (see Fig. 3); the XPS peak intensity of Ce3+ increased with increasing amount of Ce2O3 phase by reduction at 10T3HR.
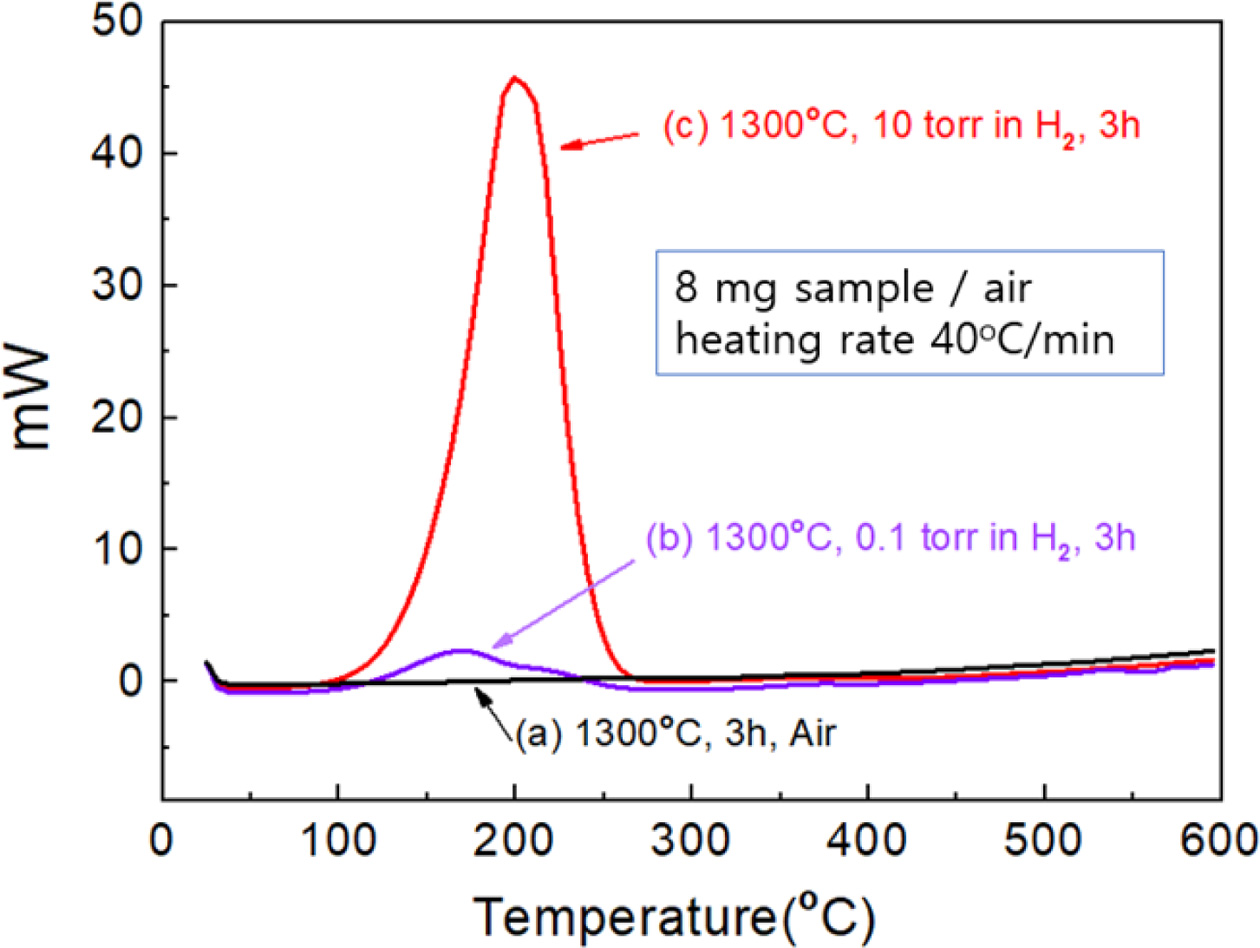
Fig. 5 presents the DSC analysis for the samples heat-treated at 1300 oC for 3 hr under three different atmospheres: in air, 0.1 Torr H2, and 10 Torr H2 in a vacuum. DSC was operated at a controlledheat-up rate (40 oC/min) in air with a sample weight of 8 mg. The sample oxidized in air did not show any peak on the DSC curve. The reduced sample under 10 Torr H2 (10T3HR) showed astrong exothermic peak, while thatunder 0.1 Torr H2 showeda weak exothermic peak at approximately 200 oC.The exothermic peak was assigned mainly to the oxidation reaction of Ce3+ into Ce4+ ions in air. The exothermic peak intensity was proportional to the amount of Ce2O3 phase in the measured samples. The exothermic reaction temperature shifted to approxi- mately 500 oC under a nitrogen atmosphere (data not shown). Hydrogen can be incorporated in the reduced samples under a H2 gas atmosphere. The oxidation of hydrogen atoms incorporated in the reduced sample can contribute to the exothermic reaction. An analysis of hydrogen incorporated in the reduced samples will be discussed later.
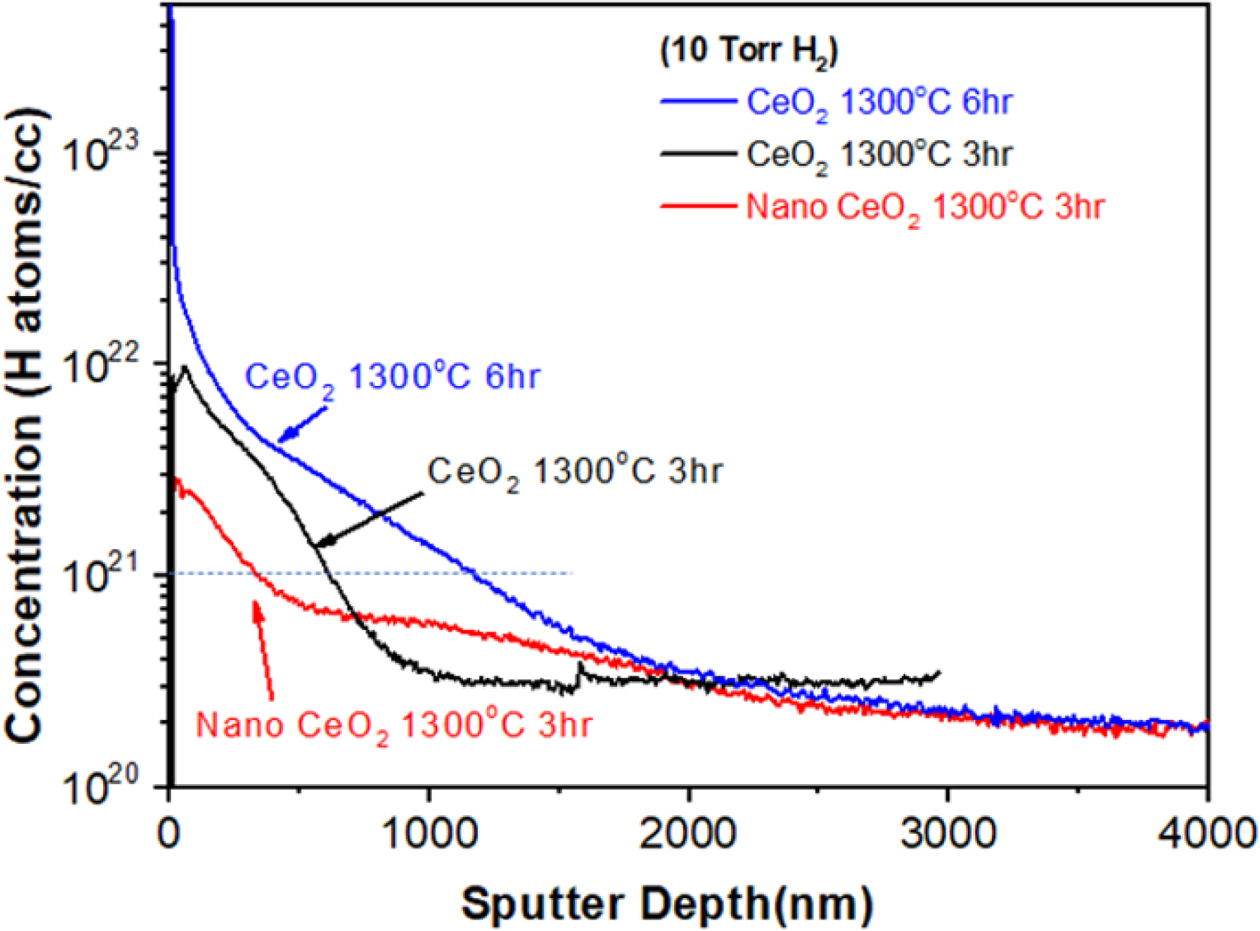
Hydrogen incorporation in CeO2 has been analyzed using several experimental tools as well as theoretical calculations, such as first-principle calculations, but the chemical nature of incorporated hydrogen is unclear [4, 17, 19, 23, 38-41]. SIMS, which is a surface analysis technique, can be used to measure the depth distributions of hydrogen in the sample by peeling-off the surfacelayer by ion beam sputtering [39]. SIMS depth profile analysis was performed (see Fig. 6) on the three different samples, which were reduced under 10Torr H2 at 1300°C: one is nano-sized ceria powders reduced for 3hr, and the other two are micrometer-sized ceria reduced for 3hr or 6hr. For depth profiling, the powder sample was pressed into a pellet.
The vertical axis in Fig. 6 represents the H concentration (H atoms/cc), and the horizontal axis is the profiling depth. Although the secondary ion current cannot be converted to the ion concentration in a straightforward manner due to several effects [39], some meaningful information can be derived from the hydrogen depth profile. The surface region (zero depth) showed the highest H concentration, which decreased with increasing profiling depth. The level of hydrogen incorporation was critically dependent on the particle size of the raw ceria powder and a reduction time at 1300 oC (10 Torr H2). In the micron-sized ceria sample, a longer reduction time (10T6HR) resulted in a higher H-concentration than a shorter reduction time (10T3HR). The H concentration decreased to 1021 atoms/cc at 1100 nm and 600 nm, respectively. In nano-sized ceria, the hydrogen concentration decreased to 1021 atoms/cc at 300 nm depth.
The SEM images of nano-ceria in Fig. 2 may explain why the hydrogen incorporation in nano-sized ceria is relatively low. Hydrogen incorporation is limited by the hydrogen dissociation reaction (H2 = 2H+ + 2e-) on the ceria surface. Previous studies suggested that the ceria surface plays an important role in the dissociation process of H2 molecules into protons; the dissociation reaction occurs mostly on the ceria particle surfaces [19, 21, 40]. Nano-sized ceria particles grow fast at relatively low temperatures and the initial stages of the reduction process. Therefore, the catalytic surface area for H2 dissociation decreases rapidly, which inhibits H incorporation.
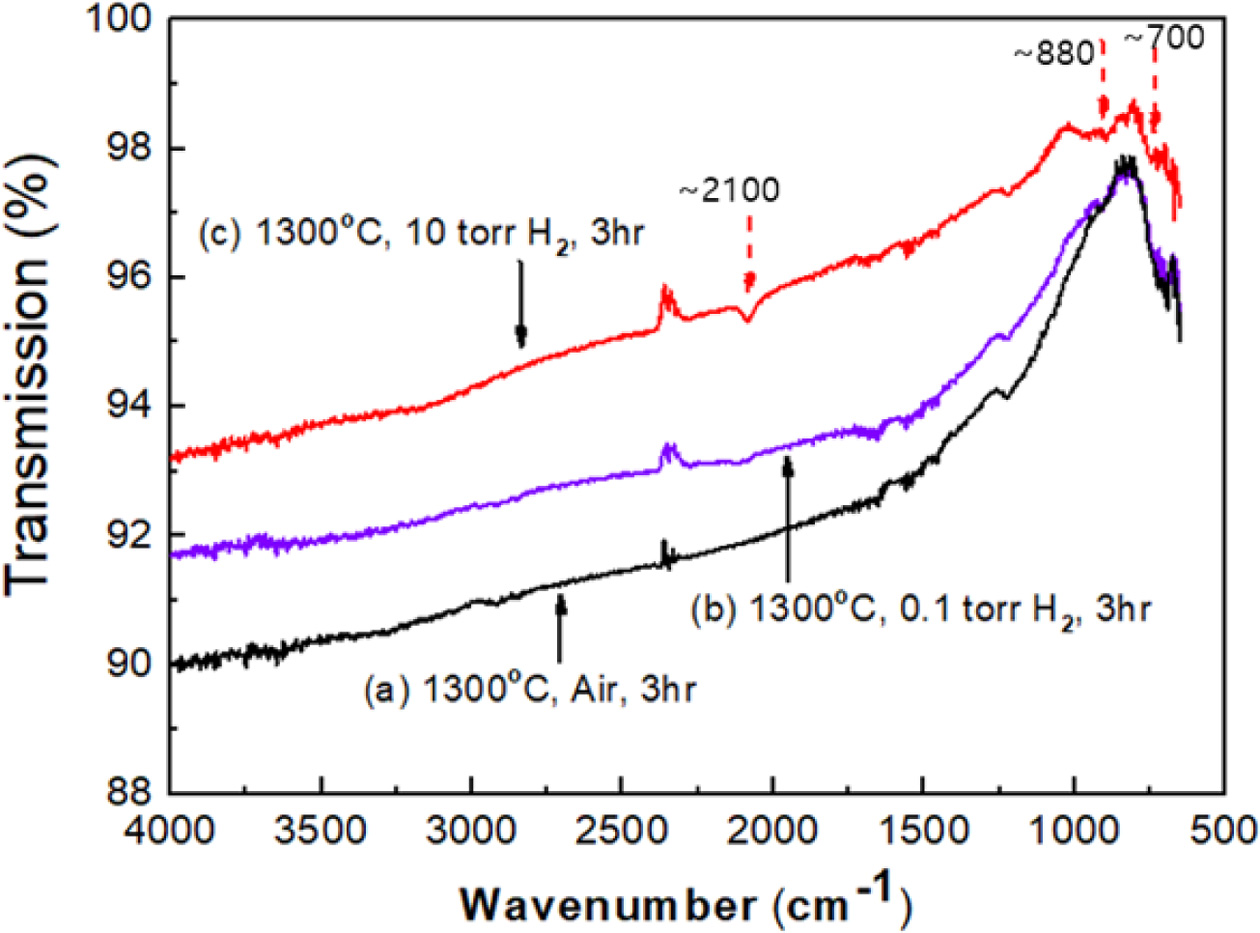
Typical vibrational spectroscopic tools for hydrogen analysis in solids are FT-IR spectroscopy, Raman spectroscopy, and inelastic neutron scattering [41-43]. In this study, FT-IR and Raman spectroscopy were carried out to characterize hydrogen incorporation in the samples. Fig. 7 presents the FT-IR spectra for the samples heat-treated at 1300 oC for 3hr under three different conditions: in air, 0.1 Torr H2, and 10 Torr H2 in a vacuum (the same samples as in Fig. 5). The reduced sample under 10 Torr H2 (10T3HR) showed distinctive absorption peaks at ~2100, ~880, and ~700 cm-1 (at the top) compared to the other two samples, which were reduced in air or 0.1 Torr H2. These absorption peaks can be understood in two ways: the structural transition of CeO2 to the trigonal Ce2O3 phase and the incorporated hydrogen in ceria.
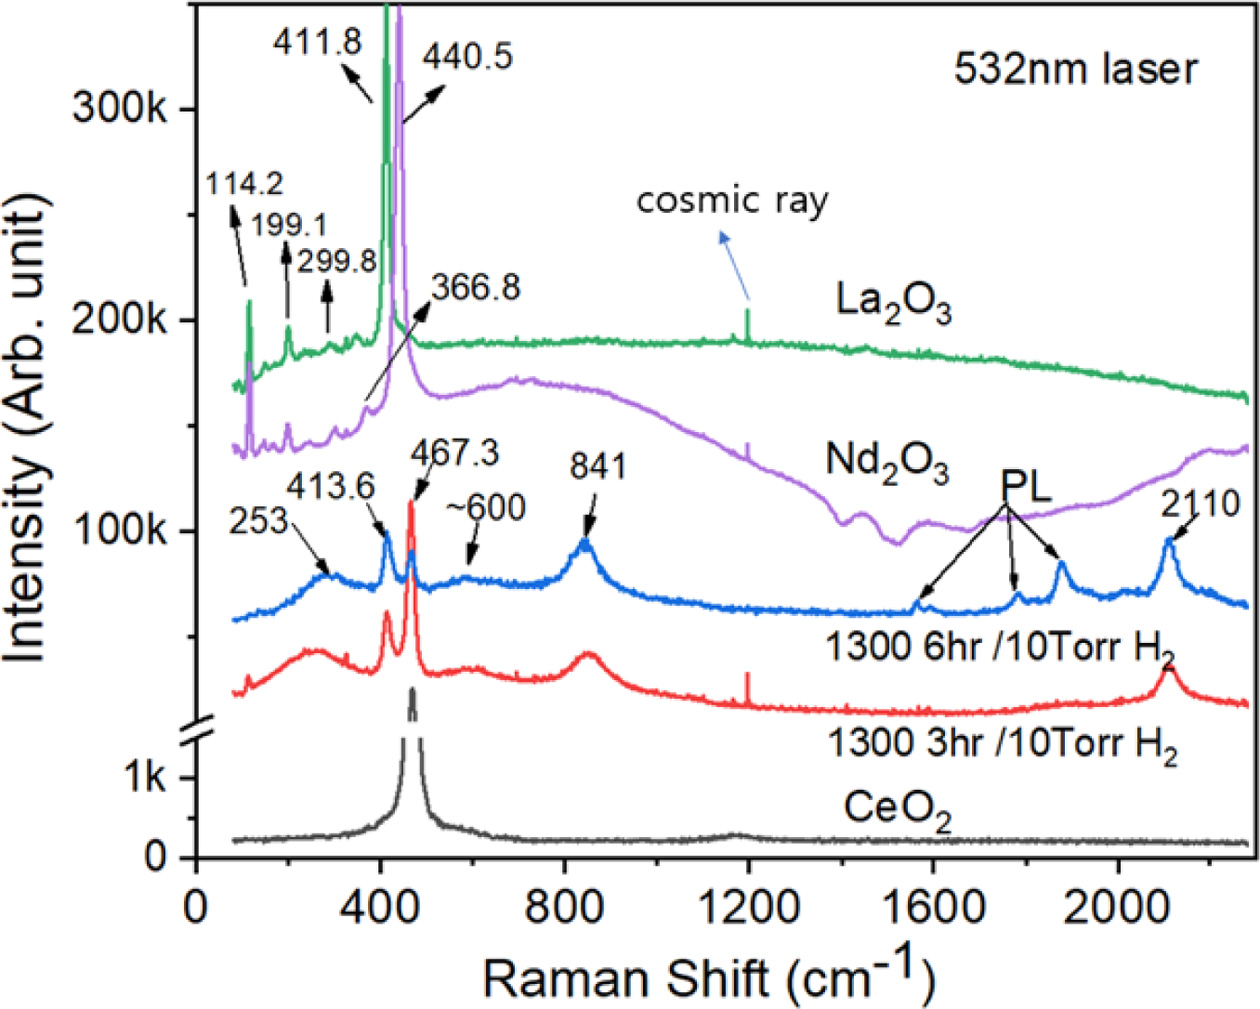
For a better understanding of the origin of these FT-IR peaks, Raman spectroscopy was carried out on the three micro-sized ceria samples: pure CeO2 powder and two reduced samples at 10T3HR and 10T6HR. Pure CeO2 powder was fully oxidized at 1300 oC in air before the measurements. As shown in Fig. 8 (lower part), the reduced samples showed additional broad peaks at 253, 600, 841, and 2110 cm-1 compared to pure CeO2. The origin of these peaks can also be understood in two different ways, similar to FT-IR spectroscopy (Fig. 7): the incorporated hydrogen and formation of Ce2O3 phase in the reduced samples. To reveal the origin of these peaks, Raman spectra of two sesquioxide samples (Nd2O3 and La2O3), which have the same crystal structure (SG P3m1) to Ce2O3 were compared (Fig. 8, upper part). In trigonal oxides, such as Ce2O3, Nd2O3, and La2O3, the rare earth (RE) ion is trivalent and coordinated by seven oxygen ions, whereas Ce4+ ion in cubic CeO2 is coordinated by eight oxygen ions. Symmetrical stretching vibrations of CeO8 (coordinated by eight O) and REO7 (coordinated by seven O) results in a first-order Raman active mode observed at ca. 467 and ca. 412 cm-1, respectively. Other small Raman peaks at ca. 114, 199, 299, and 367cm-1 were considered characteristic vibrational modes in trigonal oxides Ce2O3, Nd2O3, and La2O3 [41,42]. The reduced samples (10T3HR and 10T6HR) show additional broad peaks at 253, 600, 841, and 2110 cm-1.
Pure CeO2 powder was fully oxidized at 1300 oC in air before the measurement. As shown in Fig. 8 (lower part), the reduced samples show additional broad peaks at 253, 600, 841, and 2110 cm-1 compared to that of pure CeO2. The strong and relatively broad line at ca. 2110 cm-1 matches with the FT-IR line (~2100 cm-1) of the reduced ceria (10T3HR). Grünbacher et al. [43] suggested that the distinct IR peak at 2110 cm-1 originates from an electronic transition of Ce3+ (2F5/2 → 2F7/2): the oxygen deficiency in CeO2-x can produce Ce3+ ions and provide binding sites for reactive hydroxyl groups (OH-). The weak and broad peak at 600 cm-1 is closely related to lattice defects, which break the Raman selection rules, e.g., oxygen vacancies and hydrogen. The literature suggests that vacancies in the CeO2 lattice produce a broad peak in this region [43, 44].
In previous IR/Raman studies on the H2 interaction with CeO2, the OH stretching modes of hydroxyl groups on the surface of the CeO2 particle or thin-film appear were observed at 3400 ~ 3800 cm-1. [29, 44] This region does not show any peaks in the FT-IR and Raman spectra obtained in the present study. The reduction condition used in this study appears unfavorable for hydrogen chemisorption on the surfaces of CeO2-x. Fujimori et al. [45] reported the FT-IR and Raman spectra of non-stoichiometric cerium hydrides. The IR peaks at approximately 540, 750, and 1000 cm-l were suggested to be hydrogen-related vibrations. The broad features in the Raman spectra at 600 ~ 900 cm-l were suggested to be hydride-related signals[45].
Wu et al. examined the interaction of H2 with CeO2 over the temperature range, 533 ~ 670 K, using spec- troscopic techniques, such as in situ IR/Raman and inelastic neutron scattering (INS) [46]. INS is a sensitive spectroscopy to the vibrations of hydrogen atoms. The INS spectrum showed vibrational modes over 400 ~ 600 cm-1 and 700 ~ 1000 cm-1 energy transfer regions, which were suggested as evidence for the presence of Ce-H and bulk Ce-H (OH) species, respectively. These species form upon H2 dissociation over a ceria particle.
The vibration modes observed in the reduced ceria samples (at 10T3HR or 10T6HR) can involve the stretching and bending modes of Ce-O, Ce-OH, and Ce-H bonds. The Ce-OH vibration modes can occur at similar Raman peak positions to that of Ce-O with a slight shift because the vibrations carry hydrogen along with the oxygen displacement. In hydrogenated-vanadium oxides, Chippindale et al. [47] observed the modification of V-O vibration modes by the incorporated hydrogen. Based on the above discussion, the broad Raman peaks at ~600 and 841 cm-1 and the IR peaks at ~700 and 880 cm-1 originate from hydrogen-related vibrations. For a clearer understanding, further detailed analysis using vibrational spectroscopy will be necessary. The broad Raman peak at 253 cm-1 also appears to be hydrogen-related, but there are no relevant studies available.
Neutron diffraction is an ideal tool for structural analysis of hydrogen-related materials because neutrons are sensitive to low atomic number elements, including H. Hydrogen positions in ceria can be determined by structural analysis methods using neutron diffraction data because the scattering length is negative (-3.74 fm) and comparable to the magnitude of other elements, such as O (5.80 fm) and Ce (4.84 fm). On the other hand, it is practically difficult to reveal the position of the hydrogens in a sample when the H concentration is low. To overcome this difficulty, the nuclear density distributions were calculated by combining the Dysnomia (a computer program for calculating the electron or nuclear densities from the observed structure factors) and the MEM-based pattern fitting (MPF) method [34]. MEM-based pattern fitting (MPF) was carried out using Rietan-FP software [35, 36].
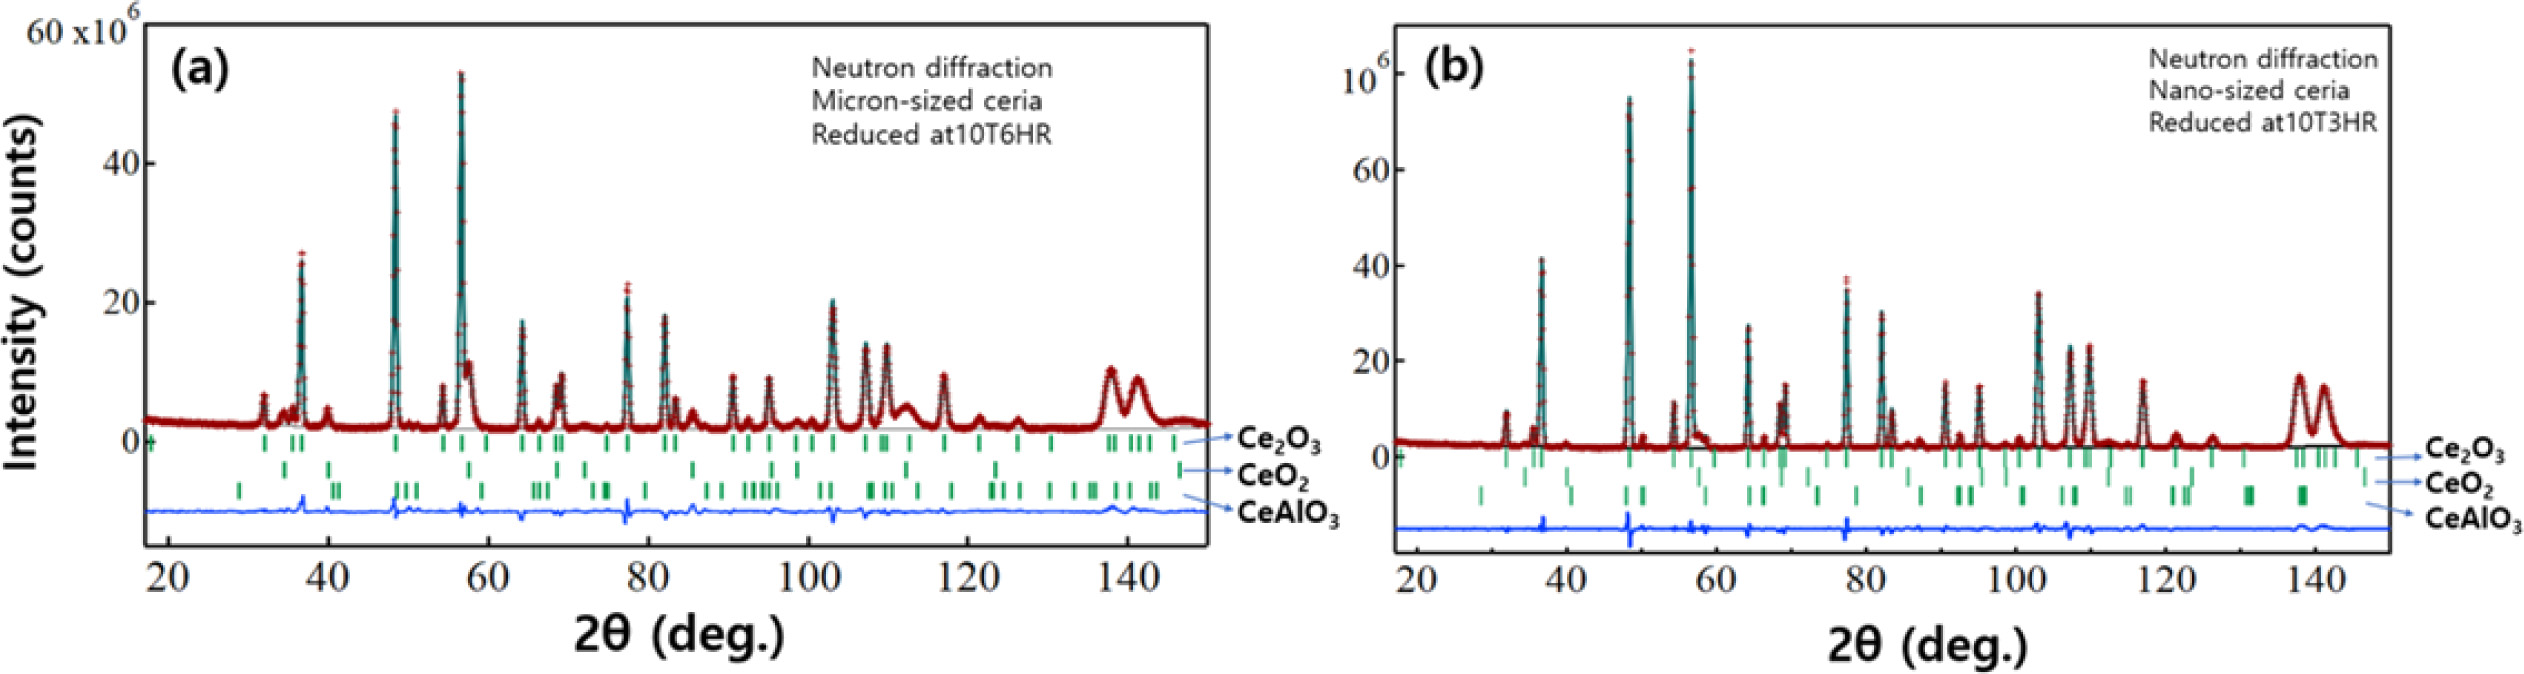
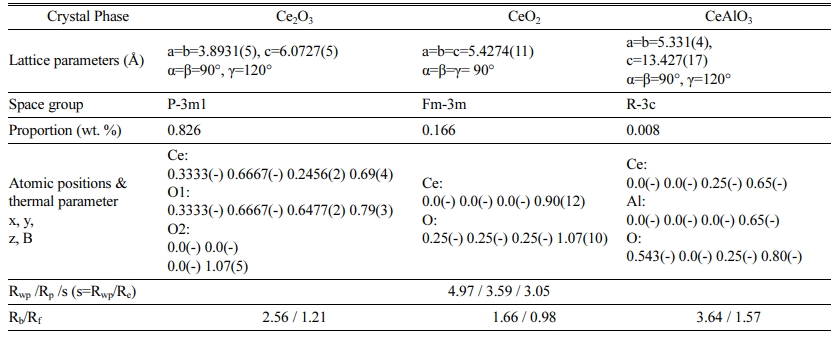
Quantitative phase analysis (Rietveld refinement) was carried out using neutron diffraction for the micron-sized and nano-sized ceria powder reduced at 10T6HR and 10T3HRrespectively. Figs. 9(a) & 9(b) show the Rietveld refinement profile obtained from the three-phase model: trigonal Ce2O3, cubic CeO2, and hexagonal CeAlO3 phases. The refinement results are summarized in Tables 1 and S2. The calculated phase ratio between Ce2O3 and CeO2 in the micron-sized sample (Fig. 9a) was 83:17 (wt.%). A minor impurity was the hexagonal CeAlO3 phase, and its proportion was < 1.0 wt.%. This impurity phase was assigned to the evaporation of the alumina substrate and a reaction with ceria powder. According to a previous study, the alumina substrate evaporates to a small extent under high-temperature vacuum conditions with low-pressure H2 gas [48]. The calculated phase ratio between Ce2O3 and CeO2 in the nano-sized sample (Fig. 9b) was 96:3 (wt.%). (see Table S2). The phase proportion of the impurity CeAlO3 was ca.1.0 wt.%.
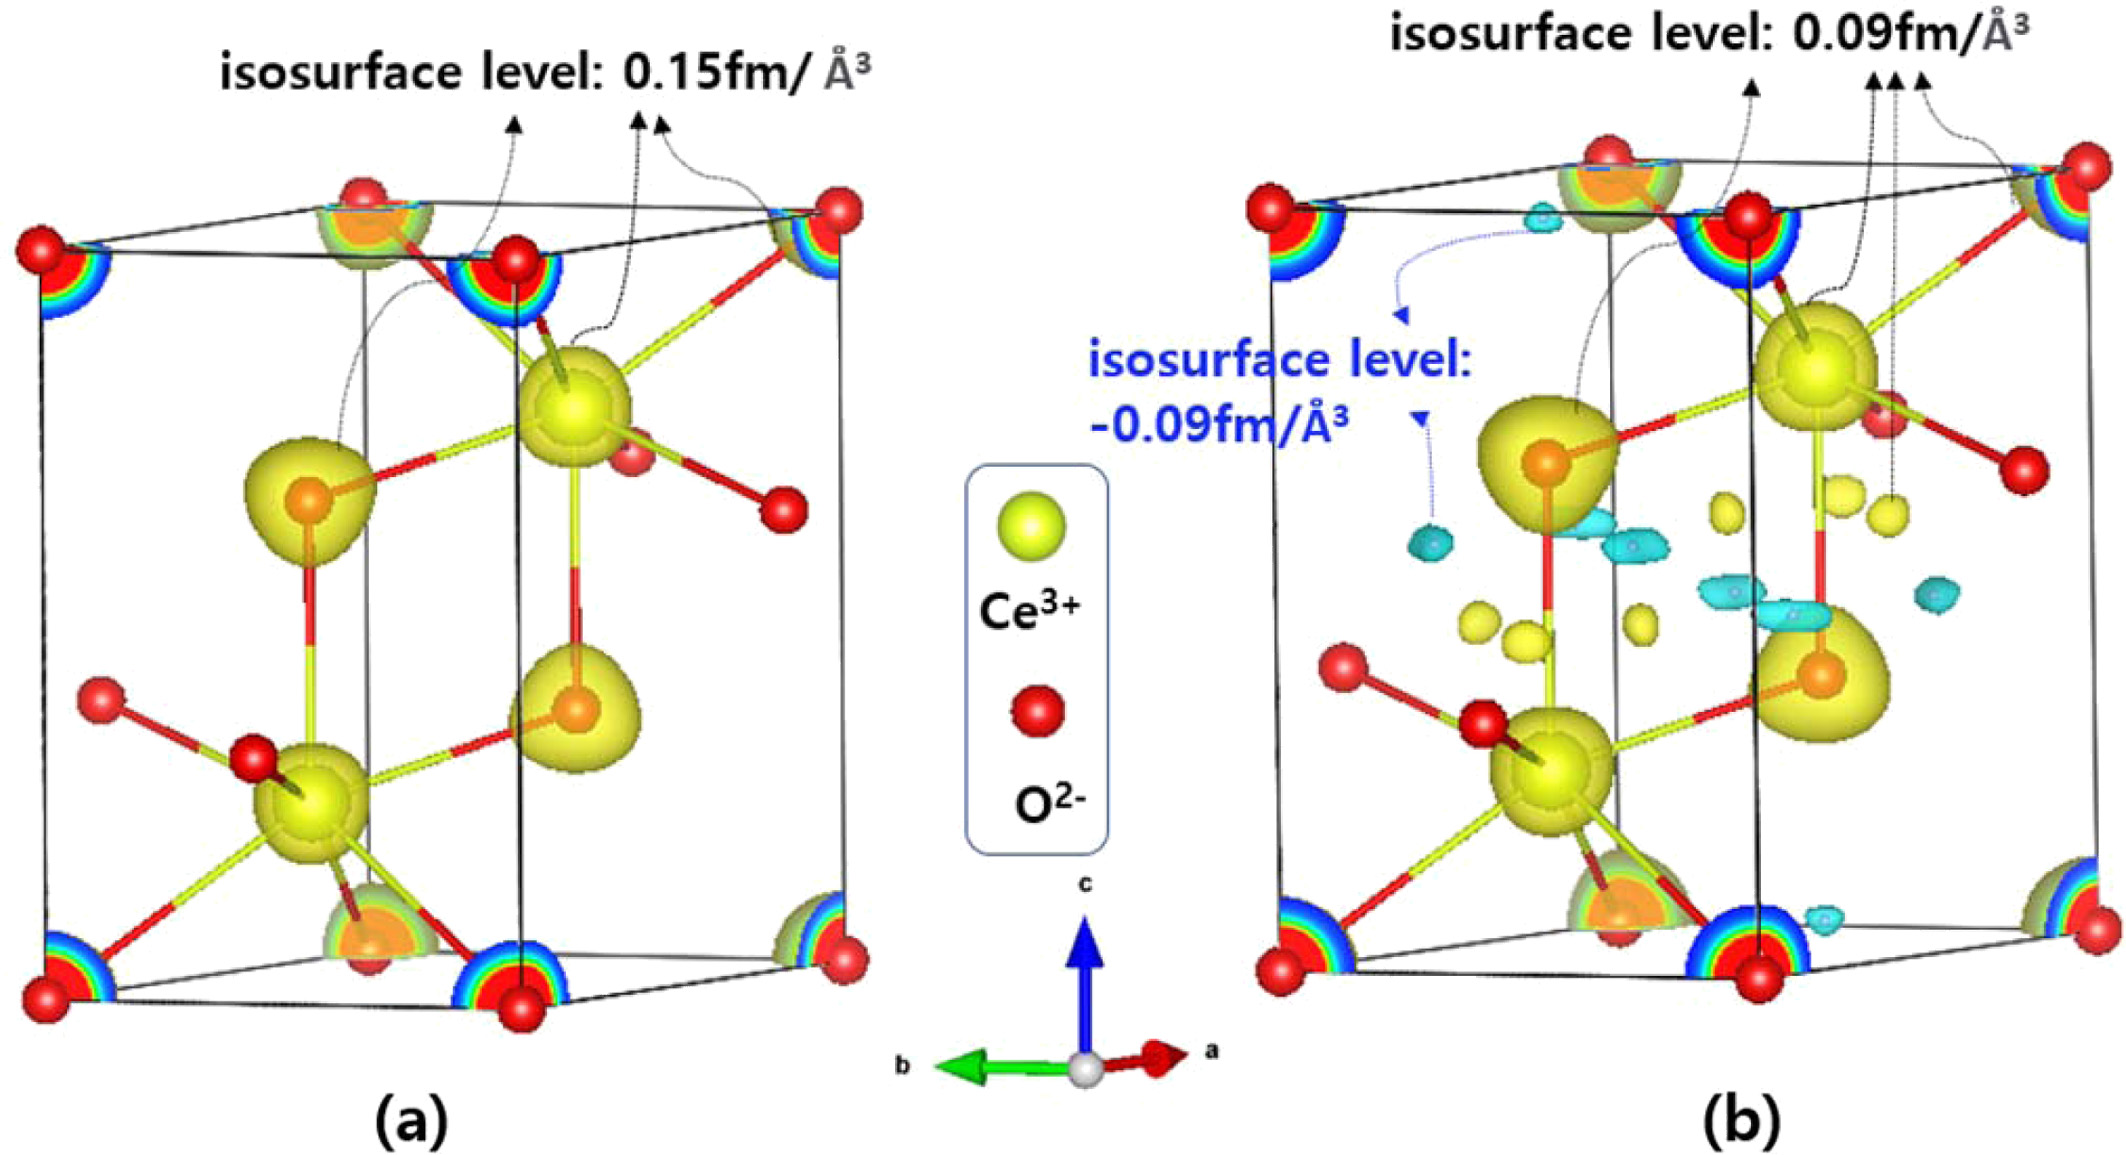
Using the MEM-based pattern fitting method and Dysnomia program, the nuclear density distributions were calculated for the Ce2O3 phase in the micron-sized ceria reduced at 10T6HR (Fig. 9a). Fig. 10(a) shows the isosurface of the scattering-length density at the +0.15 fm/Å3) level in the calculated density map of the Ce2O3 phase. Ce3+ and O2- ions constituting the unit cell were overlaid on the density map; the atomic positions were obtained by a Rietveld refinement of the neutron diffraction data. When the isosurface level was reduced to ±0.09 fm/Å3, as shown in Fig. 10(b), both negative and positive isosurfaces appeared in the unit cell. Hydrogen has a negative scattering-length (-3.74 fm), and the other two atoms (Ce and O) have positive scattering lengths. Hence, two different colors were assigned to the positive and negative isosurfaces: blue surface for negative density (-0.09 fm/Å3), possibly indicating H atoms; and a yellow surface for a positive density (+0.09 fm/Å3) for O and Ce atoms. The central positions of blue-colored regions were (x = 0.195, y = -0.195, z = 0.55) and (x = 0.3333, y = 0.6667, z = 0.97) in the unit cell; these positions were closer to O than to Ce ions. Compared to the maximum scattering-length density (221.9 fm/Å3) in the unit cell, this negative isosurface level (-0.09 fm/Å3) implies a low hydrogen concentration at these positions.
|
Fig. 1 SEM images of the micron-sized ceria powder before the reduction(a), after the reduction treatment under 10 Torr H2 gas in a vacuum chamber for 3 hr at 1300 o C, and after heat treatment in air at 1300 o C(e) |
|
Fig. 2 SEM images of the nano-sized ceria powder (a) before and (b) after the reduction treatment under 10 Torr H2 gas in a vacuum chamber for 3hr at 1300 o C. |
|
Fig. 3 Powder XRD pattern of the micron-sized CeO2 powder reduced under 10 Torr H2 gas with varying temperatures (500~ 1300 o C) and times. At the top, the sample reduced under a vacuum (10 Torr) without H2 gas at 1340 o C was compared. |
|
Fig. 4 (a) XPS spectrum for Ce (3d) of CeO2 powder oxidized at 1300o C for 3hr in air (upper one) or reduced in a vacuum chamber at 10T3HR (lower one) (b) Deconvoluted spectrum of the lower one in (a). |
|
Fig. 5 DSC analysis curves for the samples heat-treated at 1300o C for 3hr under three different atmospheres: in air, 0.1 Torr H2, and 10 Torr H2 in a vacuum. |
|
Fig. 6 SIMS depth profile analysis for hydrogen atoms. The negative secondary H− ion is recorded. The sputtering depth range was 0 ~ 4.0 μm. |
|
Fig. 7 FT-IR spectra for the samples heat-treated at 1300 o C for 3 hr under three different atmospheres: in air, 0.1 Torr H2, and 10 Torr H2 in a vacuum. |
|
Fig. 8 Raman spectra obtained from three micron-sized ceria samples: pure CeO2 powder and the two reduced samples at 10T3HR and 10T6HR. |
|
Fig. 9 Rietveld refinement profile for the neutron diffraction data using a three-phase model: trigonal Ce2O3, cubic CeO2, and hexagonal CeAlO3 phases. (a) micron-sized ceria reduced at 10T6HR (b) nano-sized ceria reduced at 10T3HR |
|
Fig. 10 Calculated nuclear density distribution of the Ce2O3 phase in the micron-sized ceria reduced at 10T6HR. Ce3+ and O2- ions in the unit cell are overlaid on the density map. Isosurface of the scattering-length density at the level of (a) +0.15 fm/Å3 and (b) ±0.09 fm/Å3 are represented. |
|
Table 1 Summary of the Rietveld refinement using neutron diffraction data for the micron-sized ceria reduced at 10 Torr H2 for 6hr at 1300 o C. |
Air-stable Ce2O3 oxide was synthesized from CeO2 powders using low-pressure H2 gas (~10 Torr) in a vacuum chamber at 1300 oC. The nano-sized CeO2 powder showed a faster transformation rate than the micron-size powder at the same reduction condition: 96% and 55 wt.% Ce2O3, respectively, at 1300 oC and 3hr. Reduction of CeO2 powder without H2 gas in a vacuum (0.1 Torr at 1340 oC) produced a very small amount of Ce2O3 phase (ca. 7 wt.%). Hydrogen incor- poration in the reduced ceria was confirmed by SIMS depth profile analysis. The surface region (zero depth) showed the highest H concentration and decreased with increasing profiling depth. The level of hydrogen incorporation was critically dependent on the particle size of the raw ceria oxide and the reduction time at 1300 oC. The nano-sized ceria sample showed a smaller amount of hydrogen incorporation than the micron-sized ceria samples. A longer reduction time (6hr) at 1300 oC gave rise to a higher level of H2 incorporation in the micron-sized sample. The relatively low hydrogen incorporation in the nano-sized sample can be attributed to the rapid grain growth and small catalytic-surface area on which hydrogen dissociation reaction occurs. The reduced samples under 10 Torr H2 at 1300 oC showed additional peaks in the Raman and FT-IR spectra compared to the cubic CeO2 and the sesquioxides (Nd2O3 and La2O3) having the same crystal structure as Ce2O3. Broad Raman peaks at 253, 600, 841, and 2110 cm-1 were assigned to hydrogen-related vibrations. The isosurface at the level of ±0.09 fm/Å3 in the calculated nuclear density distribution of the Ce2O3 phase revealed a negative density (-0.09 fm/Å3) region, suggesting the incorporated H locations. The central positions of the negative density regions were closer to the O atoms than to the Ce atoms.
This research was supported by the Academic Research fund of Hoseo University in 2018 (20180317).
- 1. G. Jacobs, P.M. Patterson, L. Williams, D. Sparks, and B.H. Davis, Catal. Lett. 96[1-2] (2004) 97-105.
-

- 2. K. Polychronopoulou, C.M. Kalamaras, and A.M. Efstathiou, Recent Pat. Mater. Sci. 4[2] (2011) 122-145.
-
- 3. F. Dvorak, L. Szabova, V. Johanek, M.F. Camellone, V. Stetsovych, M. Vorokhta, A. Tovt, T. Skala, I. Matolínova, Y. Tateyama, J. Myslivecek, S. Fabris, and V. Matolín, ACS Catal. 8[5] (2018) 4354-4363.
-
- 4. K. Sohlberg, S.T. Pantelides, and S.J. Pennycook, J. Am. Chem. Soc. 123[27] (2001) 6609-6611.
-
- 5. L. Jalowiecki-Duhamel, S. Debeusscher, H. Zarrou, A. D’Huysser, H. Jobic, and E. Payen, Catal. Today 138[3-4] (2008) 266-271.
-
- 6. K. Werner, X. Weng, F. Calaza, M. Sterrer, T. Kropp, J. Paier, J. Sauer, M. Wilde, K. Fukutani, S. Shaikhutdinov, and H.-J. Freund, J. Am. Chem. Soc. 139[48] (2017) 17608-17616.
-
- 7. Y. Lara-López, G. García-Rosales, and J. Jiménez-Becerril, J. Ceram. Process. Res. 20[1] (2019) 24-29.
- 8. R. Ma, M. J. Islam, D.A. Reddy, and T.K. Kim, Ceram. Int. 42[16] (2016) 18495-18502.
-
- 9. E.-H. Hyeong, S.-M. Bae, C.-R. Park, J.-S. Park, Y.-S. Yoo, H.-S. Yang, and J.-H. Hwang, J. Ceram. Process. Res. 13[3] (2012) 349~352.
- 10. J-W. Bae, S.-W. Hong, B.-J Koo, J.-H An, F.B. Prinz, and Y.-B. Kim, J. Eur. Ceram. Soc. 34[15] (2014) 3763-3768.
-
- 11. J.Y. Park, J. Ceram. Process. Res. 21[S1] (2020) 63-67.
-
- 12. J.-S. Lee, J. Ceram. Process. Res. 17[10] (2016) 1078-1081.
- 13. S. Masahiro, O. Masakuni, S. Akihiko, S. Tadashi, and K. Takaaki, Bull. Chem. Soc. Jpn. 78[5] (2005) 752-767.
-
- 14. M. Zarinkamar, M. Farahmandjou, and T.P. Firoozabadi, J. Ceram. Process. Res. 17[3] (2016) 166-169.
-
- 15. X. Zhang, Y. Zhang, Y. Lu, S. Zhang, amd J. Yang, J. Eur. Ceram. Soc. 40[12] (2020) 4366-4372
-
- 16. M.B. Watkins, A.S. Foster, and A.L. Shluger, J. Phys. Chem. C 111[42] (2007) 15337-15341.
-
- 17. L. Brugnoli, A. Pedone, M.C. Menziani, C. Adamo, and F. Labat, J. Phys. Chem. C 123[42] (2019) 25668-25679.
-
- 18. J. Liu, Z. Dou, and T. Zhang, Ceram. Int. 46[5] (2020) 5976-5982.
-
- 19. K. Werner, X. Weng, F. Calaza, M. Sterrer, T. Kropp, J. Paier, J. Sauer, M. Wilde, K. Fukutani, S. Shaikhutdinov, and H.-J. Freund, J. Am. Chem. Soc. 139[48] (2017) 17608-17616.
-
- 20. E.A. KuKmmerle and G. Heger, J. Solid State Chem. 147[2] (1999) 485-500.
-
- 21. O. Matz and M. Calatayud. Top. Catal. 62[12-16] (2019) 956-967.
-
- 22. V. Stetsovych, F. Pagliuca, F. Dvorak, T. Duchoň, M. Vorokhta, M. Aulicka, J. Lachnitt, S. Schernich, I. Matolínova, K. Veltruska, T. Skala, D. Mazur, J. Myslivecek, J. Libuda, and V. Matolín, J. Phys. Chem. Lett. 4[6] (2013) 866-871.
-
- 23. M. García-Melchor and N. López, J. Phys. Chem. C 118[20] (2014) 10921-10926.
-
- 24. S. Abanades and G. Flamant, Sol. Energy 80[12] (2006) 1611-1623.
-
- 25. T. Ishida, N. Gokon, T. Hatamachi, and T. Kodama, Energy Procedia 49 (2014) 1970-1979.
-
- 26. J. Valle-Hernández, H. Romero-Paredes, C.A. Arancibia-Bulnes, H.I. Villafan-Vidales, and G. Espinosa-Paredes, AIP Conf. Proc. 1734(2016) 120008(1-8)
-
- 27. J. Höcker, J.-O. Krisponeit, T. Schmidt, J. Falta, and J.I. Flege, Nanoscale 9[27] (2017) 9352-9358.
-
- 28. T. Sata and M. Yoshimura, J. Ceram. Assoc. Japan 76[872] (1968) 116-122.
-
- 29. J.L.G. Fierro, J. Soria, J. Sanz, and J .M. Rojo, J. Solid State Chem. 66[1] (1987) 154-162.
-
- 30. A. Trovarelli, Catal. Rev. 38[4] (1996) 439-520.
-
- 31. V. Perrichon, A. Laachir, S. Abouarnadasse, O. Touret, and G. Blanchard, Appl. Catal. A-Gen. 129[1] (1995) 69-82.
-
- 32. D.J. M. Bevan and J. Kordis, J. Inorg. Nucl. Chem. 26[9] (1964) 1509-1523.
-
- 33. C.M. Hamm, L. Alff, and B. Albert, Z. Anorg. Allg. Chem. 640[6] (2014) 1050-1053.
-
- 34. F. Izumi and K. Momma, IOP Conf. Ser.: Mater. Sci. Eng. 18[2] (2011) 022001.
-
- 35. K. Momma and F. Izumi, Z. Kristallogr. Proc. 1 (2011) 195-200.
- 36. K. Momma, T. Ikeda, A.A. Belik, and F. Izumi, Powder Diffr. 28[3] (2013) 184-193.
-
- 37. A. Kumar, S. Babu, A.S. Karakoti, A. Schulte, and S. Seal, Langmuir 25[18] (2009) 10998-11007.
-
- 38. M.F. Bekheet, M. Grünbacher, L. Schlicker, A. Gili, A. Doran, J. D. Epping, A. Gurlo, B. Klötzerb, and S. Penner, CrystEngComm 21[1] (2019) 145-154.
-
- 39. T. Hryniewicz, P. Konarski, K. Rokosz, and R. Rokicki, Surf. Coat. Technol. 205[17-18] (2011) 4228-4236.
-
- 40. G. Righi, R. Magri, and A. Selloni, J. Phys. Chem. C 123[15] (2019) 9875-9883.
-
- 41. A. Furrer, in “Neutron Scattering from Hydrogen in Materials” (World Scientific Press, 1994) p.264.
-
- 42. V.A. Sadykov, M.N. Simonov, N.V. Mezentseva, S.N. Pavlova, Y.E. Fedorova, A.S. Bobin, Y.N. Bespalko, A.V. Ishchenko, T.A. Krieger, T.S. Glazneva, T.V. Larina, S.V. Cherepanova, V.V. Kaichev, A.A. Saraev, Y.A. Chesalov, A.N. Shmakov, A.-C. Roger, and A. Adamski, Open Chem. 14[1] (2016) 363-376.
-
- 43. M. Grünbacher, L. Schlicker, M.F. Bekheet, A. Gurlo, B. Klötzer, and S. Penner, Phys. Chem. Chem. Phys. 20[34] (2018) 22099-22113.
-
- 44. D. Mukherjee, B.G. Rao, and B.M. Reddy, Top Catal. 60[19-20] (2017) 1673-1681.
-
- 45. A. Fujimori, M. Ishii, and N. Tsuda, Phys. Stat. Sol. B 99[2] (1980) 673-681.
-
- 46. Z. Wu, Y. Cheng, F. Tao, L. Daemen, G.S. Foo, L. Nguyen, X. Zhang, A. Beste, and A.J. Ramirez-Cuesta, Am. Chem. Soc. 139[28] (2017) 9721-9727.
-
- 47. A.M. Chippindale, P.G. Dickens, and A.V. Powell, J. Solid State Chem. 92[2] (1991) 526-533.
-
- 48. K.-W. Chae, T.-R. Park, C.I. Cheon, and J.S. Kim, Sci. Adv. Mater. 8 (2016) 1-5.
 This Article
-
2021; 22(4): 461-469
Published on Aug 31, 2021
- 10.36410/jcpr.2021.22.4.461
- Received on Feb 1, 2021
- Revised on Apr 6, 2021
- Accepted on Apr 19, 2021
Services
- Abstract
introduction
experimental
results and discussion
conclusion
- Acknowledgements
- References
- Full Text PDF
Shared
Correspondence to
- Jeong Seog Kim
-
Dept. of Materials Science and Engineering, Hoseo University, Asan, Chungnam 31499, Korea
Tel : +82-10-4058-8085 Fax: +82-41-360-4849 - E-mail: kimjungs@hoseo.edu
Clean-Energy Research Institute(CRI), Hanyang University, 222, Wangsimni-ro, Seongdong-gu, Seoul, 04763, Korea
E-mail: jcpr@hanyang.ac.kr