


- Tunable green-yellow-red light properties of NaY(WO4 )2: Mn2+, Dy3+, Eu3+ phosphors excited with 365 nm LED
Yonghua Wua,*, Fugui Yangb, Hao Zhangb, Fengpo Yanb and Ruijuan Zuoc
aCollege of Electronic and Information science, Fujian Jiangxia University, Fuzhou, Fujian, 350108, P.R. China
bMatimatical Institution, Fujian Jiangxia University, Fuzhou, Fujian, 350108, P.R. China
cCollege of Mathematics and Informatics, Fujian Normal University, Fuzhou, Fujian, 350117, P.R. ChinaThis article is an open access article distributed under the terms of the Creative Commons Attribution Non-Commercial License (http://creativecommons.org/licenses/by-nc/4.0) which permits unrestricted non-commercial use, distribution, and reproduction in any medium, provided the original work is properly cited.
By the solid-state reaction method, the NaY(WO4)2 : Mn2+, Dy3+, Eu3+ phosphors are synthesized successfully. The sample’s phase-structure and morphology have been characterized by XRD and EDS. The concentrations of Mn2+, Dy3+, Eu3+, Y3+ and W6+ are measured by ICP, The result implies that the doped process of Mn2+, Dy3+ and Eu3+ is very easy in host NaY(WO4)2. The absorption and excited spectra are presented, The absorption spectrum of Mn2+ is always broad, but the Dy3+, Eu3+has relatively sharp absorption peaks.Using the commercial LED of 365 nm wavelength as the excitation light, the emission spectra with different doped concentrations ratios of Mn2+ are obtained. The Mn2 + doping reduces the emission intensity of Dy3+,also it has meaningful influence on the tunable green-yellow-red LED.The high doped concentration of Mn2+ can guarantee the emission intensity of 546 nm enough
Keywords: Solid-state reaction, XRD, Phase-structure, LED, Absorption spectrum, Emission intensity
Recently, the LED technology has been applied in many fields such as lighting, display, health, agriculture, transportation, environment, etc. In the phosphor family, the rare-earth phosphors have large number of energy levels and excited wavelengths suitable for the ultra-visible light, and occupy the vast majority such as NaY (WO4)2:Yb/P [1], NaLa(WO4)2:Eu3+ [2], ZnWO4:Sm/Eu/Tb/Dy [3], NaLa(WO4)2:Dy3+ [4, 5], ZnWO4: Cr3+/Mn2+/Cu2+ [6]. the Eu3+ ion is important activators due to its red emission band corresponding to the transition of 5D0→7F0-4 [7]. the Dy3+ has been widely used to generate the blue, yellow and red light, corresponding to the transition of 4F9/2→6H13/2 [8], because of its plentiful absorption and emission spectra.. Mn2+ has been widely used to generate the green light [9, 10]. By doping different ions, a variety of fluorescent materials with rich colors and satisfying different uses can be obtained [11].
Considering of the character of Mn2+ [12], Dy3+ [13], Eu3+ [14], in the work, we attempt to investigate the fluorescence performance of NaY(WO4)2: Mn2+, Dy3+, Eu3+ phosphors and discuss the mechanism of tunable green-yellow-red emission. We chose the NaY(WO4)2 as the host because that the tungstate has many merits such as good thermal stability, environmental safety, simple synthesis process and low synthesis temperature (~1,000 oC) [15-19]. Compared with fluoride and sulfide, the oxide is environmentally friendly and easy to prepare. Particularly, the tungstate root [WO4]2- has good blue absorption and emission bands, which contributes to the cross-energy levels transition[20-21]. Mn2+ ions not only have a rich and broad absorption band, they are often used as doping ions to improve fluorescence performance.
Using the host of NaY(WO4)2, the Dy3+ (0.091 nm) and Eu3+(0.096 nm) can easily replace the Y3+ (0.09 nm)due to the similar electronic structure (4f), and the Mn2+ (0.067 nm) can also occupy the site of Na1+ (0.102 nm). More important, some of the absorption peaks of Mn2+, Dy3+, Eu3+ are overlapped such as 365 nm, which make the excitation source is single and simple, so we use 365 nm as the excitation source.
The luminescence of NaY(WO4)2:Dy3+, Eu3+, Zn2SiO4: Mn2+, Eu3+, Dy3+, NaY(WO4)2:Eu3+ have been investigated in earlier paper [22-24]. But till now, the phosphor of NaY(WO4)2:Mn2+, Dy3+, Eu3+ has not been investigate yet. And so, in the work, we introduce the Mn2+ in NaY(WO4)2:Dy3+, Eu3+ .The adjustment mechanism of Mn2+ ions in NaY(WO4)2:Mn2+, Dy3+, Eu3+ phosphors has been also discussed. The result shows that the NaY(WO4)2:Mn2+, Dy3+, Eu3+ phosphors have good tunable green-yellow-red light with better performance.
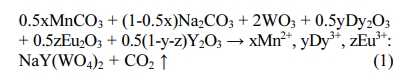
Power samples of NaY(WO4)2:xMn2+, yDy3+, zEu3+ (x = 1, 2, 6, 8, 15 at%; y = 4 at%; z = 4 at%) phosphors were fabricated via a solid state reaction method. The starting materials are MnCO3 (99.99%, 0.5-1 μm), Na2CO3 (99.995%, 0.2-0.5 μm), Eu2O3 (99.99%, 0.5-1 μm), Y2O3 (99.99%, 0.5-1 μm), Dy2O3 (99.99%, 0.5-1 μm), WO3 (99.98%, 0.1-0.5 μm). The reaction equation is as follows:
Each mixture of starting materials were mixed homogeneous by an agate mortar and then loaded into an Al2O3 crucible. After that the mixture was sintered in a tube furnace at 1,000 ± (5) oC for 4 h in a CO-reducing atmosphere. As the reaction finished, the vessel was naturally cooled down to room temperature, and the white precipitation was washed with distilled water. After that, the precipitate was dried at 70 oC for 7 h. Finally the NaY(WO4)2 : Mn2+, Dy3+, Eu3+ micro- structures were obtained through a calcination process at 600 oC for 1 h.
The purity and phase structure of the sample was identified by XRD using Rigaku Miniflex 600 diffrac-tometer with graphite-monochromatized Cu-Ka radia- tion (λ = 0.1540 nm). The 2θ angle ranged from 15o to 75o, and the scanning step size was 0.02o. The con- centrations of Mn2+, Dy3+, Eu3+, Y3+, W6+ ions were measured by inductively coupled plasma atomic emission spectrometry method (ICP-AES instrument, Agilent ICPOES730). The micro-structure was measured by EDS (Energy Dispersive Spectrometer). The absorption spectra were recorded by Shimadzu UV-2600 UV-VIS-NIR spectrophotometer. The excitation was measured by Edinburgh Instruments FLS980 fluorescence spec- trometer. Excited with 365 nm LED, the emission spectra with different concentrations ofMn2+, Dy3+, Eu3+ were measured by USB2000+ spectrometer (Ocean Optics Ltd.).
Structure and morphology characterization
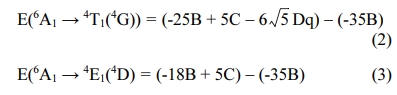
The powder XRD patterns of concentration NaY (WO4)2:xMn2+, yDy3+, zEu3+ (x = 4 at%; y = 4 at%; z = 4 at%) phosphor were measured to identify the crystal structure of products and are shown in Fig. 1. The XRD diffractive peak positions of studied sample match well with JCPDS #48-0886 for body-centered host NaY(WO4)2 of tetragonal phase with the space group I41/a and its lattice parameter values are a = 0.5205 nm, b = 0.5205 nm, c = 1.1251 nm, α = β = γ = 90o, thus indicating the achievement of the target products.
From the Fig. 1, we can conclude that doping trivalent ions (Mn2+, Dy3+, Eu3+) into the host NaY(WO4)2 will keep single phase and the doping process and the dopant concentration is the studied concentration region do not affect the structural properties of pure NaY(WO4)2.
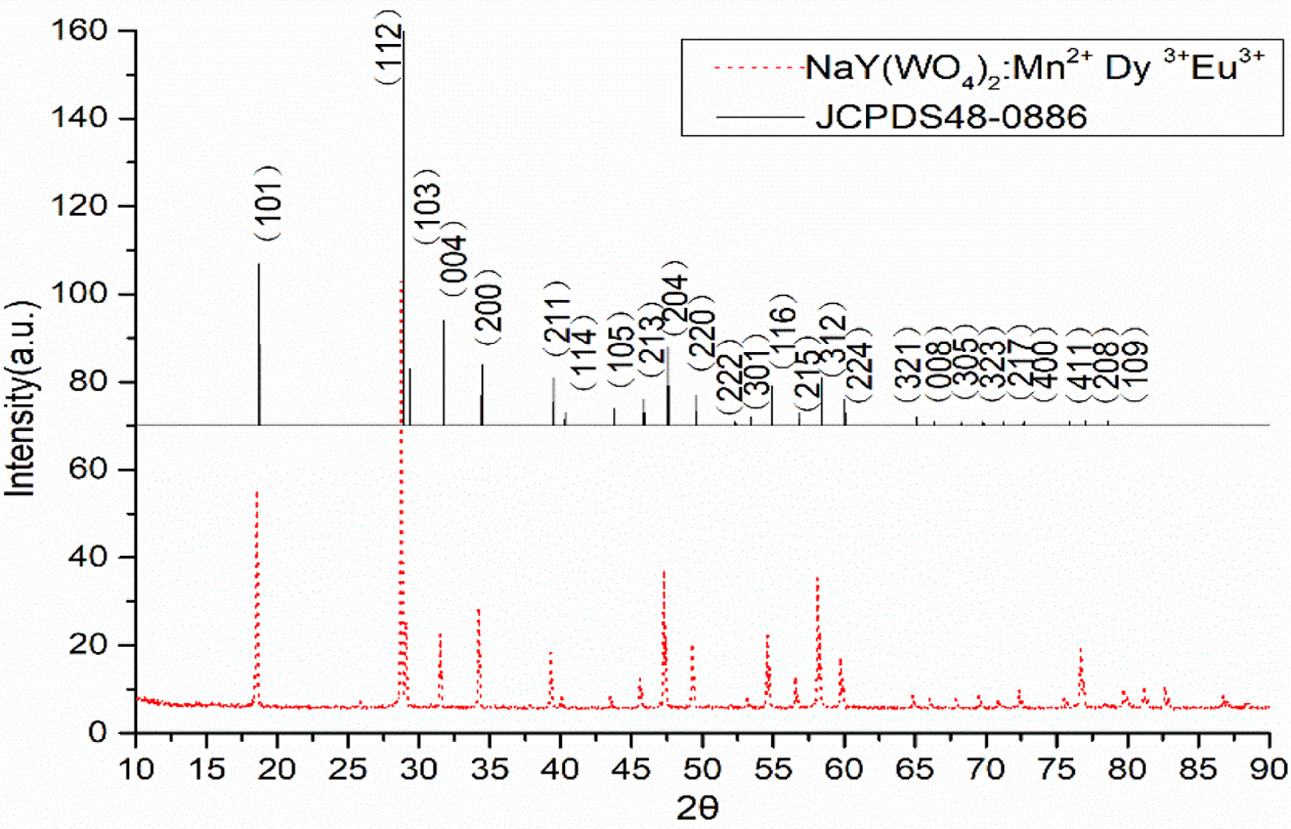
The morphology of the NaY(WO4)2:xMn2+, yDy3+, zEu3+ (x = 4 at%; y = 4 at%; z = 4 at%) phosphors calcined at 800 oC is showed in Fig. 2(a). The measurement in the Fig. 2(a) is 5 um. It can be seen from the Fig. 2(a) that the sample is powdery and uniformly distributed. The size is 1-2 um. SEM showed that we successfully prepared our samples. Through the change of CPS, it can be seen that the sample is evenly distributed in the longer size range of 15 um. The line-EDS spectra were dealt with the maximum 15 KV voltage and 16 μm length. scanning distance vs counts per-second is showed in Fig. 2(b). SEM images exhibit distorted spherical and rectangular sharp. Almost unchanged morphology are observed. This fact illustrates that the doped ions at the present level does not destroy the initial micro-crystal structure, and the stable NaY(WO4)2 microstructures can be reproducibly obtain. the sample keeps still pure single crystal phase.
The concentrations of Mn2+, Dy3+, Eu3, Y3+, W6+ ions were tested by ICP (NaY(WO4)2:4at%Mn2+, 4at%Dy3+, 4at%Eu3+). The constant volume is 25 mL. The used mass is 0.0509 g. It added the 10 mL aqua regia in the samples, in order to make the synthesis more uniform and then samples are heated to 180 oC for chemical reaction. The sample was cooled down for testing after complete reaction. The measured amount of Mn2+, Dy3+, Eu3+, Y3+, W6+ were shown as the following:
Mn2+: 2708.5 mg/kg, Dy3+: 7801.6 mg/kg, Eu3+: 7704.6
mg/kg, Y3+: 85741.6 mg/kg, W6+: 833295.7 mg/kg
So the concentrations of Mn2+, Dy3+, Eu3+, Y3+, W6+ are obtained to be 0.0493 mol/Kg, 0.048 mol/kg, 0.0507 mol/kg, 0.9638 mol/kg, 4.5327 mol/kg. The measured concentration mole ratio of Mn2+, Dy3+ and Eu3+ is identical with the initial synthesis concentration ratios (1:1:1). The result implies that the doped process of Mn2+, Dy3+ and Eu3+ is very easy in host NaY(WO4)2.
Spectra properties of NaY(WO4)2:Mn2+, Dy3+, Eu3+ phosphors
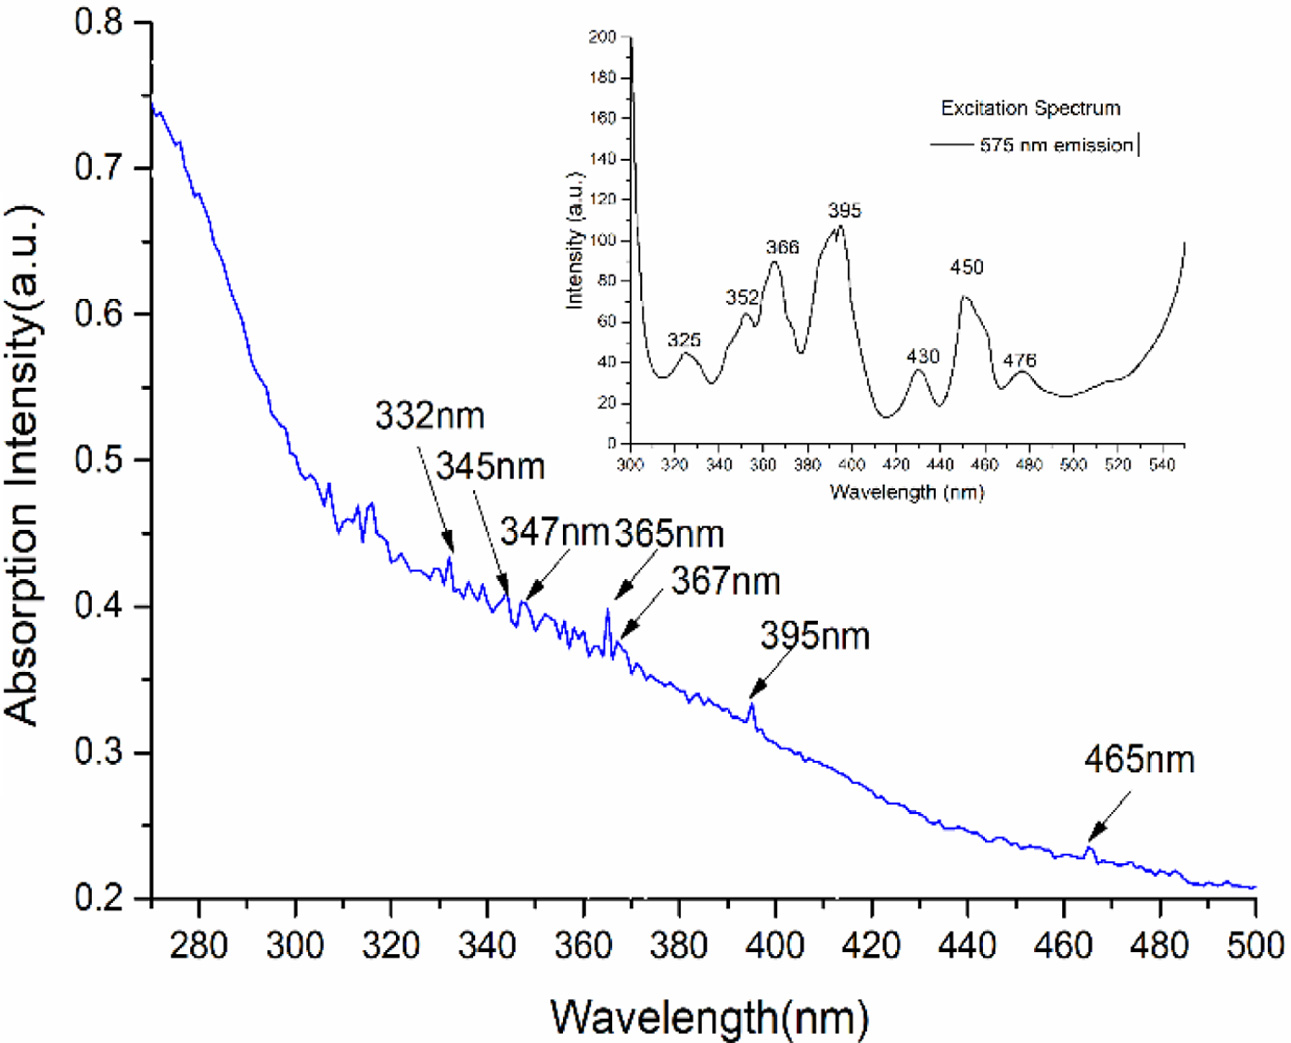
The absorption spectra of the NaY(WO4)2: xMn2+, yDy3+, zEu3+ (x = 6 at%; y = 4 at%; z = 4 at%) phosphors are measured in Fig. 3. Many absorption peaks are obtained from 270-500 nm, these peaks are concentrated at 332 nm (Dy3+), 345 nm (Dy3+, Mn2+), 347 nm (Mn2+), 365 nm (Eu3+), 367 nm(Mn2+), 395 nm (Eu3+), 465 nm (Dy3+, Mn2+). Many peaks of Dy3+, Eu3+ and Mn2+ are overlapped. The absorption spectrum of Mn2+ is always broad, but the Dy3+, Eu3+has relatively sharp absorption peaks.
The excitation spectrum of sample (NaY(WO4)2: xMn2+, yDy3+, zEu3+ (x = 6 at%; y = 4 at%; z = 4 at%)) with 575 nm emission has been measured and are shown in the upper of Fig. 3, seven peaks of Dy3+ concentrated at 325 nm, 352 nm, 366 nm, 395 nm, 430 nm, 450 nm and 476 nm were observed. When the Mn2+ doped in the phosphors, the absorption peaks change heavily. Two strong excitation intensities are found in 365 nm and 395 nm. Compared with the absorption spectrum, the 365 nm is more suitable than 395 nm because of Mn2+. Also 365 nm has more stronger intensity, it is corresponding to the transition of 7F0 → 5D4 (Eu3+), 6A1 → 4T2(Mn2+), 6H15/2 → 4M19/2(Dy3+).
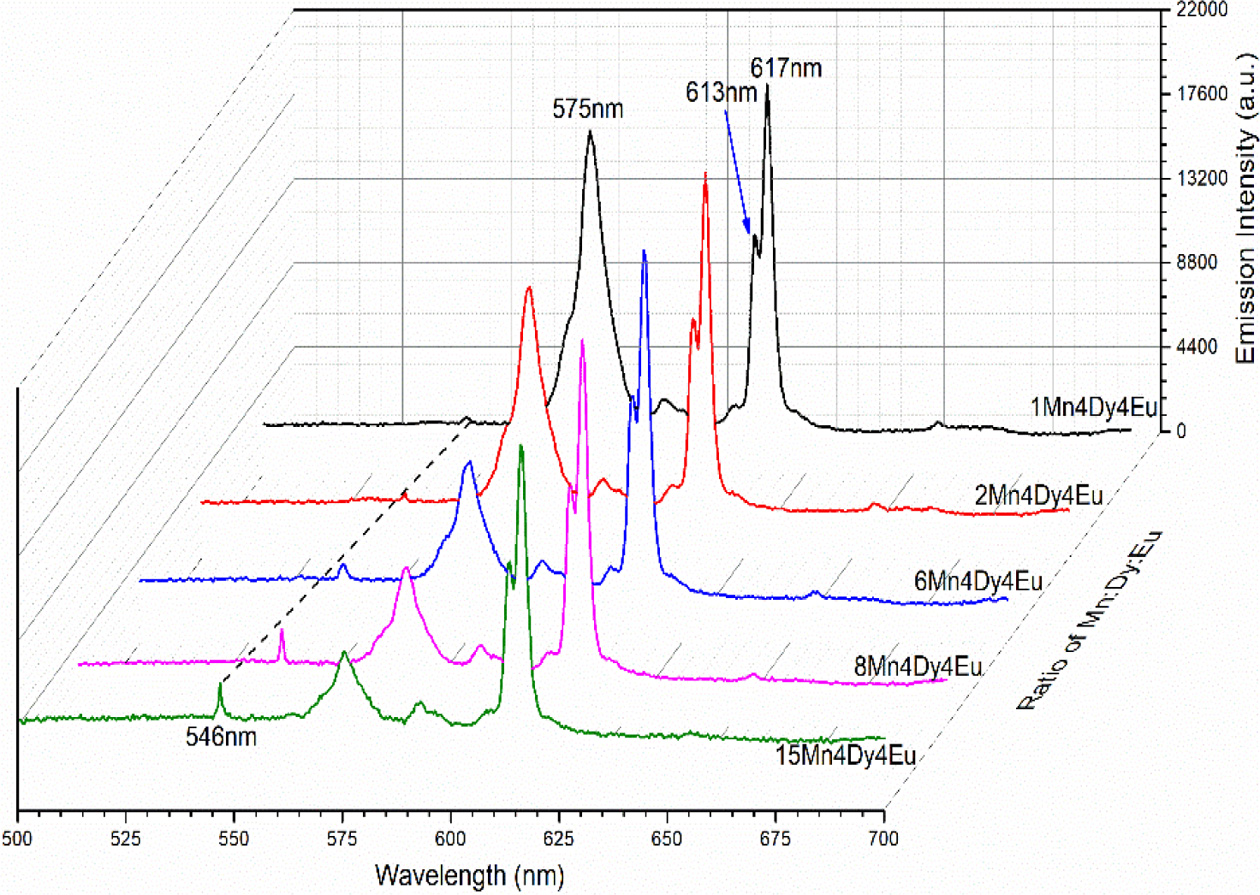
The excitation source is used with the 365 nm LED, the emission spectra are shown in Fig. 4. Three emission peaks center at 546 nm (4T2→6A1 (Mn2+)), 575 nm (4F9/2→6H13/2 (Dy3+)), 613 nm-617 nm (5D0→7F0 (Eu3+)) are observed. In order to facilitate comparison, the 617nm emission light peak intensity is used as a fixed value for comparison. With the increasing doped con- centration of Mn2+, the emission intensity of 546 nm (4T2→6A1 (Mn2+)) becomes stronger. With the decreasing doped concentration of Mn2+, the emission intensity of 575 nm (4F9/2 → 6H13/2 (Dy3+)) becomes stronger. The Mn2+ doping reduces the emission intensity of Dy3+, mainly the reason is that the energy absorbed by Dy3+ is transferred to Mn2+. The main energy transfer way is resonance transmission. And so, we can obtain the tunable green-yellow-red emission with the concentration ratio of Mn2+ to Dy3+ and Eu3++, which contributes to the broad application field such as display, health and plant growth.
The photoluminescence mechanism of NaY(WO4)2: Mn2+, Dy3+, Eu3+phosphor
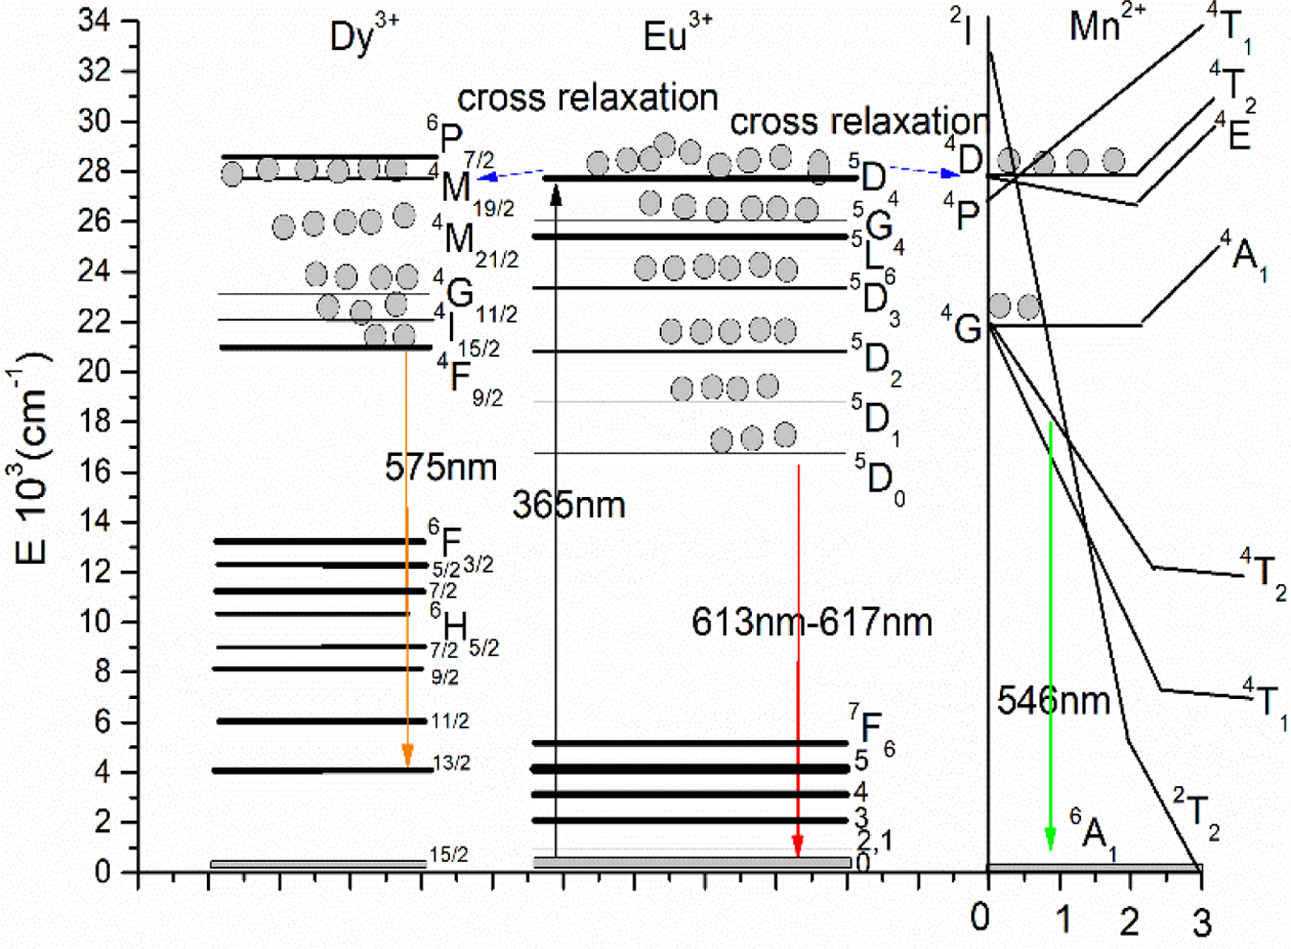
From emission spectra it is obtained that the Mn2+, Dy3+, Eu3+ tri-doped in NaY(WO4)2 have meaningful influence on the tunable green-yellow-red LED. The energy levels of Mn2+, Dy3+, Eu3+ are shown in Fig. 5. With 365 nm exciting, the electrons are inspired to 5D4(Eu3+), and then transit from the 5D4 (Eu3+) to 5G4(Eu3+), 5L6 (Eu3+), 5D3(Eu3+), 5D3(Eu3+), 5D2(Eu3+), 5D1(Eu3+), 5D0(Eu3+) by the non-radiation transition. Finally, the electrons will move to the lower energy level of 5D0(Eu3+) to generate 613-617 nm red emission. The 4D (Mn2+) and 4P(Mn2+) energy levels is near, which are all close to the energy level 5D4 (Eu3+). Also the energy level 5D4(Eu3+) is higher than the 4D (Mn2+) and 4P(Mn2+), which make some of the electrons of Eu3+ transit from the 5D4(Eu3+) to 4D (Mn2+) and 4P(Mn2+) by the cross relaxation. The electrons will continue transit from 4D(Mn2+), 4P(Mn2+) to 4G(Mn2+), the green 546 nm can be obtained corresponding to the transition of 4T2(Mn2+) → 6A1(Mn2+). Energy level of 4G(Mn2+) is close to 4F9/2 (Dy3+), which will enhance the emission from 4F9/2 (Dy3+) to 6H13/2 (Dy3+), the 575 nm yellow emission. The energy level 5D4(Eu3+) is also higher than the 4M19/2 (Dy3+), which make some of the electrons of Eu3+ transit from the 5D4 (Eu3+) to 4M19/2 (Dy3+) by the cross relaxation. The electrons transit from the 4M19/2 (Dy3+)4 to M21/2 (Dy3+),4G11/2 (Dy3+), 4I15/2 (Dy3+), 4F9/2 (Dy3+) by the non-radiation transition. Finally, the electrons will transit from 4F9/2 (Dy3+) to 6H13/2 (Dy3+) to generate the 575 nm yellow light.
Using the Tanabe-Sugano (T-S) theory [25], the energy levels of 3d5 ions is determined by the parameters of Dq, B and C. Dq is the strength of the octahedral crystal field, B and C are Racah parameters. The values of Dq, B and C are determined by the observed peaks of 4T1 (4G), 4T1(4P), and 6A1 states, whose equations are shown as follows [26].
From the absorption and emission spectra, we can obtain that the values of E(6A1→4T1(4G)) = 18,315.0 cm-1 (546 nm), E(6A1 → 4E1(4D)) = 27,397.3 cm-1 (365 nm), respectively. According to the T-S theory, generally, the C/B=4-6 and then here we select the C/B=5. And so, the parameters are calculated to be:
Dq = 337 ± 0.1 cm-1, B = 652.3 ± 0.3 cm-1,
C = 3261.6 ± 0.7 cm-1, Dq/B = 0.52 ± 0.01
In Fig. 5, the energy transition will be different with the Mn2+ doped in the micro-crystal structure. Also we can find the crystal field provides Dq/B=0.52 for the energy level split.
|
Fig. 1 XRD pattern for the phosphor NaY(WO4)2 : xMn2+, yDy3+, zEu3+ (x = 4 at%; y = 4 at%; z = 4 at%), and the standard diffraction pattern in JCPDS card No.48-0886. |
|
Fig. 2 SEM image for NaY(WO4)2 microstructure coped with 4 at% Mn2+, 4 at% Dy3+, 4 at% Eu3+. |
|
Fig. 3 The absorption spectra of NaY(WO4)2: xMn2+, yDy3+, zEu3+ (x = 6 at%; y = 4 at%; z = 4 at%) phosphors; excitation spectrum with 575 nm emission is at the upper. |
|
Fig. 4 Emission spectra of NaY(WO4)2 : xMn2+, yDy3+, zEu3+ (x = 1, 2, 6, 8, 15 at%; y = 4 at%; z = 4 at%) phosphors excited with 365 nm LED. |
|
Fig. 5 Schematic illustration of Eu3+ to Mn2+ and Dy3+ energy levels in NaY(WO4)2: Mn2+, Dy3+, Eu3+excited by 365 nm LED. |
In summary, the NaY(WO4)2: xMn2+, yDy3+, zEu3+ (x = 1, 2, 6, 8, 15 at%; y = 4 at%; z = 4 at%) phosphors were successfully synthesized. The XRD pattern measured indicates it is well identical with the standard JCPDS #48-0886. The result of line-scanning SEM-EDS measured shows that the doped ions of Mn2+, Dy3+ and Eu3+ are evenly distributed in the micro-crystal. The absorption and excitation spectra indicate that the 365 nm is suitable for the excitation source. The emission spectra excited with 365 nm LED are measured with different concentrations ratio of Mn2+ to Dy3+ and Eu3+, it indicate that the 575 nm yellow emission and 546 nm green can be tunable with different concentrations of Mn2+. And then, the 546 nm, 575 nm and 613-617 nm can be mixed to green-yellow-red light. The fluorescence mechanism is also presented, which imply that cross relaxation exist in the xMn2+, yDy3+, zEu3+: NaY(WO4)2 (x = 1, 2, 6, 8, 15 at%; y = 4 at%; z = 4 at%) phosphors. And the high doped concentration of Mn2+ can guarantee the emission intensity of 546 nm enough. The result shows that the NaY(WO4)2: Mn2+, Dy3+, Eu3+ phosphors have good tunable green-yellow-red light with better performance. In this paper, commercial LED 365 nm light source is used for excitation, which makes the products easy to be commercialized, while most other products are fired by Xe-lamp, which is not conducive to commercial applications.
This study was funded by Natural Science Foundation of Fujian Province (Grant Number 2018J01587).
The authors declare that they have no conflict of interest.
- 1. C.G. Ming, F. Song, L.Q. An, and X.B. Ren, Curr. Appl. Phys.14[8] (2014) 1028-1030.
-

- 2. A.J. Peter and I.B. Shameem Banu, J. Mater. Sci. Mater. Electron. 28 (2018) 1-6.
- 3. M.T. Li, T. Takei, Q. Zhu, B.N. Kim, and J.G. Li, Inorg. Chem. 58[14] (2019) 9432-9442.
-
- 4. G. Li, J. Mater. Sci. Mater. Electron. 27[10] (2016) 11012-11016.
-
- 5. S. Sharma, N. Brahme, D.P. Bisen, and P. Dewangan, Opt. Express. 26[22] (2018) 29495-29508.
-
- 6. D.P. Dutta and P. Raval, J. Photochem. Photobiol. A 357 (2018) 193-200.
-
- 7. K.K. Rasu, D. Balaji, and S.M. Babu, J. Lumin. 170 (2016) 547-555.
-
- 8. B. Liu, J.J. Shia, Q.G. Wang, H.L. Tang, J.F. Liu, H.Y. Zhao, D.Z. Li, J. Liu, X.D. Xu, Z.S. Wang, and J. Xua, Opt. Mater. 72 (2017) 208-213.
-
- 9. Y.H. Jin, Y.H. Hu, L. Chen, G.F. Ju, H.Y. Wu, Z.F. Mu, M. He, and F.H. Xue, Opt. Mater. Express. 6[3] (2016) 929-937.
-
- 10. K. Li, H. Wang, X. Liu, W.M. Wang, and Z.Y. Fu, J. Eur. Ceram. Soc. 37[13] (2016) 4229-4233.
-
- 11. B.Y. Zhang, S.T. Ying, S.P. Wang, L.H, J.S. Zhang, and B.J. Chen, Inorg. Chem. 58[7] (2019) 4500-4507.
-
- 12. H. Ren, and F. Yang, J. Mater. Sci., Mater. Electron. 29[18] (2018) 15396-15403.
-
- 13. Q.M. Wei, J.P. Lu, G.C. Liu, and D.W. Liang, Spectrosc. Spect. Anal. 32 (2012) 3329-3334.
- 14. B. Han, B. Liu, Y. Dai, J. Zhang, and H. Shi, Ceram. Int. 45[3] (2019) 3419-3424.
-
- 15. S. Xu, Y. Xiang, Y.Q. Zhang, J.S. Zhang, X.P. Li, J.S. Sun, L.H. Cheng, and B.J. Chen, Sens. Actuators B Chem. 240 (2017) 386-391.
-
- 16. S.Y. Xiang, H. Zheng, Y.Q. Zhang, T.X. Peng, X.Q. Zhang, and B.J. Chen, J. Nanosci. Nanotechnol. 16[1] (2016) 636-642.
-
- 17. M.H. Li, L.L. Wang, W.G. Ran, Z.H. Deng, C.Y. Ren, and J.S. Shi, Ceram. Int. 43[9] (2017) 6751-6757.
-
- 18. Y. Yang, H. Feng, and X.G. Zhang, J. Mater. Sci. Mater. Electron. 26[1] (2015) 229-233.
-
- 19. Z.X. Shi, J. Wang, H. Jiang, X. Guan, Y. Lu, and J. Shi, J. Mater. Sci. Mater. Electron. 30[4] (2019) 3169-3176.
-
- 20. H.l. Song, Q. Han, C. Wang, X.Y. Tang, W.C. Yan, Y.F. Chen, X.R. Zhao, J.F. Jiang, and T.G. Liu, Opt. Mater. 78 (2018) 402-406.
-
- 21. A. Durairajan, D. Balaji, K.K. Rasu, S.M. Babu, M.A. Valente, D. Thangaraju, and Y. Hayakawa, J. Lumin. 170 (2016) 743-748.
-
- 22. Y.H. Wu, F.G. Yang, and F.P. Yan, J. Am. Ceram. Soc. 102[12] (2019) 7347-7354.
-
- 23. P.S. Mbule, B.M. Mothudi, and M.S. Dhlamini, J. Lumin. 192 (2017) 853-859.
-
- 24. T. Liu, Q.Y. Meng, and W.J. Sun, J. Alloy. Compd. 647 (2015) 830-836.
-
- 25. K. Ohkubo and T. Shigeta, J. Illum. Eng. Inst. 83[2] (1999) 87-93.
-
- 26. Y. Tanabe and S. Sugano, J. Phys. Soc. Jpn. 9[5] (1954) 766-799.
-
 This Article
-
2021; 22(4): 436-440
Published on Aug 31, 2021
- 10.36410/jcpr.2021.22.4.436
- Received on Nov 25, 2020
- Revised on Feb 13, 2021
- Accepted on Mar 2, 2021
Services
- Abstract
introduction
experimental section
results and discussion
conclusions
- Acknowledgements
- Conflict of Interest
- References
- Full Text PDF
Shared
Correspondence to
- Yonghua Wu
-
College of Electronic and Information science, Fujian Jiangxia University, Fuzhou, Fujian, 350108, P.R. China
Tel : +86-189-0591-1552 Fax: +86-591-22823853 - E-mail: wuyonghua@fjjxu.edu.cn
Clean-Energy Research Institute(CRI), Hanyang University, 222, Wangsimni-ro, Seongdong-gu, Seoul, 04763, Korea
E-mail: jcpr@hanyang.ac.kr