


- Effect of hydrothermal time on the structure and property of graphene oxide membrane
Tran Van Khaia,b,d,*, Pham Thuy Tranga,d, Le Ngoc Longa,d, Le Van Thanga,b,d, Tran Duc Chaua,d, Vuong Vinh Data,b,d and Mai Thanh Phongc,d,*
aFaculty of Materials Technology, Ho Chi Minh city University of Technology (HCMUT), 268 Ly Thuong Kiet Street, District 10, Ho Chi Minh City, Vietnam
bVNU-HCM Key Laboratory for Material Technologies, Ho Chi Minh city University of Technology (HCMUT), 268 Ly Thuong Kiet Street, District 10, Ho Chi Minh City, Vietnam
cHo Chi Minh City University of Technology (HCMUT), 268 Ly Thuong Kiet Street, District 10, Ho Chi Minh City, Vietnam
dVietnam National University Ho Chi Minh City, Linh Trung Ward, Thu Duc District, Ho Chi Minh City, VietnamThis article is an open access article distributed under the terms of the Creative Commons Attribution Non-Commercial License (http://creativecommons.org/licenses/by-nc/4.0) which permits unrestricted non-commercial use, distribution, and reproduction in any medium, provided the original work is properly cited.
Two dimensional graphene oxide (GO) has potential application in membrane separation owing to its unique structure and physicochemical properties. In this study, the reduced graphene oxide (rGO) was synthesized from GO via hydrothermal treatment at 160 oC for 1, 2, 3 and 4 h, and the rGO membranes were prepared on cellulose nitrate supporting membranes by vacuum filtration. The structural change and chemical composition of GO were investigated using X-ray diffraction (XRD), Raman spectroscopy, Fourier transform infrared spectroscopy (FTIR), field emission scanning electron microscopy (FESEM), atomic force microscopy (AFM), transmission electron microscopy (TEM), energy-dispersive X-ray spectroscopy (EDS) and contact angle measurements. The result shows that uniformly intact rGO membranes with good hydrophobicity could be achieved by adjusting the reduction degree of GO through changing the hydrothermal reaction time. The huge improvement of the hydrophobic property of rGO could be attributed to the removal of the most the hydrophilic oxygen-containing functional groups on the surface of GO. Additionally, the structure, chemical composition, and d-spacing of the GO can also be controlled by adjusting the reduction time. This method holds great potential because it can be prepared in large quantities at low cost, and suitable for applications in membrane technologies
Keywords: Graphene oxide, reduced graphene oxide, hydrothermal method, membrane
Graphene, a single layer of sp2-bonded carbon atoms arranged in a two-dimensional (2D) hexagonal lattice has received considerable attention due to its excellent properties including electrical conductivity, thermal stability, large surface area and mechanical strength [1, 2]. Due to this unique property, it is used in various different fields and applications such as sensors [3, 4], batteries [5, 6], solar cells [7] and supercapacitors [8], electrocatalytic [9] and photocatalytic [10] applications. Graphene oxide (GO), a derivative of graphene, is also a promising material for various environmental appli- cations such as sorption [11], desalination [12], water/air purification [13], gas separation [14, 15], pervaporation [16], as well as for biomedical [17, 18] applications. Among those applications, the use of GO in membrane application is particularly attractive because they are easy to fabricate, mechanically and chemically robust, and can be amenable to industrial-scale production with low cost [15, 19-22].
Currently, most GO is synthesized by chemical oxidation and exfoliation of pristine graphite using strong oxidizing agents. The structure of GO comprises hydroxyl and epoxide functional groups on the basal plane and carbonyl and carboxyl groups at the sheet edges, together with residual non-functionalized graphitic areas [23, 24]. Owing to the existence of the hydrophilic and negatively charged oxygen functional groups, GO can be easily dispersed in water and other organic solvents to form well-dispersed aqueous GO colloids, which provide a facile approach to assemble GO nano- sheets into thin laminar membranes [25, 26]. Additionally, the functional groups as well as structural defects are introduced in the basal plane of GO sheets [27], which can provide primary passages for water transport in GO membranes [21, 28, 29]. It has been shown that the oxidized regions of GO act as spacer to provide relatively large interlayer distance to accommodate water molecules while the non-oxidized regions of GO facilitate rapid water permeability by nearly frictionless flow [20]. At the same time, GO membranes possess a tunable interlayer distance (d-spacing) between the neighboring GO nanosheets which allows the selective passage of molecular or ionic [30-33]. For example, Chen et al. reported that the interlayer d-spacing of GO membranes plays a key role in their ion rejection performance [29]. Joshiet al. [19] and Nair et al. [20] demonstrated that GO membrane (d-spacing of ~0.9 nm) allowed the pure water to pass through, while hydrated ions with larger radii than the water molecule are blocked. Meanwhile, the GO membrane with a d-spacing smaller than 0.3 nm (in some reports 0.6 nm) not is favorable for water or gas molecules to pass through [15, 34, 35]. By adjusting the interlayer distance between the GO nano- sheets through interlayer intercalation, a variety of GO membranes could be produced to precisely separate the target ions and molecules with specific sizes from the bulk solution [21, 36]. However, pure GO membranes, fabricated by solution filtration, are not suitable for water treatment. These membranes are hydrophilic, and they are easily damaged in aqueous medium due to hydration and electrostatic repulsion of the negatively charged oxygen-containing groups under hydration conditions [37, 38]. In addition, the in-plane oxygen functional groups can hinder the water transport in graphene nanochannels by hydrogen bond interaction [39]. Due to this, pure GO membranes usually exhibit low water permeance. Therefore, the removal of oxygen functional groups and control of the interlayer spacing of 2D-GO materials are of great importance to the separation performance of 2D lamellar membranes.
Recently, several methods have been proposed to modify the structure and interlayer spacing of a stacked GO film. For example, Huang et al. [40] showed that the nanochannels in the GO-based membranes could be modulated by adjusting the pH, salt concentration and the applied pressure. By optimizing experimental parameters, the as-prepared GO membranes exhibited a high water permeance of 71 L m−2 h−1 bar−1 and rejection over 85% for Evans blue. By changing the contents of GO loading on the polysulfone membranes [41], the performance of the GO membranes could be reached to 3÷16 L m−2 h−1 bar−1 for pure water flux and a rejection of 45÷72% for sodium sulfate. Xu et al. [42] reported that the attachment of TiO2 on the GO surface resulted in the increased interlayer spacing of GO-TiO2 composite membrane due to formation of special pores and nano- channels in the membranes. These GO-TiO2 membranes showed outstanding rejection and adsorption capacities of Methyl orange and Rhodamine B. On the other hand, the structure and interlayer spacing of GO in the form of a layer-stacked membrane can be modulated by reduction methods, such as thermal annealing [43-45], microwave radiation [46, 47], chemical [48, 49], hydrothermal [50, 51], and photocatalytic reduction [52-55]. Among them, hydrothermal reduction of GO is a simple, low-cost, easy-operation and scalable process and has a high potential for the large-scale fabrication of rGO for membrane applications. Herein, we report a simple method to synthesize rGO by hydrothermal reduction without using any reducing agent and prepare rGO membranes on cellulose nitrate membranes by vacuum filtration. In order to control the interlayer spacing and properties of GO, the reduction degree of GO nanosheets was modulated by adjusting the hydro- thermal reaction time. The as-prepared materials were firstly characterized by using various techniques such as TEM, FESEM, AFM, XRD, Raman, FTIR and EDS. Then, the influence of hydrothermal reaction time on the hydrophility of rGO membranes was evaluated by measuring the contact angle of the surface of the rGO membranes.
Synthesis of graphene oxide (GO)
GO nanosheets were prepared from graphite flakes via a modification of Hummers’s method, study details have been reported previously [56]. In brief, 1 gram of graphite flakes, 12 mL of H3PO4 (98%), and 46 mL of H2SO4 (98%) were stirred in an ice bath and kept at ~5 oC for 15 min, and then 12 gram of KMnO4 (98%) was slowly added to the above mixture. The resulting mixture was transferred to a 35 ± 5 oC water bath and stirred for 3 h, forming a thick paste. Next, distilled water (90 mL) was slowly dropped into the resulting paste to dilute the mixture, and then the solution was stirred for 5 h while the temperature was raised to 90 ± 5 oC. Finally, 90 mL of distilled water was added, followed by the slow addition of 10 mL H2O2 (30%), turning the color of the solution from dark brown to yellow. The graphite oxide deposit was collected from the graphite oxide suspension by high-speed centrifugation at 15,000 rpm for 30 min. The obtained graphite oxide was then washed with 200 mL of HCl (5%), and repeatedly washed with distilled water until the pH = 7. Then, the final precipitates were redispersed in 500 mL of distilled water with mild sonication for 7 h, producing a solution of exfoliated GO nanosheets. To obtain uniform GO, a low-speed centrifugation at 4,000 rpm was first used to remove thick multilayer GO sheets until all the visible particles were removed (3÷5 min). Then the supernatant was further centrifuged at 10,000 rpm for 30 min to remove small GO pieces and water-soluble byproduct.
Synthesis of rGO and preparation of rGO membranes
The obtained aqueous GO suspension was reduced to rGO colloid by hydrothermal method without using any reducing agent. At first, 125 mL of the as-prepared GO suspension (~1 mg GO/mL) was transferred into a 200-mL Teflon-lined stainless-steel autoclave and sealed. Then, the autoclave was put into an oven, heated at 160 oC for 1 h, 2 h, 3 h and 4 h, respectively; and cooled naturally in air, producing black rGO precipitates. These black precipitates were isolated from solution by centrifugation. The as-synthesized rGO were marked as rGO1, rGO2, rGO3 and rGO4 corresponding to the hydrothermal time of 1 h, 2 h, 3h and 4 h. Finally, rGO membranes were fabricated on cellulose nitrate (Filter diameter: 47 mm, pore size: 0.45 µm, Part No: 7184-004, Whatman International Ltd, England) supporting membranes with a suitable volume of the rGO dispersion by vacuum filtration. After drying in air, these membranes were saved in a vacuum furnace at 40 oC. The thickness of the rGO membrane can easily controlled by adjusting the volume of rGO dispersion.
Characterization
The phase identification and structural characterization of synthesized samples were performed by X-ray diffraction using a Bruker D8 Advanced diffractometer (Rigaku, Tokyo, Japan) with CuKα radiation (λ = 1.54178 Å, 40 kv, 200 mA). The surface morphology and compositions of GO and rGO materials were char- acterized by using a field-emission scanning electron microscope (FESEM, Hitachi S-4800 FESEM, Tokyo, Japan) operated at an accelerating voltage of 10 kV, equipped with an energy dispersion X-ray spectroscopy analyzer (EDS). Transmission electron microscope (TEM) images were obtained on a JEOL JEM-2010 transmission electron microscope (JEOL Ltd., Tokyo, Japan) with an accelerating voltage of 200 kV. Atomic force microscopy (AFM, XE-100) was carried out to observe the surface roughness and line profile. The Raman spectra were measured using a Jasco Laser Raman Spectrophotometer NRS-3000 Series, with an excitation laser wavelength of 532 nm, at a power density of 2.9 mW·cm-2. The FTIR spectra (500-4000 cm-1) were taken using a Nicolet IR100 FTIR spec- trometer. The contact angle of the rGO membranes was measured to examine its hydrophilicity by a contact angle tester (KSV CAM101, KSV Instruments Ltd, Helsinki, Finland).
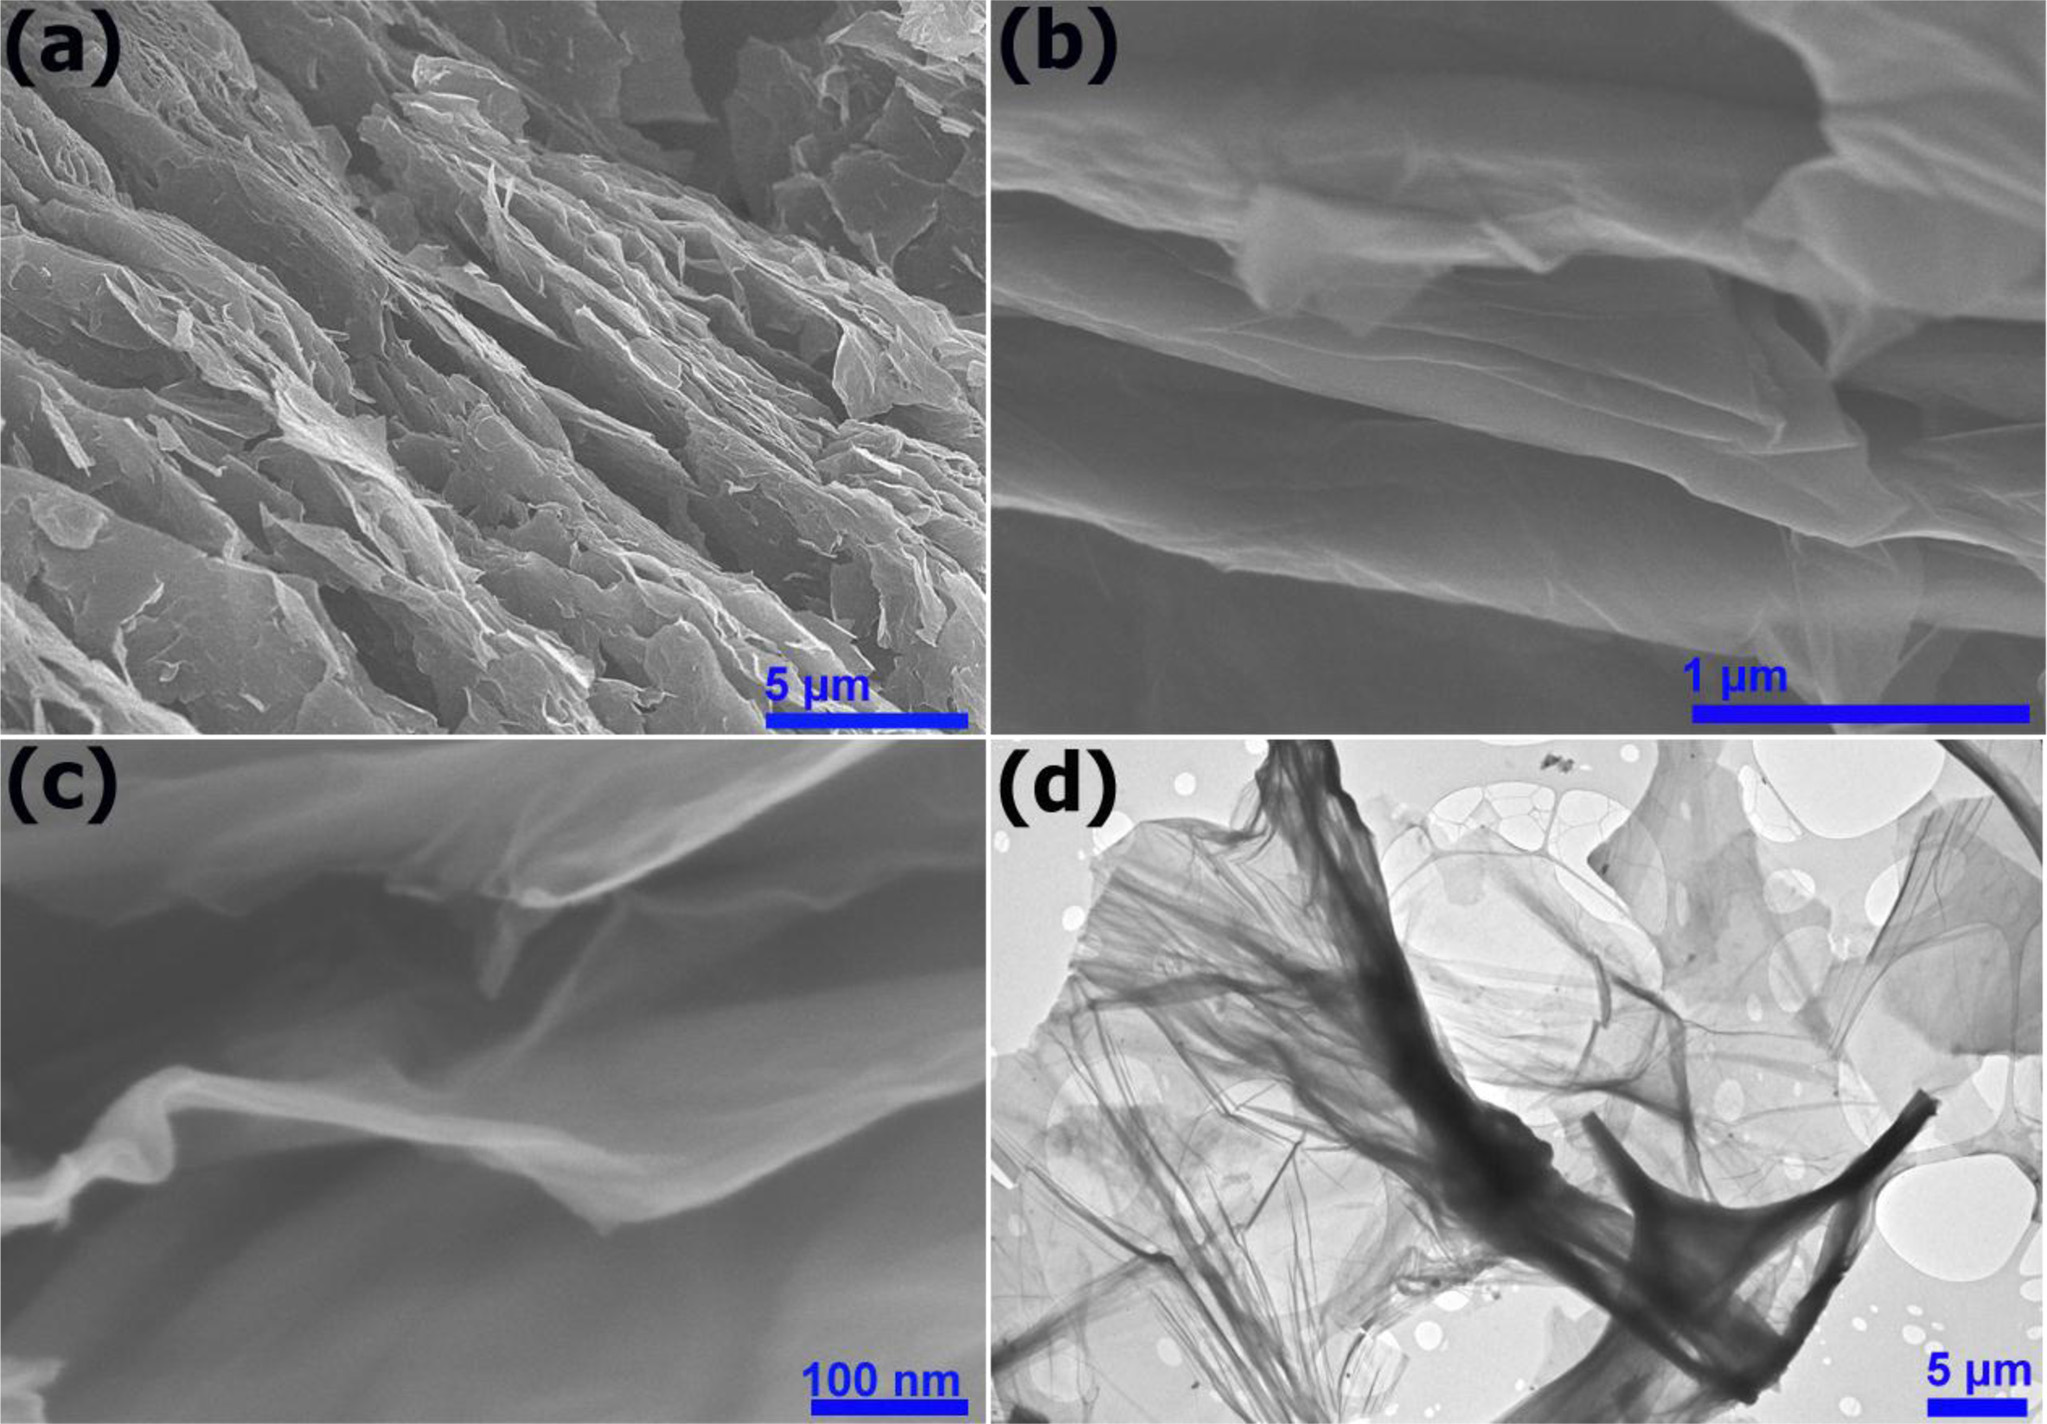
The surface morphology and structural characteristics of the GO nanosheets have been investigated by SEM and TEM. Fig. 1(a, c & b) shows the SEM images of graphite oxide and GO sheets, respectively. The SEM image of graphite oxide reveals that the material has a layered morphology and consists of the individual GO sheets closely associated with each other forming a three-dimensional network structure, as shown in Fig. 1(a). Therefore, ultrasonic treatment is required for full separation of layers [57]. It was reported that a single-layer or a few-layer GO could be achieved after dispersing in water, in which the thickness of a mono-layer was measured to be 0.8-0.9 nm [56, 58]. From the Fig. 1(b), it is clear that after sonication of graphite oxide, few and/or multilayer GO sheets are produced. The high-resolution SEM imageof GO (Fig. 1c) clearly exhibits the few-layer of graphitic carbon with typical wrinkled behavior [59-61]. The edges of GO sheets slightly curved due to surface tension and/or the presence of oxygen-containing functional groups on its surfacesand edges. Fig. 1(d) indicates the TEM image of GO sheets with lateral dimensions ranging from several of micrometers to tens of micrometers. Transparent sheets of a single or few layers of GO with typical wrinkled and crumpled behaviour was observed.
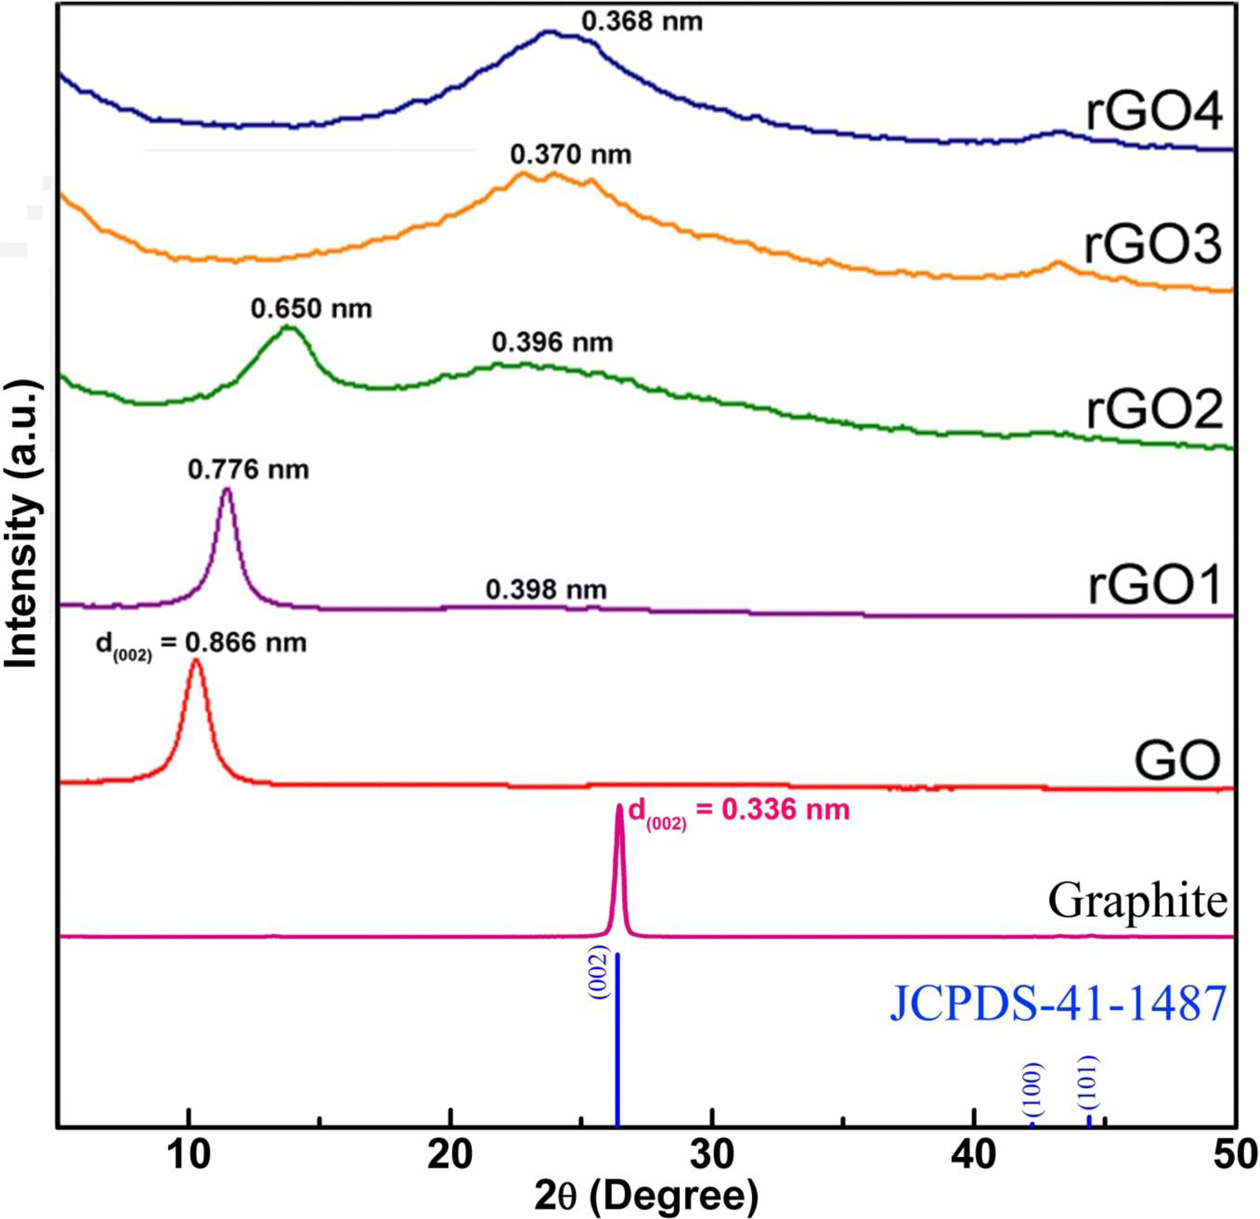
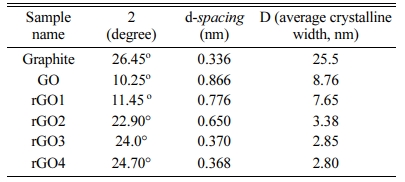
The XRD diffraction pattern of graphite flake, GO and rGO along with JCPDS data were shown in Fig. 2. For the pristine graphite sample, there are peaks at 2θ of ~ 26.45o, 42.22o and 44.38o, which could be indexed to the characteristic peaks (002), (100) and (101) plane reflections of graphite (JCPDS No. 41-1487, 3.3756 Å). The (002) sharp peak at 2θ = 26.45o, corresponding to an interlayer distance (d-spacing) of about 0.336 nm, which is the typical interlayer spacing of stacked graphene sheets in pristine graphite [56]. After the oxidation and exfoliation processes, the dominant diffraction peak shifted to a lower angle of 2θ = 10.25o (corresponding to the (002) planes of GO), indicating that the graphite was mostly well-oxidized and exfoliated into few-layered GO sheets. The d-spacing of GO is calculated to be ~ 0.866 nm, which is much higher compared with the pristine graphite (~ 0.336 nm). According to the previous studies, an increase in interlayer spacing is mainly attributed to the intercalation with water and the presence of a large number of oxygen-containing func- tional groups on the basal plane of the graphene sheet [62-65]. After 1-h hydrothermal treatment (rGO1), the dominant peak slightly shifted towards a higher angle (2θ = 11.45o), showing the decrease in the d-spacing (0.776 nm). Meanwhile, a relatively weak and broad shoulder was observed at 2θ = 22.3o, corresponding to an interlayer distance of 0.398 nm. This suggests that the reduction has taken place within 1 h; and thus, the decreasing of d-spacing occurred due to the removal of oxygen groups during the reduction process [66]. After a 2-h hydrothermal reduction (rGO2), the intensity ofthe shoulder peak (2θ = 22.9o, d-spacing of 0.396 nm) becomesmore pronounced. However, a weak GO peak still can be observed (2θ = 13.7o, d-spacing of 0.650 nm), indicating the coexistence of rGO and GO or incompletion of GO reduction. After 3-h reduction (rGO3), the GO peak disappeared and left a broad rGO peak on the spectrum with a d-spacing of 0.370 nm (2θ = 24.0°). Also, the absence of the characteristic diffraction peak at 2θ = 10.25° indicates that a large amount of functional groups has been removed during reduction process. The rGO peak position remains almost the same up to a reduction time of 4 h (2θ = 24.7o, d-spacing of 0.368 nm). However, the intensity of the rGO peak increases, which can be attributed to restacking or overlapping of rGO sheets [67].
Different from the XRD peak positions (that depends upon interlayer spacing), the peak width is highly dependent on size of graphitic domains existing inside the macroscopic graphene materials. Generally, the average crystallite width (D) is calculated by using classical Debye-Scherrer equation [68]:

where is the full width at half maximum height (FWHM) expressed in radians; is half diffraction angle; cosvalue is in radians; is the wavelength of the incident X-ray (=0.154 nm); and K is a constant related to crystalline shape, normally taken as 0.89 for spherical crystals with cubic unit cells.
Table 1 depicted the result of the average crystalline size that were available in graphite, GO and rGO samples. It has been found that the average crystallite size significantly reduces in GO (~ 8.76 nm) compared with that of graphite (25.5 nm). From the result, it could be concluded that the present method was efficient to separate the graphite into individual GO sheets. For the rGO samples, it has been observed that the average crystallite size continuously decreases with increasing hydrothermal time and reaches the lowest value of 2.80 nm at hydrothermal time of 4 h. This may be due to the shrinking of graphitic domains (i.e., disruption of graphitic stacked ordering) and formation of more grain boundaries or lateral defects, which may take place due to removal of oxygen functional groups and/or expulsion of graphene layers from domains upon reduction.
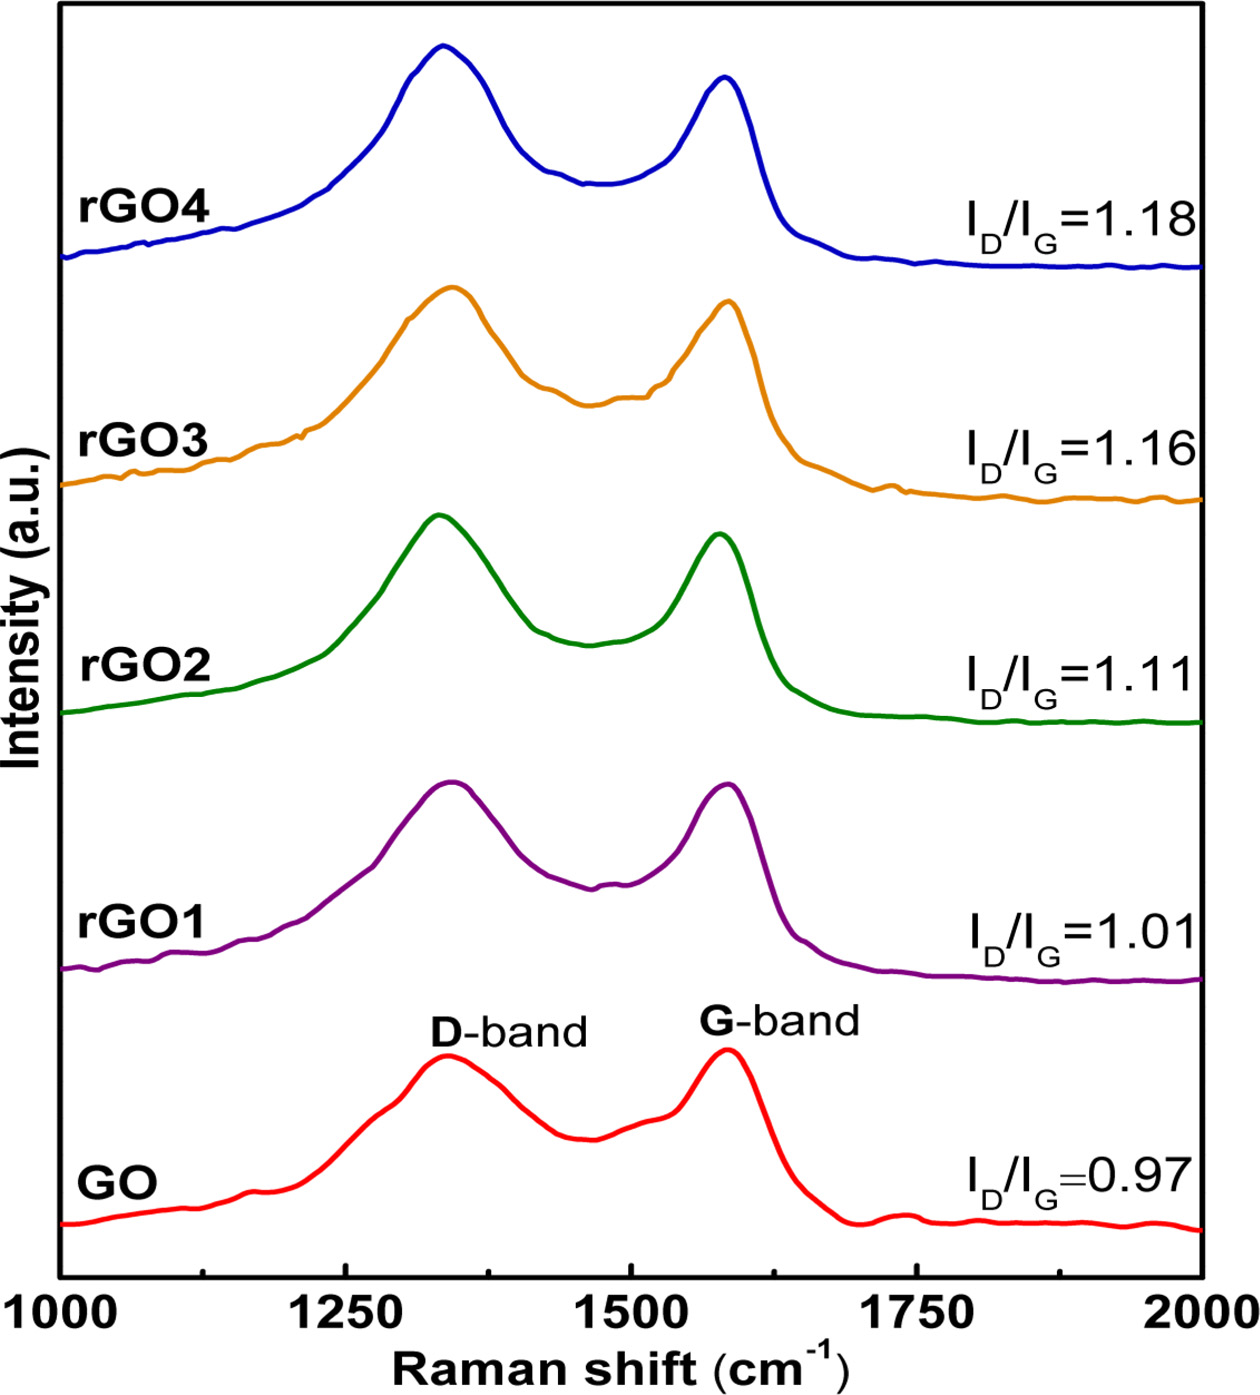
Raman spectroscopy is a widely used tool for analyzing the structural changes of carbon-based materials (graphene, rGO, GO, etc), such as disorder and structural defect, defect density, and doping levels [69, 70]. Two remarkable features have been frequently observed in the Raman spectra of carbon-based materials, namely the G-band (~ 1,582 cm-1) and the D-band (~ 1,330-1,450 cm-1, depending on laser wavelength). The G-band is attributed to the first-order scattering of the E2g mode of sp2-carbon domains at the Brillouin zone center, whereas the D-band arises from a breathing mode k-point phonons of Ag1 symmetry and is related to the sp3-hybridzed, structural defects, grain boundaries, carbon amorphous and/or edge planes [71-73]. Fig. 3 shows the Raman spectra of the GO, rGO1, rGO2, rGO3 and rGO4 samples. It is observed that all spectra have a similar shape and they exhibit two dominant Raman peaks (~ 1,331-1,341 cm-1) and (~1,579-1,585 cm-1), which correspond to the well-documented D and G bands, respectively [74]. Generally, a smaller intensity ratio of the D and G bands (ID/IG) in a Raman spectrum can be assigned to lower concentration of defects and disorders (e.g. wrinkle, fold, pore and edge) in the carbonous materials, smaller fraction of sp3/sp2-bonded carbon, and/or larger size in-plane graphitic crystallite sp2 domains [71, 72, 75, 76]. In comparison with the D (~ 1,358 cm-1) and G (~ 1,582 cm-1) bands of starting graphite material [56], the observed G-band of GO is broadened and shifted to ~ 1,583 cm-1 whilst the D-band at ~ 1,331 cm-1 becomes more prominent, denoting the destruction of sp2 conjugated system and formation of structural defects in the carbon lattices due to harsh oxidation by strong acids during the synthesis process. Remarkably, the ID/IG intensity ratio of GO (~ 0.97) increases com- pared to that of graphite (~ 0.11) [56], which further suggests an increase of defects and disorders, but along with a decrease in average size of sp2 domain in the exfoliated GO. The ID/IG ratio increased to 1.03 after the hydrothermal reduction for 0.5 h, suggesting that more structural defects were introduced during the process. In this reduction step, although the oxygen-containing functional groups are partially reduced to recover the conjugated graphite network, the vacant lattice sites formed by the removal in the form of CO or CO2 during oxidation remain unchanged. Most studies report that GO has an ID/IG value of lower than 1, and rGO has a value higher than 1 [73, 77-79]. This feature is usually explained as a decrease in the average size but an increase in the number of sp2 domains during the reduction [73, 77]. Otherwise, the incomplete re- storation of sp3 defects after reduction reactions also could lead to ID/IG ratio increase [80]. Notably, the intensity of D-band not only represents the defects of graphene, but also the edges, more exposed edges increase the ID/IG ratio [81]. In the present study, the ID/IG ratio of GO was 0.97 and that of rGO1 was 1.01, which is good agreement with most chemical reduction reports. With increasing the hydrothermal reduction time from 0.5 to 4 h, the ID/IG value of rGO gradually increases from 1.01 to 1.18, indicating that average size of all sp2 clusters were decreased due to lots of smaller sp2 domains are generated and the disorder degree and defects in rGO increase [82]. It is reported that the ID/IG value remains almost unchanged when hydrothermal reduction time exceed ~ 6÷10 h, which indicates that the number of sp2 carbon domains, disorder degree and defects of rGO have no obvious change with increasing the hydrothermal reduction time [58].
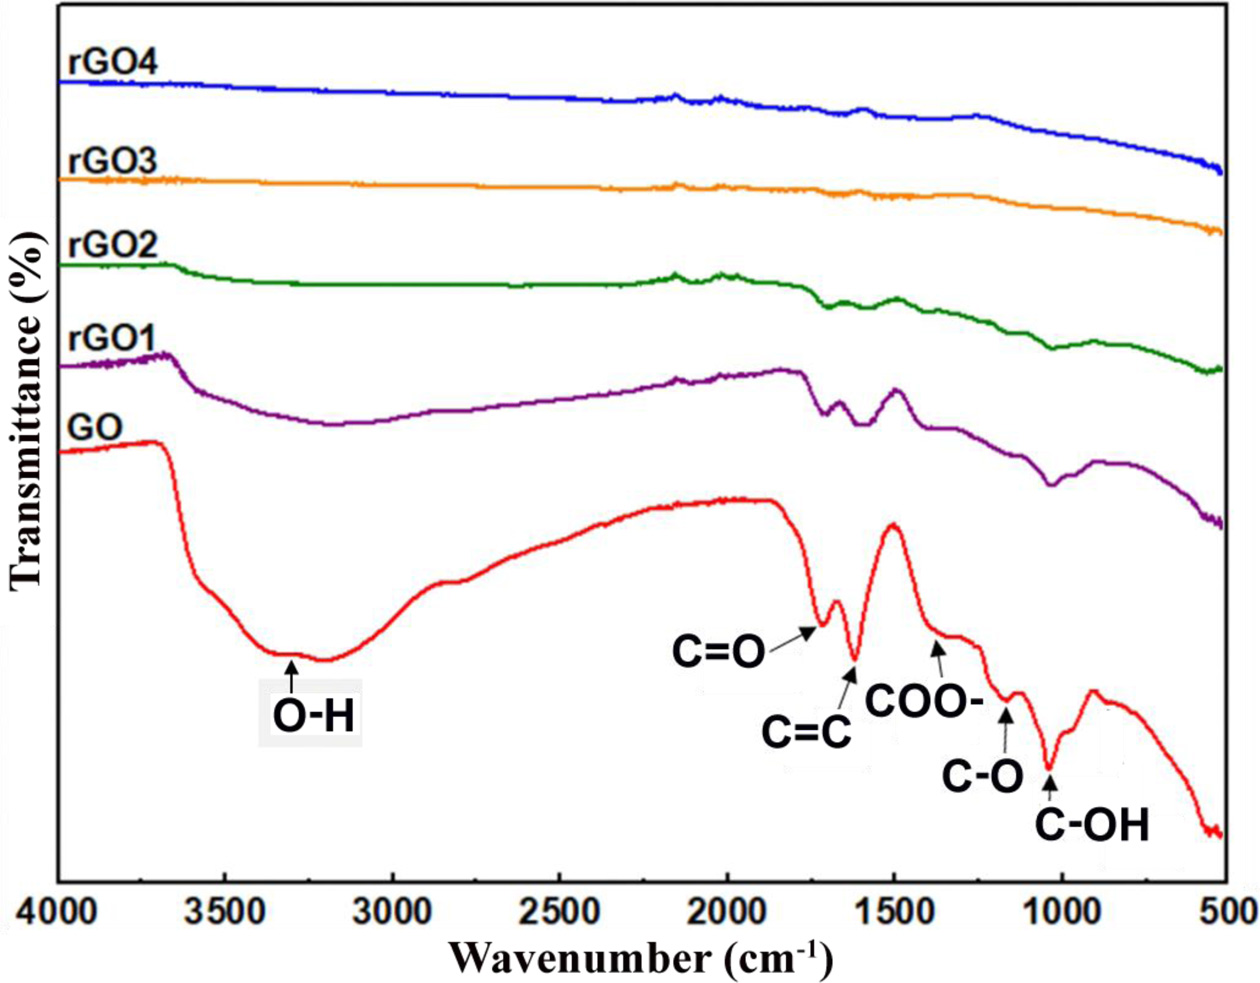
Fig. 4 shows the FTIR spectra of GO, rGO1, rGO2, rGO3, and rGO4 samples. The FTIR spectrum of GO exhibits a strong and broad band at ~ 3,400 cm-1, which is due to the stretching vibration O-H groups of water molecules adsorbed on GO. The absorption band value of ~ 1,616 cm-1 is attributed to the aromatic C=C stretching vibration of the carbon domains [83]. The oxygen-containing functional groups of GO described by value of ~ 1,716, 1,389, 1,223 and 1,042, corresponding to the carbonyl C=O, carboxyl COO-, epoxy C-O and alkoxy C-OH stretching vibrations [83, 84]. This result clearly indicates that a large number of functional groups were introduced into carbon frameworks upon oxidation. After the hydrothermal treatment for 0.5 h, the charac- teristic absorption peaks responsible for the oxygen functional groups were significantly reduced in intensity, indicating the removal of the functional groups. With an increase hydrothermal treatment time, the intensity of the peaks gradually decreases. Especially the hydro- thermal treatment for more than 3 h, the peaks are almost completely removed from the surface of GO.
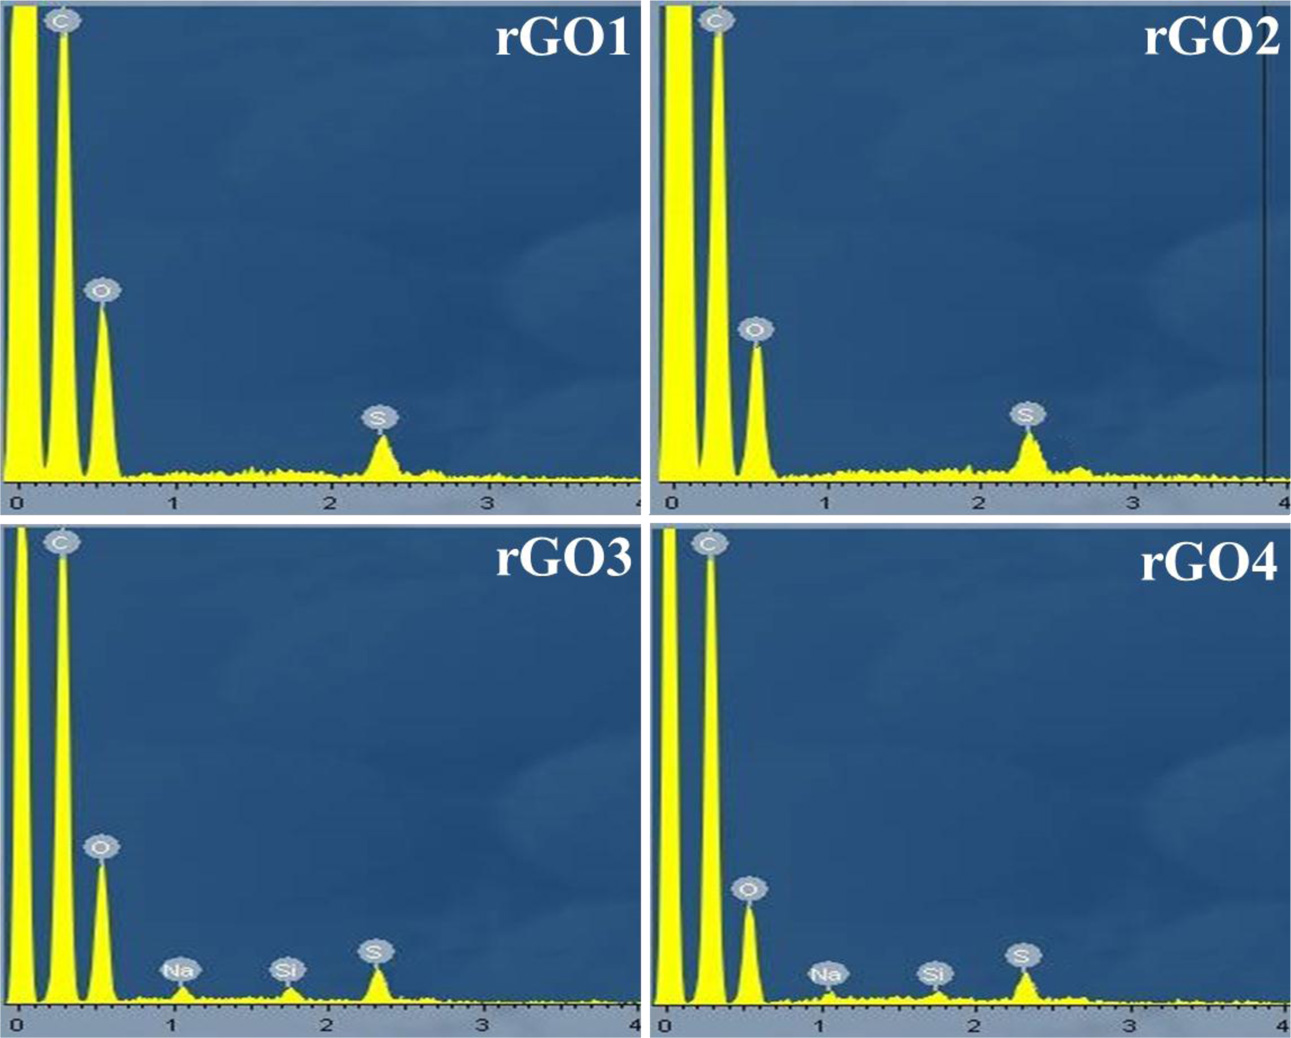
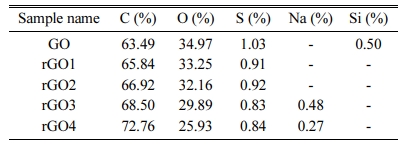
The composition of the rGO nanosheets is determined by energy-dispersive X-ray (EDX) spectroscopy ex- periment, as is shown in Fig. 5. As a result, C and O elements were identified, the atomic percentage (at.%) of each element was calculated from the spectra, and the result was summarized in Table 2.The effective hydrothermal reduction is clear because the content of oxygen (O) atom of rGO decreases compared with GO. The oxygen content decreased in the rGO samples in the order of GO > rGO1 > rGO2 > rGO3 > rGO4, suggesting the effectiveness of removal of the oxygen-functional groups upon on reduction of the exfoliated GO sheets.
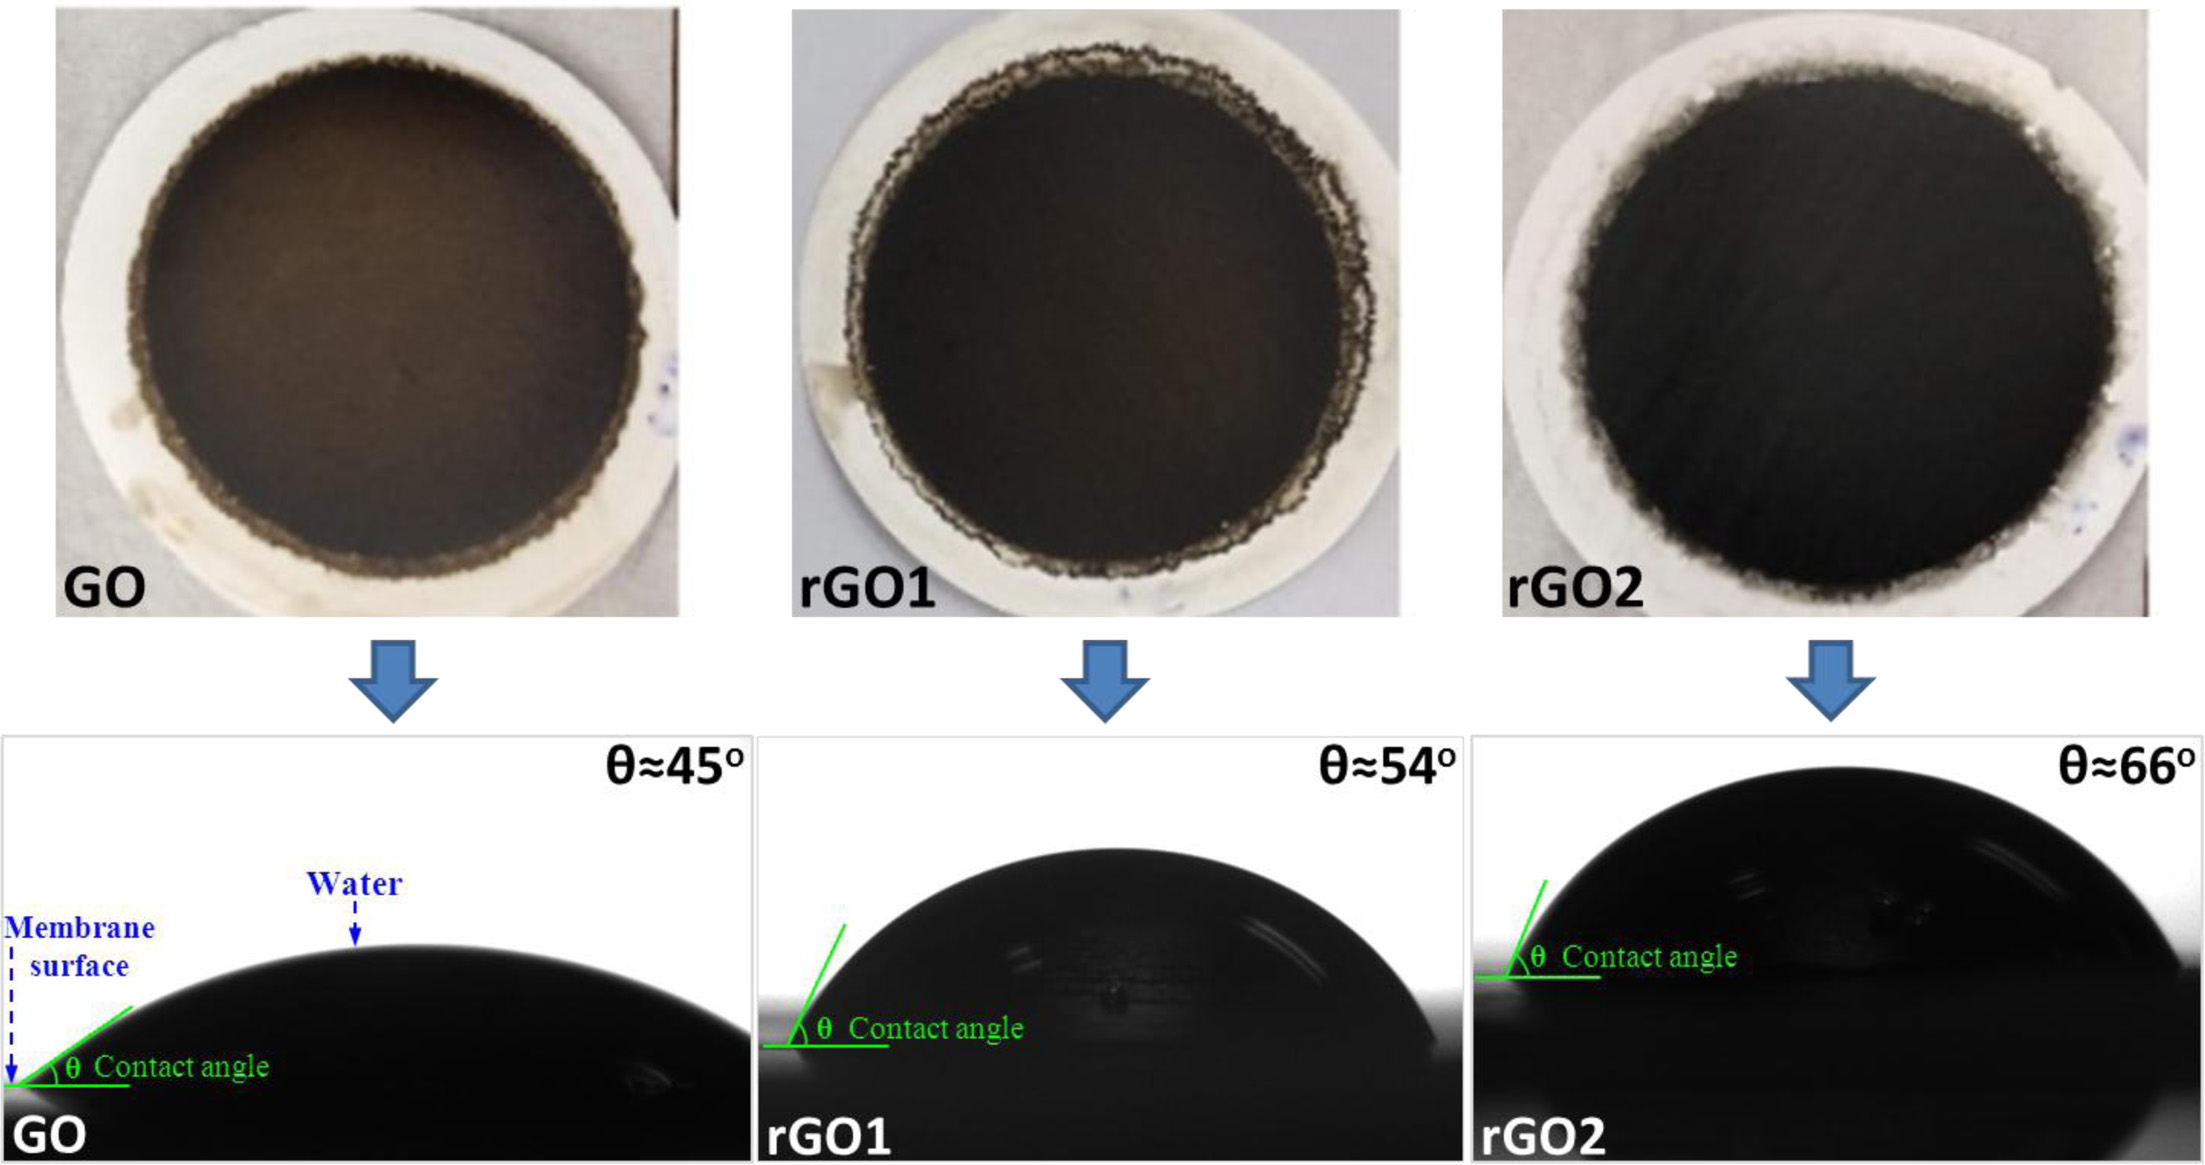
Depending on the oxidation conditions, GO may consists of variable amounts of oxygen-containing functional groups, such as carbonyl C=O, carboxyl COO-, epoxy C-O and alkoxy C-OH groups [64, 85]. Due to the existence of these functional groups, GO is very hydrophilic and soluble in aqueous media. If these functional groups are reduced, the GO can be changed back to its original form (i.e., graphite) [77, 86]. This makes GO nanosheets in rGO relatively hydrophobic. By reducing the functional groups of GO in the mem- branes, it is possible to obtain films that consist of a highly hydrophobic graphene nanosheets. The graphene nanolayers in rGO will act as impermeable obstacles [87, 88] that provide longer diffusion paths across the membrane film, resulting in enhanced barrier properties. Thus, the surface property of rGO membranes is very importance for the device fabrication. In the present study, some the hydrophilic groups such as carbonyl, carboxyl, epoxy and alkoxy groups on the surface of GO sheets are partially removed and converted to rGO during the hydrothermal treatment, which affects the hydrophilicity of the rGO membranes [89, 90]. Generally, the hydrophilicity of membranes is closely associated with the water permeantion performance in water separation. Therefore, contact angle measurements were conducted to analyze the surface hydrophilicity of the membrane and the results are shown in Fig. 6. The digital images of the GO, rGO1 and rGO2 membranes are shown on the top of Fig. 6 and the corresponding contact angle of GO, rGO1 and rGO2 membranes, respectively (Bottom). The pure GO film is hydrophilic and the contact angle is ~ 45o without any hydrothermal treatment. Generally, the smaller contact angle is con- sistent with a more hydrophilic material. After the hydro- thermal treatment, the contact angle of rGO membranes increases to ~ 54o and ~ 66o corresponding to hydro- thermal reduction time of 1 and 2 h. The improvement of the hydrophobic property is attributed to the removal of the most the hydrophilic oxygen containing functional groups. However, the contact angle of the rGO2 mem- branes is still less than 90o, confirming that the rGO2 membranes are partially reduced after hydrothermal reduction, which is good agreement with the XRD and FTIR results. Based on this, it can be inferred that the residual oxygen-containing functional groups maintain a certain hydrophilicity of the rGO membranes, a similar result was observed by Fan et al. [91]. At the same time, it should be noted that vacancy defects in the surface can effectively reduce the interfacial interac- tions and weaken the wetting properties. Li et al. [92] studied the wetting and interfacial properties of water on the defective graphene. They found that the droplet contact angle is sensitive to a single-vacancy defect. As confirmed by theRaman result above, the disorder degree and defects of rGO increased after hydrothermal treatment. This could be ascribed to the removal of oxygen-containing groups of GO during reduction process. As a result, the increase of contact angle may be caused by the increase of structural defects on rGO sheets.
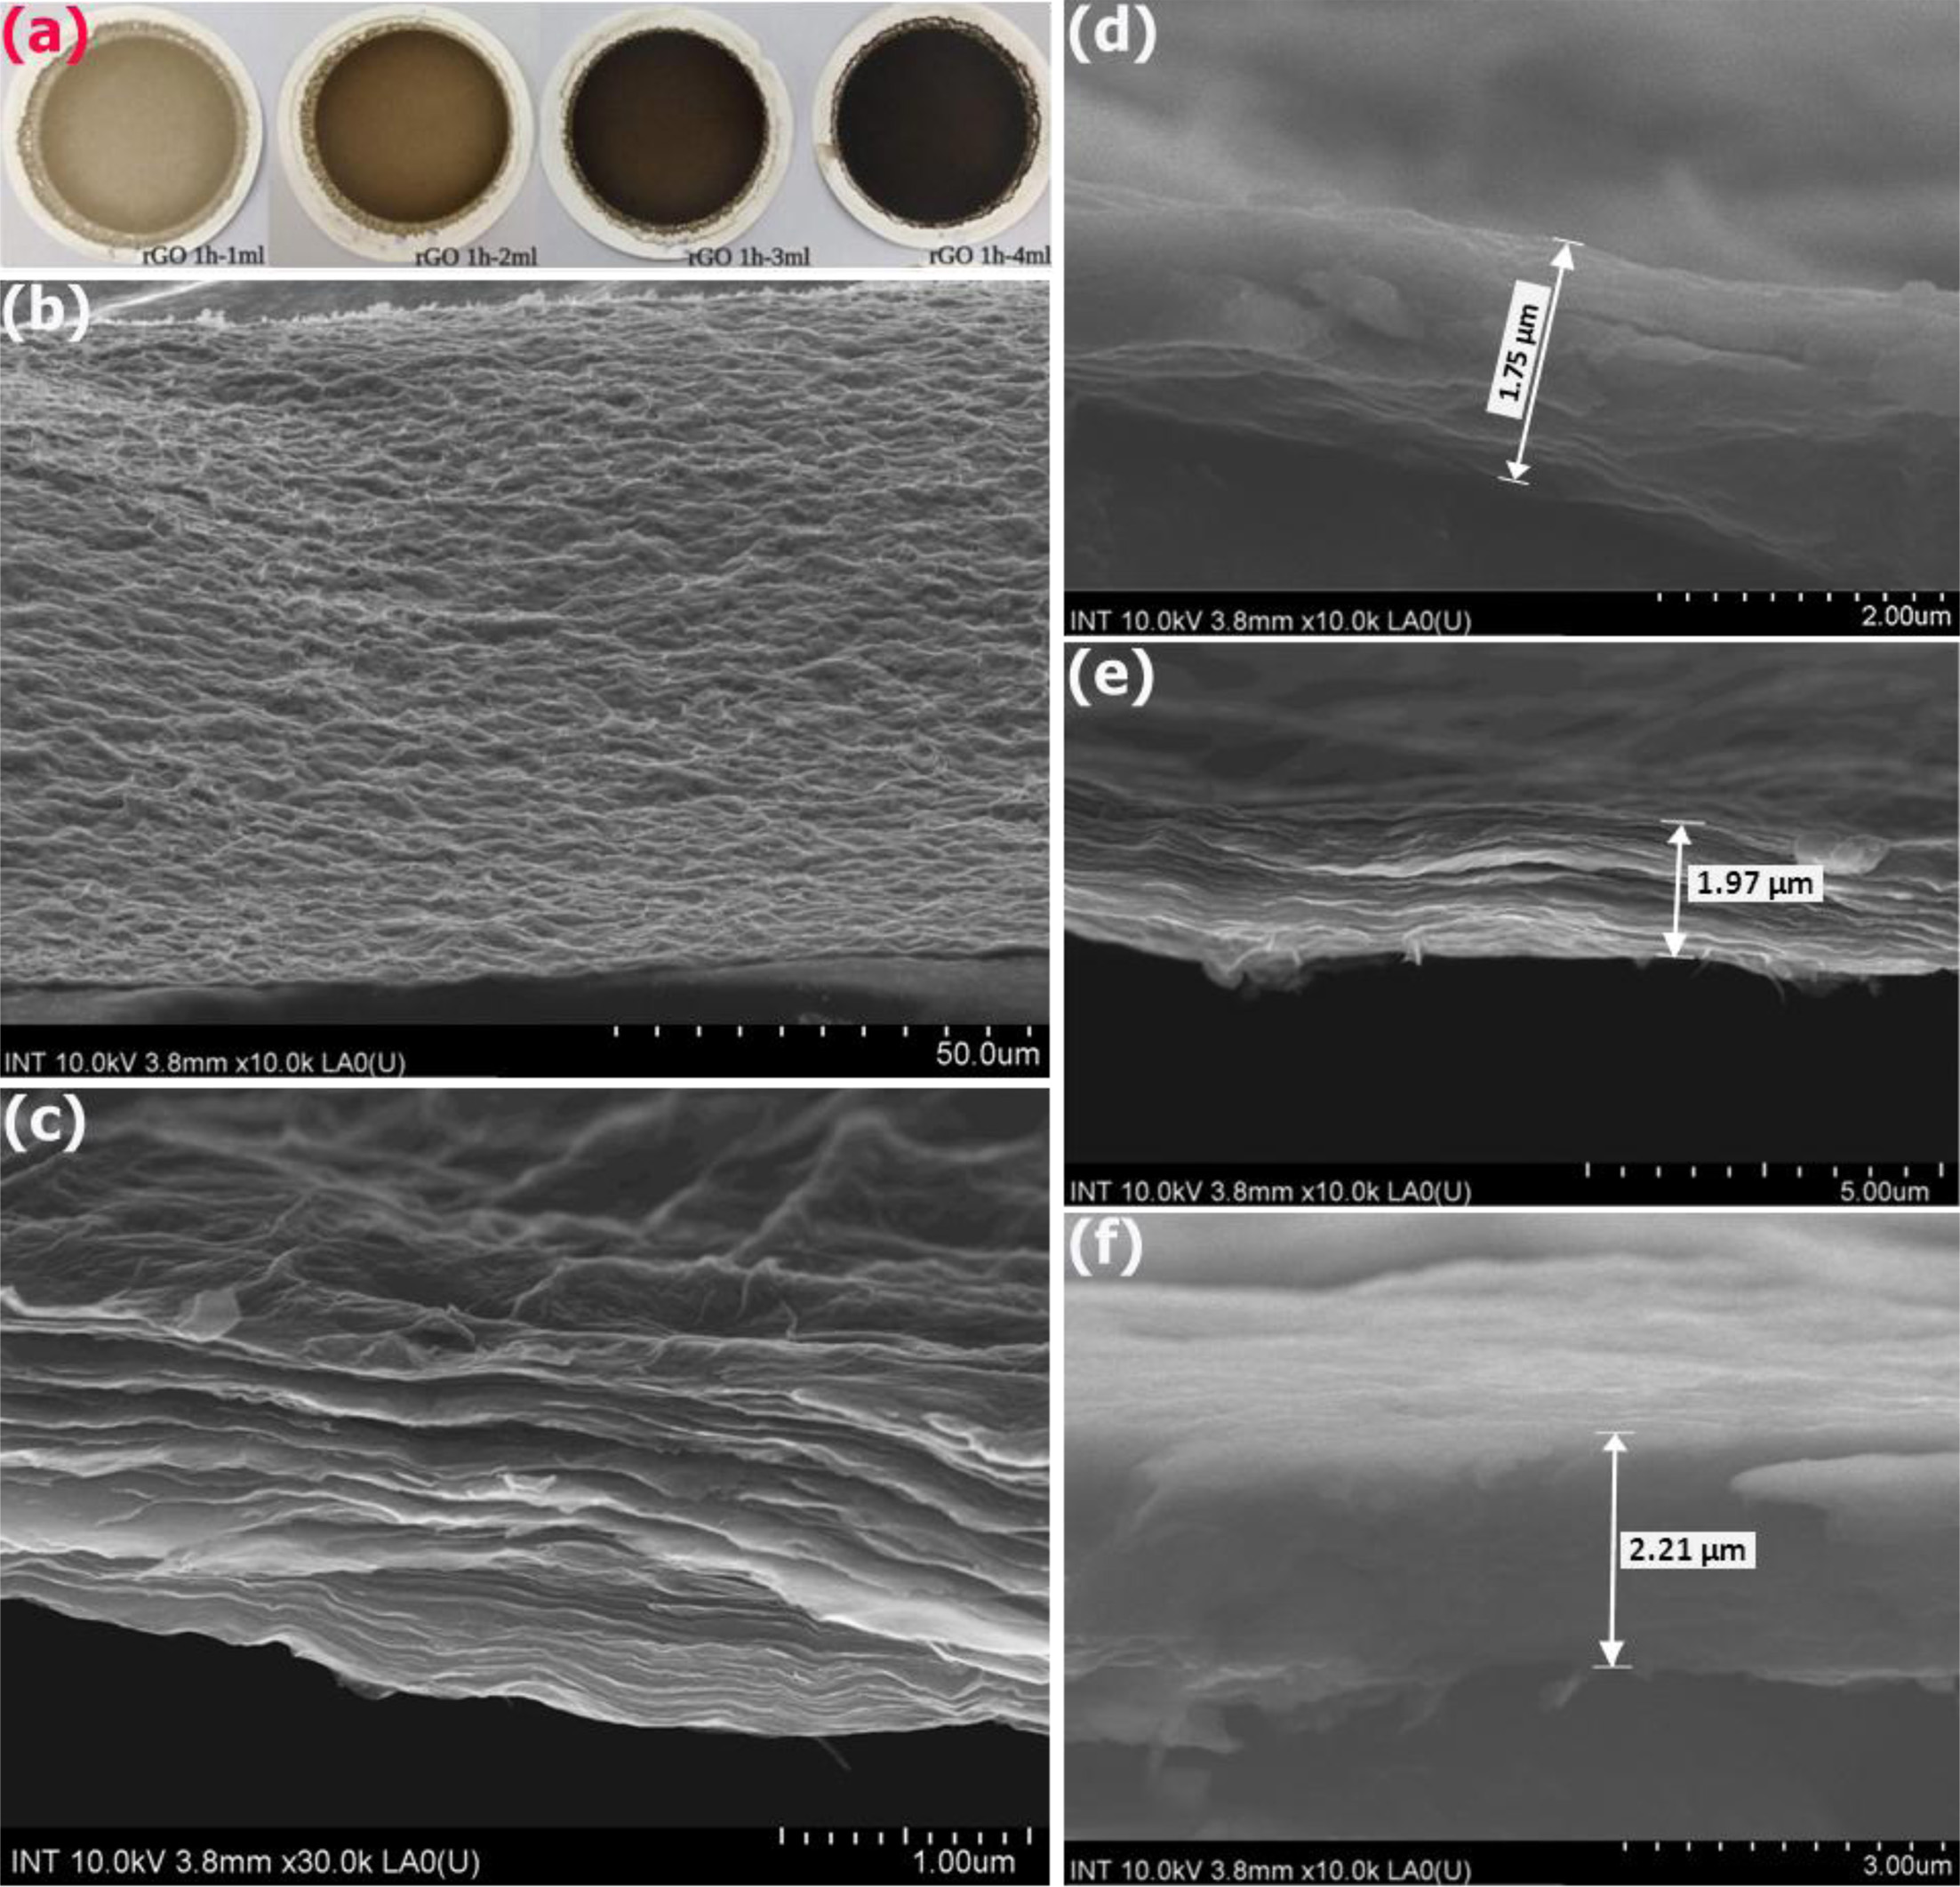
The digital images in Fig. 7(a) shows the surface properties of the membranes fabricated with different thickness of the rGO1 layer. It was observed that the color of the rGO membranes turned gradually from drak-yellow to black when the membrane thickness was increased. Fig. 7(b & c) shows the SEM image of the surface morphology and cross-section structure of the rGO1 membrane, respectively. As shown in Fig. 7(b), the wrinkles are visible on the surface, which likely show the edges of the rGO nanosheets [93]. The planar surface of the membrane is actually not flat with a network of wrinkles well-distributed over the whole surface. In fact, this kind of surface morphology could be expected in the rGO membrane since the individual rGO flakes present in solution are of random irregular shape and size, in contrast to the parent graphite oxide [94]. Therefore, deposition of these flakes over each other into a multilayered film will inevitably lead to overlaps and deformation of the flake shape [95]. The rGO film is continuous and stable, no obvious defects are visible, which is generally favourable for water treatment applications. From Fig. 7(c), it was clearly seen that multiple layers of rGO are visible. Furthermore, the observed rGO nanosheets had a laminate structure and were stacked layer by layer, which could supports the sieving mechanism of rGO membranes [21]. Fig. 7(d-f) show cross-sectional SEM images of rGO2 membranes fabricated with the different the volume of the rGO2 solution. It was observed that the membrane thickness was estimated to be ~ 1.75, 1.97 and 2.21 µm, which corresponds to the volume of the 3, 4, and 5 mL of rGO2 solution. Such different thicknesses of membrane were made by changing the volume of the rGO solution. Similar results were found in the literatures [96], in which the authors prepared the pure GO membranes by filtration in a vacuum condition and showed that the thickness, pore size and the d-spacing between GO nanosheets is tunable.
Because of the presence hydrophilitic and negatively charged oxygen functional groups, GO can be well dispersed in pure water without aggregation. These advantages make vacuum/pressure-assisted method suitable for producing multilayered GO membranes. The vacuum filtration method filters a certain amount of a GO solution through the support layer [97-99], in which GO nanosheets are deposited together almost parallel to the support layer, including nanofiltration, microfiltration and ultrafiltration membranes on the large-scale. Typically, the thickness vacuum-assisted GO membranes can be readily controlled by changing the volume or concentration of the GO dispersions used. This process usually does not affect the physiochemical properties of GO since interactions between the adjacent GO sheets include electrostatic, repulsion, van der Waals attractive forces and hydrogen bonding. The GO membranes fabricated by vacuum filtration method have shown a highly ordered laminar structure with low surface roughness [100]. Additionally, the desired channel structure of GO membranes can be achievedby adjusting the deposition rate of GO, which results in the high rejection and flux in separation process [101].
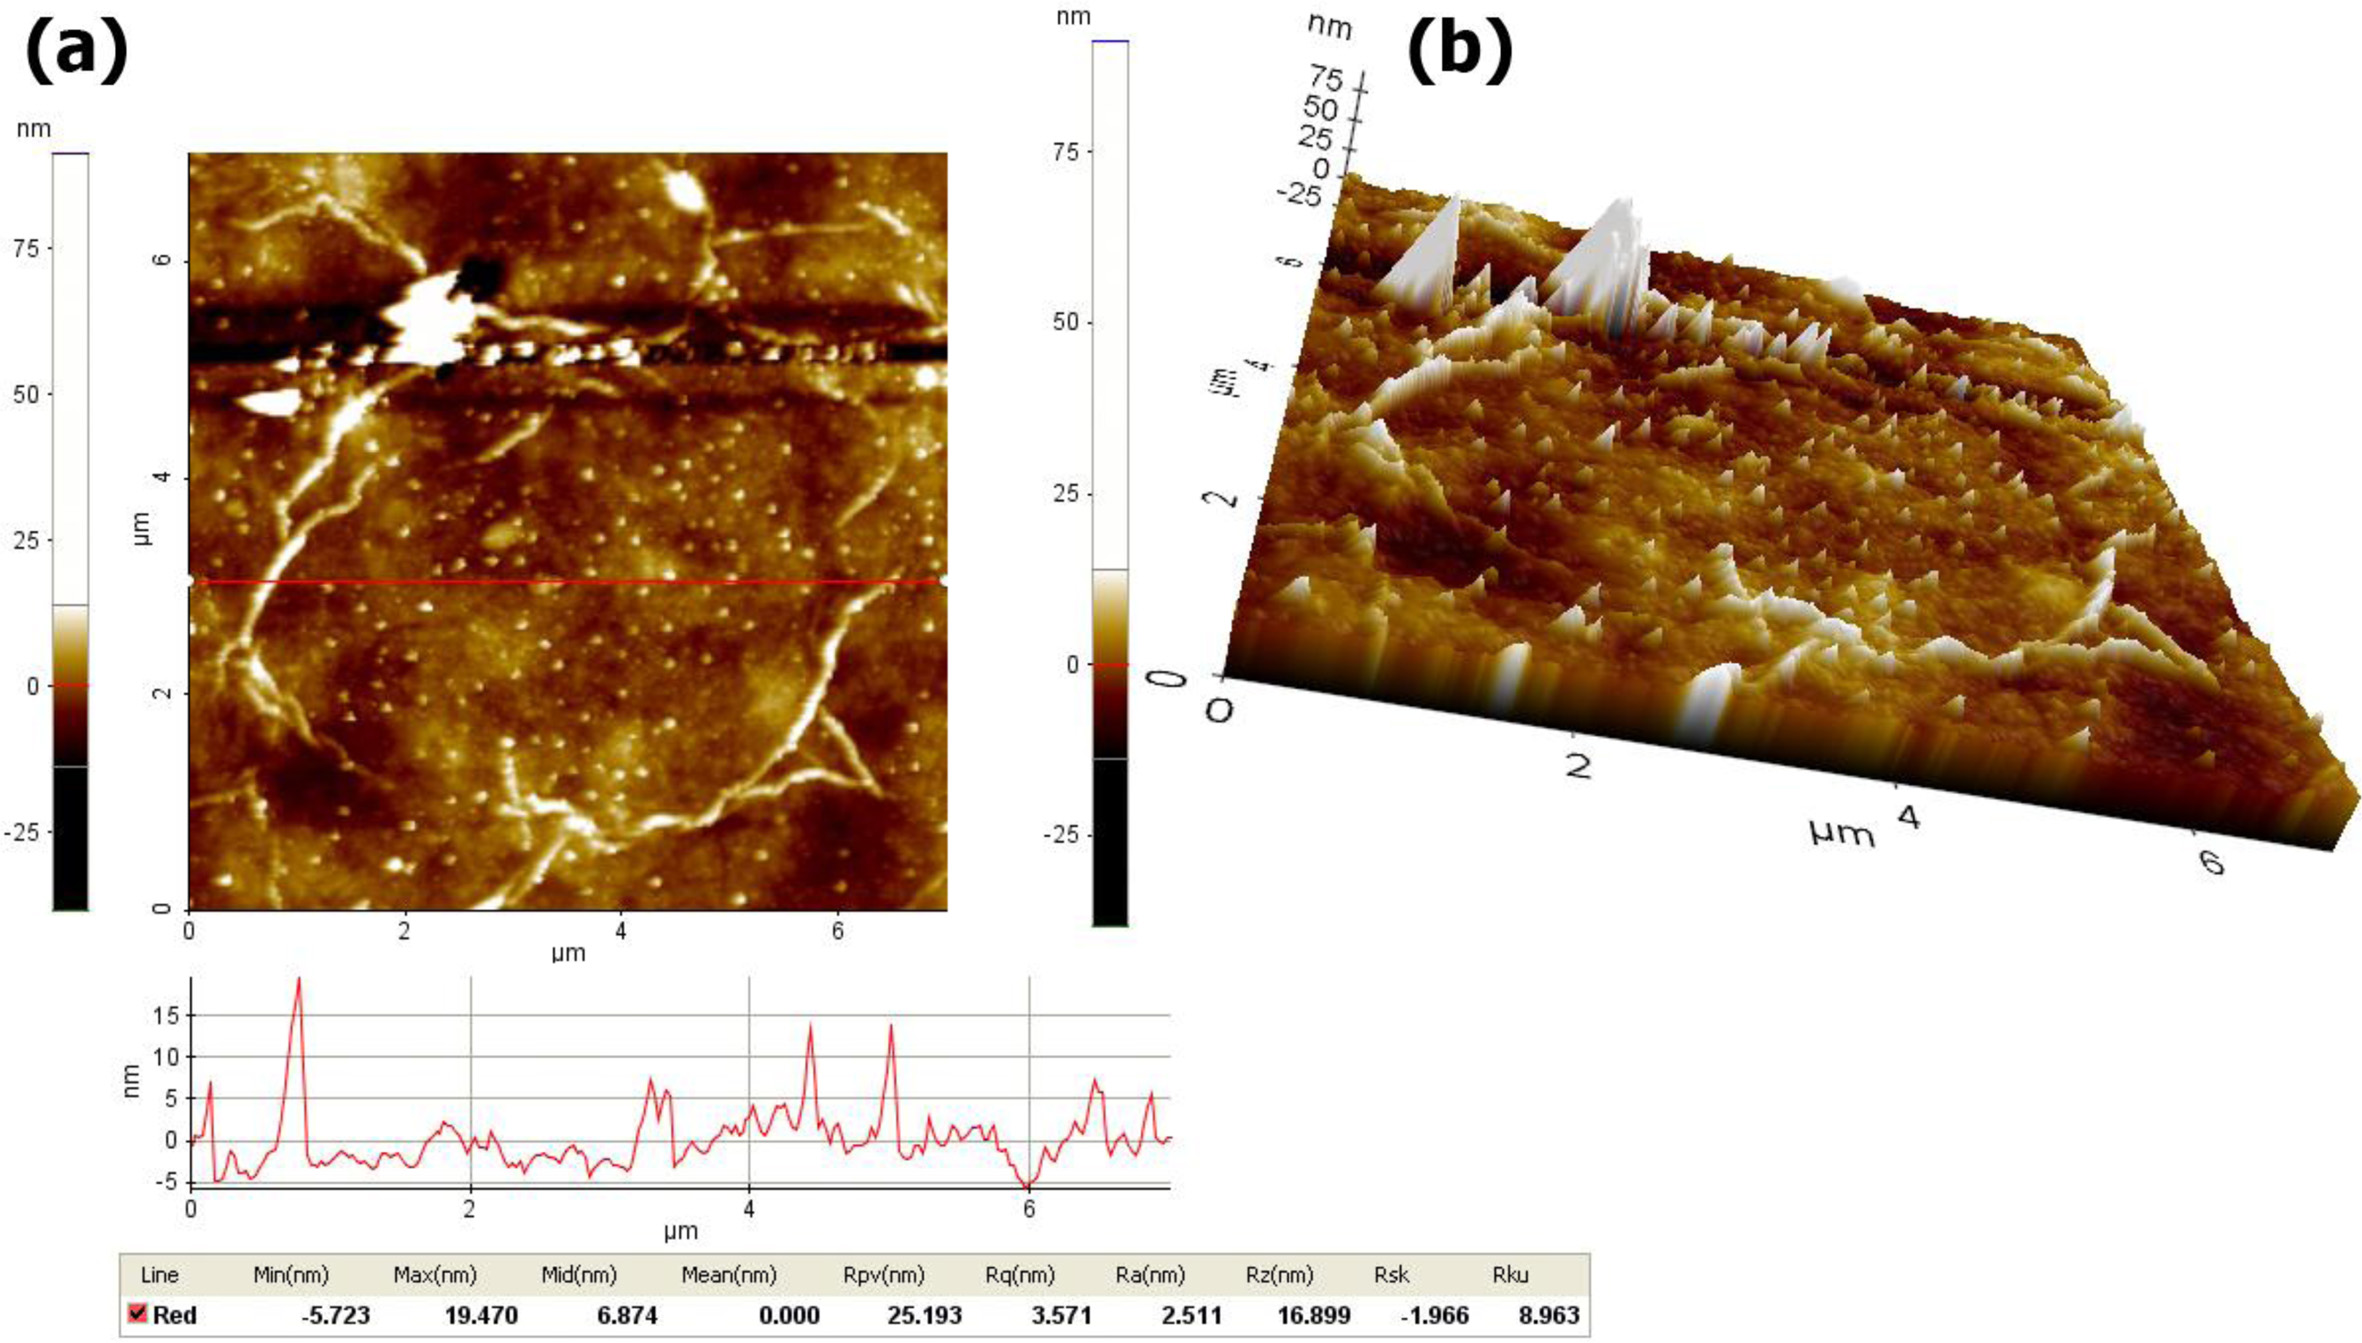
The surface roughness of the rGO2 membrane was analyzed by AFM in a non-contact mode at room temperature. Fig. 8(a & b) show the 2D and 3D surface morphology of rGO2 membrane with scale bar of 7 m, respectively. It can be clearly observed that the rGO sheets randomly stacked and overlapped one another to produce a continuous thin film with long and broad wrinkles/folds. Such films had a large amount of struc- tural disorders, which is typical of the film synthesized by using the solution-based process. The red-line (bottom of Fig. 8a) indicates the location of the height profile of the film. It was found that the root-mean-square roughness of the film surface (Rq) was estimated to be about 3÷4 nm, indicating that the film have quite smooth surface regardless of the formation of the wrinkles and folds across the film surface.
|
Fig. 1 SEM images of graphite oxide (a); (b) Medium and (c) High resolution SEM images of GO sheets. (d) TEM image of GO sheets. |
|
Fig. 2 XRD patterns of the graphite, GO, rGO1, rGO2, rGO3, and rGO4 samples. |
|
Fig. 3 Raman spectra of the GO, rGO1, rGO2, rGO3 and rGO4 samples. |
|
Fig. 4 FTIR spectra of GO, rGO1, rGO2, rGO3, and rGO4 samples. |
|
Fig. 5 The energy-dispersive X-ray (EDX) of the rGO samples. |
|
Fig. 6 Digital images of the GO, rGO1 and rGO2 membranes (Top); and the contact angle of GO, rGO1 and rGO2 membranes, respectively (Bottom) |
|
Fig. 7 (a) Digital image of the various rGO1 membranes fabricated with different thickness of the rGO1 layer (i.e., the membrane was prepared from 1, 2, 3 and 4 mL of rGO1 solution), SEM images of its (b) surface and the (c) cross-sectional morphology of the rGO1-4mL membrane. Cross-sectional SEM images of rGO2 membranes fabricated at the different the volume of the rGO2 nanosheet solution: (d) 3 mL, (e) 4 mL and (f) 5 mL. The double arrows mark the position where the membrane thickness was measured. |
|
Fig. 8 (a) Two- and (b) three dimensional AFM images of the rGO2 membrane. |
|
Table 1 Various physical parameters of graphite, GO and rGO samples obtained from XRD results |
In this study, we have prepared GO nanosheet from graphite by chemical oxidation and exfoliation. Then, rGO was synthesized from GO through hydrothermal method at 160 oC for 1-4 h, and the rGO membranes were produced on cellulose nitrate membrane via vacuum filtration. The morphology, structure and chemical com- position of the as-prepared samples were examined by SEM, TEM, Raman, FTIR, XRD, AFM, and EDS measurements. The result indicates that chemical com- position, d-spacing and surface morphology of GO could be adjusted by changing hydrothermal time. In addition, the rGO membranes with good hydrophobicity could be obtained by controlling reduction of GO by adjusting reaction time. The improvement of the hydro- phobic property of the rGO is assigned to the removal of the hydrophilic functional groups on the GO surface. The increasing contact angle of rGO membraneswith the hydrothermal time can be attributed to the increase of structural defects on rGO sheets.
This research is funded by Vietnam National Uni- versity Ho Chi Minh City (VNU-HCM) under grant number DS2020-20-01/HĐ-KHCN. We acknowledge the support of time and facilities from Ho Chi Minh City University of Technology (HCMUT), VNU-HCM for this study.
- 1. A.K. Geim and K.S. Novoselov, Nat. Mater. 6[3] (2007) 183-191.
-

- 2. A.K. Geim, Science 324[5934] (2009) 1530-1534.
-
- 3. H.G. Na, Y.J. Kwon, S.Y. Kang, W. Kang, M.S. Choi, J.H. Bang, T.K. Jung, C. Lee, and H.W. Kim, J. Ceram. Process. Res. 17[6] (2016) 523-531.
- 4. T.V. Khai, D.S. Kwak, Yong Jung Kwon, S.S. Kim, K.B. Shim, and H.W. Kim, J. Ceram. Process. Res. 14 (2013) 355-362.
- 5. X.Y. Zhou, J.J Shi, Y. Liu, Q.M. Su, J. Zhang, and G.H. Du, Electrochim. Acta 143 (2014) 175-179.
-
- 6. Q. Li, Z. Zhou, X. Zhang, and S.S. Liu, J. Ceram. Process. Res. 17[5] (2016) 513-517.
- 7. V.V. Brus, M.A. Gluba, X. Zhang, K. Hinrichs, J. Rappich, and N.H. Nickel, Sol. Energy 107 (2014) 74-81.
-
- 8. R. Kumar, H.J. Kim, S. Park, A. Srivastava, and I.K. Oh, Carbon 79 (2014) 192-202.
-
- 9. T.H. Kim, J.H. Yoo, and S.C. Yi, J. Ceram. Process. Res. 18[3] (2017) 261-264.
- 10. Z. Bin and Y. Yin, J. Ceram. Process. Res. 18[2] (2017) 108-111.
- 11. F. Barroso-Bujans, S. Cerveny, A. Alegría, and J. Colemero, Carbon 48[11] (2010) 3277-3286.
-
- 12. B. Feng, K. Xu, and A. Huang, Desalination 394 (2016) 123-130.
-
- 13. M. Hu and B. Mi, Environ. Sci. Technol. 47[8] (2013) 3715-3723.
-
- 14. J. Shen, M. Zhang, G. Liu, and W. Jin, RSC Adv. 6[59] (2016) 54281-54285.
-
- 15. H.W. Kim, H.W. Yoon, S.M. Yoon, B.M. Yoo, B.K. Ahn, Y.H. Cho, H.J. Shin, H. Yang, U. Paik, S. Kwon, J.Y. Choi, and H.B. Park, Science 342[6154] (2013) 91-95.
-
- 16. W. Hung, Q. An, M. De Guzman, H. Lin, S. Huang, W. Liu, C. Hu, and K. Lee, and J. Lai, Carbon 68 (2014) 670-677.
-
- 17. S. Priyadarsini, S. Mohanty, S. Mukherjee, S. Basu, and M. Mishra, J. Nanostructure Chem. 8[2] (2018) 123-137.
-
- 18. Y. Yang, A.M. Asiri, Z. Tang, D. Du, and Y. Lin, Materials Today 16[10] (2013) 365-373.
-
- 19. R.K. Joshi, P. Carbone, F.C. Wang, V.G. Kravets, Y. Su and I.V. Grigorieva, H.A. Wu, A.K. Geim, and R.R. Nair, Science 343[6172] (2014) 752-754.
-
- 20. R.R. Nair, H.A. Wu, P.N. Jayaram, I.V. Grigorieva, and A.K. Geim, Science 335[6067] (2012) 442-444.
-
- 21. B. Mi, Science 343[6172] (2014) 740-742.
-
- 22. H. Li, Z. Song, X. Zhang, Y. Huang, S. Li, Y. Mao, H.J. Ploehn, Y. Bao, and M. Yu, Science 342[6154] (2013) 95-98.
-
- 23. S. Park and R.S. Ruoff, Nat. Nanotechnol. 4[4] (2009) 217-224.
-
- 24. H.C. Schniepp, J.L. Li, M.J. McAllister, H. Sai, M. Herrera-Alonso, D.H. Adamson, R.K. Prud’homme, R. Car, D.A. Saville, and I.A. Aksay, J. Phys. Chem. B 110[17] (2006) 8535-8539.
-
- 25. K.H. Thebo, X. Qian, Q. Zhang, L. Chen, H.M. Cheng, and W. Ren, Nat. Commun. 9[1] (2018) 1486.
-
- 26. S. Pei, Q. Wei, K. Huang, H.M. Cheng, and W. Ren, Nat. Commun. 9[1] (2018) 145.
-
- 27. D.R. Dreyer, S. Park, C.W. Bielawski, and R.S. Ruoff, Chem. Soc. Rev. 39[1] (2010) 228-240.
-
- 28. J. Abraham, K.S. Vasu, C.D. Williams, K. Gopinadhan, Y. Su, C.T. Cherian, J. Dix, E. Prestat, S.J. Haigh, I.V. Grigorieva, P. Carbone, A.K. Geim, and R.R. Nair, Nat. Nanotechnol. 12[6] (2017) 546-550.
-
- 29. L. Chen, G. Shi, J. Shen, B. Peng, B. Zhang, Y. Wang, F. Bian, J. Wang, D. Li, Z. Qian, G. Xu, G. Liu, J. Zeng, L. Zhang, Y. Yang, G. Zhou, M. Wu, W. Jin, J. Li, and H. Fang, Nature 550[7676] (2017) 380-383.
-
- 30. S. Wang, Y. Xie, G. He, Q. Xin, J. Zhang, L. Yang, Y. Li, H. Wu, Y. Zhang, M.D. Guiver, and Z. Jiang, Angew. Chem. Int. Ed. 56[45] (2017) 14246-14251.
-
- 31. T. Wu, Z. Wang, Y. Lu, S. Liu, H. Li, G. Ye, and J. Chen, Adv. Sci. 8 (2021) 2002717.
-
- 32. V. Saraswat, R.M. Jacobberger, J.S. Ostrander, C.L. Hummell, A.J. Way, J. Wang, M.T. Zanni, and M.S. Arnold, ACS Nano 12[8] (2018) 7855-7865.
-
- 33. F. Fu and Q. Wang, J. Environ. Manage. 92[3] (2011) 407-418.
-
- 34. J. Abraham, K.S. Vasu, C.D. Williams, K. Gopinadhan, Y. Su, C.T. Cherian, J. Dix, E. Prestat, S.J. Haigh, I.V. Grigorieva, P. Carbone, A.K. Geim, and R.R. Nair, Nat. Nanotechnol. 12[6] (2017) 546-550.
-
- 35. P. Sun, Q. Chen, X. Li, H. Liu, K. Wang, M. Zhong, J. Wei, D. Wu, R. Ma, T. Sasaki, and H. Zhu, NPG Asia Mater. 7[2] (2015) e162.
-
- 36. Y. Han, Y. Jiang, and C. Gao, ACS Appl. Mater. Interfaces 7[15] (2015) 8147-8155.
-
- 37. G. Liu, W. Jin, and N. Xu, Chem. Soc. Rev. 44[15] (2015) 5016-5030.
-
- 38. Y. Zhang, S. Zhang, and T. Chung, Environ. Sci. Technol. 49[16] (2015) 10235-10242.
-
- 39. J.Y. Chong, B. Wang, and K. Li, Chem. Commun. 54[20] (2018) 2554-2557.
-
- 40. H. Huang, Y. Mao, Y. Ying, Y. Liu, L. Sun, and X. Peng, Chem. Commun. 49[53] (2013) 5963-5965.
-
- 41. Y. Wei, Y. Zhang, X. Gao, Y. Yuan, B. Su, and C. Gao, Carbon 108 (2016) 568-575.
-
- 42. C. Xu, A. Cui, Y. Xu, and X. Fu, Carbon 62 (2013) 465-471.
-
- 43. C. Mattevi, G. Eda, S. Agnoli, S. Miller, K.A. Mkhoyan, O. Celik, D. Mostrogiovanni, G. Granozzi, E. Garfunkel, and M. Chhowalla, Adv. Funct. Mater. 19[16] (2009) 2577-2583.
-
- 44. D. Yang, A. Velamakanni, G. Bozoklu, S. Park, M. Stoller, R.D. Piner, S. Stankovich, I. Jung, D.A. Field, C.A. Ventrice, and R.S. Ruoff, Carbon 47[1] (2009) 145-152.
-
- 45. X. Wang, L.J. Zhi, and K. Mullen, Nano Lett. 8[1] (2008) 323-327.
-
- 46. Y.W. Zhu, S. Murali, M.D. Stoller, A. Velamakanni, R.D. Piner, and R.S. Ruoff, Carbon 48[7] (2010) 2118-2122.
-
- 47. H.M.A. Hassan, V. Abdelsayed, A. Khder, K.M. AbouZeid, J. Terner, M.S. El-Shall, S.I. Al-Resayes, and A.A. El-Azhary, J. Mater. Chem. 19[23] (2009) 3832-3837.
-
- 48. H.H. Huang, R.K. Joshi, K.K.H. De Silva, R. Badam, and M. Yoshimura, J. Membr. Sci. 572 (2019) 12-19.
-
- 49. J. Zhang, H. Yang, G. Shen, P. Cheng, J. Zhang, and S. Guo, Chem. Commun. 46[7] (2010) 1112-1114.
-
- 50. H.H. Huang, K.K.H. De Silva, G.R.A. Kumara, and M. Yoshimura, Scientific Reports 8[1] (2018) 6849.
-
- 51. X. Mei, X. Meng, and F. Wu, Physica E 68 (2015) 81-86.
-
- 52. Y.L. Zhang, L. Guo, S. Wei, Y.Y. He, H. Xia, Q.D. Chen, H.B. Sun, and F.S. Xiao, Nano Today 5[1] (2010) 15-20.
-
- 53. M.F. El-Kady, V. Strong, S. Dubin, and R.B. Kaner, Science 335[6074] (2012) 1326-1330.
-
- 54. W. Gao, N. Singh, L. Song, Z. Liu, A.L.M. Reddy, L.J. Ci, R. Vajtai, Q. Zhang, B.Q. Wei, and P.M. Ajayan, Nat. Nanotechnol. 6[8] (2011) 496-500.
-
- 55. G. Williams, B. Seger, and P.V. Kamat, ACS Nano 2[7] (2008) 1487-1491.
-
- 56. T.V. Khai, D.S. Kwak, Y.J. Kwon, H.Y. Cho, T.N. Huan, H. Chung, H. Ham, C. Lee, N.V. Dan, N.T. Tung, and H.W. Kim, Chem. Eng. J. 232 (2013) 345-355.
-
- 57. M.J. McAllister, J. Li, D.H. Adamson, H.C. Schniepp, A.A. Abdala, J. Liu, M. Herrera- Alonso, D.L. Milius, R. Car, R.K. Prud'homme, and I.A. Aksay, Chem. Mater. 19[18] (2007) 4396-4404.
-
- 58. H.H. Huang, K.K.H. De Silva, G.R.A. Kumara, and M. Yoshimura, Scientific Reports 8[1] (2018) 8:6849.
-
- 59. B.K. Barman, P. Mahanandia, and K.K. Nanda, RSC Adv. 3[31] (2013) 12621-12624.
-
- 60. Z.J. Fan, W. Kai, J. Yan, T. Wei, L.J. Zhi, J. Feng, Y.M. Ren, L.P. Song, and F. Wei, ACS Nano 5[1] (2011) 191-198.
-
- 61. X. Mei and J. Ouyang, Carbon 49[15] (2011) 5389-5397.
-
- 62. K. Krishnamoorthy, M. Veerapandian, K. Yun, and S.J. Kim, Carbon 53 (2013) 38-49.
-
- 63. H. He, T. Riedl, A. Lerf, and J. Klinowski, J. Phys. Chem. 100[51] (1996) 19954-19958.
-
- 64. A. Lerf, H. He, M. Forster, and J. Klinowski, J. Phys. Chem. B 102[23] (1998) 4477-4482.
-
- 65. C.K. Chua and M. Pumera, Chem. Soc. Rev. 43[1] (2014) 291-312.
-
- 66. Y. Jin, S. Huang, M. Zhang, M. Jia, and D. Hu, Appl. Surf. Sci. 268 (2013) 541-546.
-
- 67. C.P.P. Wong, C.W. Lai, K.M. Lee, and S.B. Abd Hamid, Materials 8[10] (2015) 7118-7128.
-
- 68. F.C. Tai, W. Wei, S.H. Chang, and W.S. Chen, J. Raman Spectrosc. 41[9] (2010) 933-937
-
- 69. A.C. Ferrari and D.M. Basko, Nat. Nanotechnol. 8[4] (2013) 235-246.
-
- 70. A. Eckmann, A. Felten, I. Verzhbitskiy, R. Davey, and C. Casiraghi, Phys. Rev. B 88[3] (2013) 035426-11.
-
- 71. F. Tuinstra and J.L. Koenig, J. Chem. Phys. 53[3] (1970) 1126-1130.
-
- 72. A.C. Ferrari and J. Robertson, Phys. Rev. B 61[20] (2000) 14095-14107.
-
- 73. D. Chen, L. Li, and L. Guo, Nanotechnology 22[32] (2011) 325601-7.
-
- 74. Y. Xu, K. Sheng, C. Li, and G. Shi, ACS Nano 4[7] (2010) 4324-4330.
-
- 75. J. Wang, Y.K. Zhou, B. Xiong, Y.Y. Zhao, X.J. Huang, andZ.P. Shao, Electrochim. Acta 88 (2013) 847-857.
-
- 76. O. Akhavan, M. Abdolahad, A. Esfandiar, and M. Mohatashamifar, J. Phys. Chem. C 114[30] (2010) 12955–12959.
-
- 77. S. Stankovich, D.A. Dikin, R.D. Piner, K.A. Kohlhaas, A. Kleinhammes, Y. Jia, Y. Wu, S.B.T. Nguyen, and R.S. Ruoff, Carbon 45[7] (2007) 1558-1565.
-
- 78. X. Dong, C.Y. Su, W. Zhang, J. Zhao, Q. Ling, W. Huang, P. Chen, and L.J. Li, Phys. Chem. Chem. Phys. 12[9] (2010) 2164-2169.
-
- 79. Y. Zhou, Q. Bao, L.A.L. Tang, Y. Zhong, and K.P. Loh, Chem. Mater. 21[13] (2009) 2950-2956.
-
- 80. S. Gurunathan, J.W. Han, V. Eppakayala, and J.H. Kim, Colloids Surf. B 102 (2013) 772-777.
-
- 81. A.C. Ferrari, J.C. Meyer, V. Scardaci, C. Casiraghi, M. Lazzeri, F. Mauri, S. Piscanec, D. Jiang, K.S. Novoselov, S. Roth, and A.K. Geim, Phys. Rev. Lett. 97[18] (2006) 187401-4.
-
- 82. J. Liang, Z. Cai, Y. Tian, L. Li, J. Geng, and L. Guo, ACS Appl. Mater. Interfaces 5[22] (2013) 12148-12155.
-
- 83. C. Hontorialucas, A.J. Lopezpeinado, J.D.D Lopezgonzalez, M.L. Rojascervantes, and R.M. Martinaranda, Carbon 33[11] (1995) 1585-1592.
-
- 84. C. Nethravathi and M. Rajamathi, Carbon 46[14] (2008) 1994-1998.
-
- 85. H. He, J. Klinowski, M. Forster, and A. Lerf, Chem. Phys. Lett. 287[1-2] (1998) 53-56.
-
- 86. S. Stankovich, R.D. Piner, X. Chen, N. Wu, S.T. Nguyen, and R.S. Ruoff, J. Mater. Chem. 16[2] (2006) 155-158.
-
- 87. J.S. Bunch, S.S. Verbridge, J.S. Alden, A.M. van der Zande, J.M. Parpia, H.G. Craighead, and P. L. McEuen, Nano Lett. 8[8] (2008) 2458-2462.
-
- 88. J. Wang, P. Zhang, B. Liang, Y. Liu, T. Xu, L. Wang, B. Cao, and K. Pan, ACS Appl. Mater. Interfaces, 8[9] (2016) 6211-6218.
-
- 89. B. Qi, X. He, G. Zeng, Y. Pan, G. Li, G. Liu, Y. Zhang, W. Chen, and Y. Sun, Nat. Commun. 8[1] (2017) 825.
-
- 90. N. Wei, C. Lv, and Z. Xu, Langmuir 30[12] (2014) 3572-3578.
-
- 91. X. Fan, C. Cai, J. Gao, X. Han, and J. Li, Sep. Purif. Technol. 241 (2020) 116730-8.
-
- 92. X. Li, L. Li, Y. Wang, H. Li, and X. Bian, J. Phys. Chem. C 117[27] (2013) 14106-14112.
-
- 93. Y.P. Tang, D.R. Paul, and T.S. Chung, J. Membr. Sci. 458 (2014) 199-208.
-
- 94. C. Botas, P. Alvarez, C. Blanco, R. Santamaria, M. Granda, P. Ares, F. Rodriguez-Reinoso, and R. Menendez, Carbon 50[1] (2012) 275-282.
-
- 95. A. Klechikov, J. Yu, D. Thomas, T. Sharifi, and A.V. Talyzin, Nanoscale 7[37] (2015) 15374-15384.
-
- 96. W.J. Lau, A.F. Ismail, A. Isloor, and A. Al-Ahmed, in “Advanced Nanomaterials for Membrane Synthesis and Its Applications, 1st Ed.” (Elsevier, 2019) p.84.
-
- 97. Y. Han Z. Xu, and C. Gao, Adv. Funct. Mater. 23[29] (2013) 3693-3700.
-
- 98. H. Huang, Z. Song, N. Wei, L. Shi, Y. Mao, Y. Ying, L. Sun, Z. Xu, and X. Peng, Nat. Commun. 4[4] (2013) 2979.
-
- 99. Q. Yang, Y. Su, C. Chi, C.T. Cherian, K. Huang, V.G. Kravets, F.C. Wang, J.C. Zhang, A. Pratt, A.N. Grigorenko, F. Guinea, A.K. Geim, and R.R. Nair, Nat. Mater. 16[12] (2017) 1198-1202.
-
- 100. C. Tsou, Q. An, S. Lo, M. De Guzman, W. Hung, C. Hu, K. Lee, and J. Lai, J. Membr. Sci. 477 (2015) 93-100.
-
- 101. W.L. Xu, C. Fang, F. Zhou, Z. Song, Q. Liu, R. Qiao, and M. Yu, Nano Lett. 17[5] (2017) 2928-2933.
-
 This Article
-
2021; 22(4): 425-435
Published on Aug 31, 2021
- 10.36410/jcpr.2021.22.4.425
- Received on Nov 25, 2020
- Revised on Mar 12, 2021
- Accepted on Apr 9, 2021
Services
- Abstract
introduction
experimental procedure
results and discussion
conclusions
- Acknowledgements
- References
- Full Text PDF
Shared
Correspondence to
- Tran Van Khai a,b,d, Mai Thanh Phong c,d
-
aFaculty of Materials Technology, Ho Chi Minh city University of Technology (HCMUT), 268 Ly Thuong Kiet Street, District 10, Ho Chi Minh City, Vietnam
bVNU-HCM Key Laboratory for Material Technologies, Ho Chi Minh city University of Technology (HCMUT), 268 Ly Thuong Kiet Street, District 10, Ho Chi Minh City, Vietnam
cHo Chi Minh City University of Technology (HCMUT), 268 Ly Thuong Kiet Street, District 10, Ho Chi Minh City, Vietnam
dVietnam National University Ho Chi Minh City, Linh Trung Ward, Thu Duc District, Ho Chi Minh City, Vietnam
Tel : +84 8 3864 7256 Fax: +84 8 3866 1843 - E-mail: phong.mai@hcmut.edu.vn (M.T. Phong) E-mail: tvkhai
Clean-Energy Research Institute(CRI), Hanyang University, 222, Wangsimni-ro, Seongdong-gu, Seoul, 04763, Korea
E-mail: jcpr@hanyang.ac.kr