


- Synthesis and optimization of Ag-ZnO heterojunction composite nanofibers for enhanced photocatalytic activity
Myeongjun Jia,b and Young-In Leea,b,*
aDepartment of Materials Science and Engineering, Seoul National University of Science and Technology, Seoul 01811, Republic of Korea
bThe Institute of Powder Technology, Seoul National University of Science and Technology, Seoul 01811, Republic of KoreaThis article is an open access article distributed under the terms of the Creative Commons Attribution Non-Commercial License (http://creativecommons.org/licenses/by-nc/4.0) which permits unrestricted non-commercial use, distribution, and reproduction in any medium, provided the original work is properly cited.
In this study, Ag-ZnO heterojunction composite nanofibers with an average diameter of about 100 nm and coupled Ag nanoparticles with a size of 10 nm were synthesized by facile electrospinning followed by thermal treatment whereby the Ag content was tuned by controlling the precursor concentration. Rhodamine B (RhB) was employed as a representative dye pollutant to evaluate the ultraviolet (UV) and visible light photocatalytic activity of the pure ZnO and Ag-ZnO composite nanofibers. The photocatalytic activity of 1.5 at% Ag-ZnO nanofibers toward RhB degradation was the greatest, outperforming pure ZnO nanofiber by a factor of more than 5 times. Further increasing the Ag content led to lower photocatalytic activity, most likely due to the growth of the Ag nanoparticles. It was found that the enhanced photocatalytic activity is caused by the heterojunction structure promoting the charge separation of the photogenerated charge carriers, while the effect of surface plasmon resonance by the Ag nanoparticles on the photoreactivity is insufficient. The Ag-ZnO nanofibers show great promise as innovative and highly performing photocatalyst for photocatalytic waste-water treatment
Keywords: Electrospinning, Nanofiber, Heterojunction, Photocatalyst, Ag-ZnO
A quick and energy-efficient method for environmental remediation is urgently needed to solve the global problems associated with air and water pollution [1-7]. The photocatalytic degradation of organic pollutants is considered to be a better low cost and environmental friendly method than traditional advanced oxidation processes such as ozone, hydrogen peroxide, and/or UV light treatment [5, 6].
Zinc oxide (ZnO) is one of the most widely studied semiconducting photocatalysts because of its high carrier mobility and physical and chemical stability, and low toxicity [7-11]. Despite numerous researches of ZnO photocatalysts, a major limitation still remains to achieving high photocatalytic efficiency with it. For high photocatalytic efficiency, energy transfer must be efficient by suppressing the recombination of the photoexcited electron-hole pairs and transporting the carriers to surface active sites for surface chemical reaction with organic pollutants [12-14]. It has been widely reported that the photocatalytic performance of ZnO-based heterostructures or composites is improved via the introduction of noble metals [15-17]. These can act as electron sinks near the conduction band, thus the photoexcited carriers are readily separated and recom- bination with the valence band holes is prevented. In addition, incorporating noble metals into ZnO can extend visible light absorption by localized surface plasmon resonance. Among the various noble metals such as gold (Au), silver (Ag), palladium (Pd), and platinum (Pt), Ag has particularly attracted much interest because of its superior activity for the photocatalytic degradation of aqueous phase pollutants compared with other noble metals [18, 19].
One-dimensional (1D) photocatalysts are superior to spherical powder catalysts due to their large surface-to-volume ratio, dimensionality for easily separating electron-hole pairs, and being readily recoverable [20]. Of the various methods that have been used to synthesize 1D nanostructures, it has been found that electrospun nanofibers show unique properties suitable for use as catalysts because they have benefits including flexibility of form, three-dimensional open structures, and easy scale-up and because they can be easily immobilized on membrane substrates.
The objective of this study is to synthesize Ag-ZnO composite nanofibers and optimize their photocatalytic performance for the oxidation of organic pollutants in water. Although there has been much work on electrospun ZnO nanofibers, relatively few studies have been con- ducted on the synthesis of Ag-ZnO composite nanofibers [16, 21-24, 32]. Additionally, further work is necessary to investigate the effects of Ag additives in ZnO nano- fibers for photocatalytic performance. The effects of the Ag content on the phase, morphology, microstruc- ture, and optical property of the synthesized Ag-ZnO composite nanofibers were systematically investigated. The photocatalytic activity was evaluated by the degradation of Rhodamine B (RhB) dye under UV and visible light irradiation to confirm the primary mechanism for the improvement of photocatalytic activity.
Zinc acetate [Zn(CH3COO)2·2H2O, 99%], polyvinyl pyrrolidone (PVP, Mw = 1 300 000), and silver nitrate (AgNO3, 99%) were purchased from Sigma-Aldrich (St. Louis, MO, USA) and all reagents were of analytical grade and were directly used as received without any further purification. ZnO and Ag-ZnO nanofibers were synthesized using an electrospinning method followed by a thermal treatment step. The viscous solution for the electrospinning was prepared by dissolving 0.5 g of PVP and 1.097 g of Zn(CH3COO)2 in 9.1 mL of anhydrous ethanol under vigorous stirring at a rate of 300 rpm for 1 h, thereby ensuring that all of the chemicals had dissolved. AgNO3 was mixed in the solution at levels between 1.0 and 2.5 at%. The final products without Ag and with 1.0, 1.5, 2.0, and 2.5 at% Ag were named ZA-0, ZA-1.0, ZA-1.5, ZA-2.0, and ZA-2.5, respectively. The precursor solution was transferred into a syringe attached with a 0.25 mm inner diameter needle which was placed in the front of a rotating metal collector with a fixed distance of 12 cm between the nozzle and collector. An aluminum foil-covered rotating drum acting as the cathode collector was rotated at 300 rpm during the electrospinning. The precursor solution was progressed through a syringe pump (KDS200; KD Scientific Inc., Holliston, MA, USA) controlled at a rate of 0.4 ml∙h-1 and the solution was negatively charged at 18 kV via a power supply (HV60; NanoNC Co., Ltd, Seoul, Korea) to electrify it. Environmental conditions were kept constant at 40 oC and a humidity of 20%. After the electrospinning, aluminum foil coated with the nanofibers was removed and inserted into a drying oven at 60 oC overnight and the nanofibers were calcined at 500 oC for 3 h with a heating rate of 5 oC∙min-1 in the air for polymer removal and crystallization of ZnO and Ag.
The synthesized ZnO and Ag-ZnO nanofibers were characterized using various techniques to quantify their phase, size, and morphological and optical properties. The crystal structures and average crystallite sizes of the ZnO and Ag-ZnO nanofibers were characterized by X-ray diffraction (XRD; X’Pert3 Powder, Malvern Panalytical, Almelo, Netherlands). The morphology, diameter, and microstructure of the nanofibers were examined by means of field emission scanning electron microscopy (FE-SEM; S-4800, Hitachi, Ibaraki, Japan) and high-resolution transmission electron microscopy (HR-TEM; JEM-2100F, JEOL, Tokyo, Japan). The pre- sence of Ag content was analyzed via energy dispersive X-ray spectroscopy (EDX) and selected area electron diffraction (SAED) analysis. Their optical properties were characterized using a UV-vis spectrophotometer (SHIMADZU UV-2600, Shimadzu, Kyoto, Japan) equipped with an integration sphere and using BaSO4 as a reference. In addition, the photoluminescence (PL) of the samples were investigated using the fluorescence spectrophotometer (NanoLog; Horiba Co. Ltd., Kyoto, Japan) at room temperature at an excitation wavelength of 325 nm.
Reactivity experiments for the ZnO and Ag-ZnO nanofibers were conducted in a batch system using a solar simulator equipped with a 300 W xenon lamp and an Air Mass 1.5 global filter simulating solar radiation reaching the surface of the earth at a zenith angle of 48.2o. For the runs performed under visible light, a filter with a 395 nm cut-off was employed (50.8 × 50.8 mm; FSQ-GG395, Newport, Irvine, CA, USA). Activity was confirmed by the decolorization of RhB during the photocatalytic degradation based on the Beer-Lambert law [25] which is the linear relationship between abso- rbance and concentration of an absorbing species. Pho- tocatalytic experiments were carried out by adding 0.05 g of ZnO and Ag-ZnO nanofibers to 100 mL of 1 × 10⁻⁵ M RhB aqueous solution. The mixture was kept in the dark for 30 min to reach the adsorption-desorption equilibrium among the photocatalyst, RhB, and water before irradiation. The mixture solution was irradiated using the xenon lamp while being magnetically stirred in a water bath at 25 oC. A series of specific volumes of samples were withdrawn at selected times for analysis and were centrifuged before measurement. The residual concentration of RhB in each sample was determined via UV/Vis diffuse reflection spectroscopy (UV-2600, Shimadzu).
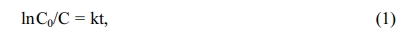
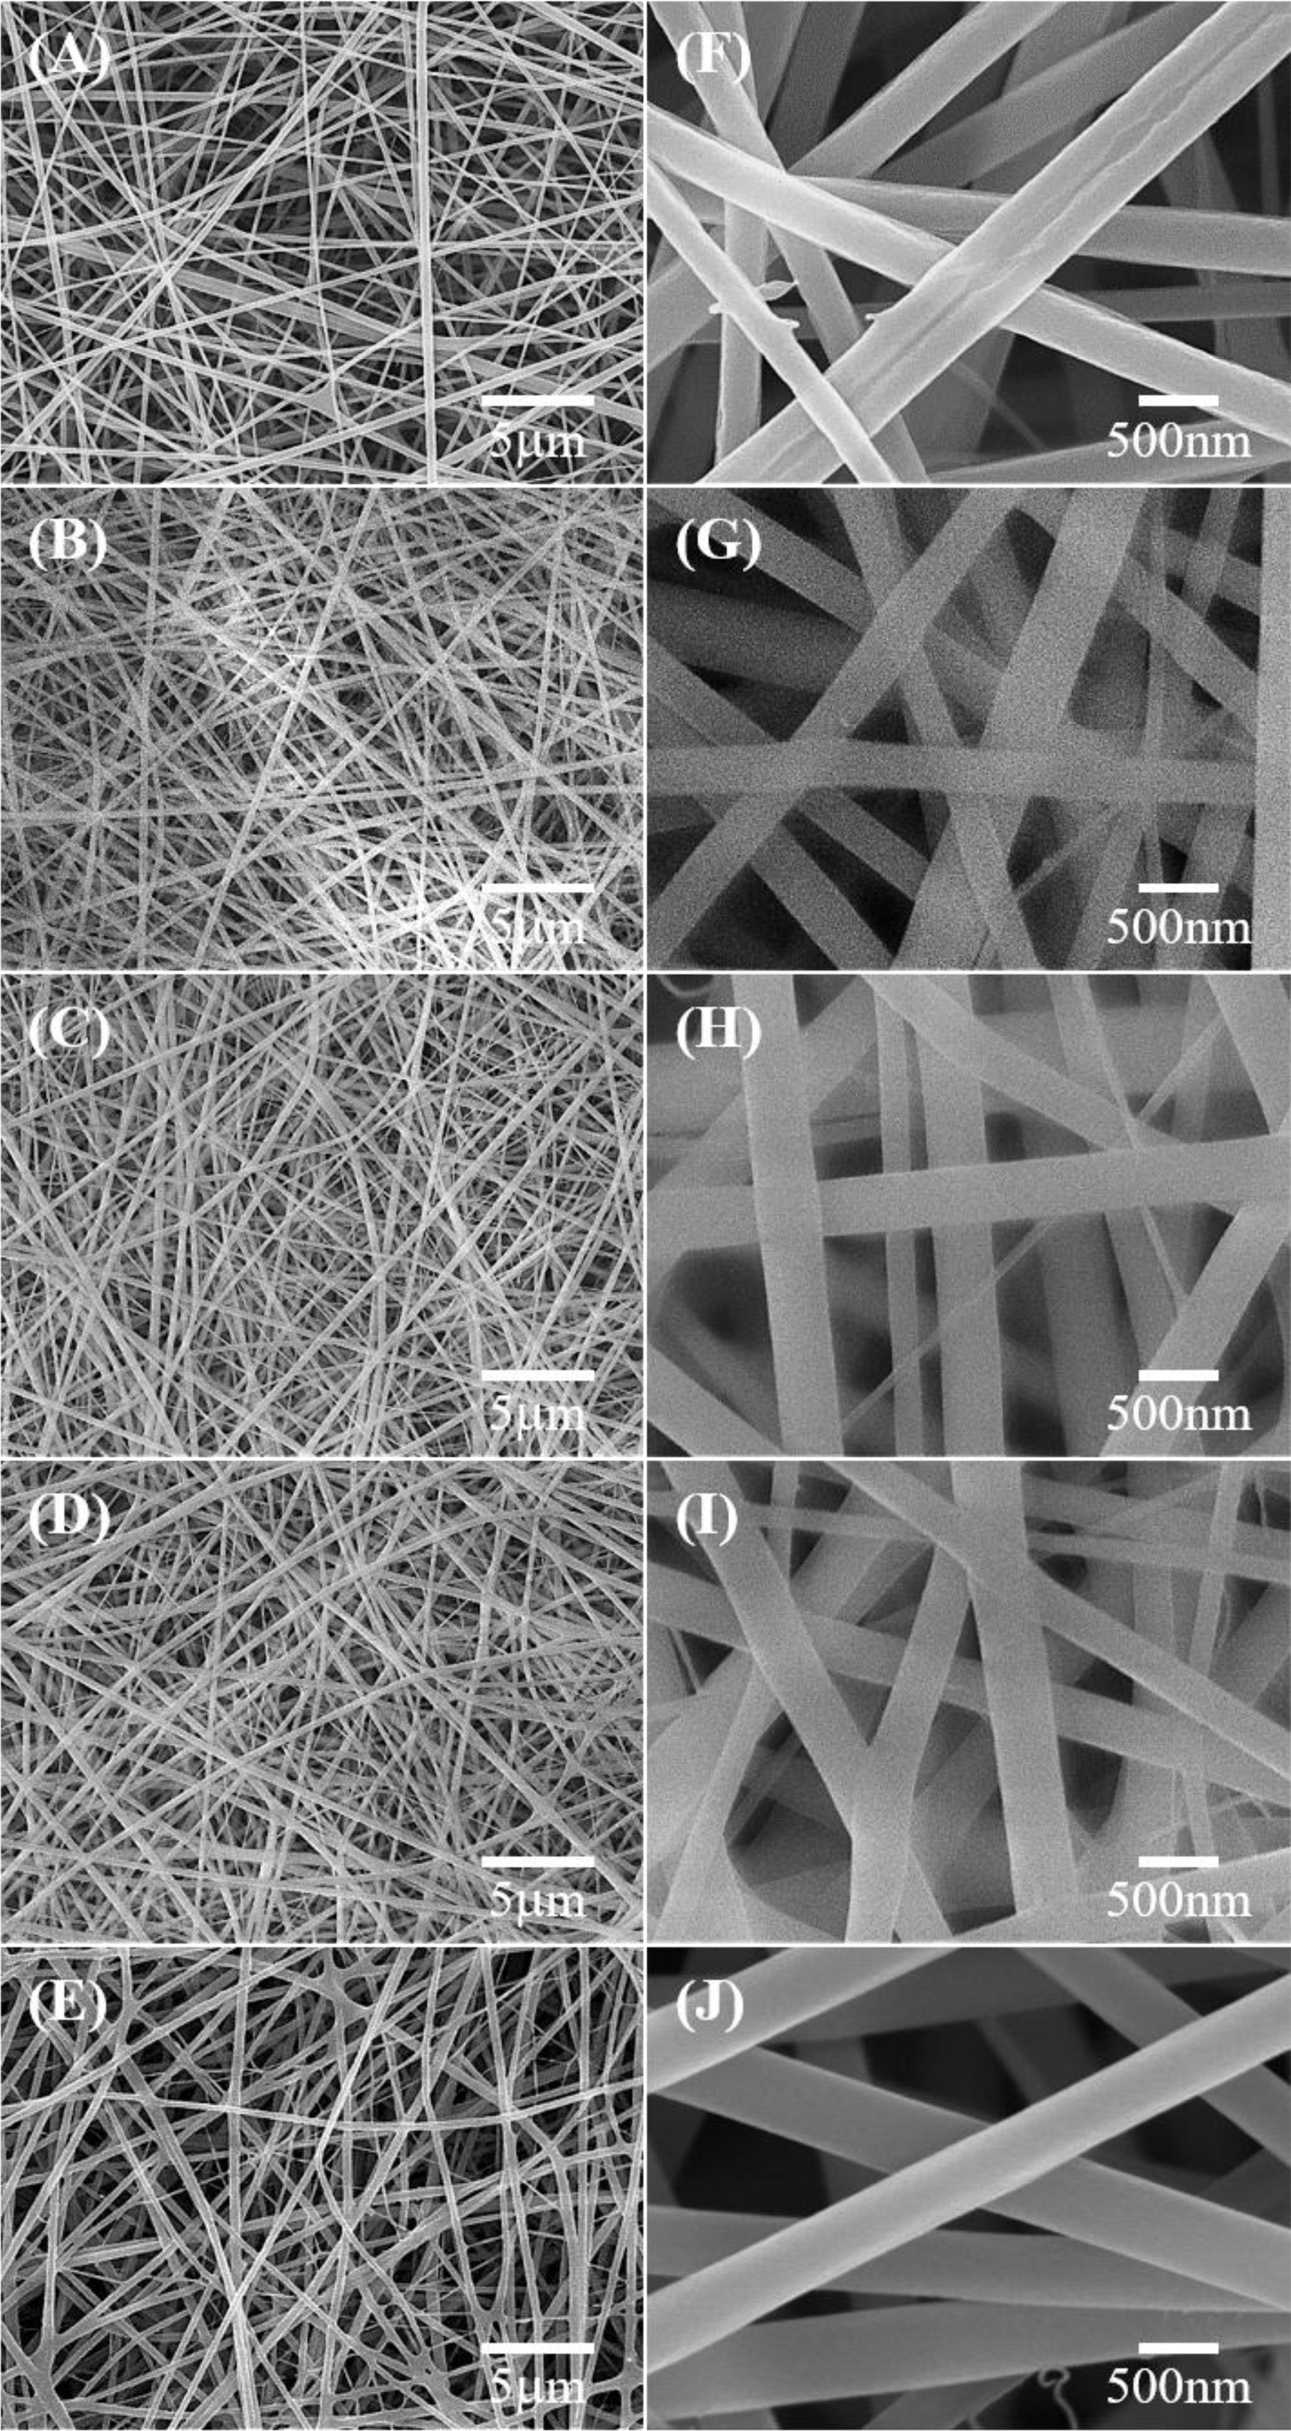
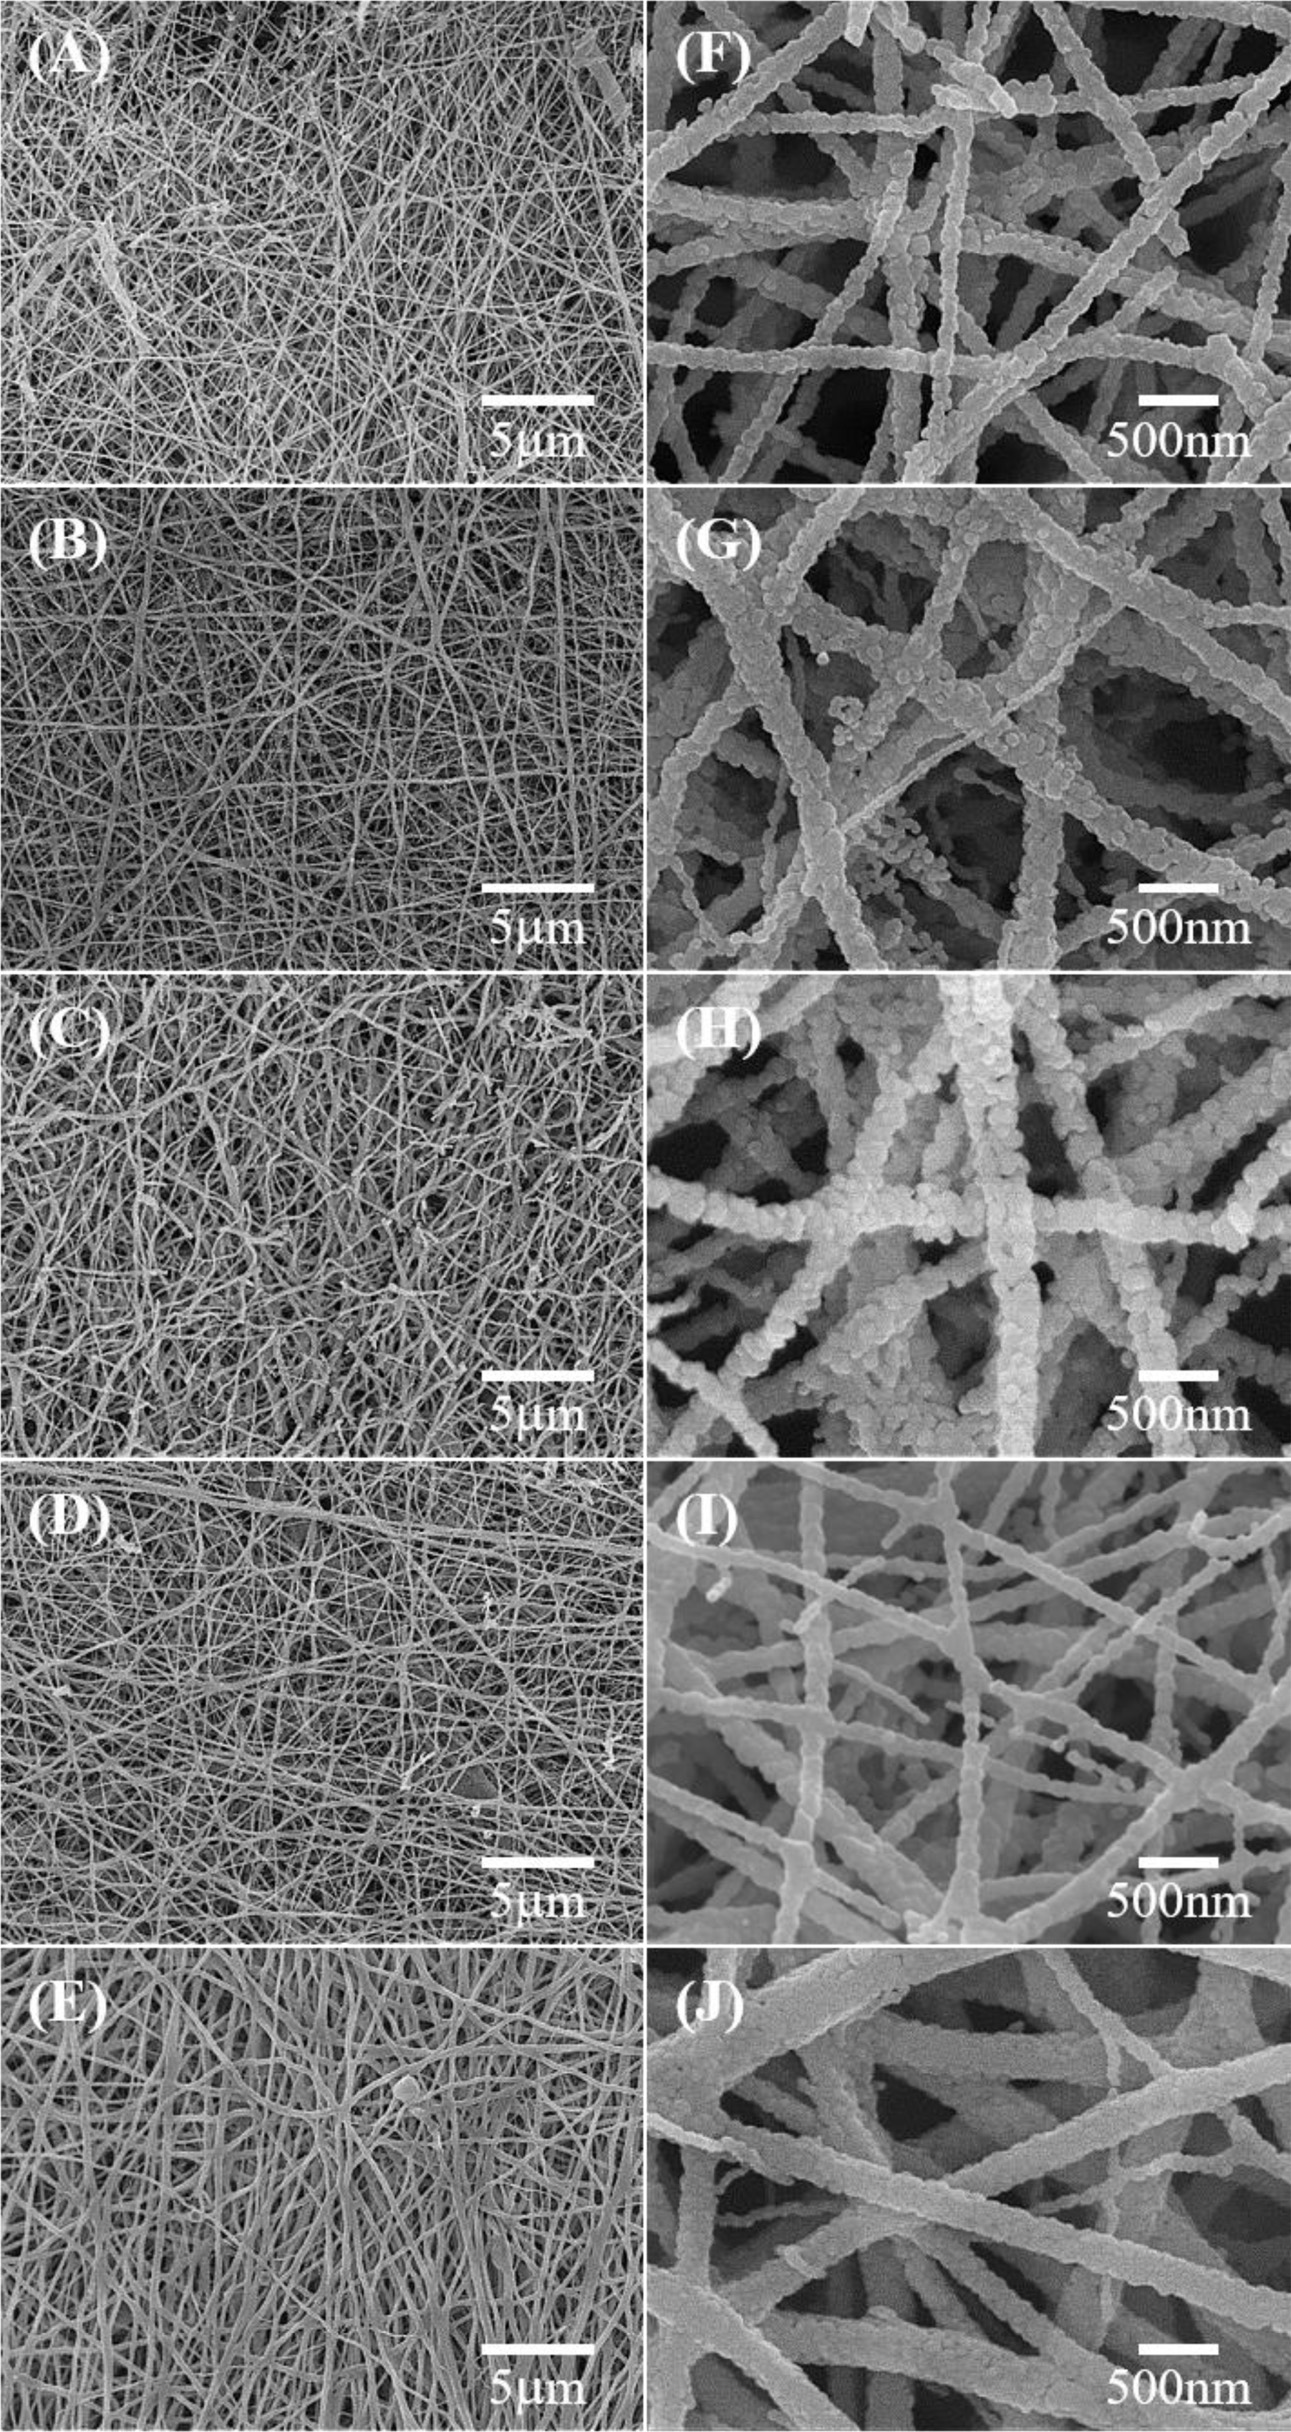
FE-SEM was employed to confirm the morphologies and average diameters of the as-spun fibers and their corresponding calcined products. Fig. 1 shows typical SEM images of the as-spun fibers in which those with or without the Ag precursor exhibit a well-defined fibrous structure with a smooth surface. Their lengths reached several micrometers and the nanofibers were piled up and randomly oriented in a non-woven form. From the diameter distribution graphs, which were generated by manually selecting and measuring around 200 nanofibers, the average diameter of the nanofibers slightly increased at high Ag content levels but all measured diameters were still within one standard deviation of the diameter of ZA-0 nanofibers (Fig. 3). Fig. 2 presents representative low and high magnifi- cation FE-SEM images of the corresponding calcined nanofibers calcined at 500 oC for 3 h in air. All of the calcined products exhibited shrinkage and a rough surface resulting from the decomposition of organic substances and the crystallization of ZnO but maintained their initial long fibrous shape quite well. As shown in Fig. 3, the average diameters of the ZA-1.0, ZA-1.5, ZA-2.0, and ZA-2.5 nanofibers were also within one standard deviation of the ZA-0 nanofiber diameter.
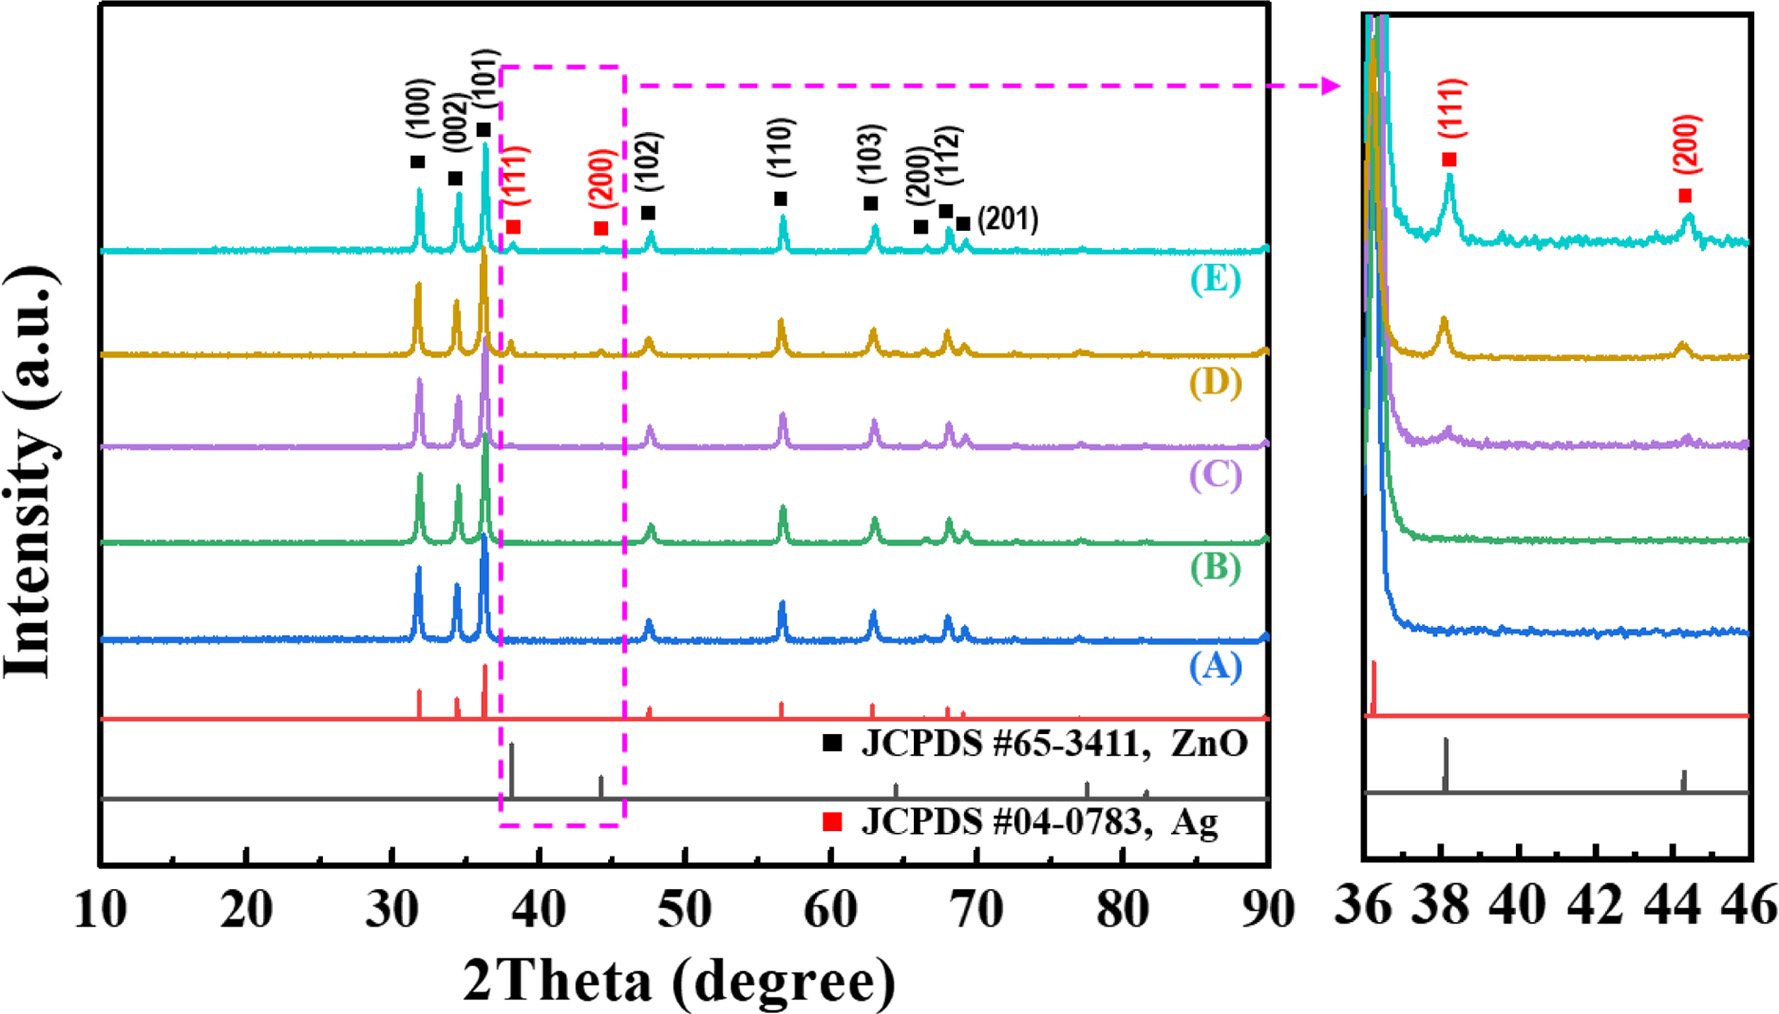
The crystal structures of the calcined nanofibers were investigated via XRD, and Fig. 4 presents XRD patterns of the calcined products as a function of Ag content. The diffraction peaks of ZA-0 can be perfectly indexed as pure hexagonal wurtzite ZnO (JCPDS No. 65-3411). The position and shape of the diffractive peaks of the ZA-1.0, ZA-1.5, ZA-2.0, and ZA-2.5 nanofibers were quite similar to those of pure ZA-0 nanofiber, suggesting that the nanofibers were well maintained as the wurtzite phase after the introduction of Ag. Additionally, very small Ag peaks (JCPDS No. 04-0783) are observable in the enlarged view of the XRD patterns of the ZA-1.5, ZA-2.0, and ZA-2.5 nanofibers, but the diffraction peaks of ZA-1.0 could not be observed due to the low concentration of Ag. No signal from impurities was detected in any of the samples, indicating the high purity of the products. As calculated using the Debye-Scherrer formula [21, 26], the average crystallite size of ZnO was ~22 nm for all of the products. The enlarged view of the XRD patterns (from 35o to 45o) presented in the insert in Fig. 4 indicate the presence of metallic Ag; these peaks were rather broad (revealing that the sizes of the Ag nanoparticles were very small) and became sharper as the Ag content increased (indicating that the Ag nanoparticles grew as a result of aggregation with high Ag content).
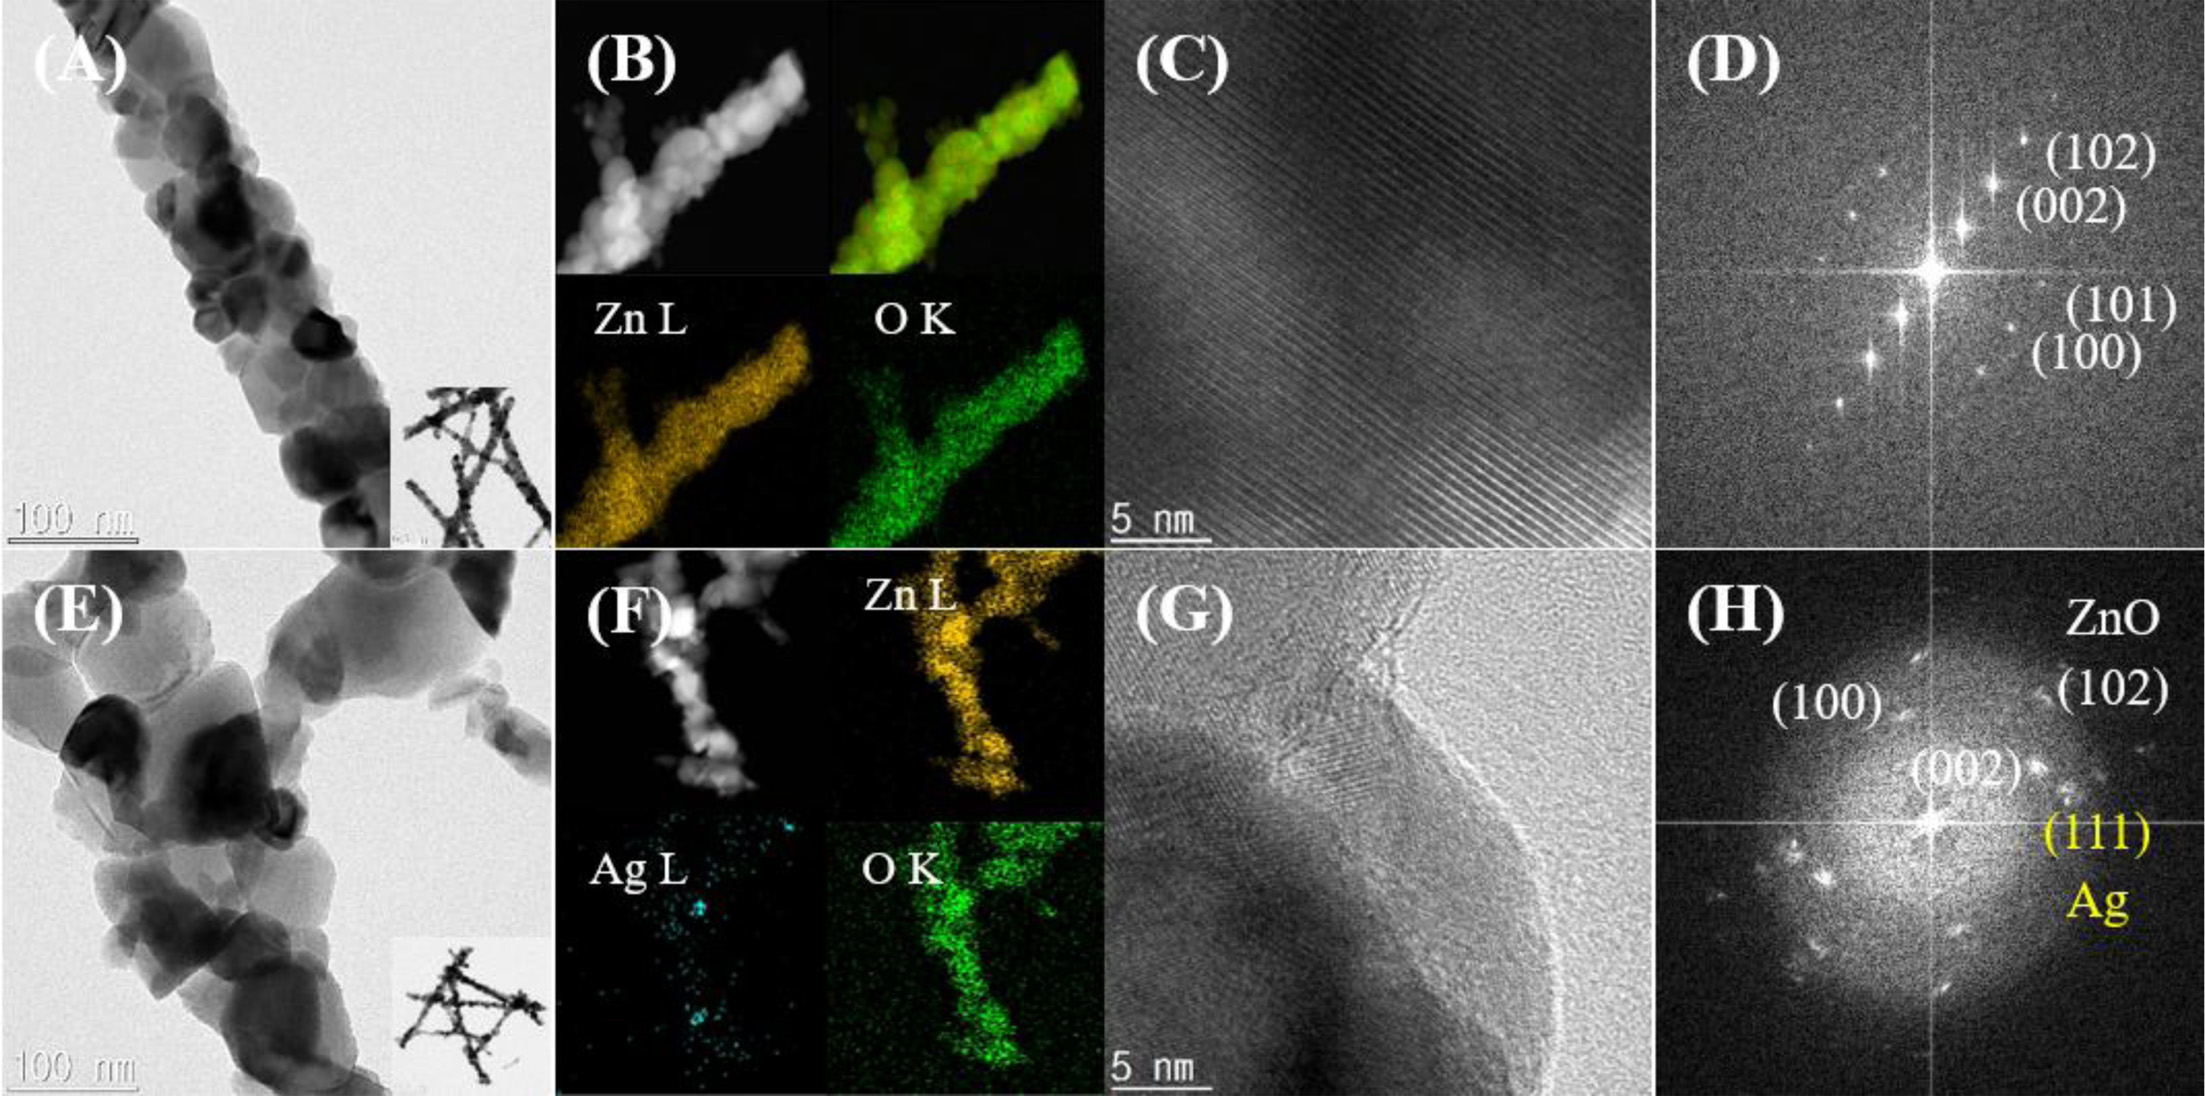
TEM analysis was performed on the ZA-0 and ZA-1.5 nanofibers to examine the Ag formation in the ZnO nanofibers, as shown in Fig. 5 in which it is clearly evident that each individual nanofiber was composed of nanoscale crystallites which were fully bonded with neighboring crystallites to form a fibrous structure. No distinct change was observed on the morphology of the ZA-1.5 nanofibers compared to ZA-0 except for the dispersion of Ag nanoparticles with a diameter of around 10 nm. EDX mapping analysis results from the TEM images of ZA-1.5 reveal the presence of Ag nanoparticles in the nanofibers; their microstructures and inter crystal junctions can be seen more clearly in the HR-TEM images in Fig. 5(C) and 5(G). Fig. 5(D) and 5(H) presents the fast Fourier transform (FFT) patterns of the HR-TEM images (Fig. 5D and 5H for Fig. 5C and 5G, respectively) which shows their high crystallinity and confirms that the transformed patterns correspond to those of hexagonal wurtzite ZnO for both the ZA-0 and ZA-1.5 nanofibers. Additionally, an extra diffraction dot can be seen in the ZA-1.5 pattern corresponding with crystalline Ag in the (111) orientation.
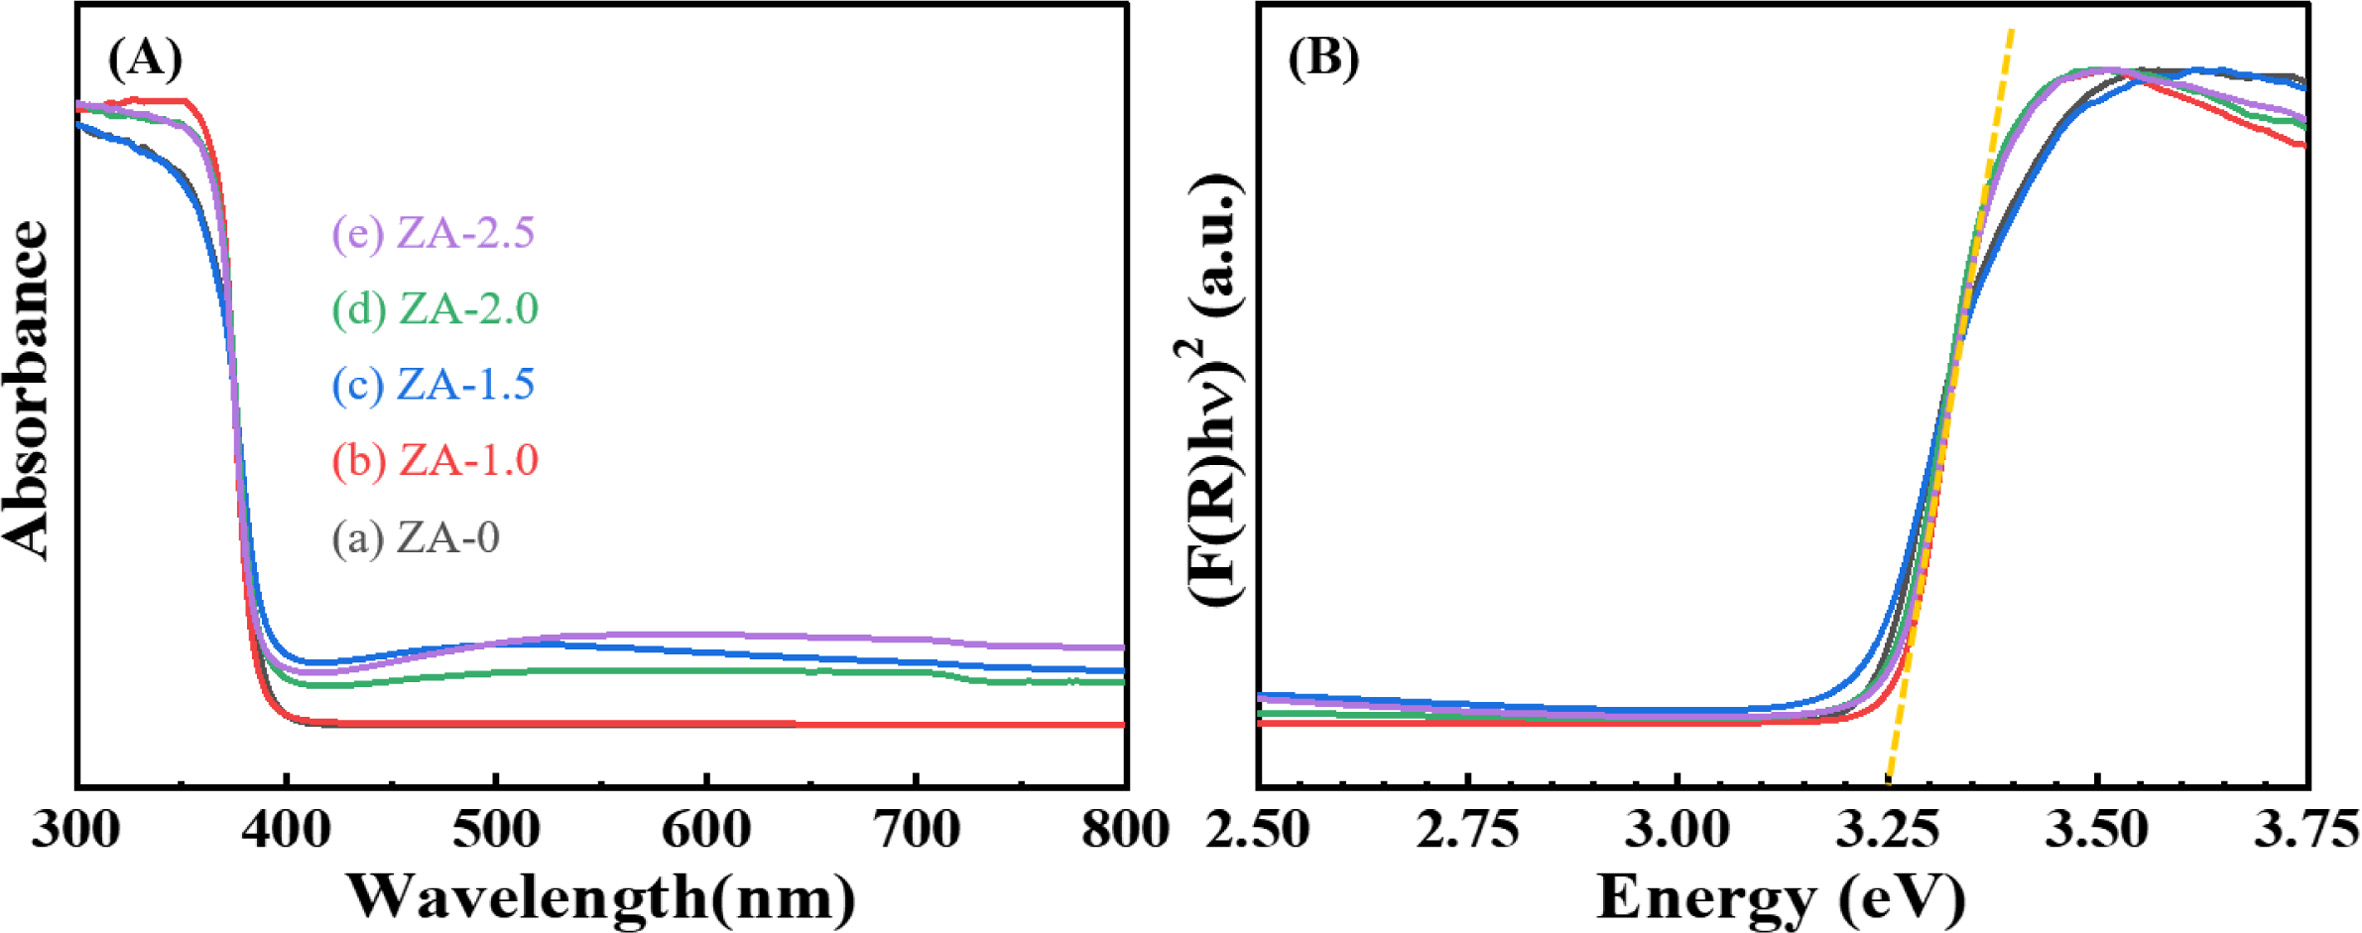
Light absorption is critical to the performances of photocatalysts. Fig. 6(A) shows the UV-vis diffuse reflectance spectra of the nanofibers with different Ag content; it can be seen that the absorption edge of the ZA-0 nanofibers was located at around 380 nm, which is assigned to the intrinsic bandgap absorption of wurtzite ZnO. The Ag-ZnO composite nanofibers exhibited a slight red shift of the absorption edge, suggesting that Ag+ ions might be doped into the ZnO lattice and substitute for Zn2+ ions. The band gaps of all samples were calculated according to the modified Kubelka-Munk function [F(R)E]2 vs. the energy of absorbed light E, which are plotted in Fig. 6(B) [26]. The values are all in the range of experimental error (±0.2 eV), thus the introduction of Ag had almost no influence on the band gap energy of the ZnO nanofibers. However, in contrast to the pure ZnO sample, the Ag-ZnO com- posite nanofibers had slightly increased light absorption in the visible region arising from the surface plasmon resonance (SPR) of the Ag nanoparticles in the ZnO matrix.
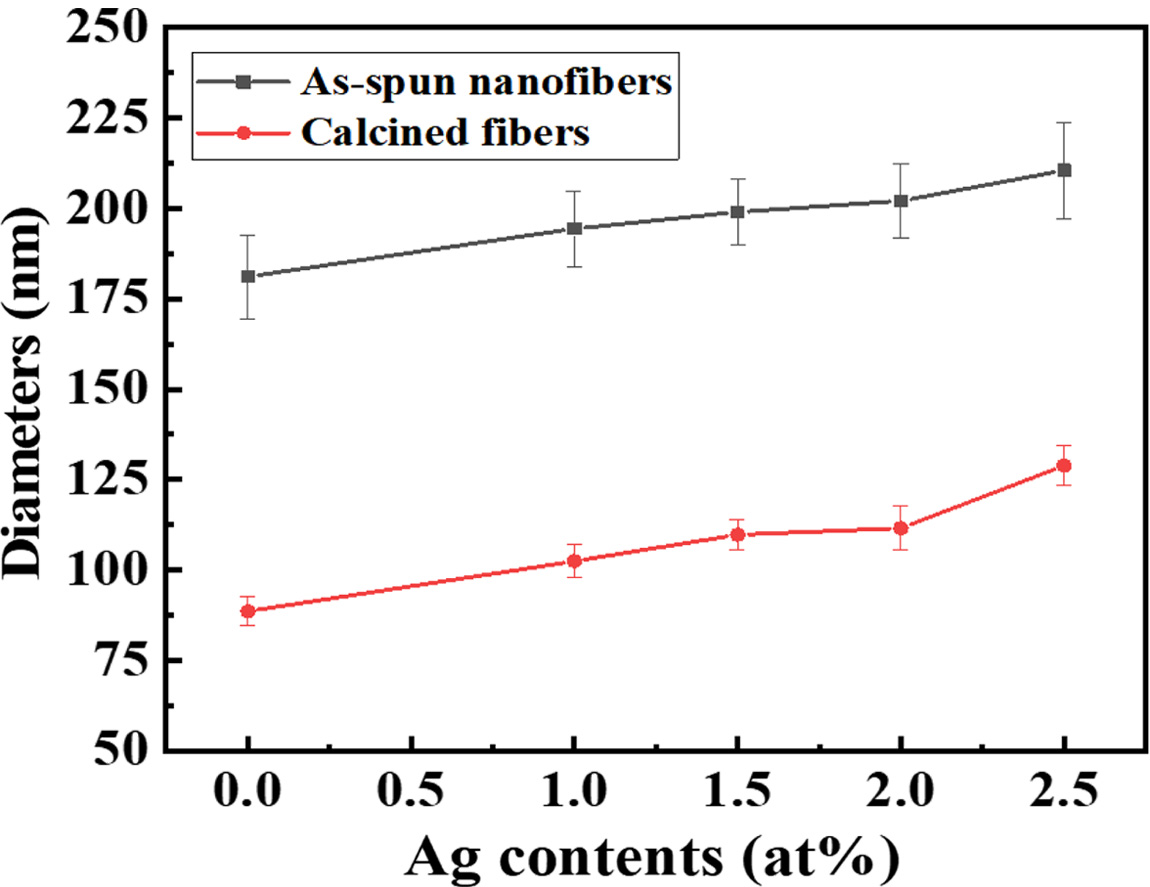
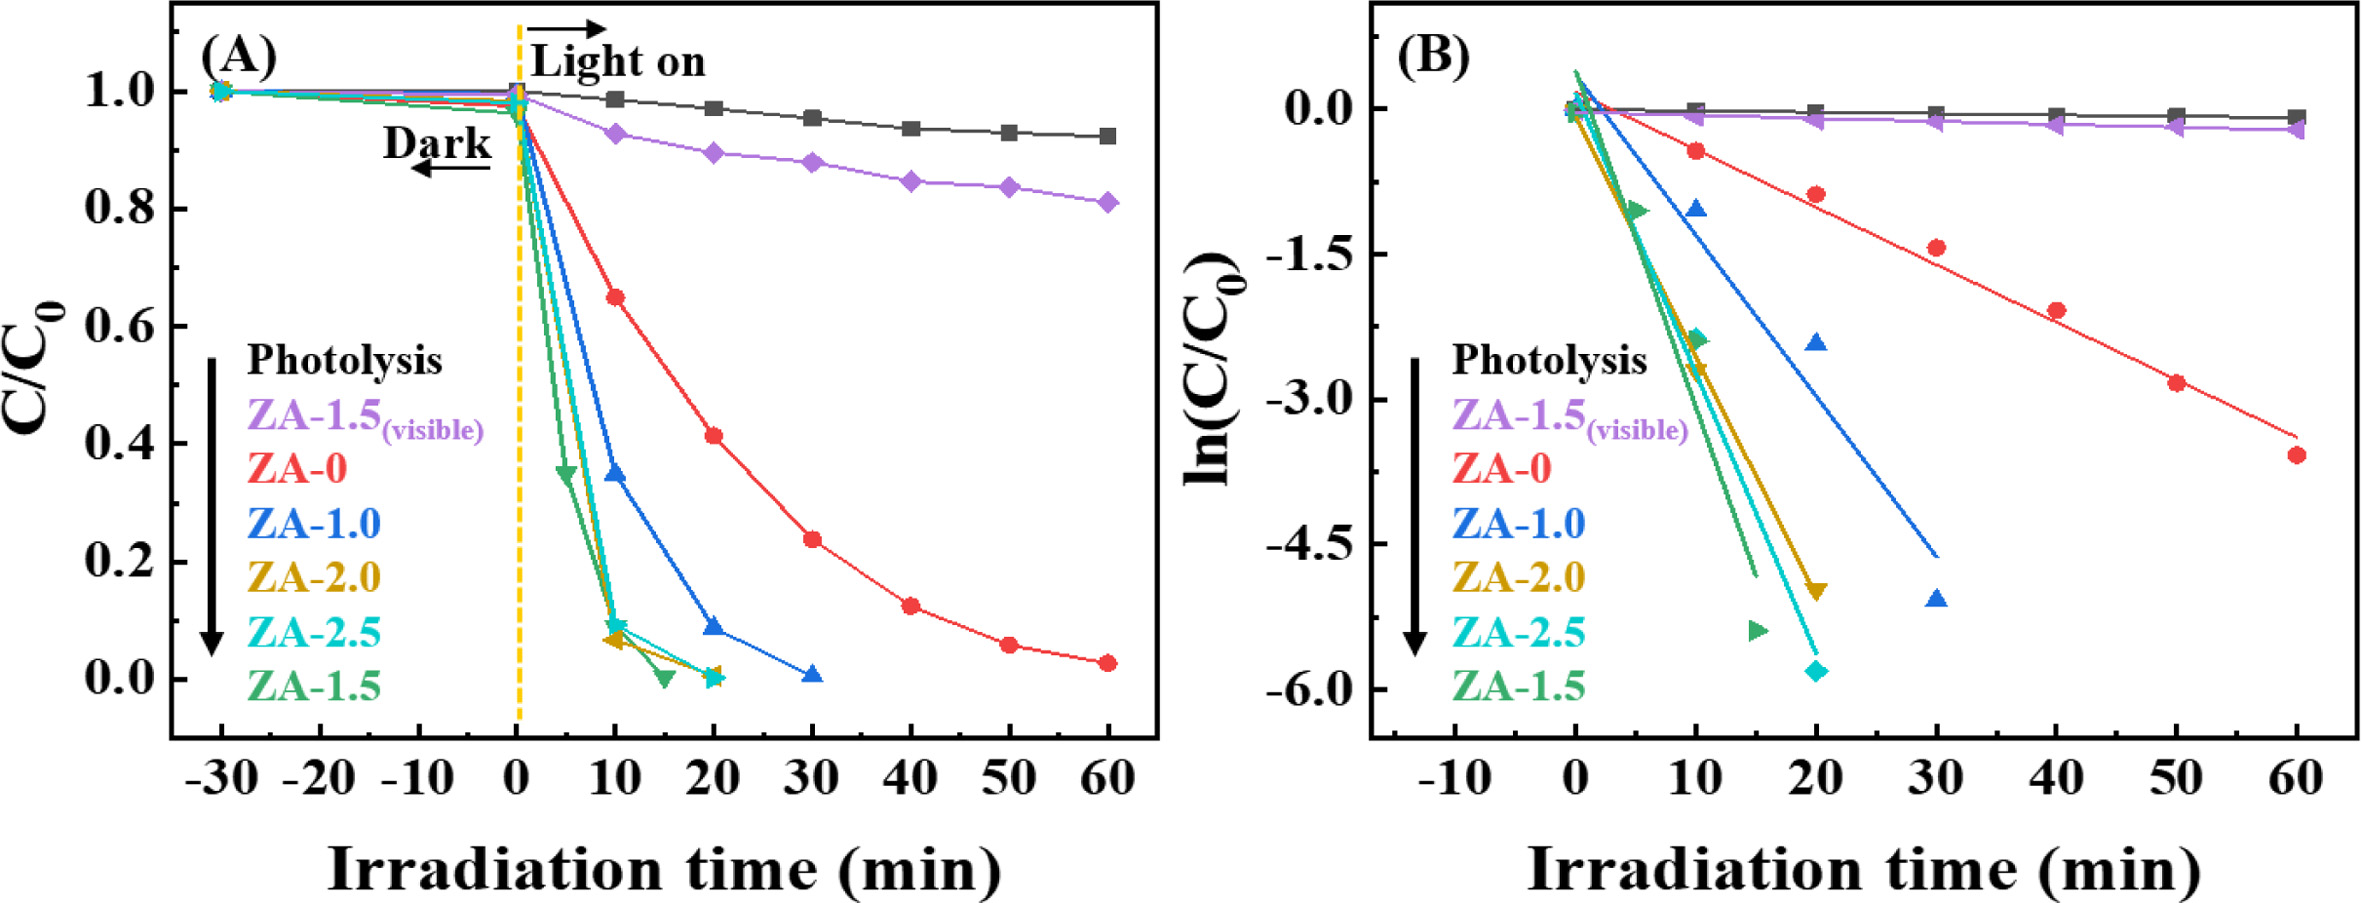
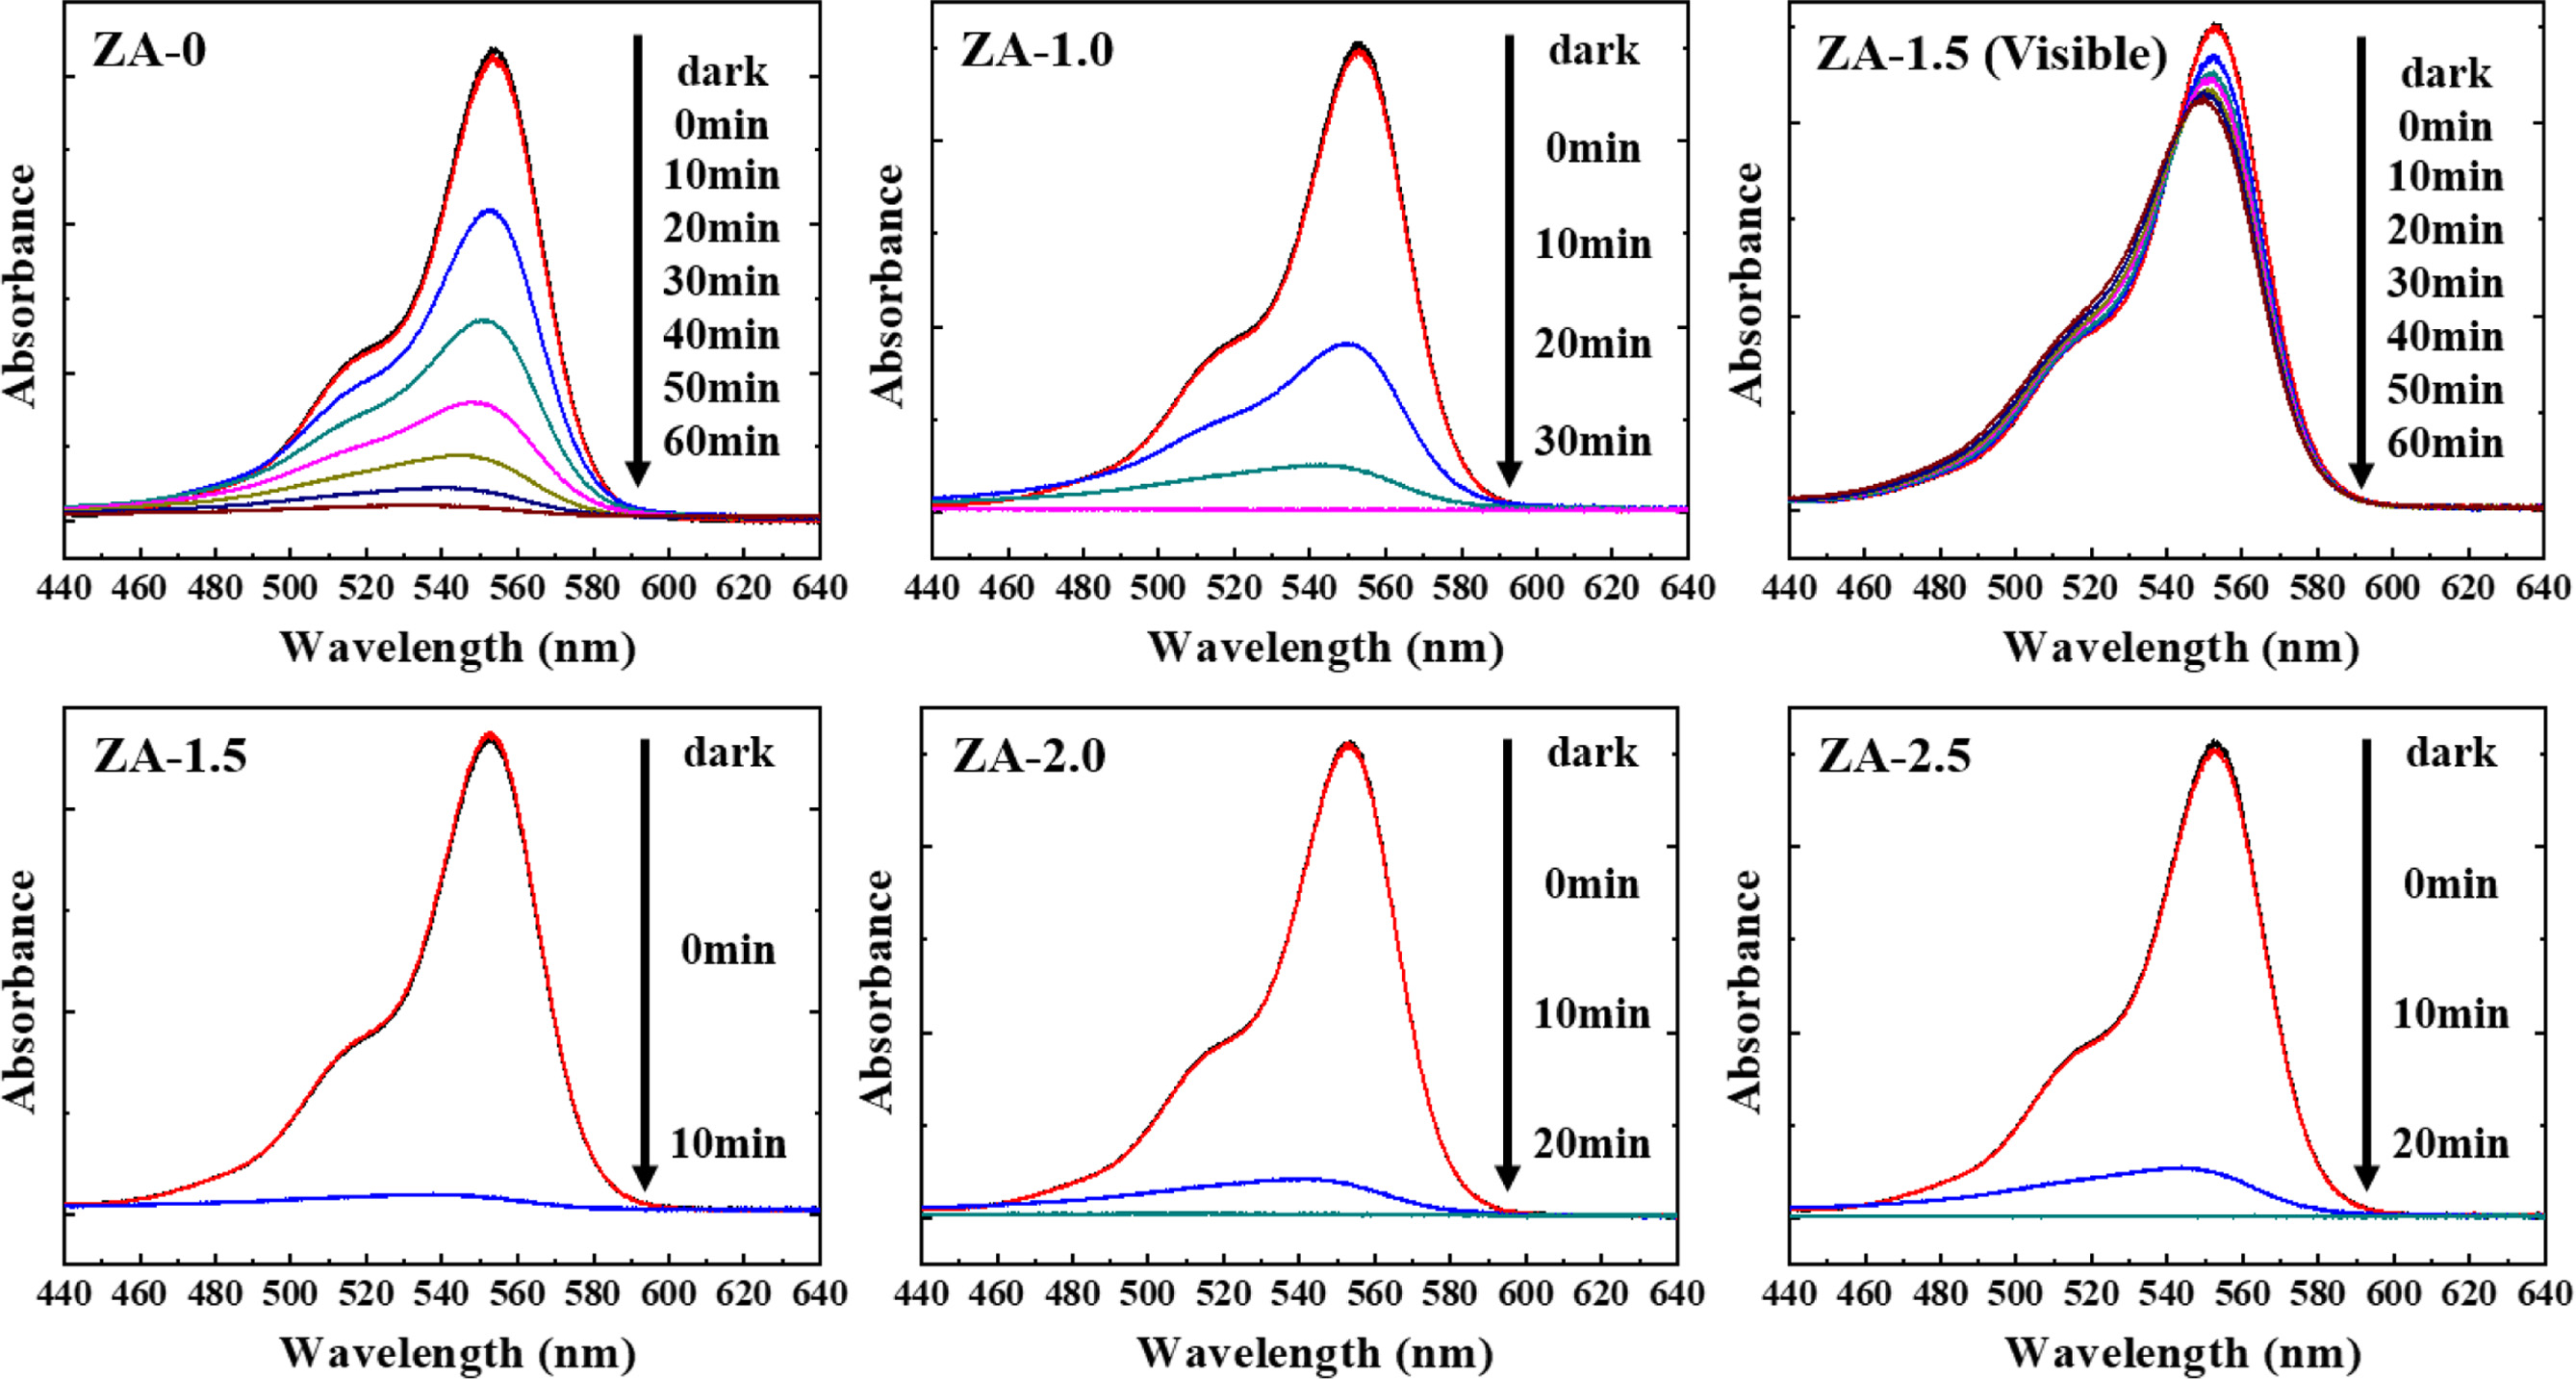
The influence of the loaded amount of Ag on the photocatalytic activity of the Ag-ZnO nanofibers was evaluated by their usage as photocatalysts. Rhodamine B (RhB), a widely used organic dye, was selected as the model pollutant to investigate the photocatalytic activity of the synthesized nanofibers. As shown in Fig. 8, the normalized optical density change of RhB at 553 nm was used to evaluate the photocatalytic activity [27, 28]. C/C0 changes over reaction time, where C0 is the original concentration of dyes and C is the concen- tration of filtrates taken during the reactions, were used to evaluate the degradation rates. Generally, the decom- position of the dye can be assigned to a pseudo-first-order kinetics reaction with a simplified Langmuir-Hinshelwood model when C0 is very small [29, 30]:
where t is the visible light irradiation time and k is the apparent first-order rate constant determined from a linear fit to the data, as shown in Fig. 7. The photo- catalytic activity increased significantly with an increase in Ag content up to 1.5 at% and then decreased as the Ag content increased; obviously, the optimum Ag content is 1.5 at%. As can be seen in Fig. 7, the presence of Ag clearly improved the reactivity of the nanofibers; the ZA-1.5 nanofibers (k = 0.3481) enhanced the reactivity per unit mass by more than 5 times that of the pure ZnO nanofibers (k = 0.0594). The decreased photocatalytic activity of ZA-2.0 and ZA-2.5 compared to ZA-1.5 was mainly attributed that the excess Ag in the ZnO nanofibers forming recombination centers of photoexcited charge carriers. In addition, the RhB degradation experiment with the ZA-1.5 nanofibers was conducted under visible light irradiation (l > 395 nm) to confirm the effect of SPR by the Ag nanoparticles in the ZnO nanofibers on the photocatalytic activity of the ZA-1.5 sample, the results of which show that it was found to be insufficient.
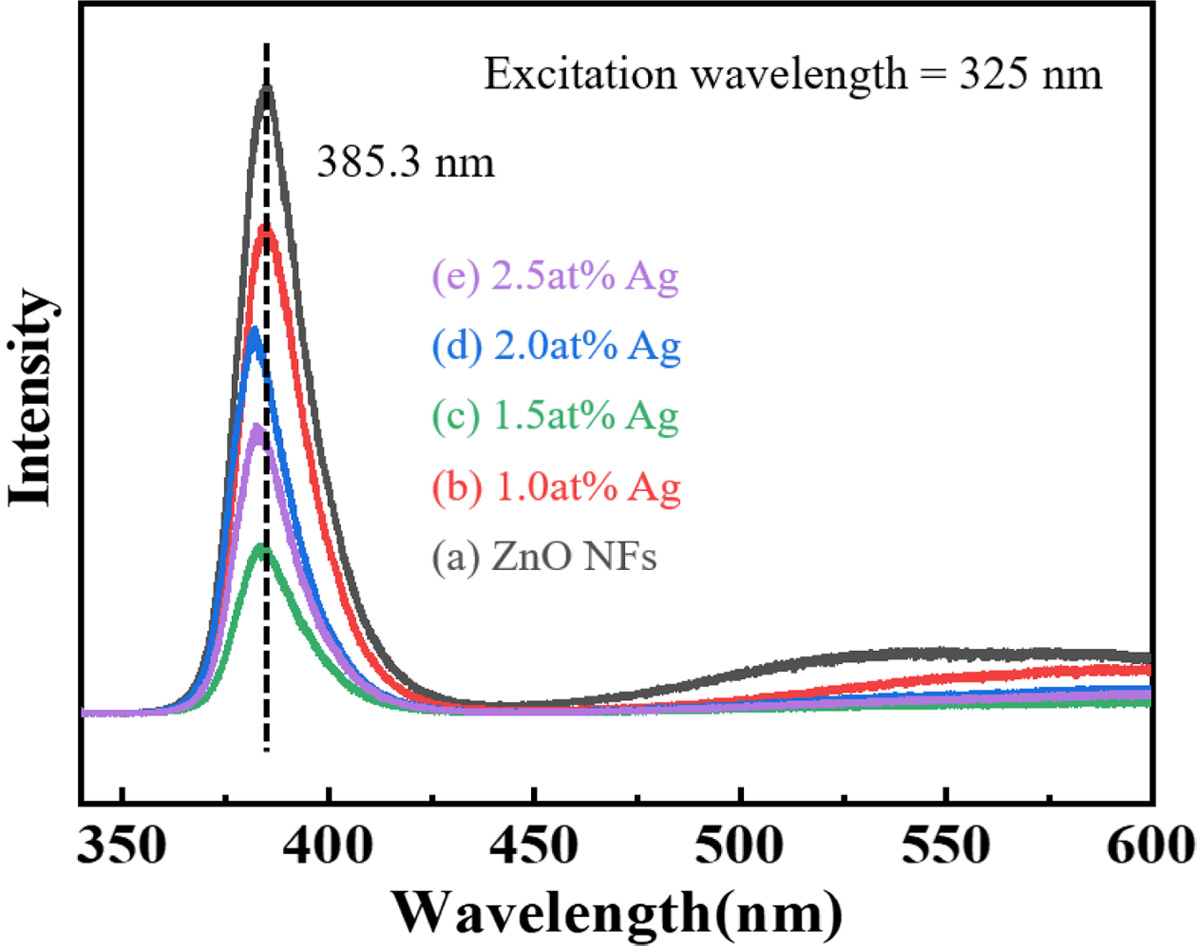
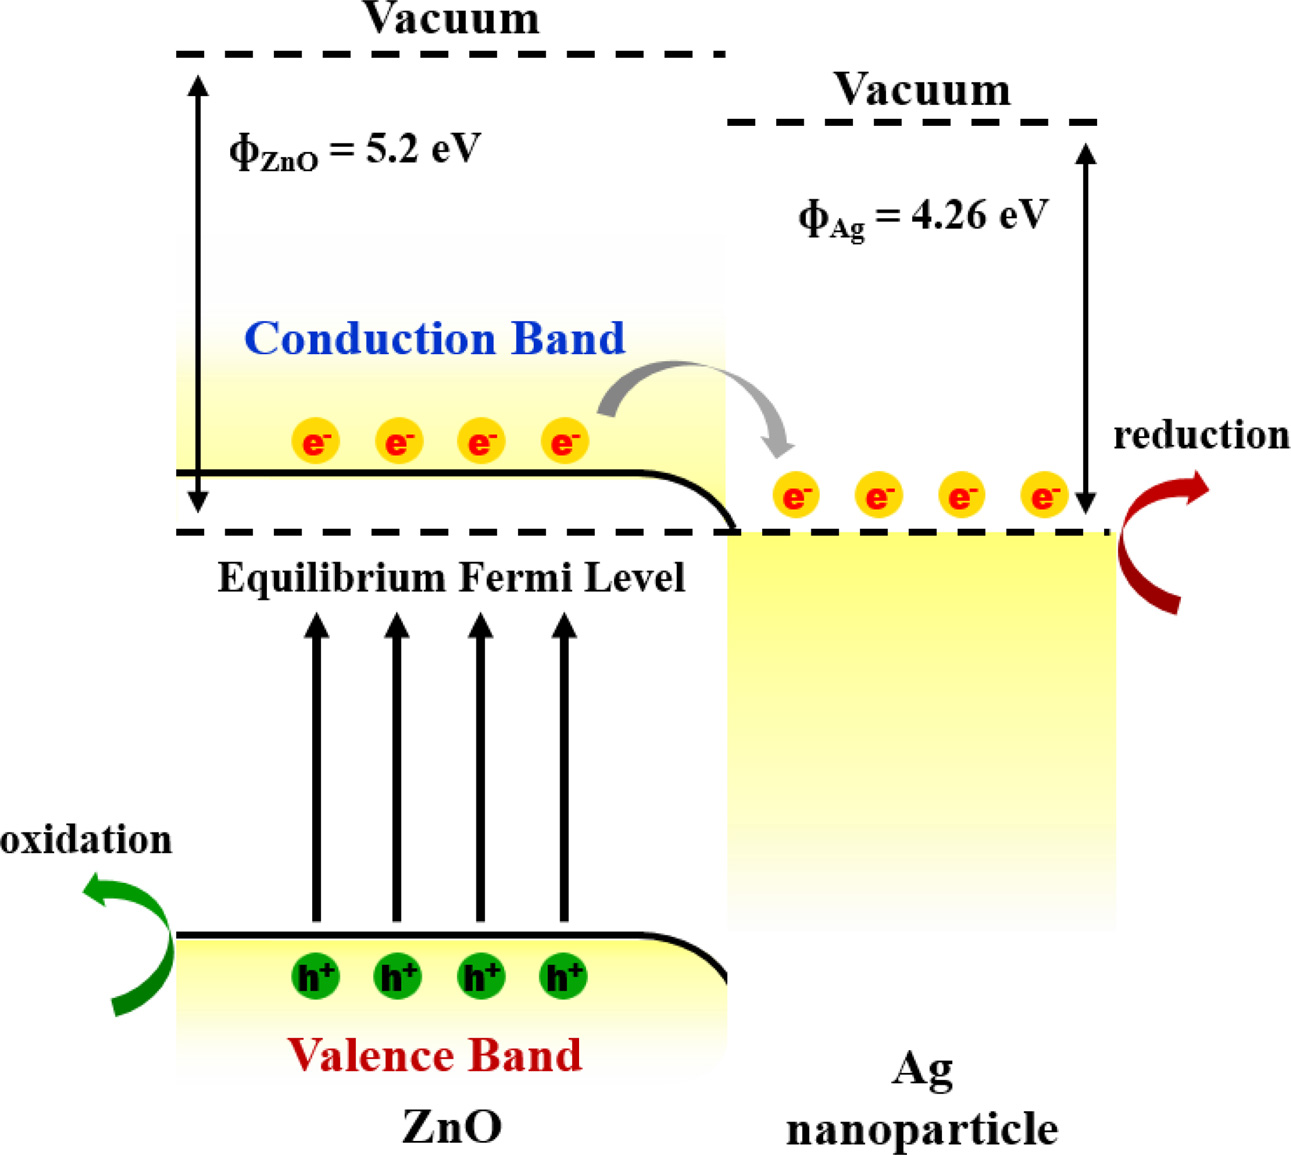
The PL of semiconductors is associated with the migration, transfer, and recombination behavior of the photoexcited electrons and holes, thus PL spectra can reflect the separation and recombination of photoinduced charge carrier in photocatalysts [30-32]. A low PL intensity represents a low recombination probability of the photoexcited electrons and holes under light irradiation. The PL spectra of the ZnO nanofibers with different Ag content are shown in Fig. 9. The excitation wavelength was determined as 325 nm, with all samples showing an emission peak at around 385 nm which is equal to a photon energy of 3.22 eV. According to the calculated band gaps of nanofibers, these PL emissions in the UV region can be explained by near-band-edge emission ascribed to the wide band gap of ZnO [33, 34]. For the pure ZnO nanofiber (ZA-0) had a relatively strong emission peak, while the ZA-1.5 nanofibers with optimum Ag content display a small PL peak in the scope of the monitoring and it can be seen that the photocatalytic activities of the nanofibers decreased as the intensities of the PL peaks increased. It is generally known that the work function of ZnO (ϕs) and Ag (ϕm) are 5.2 eV and 4.26 eV respectively. The ohmic contact is established due to the difference between the work functions of Ag and ZnO. As the heterojunction is formed, the Fermi levels of Ag and ZnO are modified until the equilibrium is established, resulting in the band bending from ZnO to Ag. Therefore, this reconstructed band structure promotes the transfer of photoexcited electrons and prevents the recombination of photoexcited charge carriers [35-37]. Fig. 10 illustrates the charge separation in the Ag-ZnO heterojunction composite nanofibers. These results indicate that the noble-metal contact facilitates electron-hole separation and promotes electron transfer for increased photocatalytic activity. Therefore, the higher photodegradation efficiency of the ZA-1.5 nanofiber could be ascribed to the fact that the heterojunction of Ag and ZnO efficiently prevents the direct recombination of photoexcited electrons and holes. table 1
|
Fig. 1 Field emission scanning electron microscopy (FE-SEM) images of the as-spun nanofibers with different Ag content: (A, F) ZA-0 (0 at% Ag), (B, G) ZA-1.0 (1.0 at% Ag), (C, H) ZA-1.5 (1.5 at% Ag), (D, I) ZA-2.0 (2.0 at% Ag), and (E, J) ZA-2.5 (2.5 at% Ag). |
|
Fig. 2 Field emission scanning electron microscopy (FE-SEM) images of the nanofibers calcined at 500 ? for 3h: (A, F) ZA-0 (0 at% Ag), (B, G) ZA-1.0 (1.0 at% Ag), (C, H) ZA-1.5 (1.5 at% Ag), (D, I) ZA-2.0 (2.0 at% Ag), and (E, J) ZA-2.5 (2.5 at% Ag). |
|
Fig. 3 Graph showing the average diameters of the electrospun nanofibers before and after heat treatment. |
|
Fig. 4 X-ray diffraction (XRD) patterns of electrospun nanofibers with different Ag content: (A) ZA-0 (0 at% Ag), (B) ZA-1.0 (1.0 at% Ag), (C) ZA-1.5 (1.5 at% Ag), (D) ZA-2.0 (2.0 at% Ag), and (E) ZA-2.5 (2.5 at% Ag) |
|
Fig. 5 Transmission electron microscopy (TEM) and fast Fourier transform (FFT) images of Ag-ZnO nanofibers synthesized by electrospinning followed calcination: (A, B, C, D) ZA-0 (0 at% Ag) and (E, F, G, H) ZA-1.5 (1.5 at% Ag). |
|
Fig. 6 (A) UV-Vis absorption spectra and (B) Kubelka-Munk plots obtained from diffuse reflectance data of the nanofibers with different Ag content: ZA-0 (0 at% Ag), ZA-1.0 (1.0 at% Ag), ZA-1.5 (1.5 at% Ag), ZA-2.0 (2.0 at% Ag), and ZA-2.5 (2.5 at% Ag). |
|
Fig. 7 (A) Kinetic profiles on photocatalytic degradation of RhB by Ag-ZnO nanofibers synthesized with different Ag content and (B) plots of ln(C/C0) versus irradiation time for the first-order rate constant: ZA-0 (0 at% Ag), ZA-1.0 (1.0 at% Ag), ZA-1.5 (1.5 at% Ag), ZA-2.0 (2.0 at% Ag), and ZA-2.5 (2.5 at% Ag). |
|
Fig. 8 UV-Vis spectral variation of RhB solutions during photocatalytic degradation using pure and different Ag-ZnO nanofibers as a photocatalyst, respectively. |
|
Fig. 9 . Photoluminescence (PL) spectra of the Ag-ZnO nanofibers synthesized with different Ag content. |
|
Fig. 10 Schematic diagram showing electron migration by the formation of ohmic contact in Ag/ZnO heterojunction composite. |
|
Table 1 The average crystallite size of the Ag nanoparticles in the electrospun Ag-ZnO nanofibers calculated via the Scherrer equation |

ZA-1.0 (1.0 at% Ag), ZA-1.5 (1.5 at% Ag), ZA-2.0 (2.0 at% Ag), ZA-2.5 (2.5 at% Ag). |
In summary, a series of Ag-ZnO composite nanofibers were successfully synthesized using a facile electro- spinning technique followed by thermal treatment for the removal of the PVP template and the conversion of Ag ions to Ag nanoparticles. In addition, we showed that the photocatalytic reactivity could be enhanced and optimized by incorporating Ag nanoparticles as a co-catalyst and tailoring its content, respectively. The diameter, morphology, and band gap of the nanofibers were not significantly altered by the addition of Ag up to 2.5 at%. The photocatalytic activity results show that the presence of the Ag nanoparticles enhanced the activity, with an optimal loading of 1.5 at% Ag outper- forming its unmodified ZnO nanofiber counterpart by a factor of more than 5 times. Above this Ag content, the photocatalytic activity decreased with increasing Ag content. In addition, visible light-driven photocatalytic activity testing showed that the effect of SPR by the Ag nanoparticles on the photocatalytic activity was insuffi- cient. Thus, the photocatalytic activity enhancement of the Ag-ZnO composite nanofibers can be explained by the heterojunction of Ag and ZnO efficiently preventing the direct recombination of photoexcited electrons and holes. It is expected that our present work provides useful information for future development of more efficient 1D photocatalysts for environmental remediation.
This research was supported by Basic Science Re- search Program through the National Research Foun- dation (NRF) of Korea funded by the Ministry of Education (NRF-2018R1D1A1B07048149).
- 1. F. Dong, Z. Zhao, Y. Sun, Y. Zhang, S. Yan, and Z. Wu, Environ. Sci. Technol. 49[20] (2015) 12432-12440.
-

- 2. A.H. Mamaghani, F. Haghighat, and C. Lee, Appl. Catal. B Environ. 203 (2017) 247-269.
-
- 3. H. Ren, P. Koshy, W. Chen, S. Qi, and C.C. Sorrell, J. Hazard. Mater. 325 (2017) 340-366.
-
- 4. F. Gauvin, V. Caprai, Q.L. Yu, and H. J. H. Brouwers, Appl. Catal. B Environ. 227 (2018) 123-131.
-
- 5. B.C. Hodges, E.L. Cates, and J. Kim, Nat. Nanotech. 13[8] (2018) 642-650.
-
- 6. Z. Xing, J. Zhang, J. Cui, J. Yin, T. Zhao, J. Kuang, Z. Xiu, N. Wan, and W. Zhou, Appl. Catal. B Environ. 225 (2018) 452-467.
-
- 7. A. Mills, R. . Davies, and D. Worsley, Chem. Soc. Rev. 22[6] (1993) 417-425.
-
- 8. S.G. Kumar and K.S.R.K. Rao, RSC Adv. 5[5] (2015) 3306-3351.
-
- 9. C.B. Ong, L.Y. Ng, and A.W. Mohammad, Renew. Sust. Energy Rev. 81 (2018) 536-551.
-
- 10. H.L. Guo, Q. Zhu, X.L. Wu, Y.F. Jiang, X. Xie, and A.W. Xu, Nanoscale 7[16] (2015) 7216-7223.
-
- 11. C. Tian, Q. Zhang, A. Wu, Z. Liang, B. Jiang, and H. Fu, Chem. Commun. 48[23] (2012) 2858-2860.
-
- 12. H. Wang, L. Zhang, Z. Chen, J. Hu, S. Li, Z. Wang, J. Liu, and X. Wang, Chem. Soc. Rev. 43[15] (2014) 5234-5244.
-
- 13. J. Fu, J. Yu, C. Jiang, and B. Cheng, Adv. Energy Mater. 8[3] (2018) 1701503.
-
- 14. A. Li, X. Chang, Z. Huang, C. Li, Y. Wei, L. Zhang, T. Wang, and J. Gong, Angew. Chem. Int. Ed. 55[44] (2016) 13734-13738.
-
- 15. J. Low, J. Yu, M. Jaroniec, S. Wageh, and A.A. Al-Ghamdi, Adv. Mater. 29[20] (2017) 1601694.
-
- 16. Y. Zheng, L. Zheng, Y. Zhan, X. Lin, Q. Zheng, and K. Wei, Inorg. Chem. 46[17] (2007) 6980-6986.
-
- 17. K. Lee, C. Lai, K. Ngai, and J. Juan, Water Res. 88 (2016) 428-448.
-
- 18. N. Sobana, M. Muruganadham, and M. Swaminathan, J. Mol. Catal. A Chem. 258[1-2] (2006) 124-132.
-
- 19. Y. Liu, C. Liu, Q. Rong, and Z. Zhang, Appl. Surf. Sci. 220[1-4] (2003) 7-11.
-
- 20. G. Lim, J. Yoo, M. Ji, and Y. Lee, J. Alloys Compd. 806 (2019) 1060-1067.
-
- 21. D. Lin, H. Wu, R. Zhang, and W. Pan, Chem. Mater. 21[15] (2009) 3479-3484.
-
- 22. X. Chen, Y. Li, X. Pan, D. Cortie, X. Huang, and Z. Yi, Nat. Commun. 7[1] (2016) 1-8.
-
- 23. Y. Liang, N. Guo, L. Li, R. Li, G. Ji, and S. Gan, Appl. Surf. Sci. 332 (2015) 32-39.
-
- 24. H. Bouzid, M. Faisal, F.A. Harraz, S.A. Al-Sayari, and A. A. Ismail, Catal. Today 252 (2015) 20-26.
-
- 25. H. Yoneyama, Y. Toyoguchi, and H. Tamura, J. Phys. Chem. 76[23] (1972) 3460-3464.
-
- 26. S.S. Kumar, P. Venkateswarlu, V.R. Rao, and G.N. Rao, Inter. Nano Lett. 3[1] (2013) 30.
-
- 27. R. Riaz, M. Ali, H. Anwer, M.J. Ko, and S.H. Jeong, J. Colloid Interface Sci. 557 (2019) 174-184.
-
- 28. R. Riaz, M. Ali, T. Maiyalagan, A.A. Arbab, A.S. Anjum, S. Lee, M.J. Ko, and S.H. Jeong, Int. J. Hydrog. Energy 45[13] (2020) 7751-7763.
-
- 29. C.S. Turchi and D.F. Ollis, J. Catal. 122[1] (1990) 178-192.
-
- 30. N. Barka, A. Assabbane, A. Nounah, and Y. AîtIchoua, J. Hazard. Mater. 152[3] (2008) 1054-1059.
-
- 31. J. Liqiang, Q. Yichun, W. Baiqi, L. Shudan, J. Baojiang, Y. Libin, F. Wei, F. Honggang, and S. Jiazhong, Sol. Energy Mater. Sol. Cells 90[12] (2006) 1773-1787.
-
- 32. B. Sarma and B.K. Sarma, Appl. Surf. Sci. 410 (2017) 557-565.
-
- 33. F.A. Alharthi, A.A. Alghamdi, N.A. Zaqri, H.S. Alanazi, A.A. Alsyahi, A.E. Marghany, and N. Ahmad, Sci. Rep. 10 (2020) 20229.
-
- 34. Q. Deng, X. Duan, D.H.L. Ng, H. Tang, Y. Yang, M. Kong, Z. Wu, W. Cai, and G. Wang, ACS Appl. Mater. Interfaces 4[11] (2012) 6030-6037.
-
- 35. C. Ding, K. Fu, Y. Pan, J. Liu, H. Deng, and J. Shi, Catalysts 10[9] (2020) 1097.
-
- 36. Y. Liu, S. Wei, and W. Gao, J. Hazard. Mater. 287 (2015) 59-68.
-
- 37. R. Riaz, M. Ali, I.A. Sahito, A.A. Arbab, T. Maiyalagan, A.S. Anjum, M.J. Ko, and S.H. Jeong, Appl. Surf. Sci. 480 (2019) 1035-1046.
-
 This Article
-
2021; 22(4): 386-393
Published on Aug 31, 2021
- 10.36410/jcpr.2021.22.4.386
- Received on Sep 15, 2020
- Revised on Apr 26, 2021
- Accepted on May 14, 2021
Services
- Abstract
introduction
material and methods
results and discussion
conclusions
- Acknowledgements
- References
- Full Text PDF
Shared
Correspondence to
- Young-In Lee
-
aDepartment of Materials Science and Engineering, Seoul National University of Science and Technology, Seoul 01811, Republic of Korea
bThe Institute of Powder Technology, Seoul National University of Science and Technology, Seoul 01811, Republic of Korea
Tel : +82-2-970-6646 Fax: +82-2-973-6657 - E-mail: youngin@seoultech.ac.kr
Clean-Energy Research Institute(CRI), Hanyang University, 222, Wangsimni-ro, Seongdong-gu, Seoul, 04763, Korea
E-mail: jcpr@hanyang.ac.kr