


- Effect of composition on the ability to form SiC/SiO2-C composite from rice husk and silica gel
Do Quang Minha,b, Tran Van Khaia,b, Huynh Ngoc Minha,b, Nguyen Vu Uyen Nhia,b and Kieu Do Trung Kiena,b,*
aFaculty of Materials Technology, Ho Chi Minh City University of Technology, 268 Ly Thuong Kiet street, Ward 14, District 10, Ho Chi Minh City, Vietnam
bVietnam National University Ho Chi Minh City, Linh Trung Ward, Thu Duc District, Ho Chi Minh City, VietnamThis article is an open access article distributed under the terms of the Creative Commons Attribution Non-Commercial License (http://creativecommons.org/licenses/by-nc/4.0) which permits unrestricted non-commercial use, distribution, and reproduction in any medium, provided the original work is properly cited.
Rice husk is a waste product of agricultural production of rice. Every year, the agricultural production of Vietnam emits about 10 million tons of rice husks. Rice husks are usually treated by burning method or discharged into rivers, causing many negative impacts on the environment. In this study, the rice husk/silica gel ratio components were investigated to form SiC/SiO2-C composite in a CO2 environment at 1000 oC for 60 min. The products after pyrolysis were determined SiC, SiO2, and free C contents according to ISO 21068-2: 2008 standards. The functional groups and mineral composition of composites were analyzed by Fourier transform infrared spectroscopy (FTIR) and X-ray diffraction (XRD). The microstructure and element distribution of them were observed by scanning electron microscope (SEM) and Energy-dispersive X-ray (EDX) mapping. The results showed that the optimum rice husk/silica gel ratio to form SiC/SiO2-C was 1.4/1. The sample after pyrolysis had chemical composition including 14% SiC, 63% SiO2, 23% free C (%wt.) and the phase composition including amorphous carbon, β-SiC, 6H-SiC, 4H-SiC, cristobalite. Composite SiC/SiO2-C can apply to advanced friction systems. This can be seen as an effective method to treat rice husk waste and improved the economic value of rice plants
Keywords: Silicon carbide, rice husk, SiC/SiO2-C composite
Vietnam is an agricultural country and people have been living by growing rice for a long time. Rice is the main product of agriculture in Vietnam. Rice not only contributes to ensuring people's lives but also contributes a huge part to the total export turnover value in Vietnam. According to statistics in 2019, the rice cultivation area in Vietnam is 7.53 million hectares, the total export turnover is 2.81 billion USD. Vietnam rice is exporting to more than 150 countries and regions around the world. These data confirm the great benefits that rice can bring to Vietnam. However, rice husk which is a by-product of the rice industry has not yet been treated effectively. According to statistics, Vietnam produces about 50 million tons of paddy and discharges generate nearly 10 million tons of rice husk per year. This amount of rice husk is usually treated mainly by the burning method. This treatment method has hidden risks of causing environmental pollution and harming human health.
Following the trend of green agriculture and zero emissions to the environment, many studies have been done using rice husk or rice husk ash to form products with interesting technical properties. Rathinam Yuvakkumar et al. prepared nano-silica from rice husk by using alkali extraction and precipitated acid. The formed nano-silica had a high purity of 99.9% and a medium size of ~ 25 nm [1]. Nano-silica powder is been applying in areas such as cement mortars [2], construction materials [3, 4], bio-materials [5], etc. Samantha Pinheiro et al. fabricated silica gel by extracting rice husk ash by the sol-gel method [6]. Silica gel can be used as an active additive in mortar and concrete production [7, 8]. Concrete using activated silica has higher strength and uses less cement than conventional concrete. In another study, Sheng Cui et al. fabricated aerogel from rice husk ash by sol-gel method and supercritical drying of ethanol. The aerogel had a density of 0.0713 g/cm3, a specific surface area of 729.82 m2/g, and an average pore size of 16.32 nm [9]. The properties of aerogel offer great potential for application as insulation materials, catalysis materials, acoustics, and microelectronics [10]. Sazia Sultana et al. also synthesized bioactive wollastonite from rice husk and eggshell by calcination of the mixture at 1000 oC. In the advanced ceramics, pure wollastonite can be used as a bone regenerative bioceramic materials [11].
In addition to the above studies, rice husk is also used to fabricate SiC/SiO2-C composite. Wei Weng et al. conducted electrochemical rice husk with a one-pot molten-salt-assisted to synthesize nano SiC/C from rice husk. Nano SiC/C was applied to photocatalyst [12]. Mahamad Mehdi Seraji et al. synthesized C/SiO2/SiC from novolak resin and rice husk [13]. In another work, Tawat Chanadee produced SiO2-SiC composite from rice husk ash, natural sand, activated carbon, and Mg metal at 1300 oC under a flowing N2 atmosphere [14]. Because SiC/SiO2-C composite has a high mechanical property, a high coefficient of thermal conductivity, and excellent thermal shock resistance [15], they are often applied to many fields such as aerospace [16], advanced friction systems [17, 18], reinforced materials [19-21], etc.
From the above-advanced applications, the research to fabricate SiC/SiO2-C composite will contribute to solving the rice husk waste in Vietnam and improve the economic value of rice plants. If the raw material only uses rice husk, the SiC/SiO2-C composite will have a low SiC content [22]. The cause of low SiC content is due to insufficient SiO2 involved in the reaction. Several studies have solved this problem by using a combination of tetraethyl orthosilicate (TEOS) materials to provide SiO2 [23]. However, due to the high cost of TEOS, this method is difficult to apply to large-scale production. In this study, SiC/SiO2-C composite has been studied and fabricated from rice husk (Long An province, Vietnam) and silica gel at 1000 oC in a CO2 environment. Silica gel also was synthesized from rice husk and it is a raw material that provides SiO2 to replace TEOS.
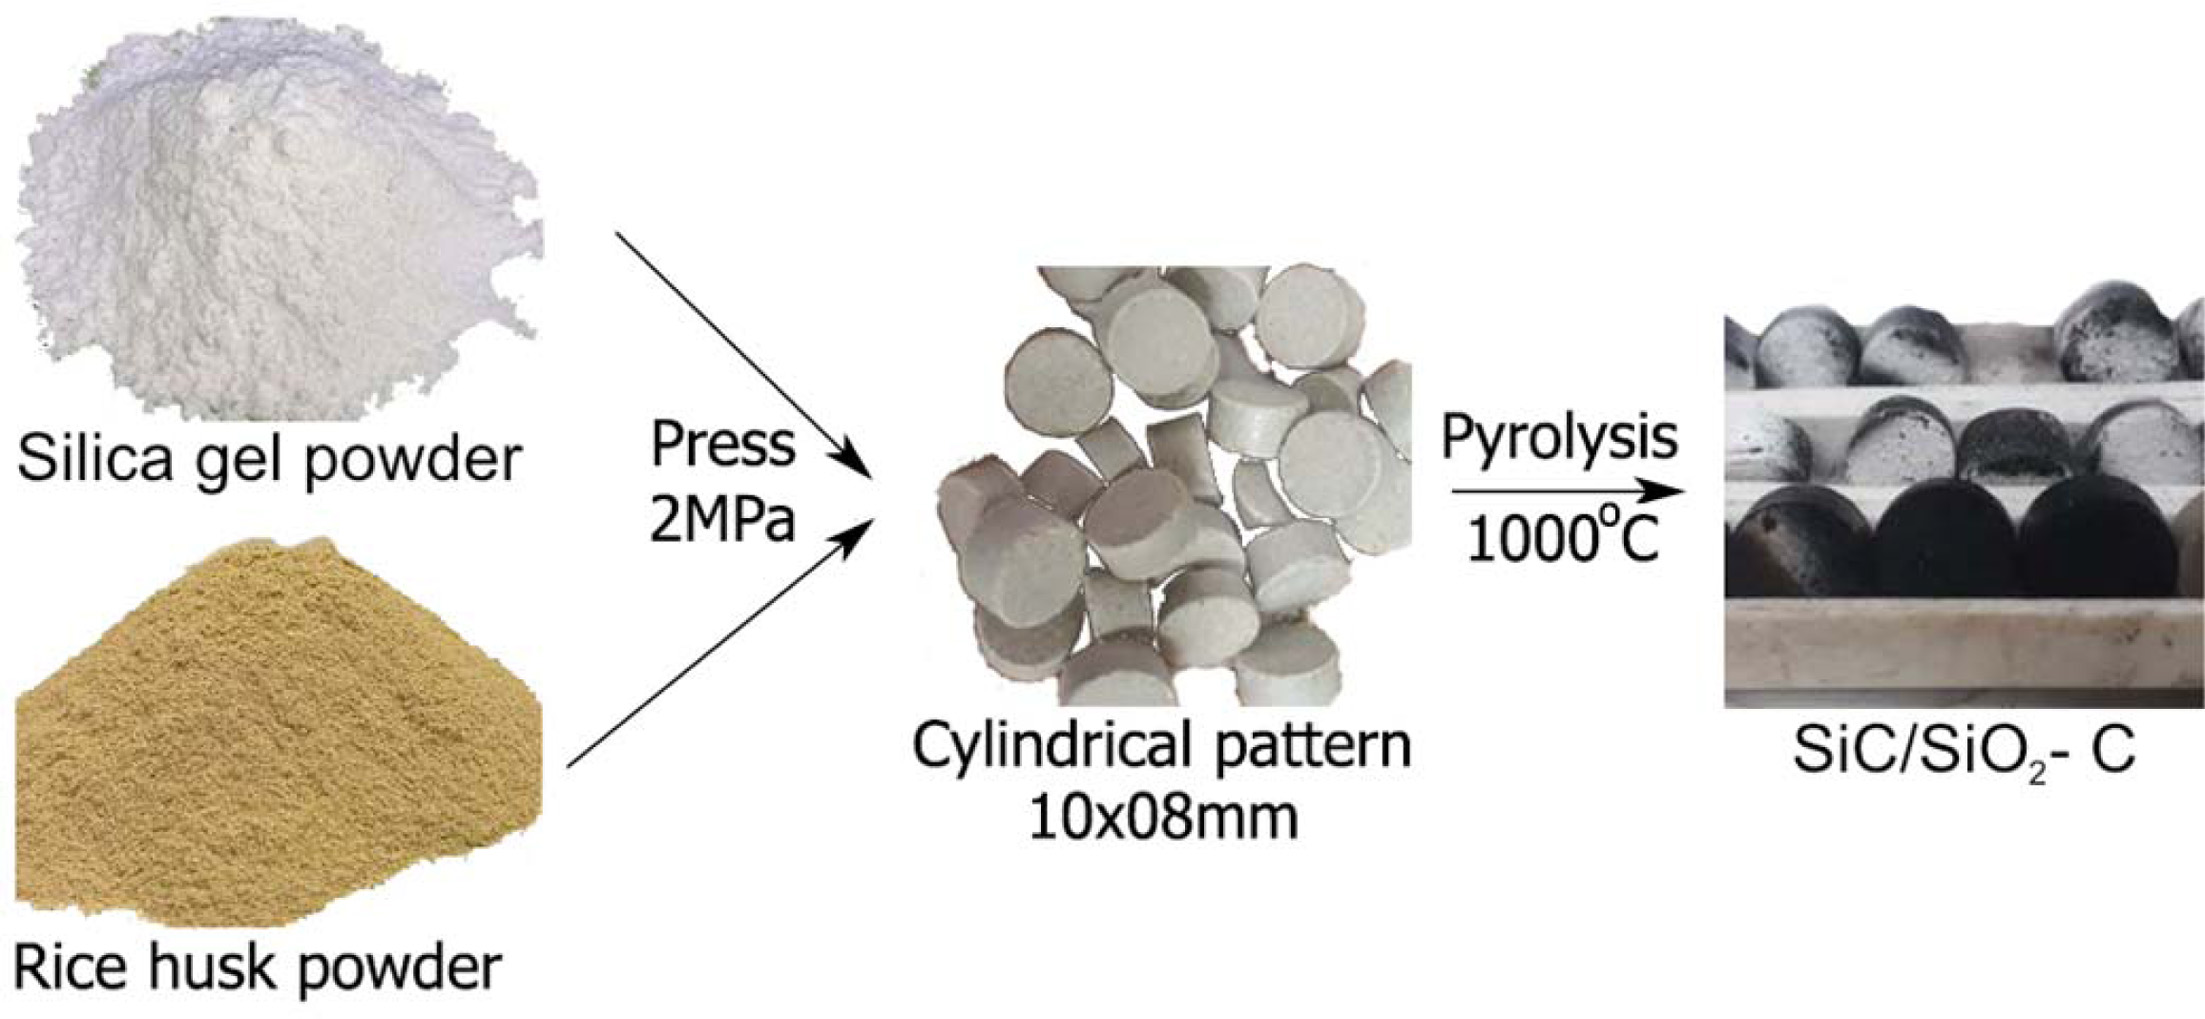
The raw material of rice husk was taken from Long An province, Vietnam. Silica gel was synthesized from rice husk according to research by Van Hai Le et al. [24]. Rice husk and silica gel materials were milled into powder (Fig. 1). The medium particle size of rice husk and silica gel were analyzed by laser diffraction method of 73.68 µm and 14.92 µm. The chemical composition of rice husk and silica gel materials determined by the X-ray Fluorescence method (XRF) were presented in Table 1. La-920 – Horiba and Arl Advant’x – Thermo were models used for particle size and chemical composition analysis.
Rice husk and silica gel powder were mixed together according to the weight ratios as shown in Table 2. The mixed mixture was pressed into cylindrical pellets with a 10´08 mm dimension at the pressure of 2 MPa. Pellets were pyrolyzed in a CO2 environment at 1000 oC for 60 min. A diagram of the prototyping process is shown in Fig. 1.
The SiC, SiO2, and free C components of the composite were analyzed by ISO 21068-2:2008 standards. The total carbon was determined by combustion with oxygen and tin powder in a tube furnace at 1050 oC to convert the carbon to carbon dioxide by combustion. The free carbon of the composites was oxidized to carbon dioxide by chromic sulfuric iodic acid at a temperature of 130 oC to 140 oC. The carbon dioxide in case of determination of total carbon or free carbon was absorbed in a sodium hydroxide solution. Total carbon and free carbon were calculated using the formula (1-2). The SiC content was calculated from total carbon and free carbon according to the formula (3). The component of SiO2 was dissolved by acid hydrofluoric and determined on the chemical reaction equation (4-5).
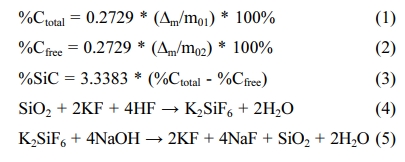
Where %Ctotal is component of total carbon (%); %Cfree is component of free carbon (%); %SiC is component of SiC (%); ∆m is the mass of sodium hydroxide solution increased in case of determination of total carbon or free carbon (g); m01 is the initial mass of the composite sample when determining total carbon (g); m02 is the initial mass of the composite sample when determining free carbon (g); 0.2729 is a factor for converting carbon dioxide to carbon; 3.3383 is a stoichiometric factor used for converting carbon to silicon carbide.
Functional groups of composite samples were analyzed by FTIR. The used FTIR model was Nicolet 6700 – Thermo Scientific with scanning range from 450 to 4000 cm-1 and scanning step of 0.96425. The analyzed sample was powder. The used binder was KBr. The phase compositions of samples were determined by XRD with D8 Advance – Bruker model. Sample analysis condition was Cu Kα radiation (λ = 0.154 nm), powder samples, scanning 2θ degree from 10 to 65, scanning step of 0.019. 2D microstructure image was observed by SEM and element distribution was analyzed by EDX mapping with S-4800 - Hitachi model and integrated Genesis 4000 EDX module. Sample analysis condition was the voltage of 10 kV, low electronic mode SE (U).
|
Fig. 1 A diagram of the prototyping process |
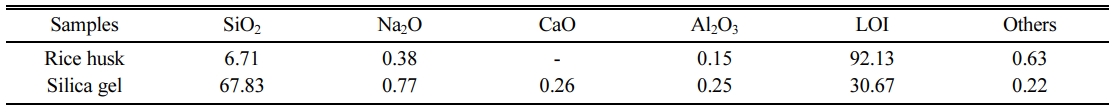
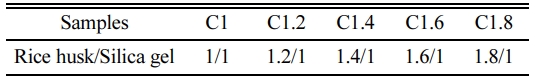
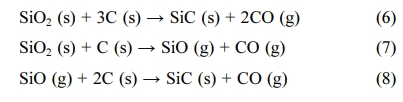
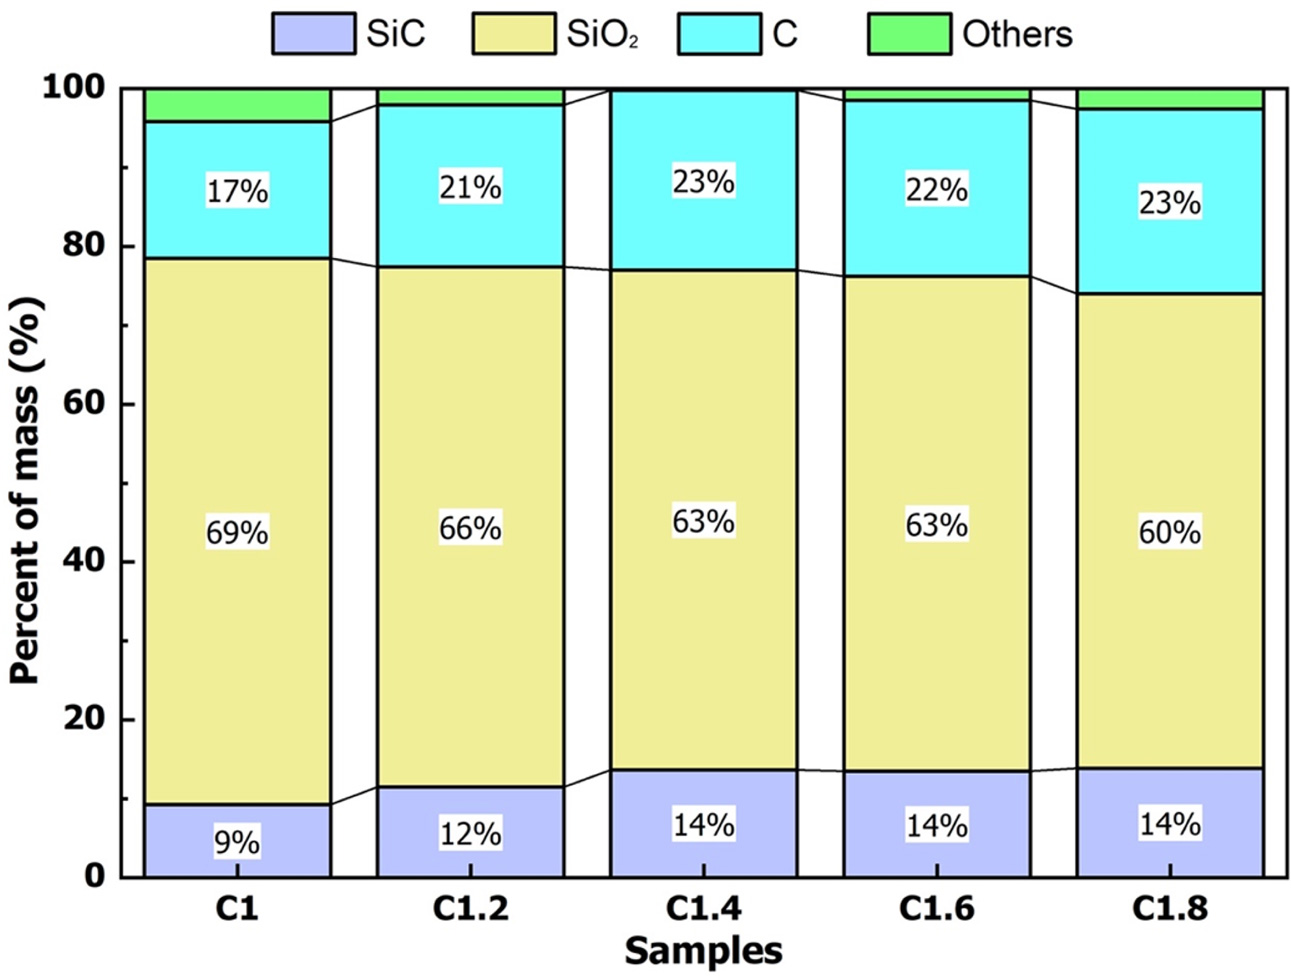
Fig. 2 shows the composition of SiC, free SiO2, and free C in the samples after heating at 1000 oC for 60 min in a CO2 environment. For studies using SiO2 and C as raw materials, SiC is usually formed at 1800 - 1900 oC [25]. The chemical reaction for the synthetic of SiC from SiO2 and C can be described in the chemical reaction eq. (6) [26]. When the raw material is rice husk, SiC can form at a lower temperature. At high temperatures, the husk decomposes to create C, SiO2. These are activated C and activated SiO2 so they can react to form SiC at lower than 1800 oC. The reaction to form SiC from rice husk was presented by Bechtold et al. (chemical eq. (7-8)) [27].
In this study, the raw materials used to form SiC were rice husk and silica gel. SiC was formed at the reaction temperature of 1000 oC. In this case, the reaction between C and SiO2 to create SiC was a solid-phase reaction, so the product after the reaction at 1000 oC also had the appearance of additional free C and SiO2. Therefore, the resulting product was SiC/SiO2-C composite. This composite had a low SiC content, so it is suitable for manufacturing wear-resistant materials such as aircraft brakes, car brakes, reinforcement materials, etc.
The results of the chemical composition of the samples showed that the SiC content increased, the free C content increased, and the free SiO2 decreased when the rice husk ratio increased. SiC content increased from sample C1 to C1.4. If the ratio of rice husk/silica gel increased more than 1.4/1, the SiC content was almost unchanged. Therefore, the composition of the mixture with the ratio of rice husk/silica gel of 1.4/1 (sample C1.4) was the optimal ingredient to form SiC/SiO2-C composite at 1000 oC in the atmosphere of CO2.
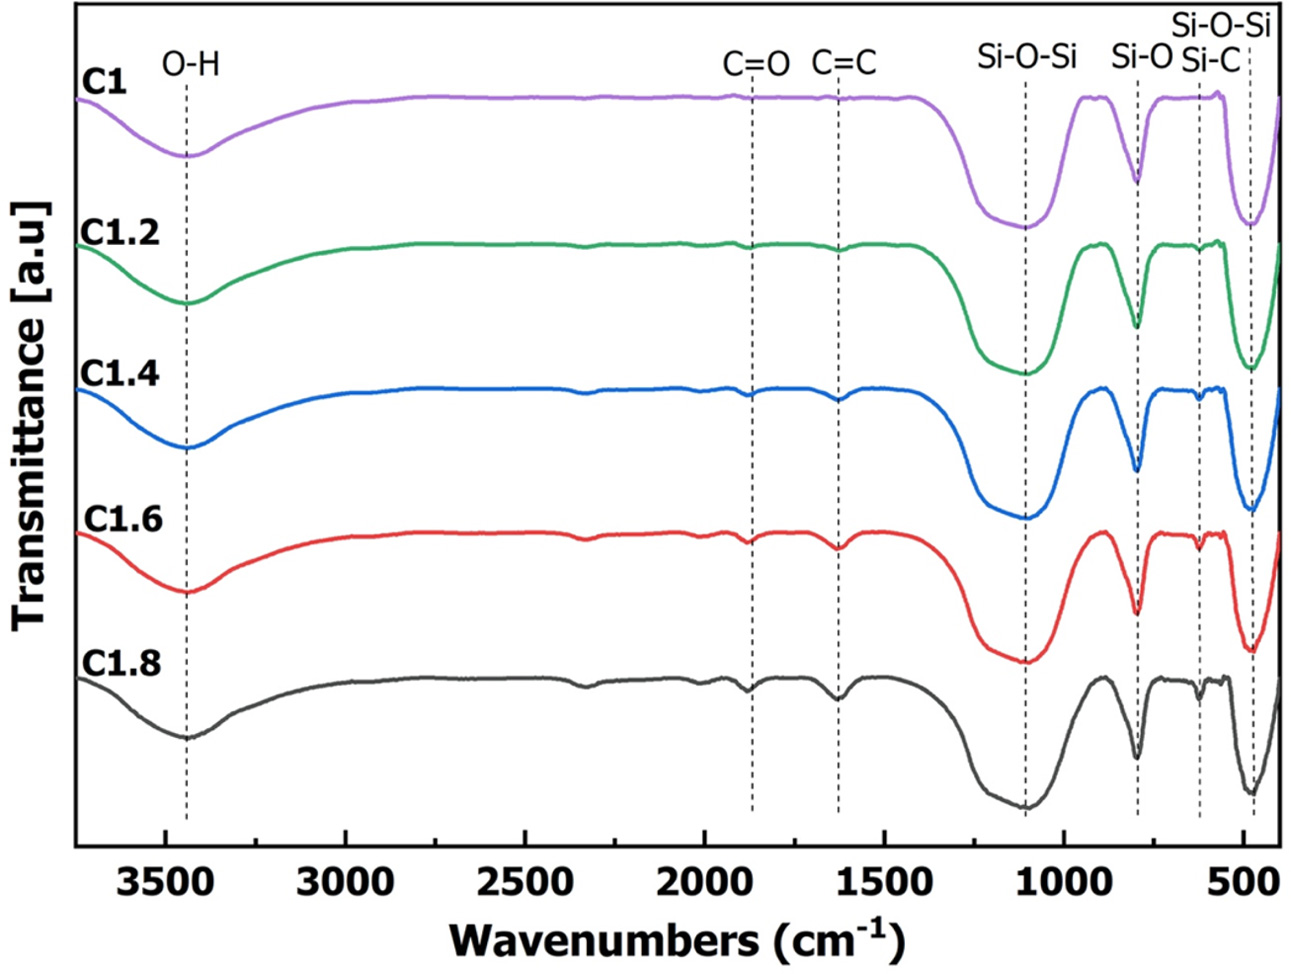
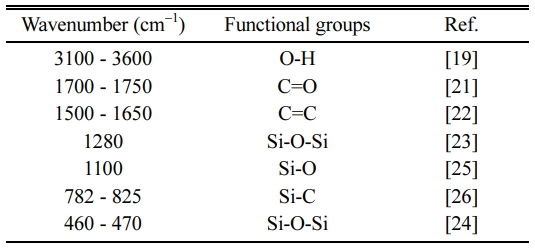
SiC, SiO2, C in the pyrolysis pellets can also be determined by analyzing the function groups by the FTIR method. Fig. 3 shows the results of the analysis of the FTIR spectrum of the samples after calcination at different mixtures. Table 3 shows the composition of functional groups in the sample after pyrolysis. FTIR analysis results of the samples were similar in different ingredients. The vibration at 3100-3600 cm-1 characterized the functional group -OH of the physical water [28, 29]. The vibration at the 1700-1750 cm-1 characterized the C = O bond and the vibration at 1500-1650 cm-1 characterized the C = C bond of free carbon [30, 31]. The vibration at the position of 1280 cm-1, 1100 cm-1, 460-470 cm-1 characterised Si-O-Si bond, Si-O bond of the free SiO2 [32-35]. The vibration at the position 782-825 cm-1 characterized the Si-C bond of the SiC [35]. The results once again demonstrated that all of the samples were formed to SiC, SiO2, and C.
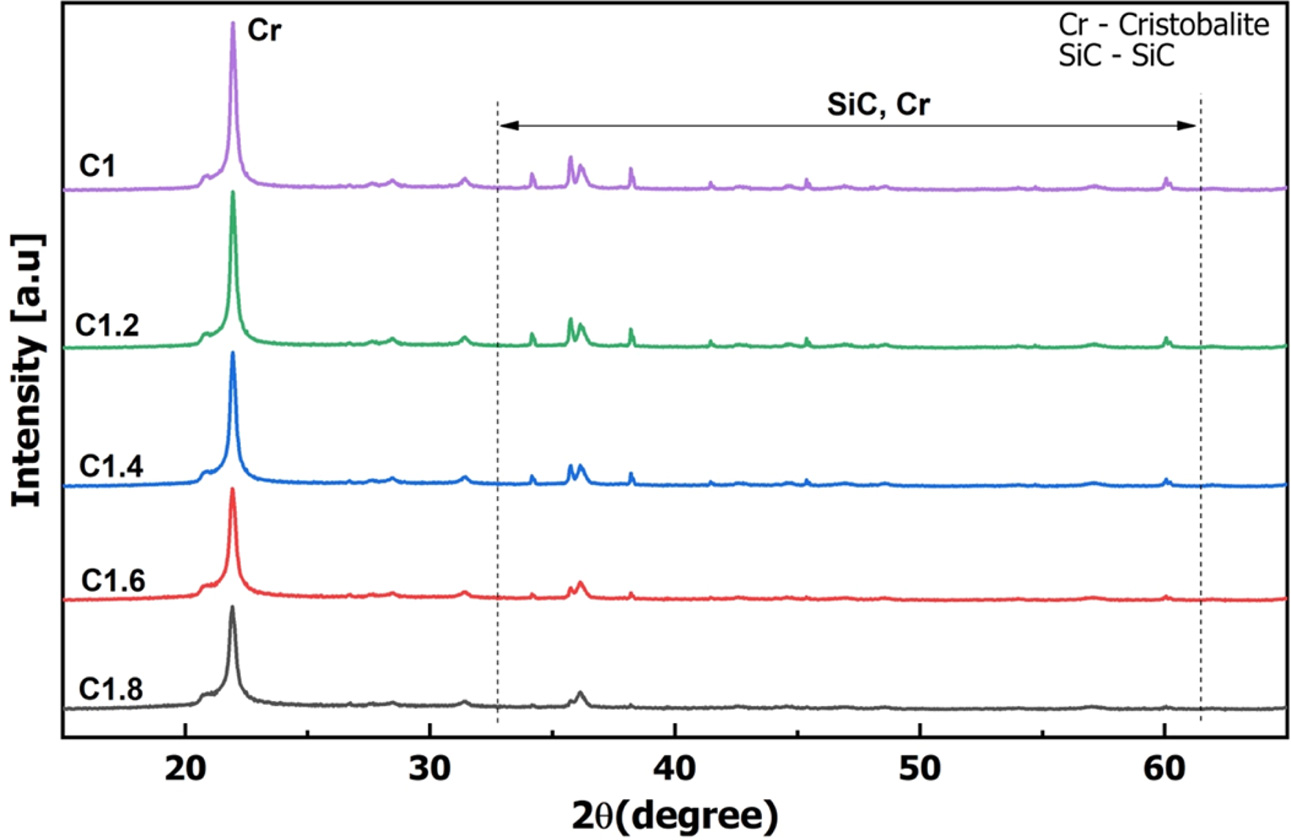
Fig. 4 is the results of the XRD analysis of samples from C1 to C1.8. Results showed that all samples appeared characteristic peak of cristobalite at position 2θ of 21.8o [36]. At high temperature, rice husk and silica gel will be pyrolyzed to form amorphous SiO2 [37]. Then, one part of the amorphous SiO2 will react with C to form SiC, another part will transform the crystal morphology. In theory, the morphology of SiO2 at 1000 oC would be tridymite [38]. However, the husk and silica gel contain other oxides such as Na2O, CaO (Table 1). Sodium-ion (Na+) and calcium-ion (Ca2+) are effective mineralizers used in forming cristobalite [39]. Therefore, the polymorphic form of SiO2 at 1000 oC was cristobalite [40].
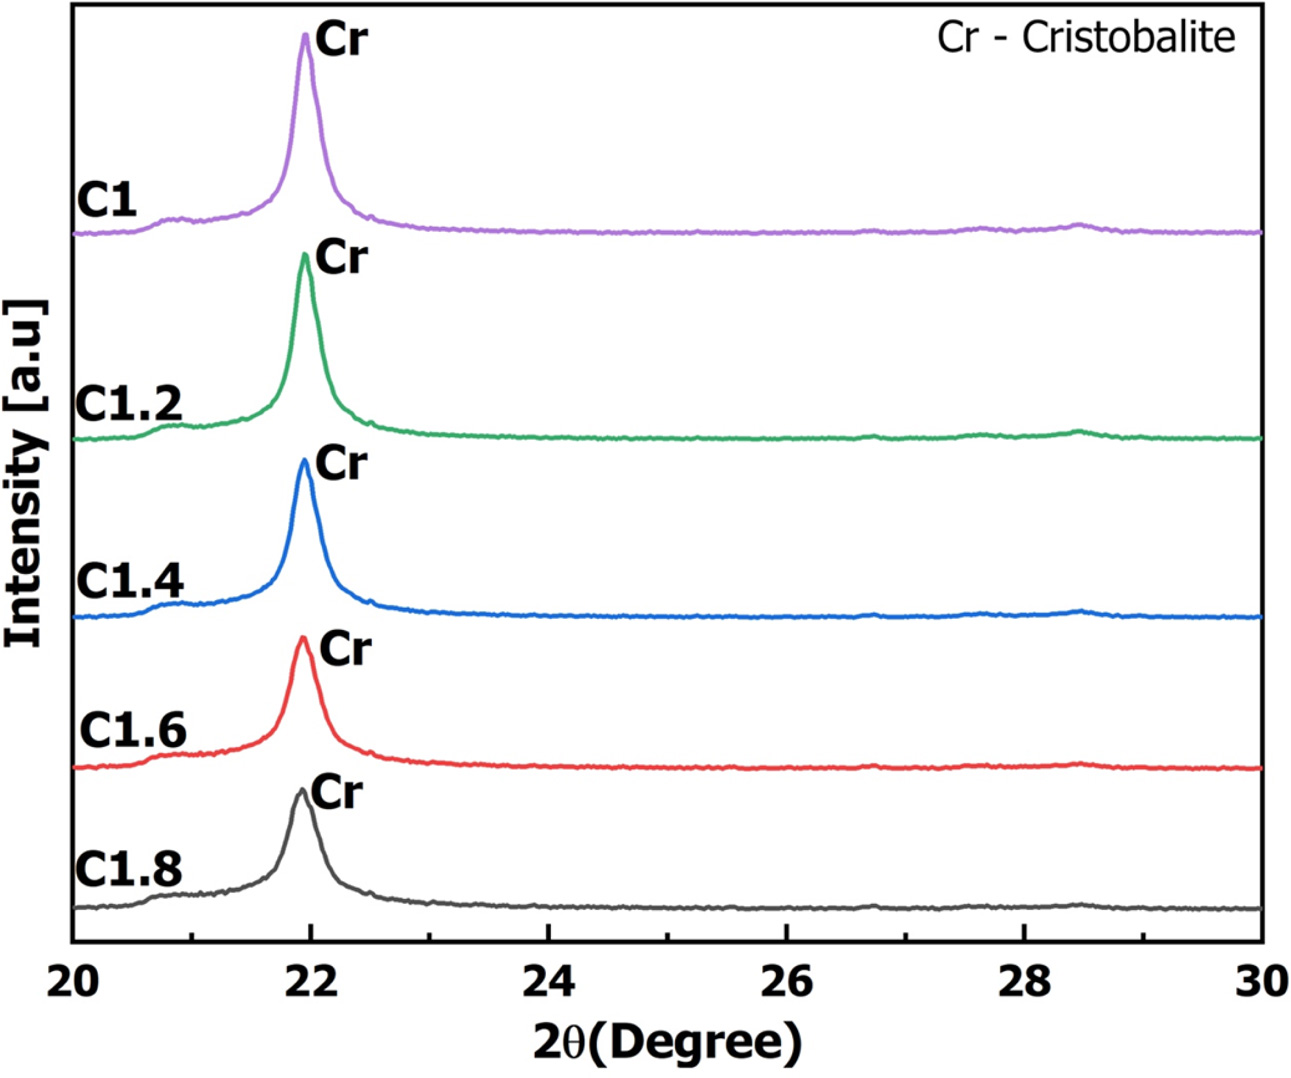
In addition to the characteristic peak of cristobalite at position 21.8o, the XRD spectrum of the samples also appeared other peaks. However, because the peak of cristobalite at 21.8o had high intensity, the XRD spectrum could not clearly show the remaining peaks. To analyze the composition of the formed phase, the XRD spectrums in Fig. 4 were separated into two component spectrums including XRD spectrum with a scanning angle from 20 to 30o (Fig. 5) and XRD spectrum with a scanning angle from 32 to 62o (Fig. 6).
Fig. 5 is the results of the XRD spectral separation of samples C1 - C1.8 at the 2θ angle from 20 to 30o. When pyrolysis of biomass materials in a reducing environment, a pyrolysis reaction will occur. The pyrolysis reaction will create COx, NOx, SOx gases out of the sample [41]. After the gas generation process, amorphous carbon will remain in the sample. On the XRD spectrum, the amorphous carbon exhibits a wide diffraction range from 5 to 30o [41]. If the temperature continues to rise, amorphous carbon will continue to rearrange its structure to form carbon graphite. When crystals of graphite are formed, the XRD spectrum will show the diffraction peak at position 2θ of 26.5o corresponding to the peak (002) of carbon graphite [42, 43]. In addition to the characteristic peak of cristobalite at 21.8o, XRD spectroscopy results in Fig. 5 showed that all samples appeared diffraction regions from 20.5 to 23o, no diffraction peak appeared at the position of 26.5o. Therefore, the formed carbon in all composite samples was amorphous carbon. The area of the amorphous carbon region increased gradually from C1 to C1.8. This result showed when increasing rice husk in the raw mixture would increase the C content in SiC/SiO2-C composite.
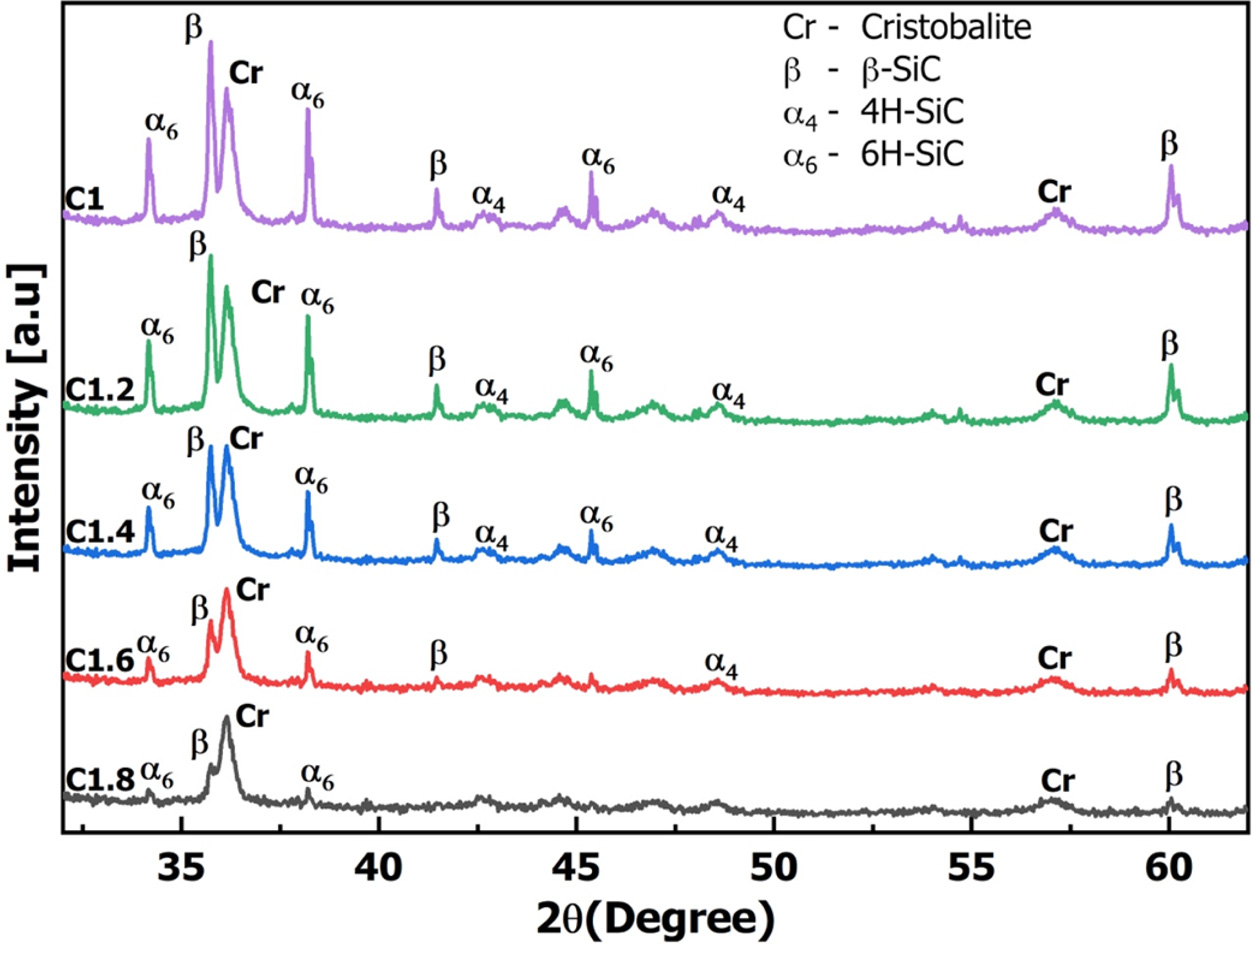
Fig. 6 is the results of XRD spectroscopy of composite samples at a scanning angle of 2θ from 32 to 62o. The results of the XRD spectrum in Fig. 6 appeared the characteristic peaks for cristobalite at 36o, 58o [42]. In addition, spectroscopy also appeared different phenotypes of SiC such as low-temperature polymorph β-SiC at diffraction positions of 35.6o, 41.6o, 60o [44, 45], high-temperature polymorph α- SiC (including 6H-SiC at diffraction positions of 34.1o, 38o, 45.3o [46, 47] and 4H-SiC at diffraction positions of 43.3o, 49o [46]). SiC minerals are usually formed from a carbothermic reaction at temperatures above 1500 oC with β-SiC and 2200 oC with α- SiC [48]. In this study, when rice husk and silica gel were pyrolyzed at 1000 oC in a CO2 environment, amorphous C and amorphous SiO2 would be formed. After that C reacted with SiO2 to create SiC. The formed SiC not only appeared β-SiC polymorph but also appeared α- SiC (6H-SiC, 4H-SiC) polymorph. α- SiC and β-SiC minerals were formed to help increase the wear-resistance properties of SiC/SiO2-C composite.
XRD spectroscopy analysis results of composite samples from C1 to C1.8 showed that peaks of cristo- balite, α- SiC, β-SiC decreased intensity, amorphous carbon increased gradually when rice husk content increased. XRD spectra of C1.6 and C1.8 samples no longer appeared clearly peaks of α- SiC, β-SiC. Therefore, from the analysis of the chemical composition, FTIR, and XRD showed that C1.4 sample (rice husk/silica gel ratio of 1.4/1) was the optimal ingredient to form SiC/SiO2-C composite at 1000 oC for 60 min in a CO2 atmosphere. The C1.4 sample after pyrolyzed was also analyzed microstructure form and elemental distribution by SEM/EDX method.
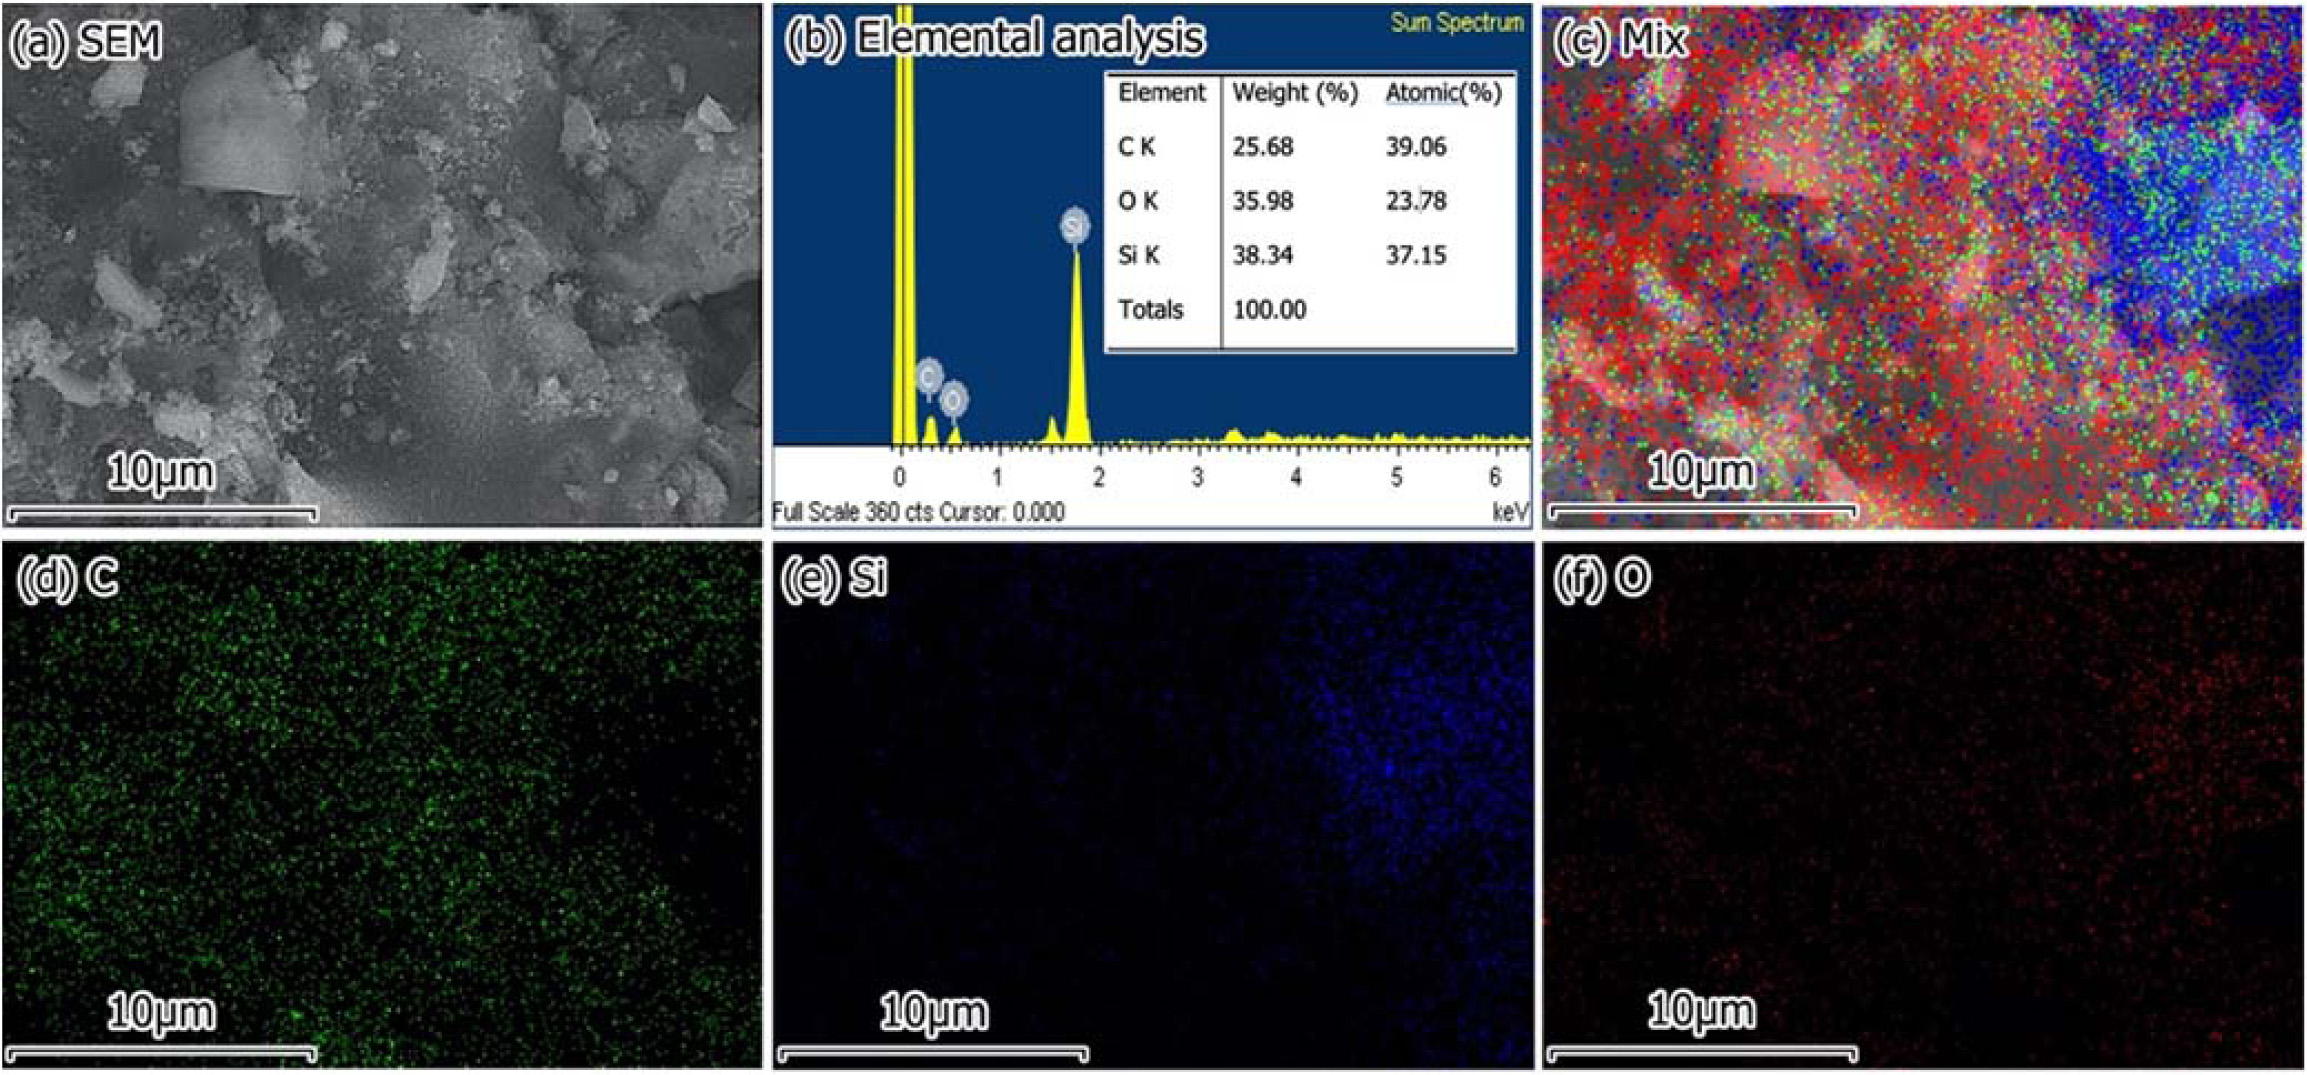
Fig. 7(a) showed a 2D image by using a scanning electron microscope (SEM). Fig. 7(b) showed the result of chemical composition analysis of C1.4 sample. Chemical composition analysis showed that C1.4 sample had elements such as C, O, Si. These elements formed SiC, SiO2, and C in the composite. Fig. 7(c)-7(f) showed the distribution of elements on the analytical surface of C1.4 sample after pyrolysis. The elemental distribution of C, Si, O confirmed that SiC, SiO2, C were evenly distributed on the surface of the SiC/SiO2-C composite.
|
Fig. 2 Chemical composition of samples. |
|
Fig. 3 Fourier transform infrared (FTIR) spectroscopy analysis of samples. |
|
Fig. 4 Results of X-Ray diffraction (XRD) analysis of samples. |
|
Fig. 5 Results of X-Ray diffraction (XRD) analysis with 2theta degree from 20 – 30o. |
|
Fig. 6 Results of X-Ray diffraction (XRD) analysis with 2theta degree from 32 – 62o. |
|
Fig. 7 (a) SEM image; (b) elemental analysis; EDX mapping of (c) mixture of chemical, (d) C, (e) Si, and (f) O elements of C1.4. |
From the results of this study such as the chemical, composition the functional groups, the phase composition, the elemental distribution of samples after being pyrolyzed, we conclude that SiC/SiO2-C composite has been created from rice husk and silica gel. By changing the rice husk/silica gel ratio components, the husk/silica gel of 1.4/1 (C1.4 sample) was optimal for composite synthesis at 1000 oC for 60 min in the CO2 atmosphere. By the method of chemical analysis according to ISO 21068-2:2008 standards, the chemical composition of 1.4 sample was 14% SiC, 63% SiO2, and 23% free C (%wt.). By FTIR and XRD analysis, the phase composition of C1.4 sample was amorphous carbon, β-SiC, α- SiC, and cristobalite. Analysis results SEM/EDX demonstrated that SiC, SiO2, C were evenly distributed over the surface of C1.4 sample. Composite SiC/SiO2-C can completely be used to fabricate wear-resistant parts
This research is funded by Ho Chi Minh City University of Technology (HCMUT) – VNU – HCM under grant number T-CNVL-2020-08. We acknowledge the support of time and facilities from Ho Chi Minh City University of Technology (HCMUT) – VNU – HCM for this study.
- 1. R. Yuvakkumar, V. Elango, V. Rajendran, and N. Kannan, J. Exp. Nanosci. 9[3] (2014) 272-281.
-

- 2. A.U. Rehman, J.B. Lee, A. Qudoos, S.H. Jakhrani, H.G. Kim, and J.S. Ryou, J. Ceram. Process. Res. 20[3] (2019) 270-275.
- 3. A. Yazdani, H.R. Rezaie, H. Ghassai, and M. Mahmoudian, J. Ceram. Process. Res. 14[1] (2013) 12-16.
- 4. A. Yazdani, H.R. Rezaie, and H. Ghassai, J. Ceram. Process. Res. 11[3] (2010) 348-353.
- 5. J. Zhang, L.M. Postovit, D. Wang, R. Gardiner, R. Harris, M. abdul, and A. A. Thomas, , Nanoscale Res. Lett. 4[11] (2009) 1297-1302.
-
- 6. S. P. B. de Lima, R. P. de Vasconcelos, O. A. Paiva, G. C. Cordeiro, M. R. de Morais Chaves, R. D. Toledo Filho, and E. de Moraes Rego Fairbairn, Quim. Nova 34[1] (2011) 71-75.
-
- 7. H. Moayedi, B. Aghel, M.A.M. Abdullahi, H. Nguyen, and A.S.A Rashid, J. Clean. Prod. 237 (2019) 117851.
-
- 8. A. A. M. Fazli, S. K. Zakaria, N. I. N. A. Rahman, S. Z. Salleh, A. H. Yusoff, N. A. Salleh, M. A. A. Tailb, F. Budiman, A. Ali, and P. T. Teo, J. Ceram. Process. 21[6] (2020) 667-682.
- 9. S. Cui, S. Yu, B. Lin, X. Shen, and D. Gu, RSC Adv. 5[81] (2015) 65818-65826.
-
- 10. Y.K. Akimov, Instrum. Exp. Tech. 46[3] (2003) 287-299.
-
- 11. S. Sultana, M.M. Rahman, Z. Yeasmin, S. Ahmed, and F.K. Rony, J. Ceram. Process. Res. 21[3] (2020) 285-295.
-
- 12. W. Weng, S. Wang, W. Xiao, and X.W.D. Lou, Adv. Mater. 32[29] (2020) 2001560.
-
- 13. N.S. Ghafoorian, A.R. Bahramian, and M.M. Seraji, Mater. Design 86 (2015) 279-288.
-
- 14. T. Chanadee, J. Ceram. Process. Res. 18[5] (2017) 389-393.
- 15. F. Christin, Adv. Eng. Mater. 4[12] (2002) 903-912.
-
- 16. W. Krenkel and F. Berndt, Mat. Sci. Eng. A-Struct. 412[1-2] (2005) 177-181.
-
- 17. W. Krenkel, B. Heidenreich, and R. Renz, Adv. Eng. Mater. 4[7] (2002) 427-436.
-
- 18. Z. Li, P. Xiao, B.G. Zhang, Y. Li, Y.H. Lu, and S.H. Zhu, Int. J. Appl. Ceram. Technol. 13[3] (2016) 423-433.
-
- 19. H. Hocheng, N.H. Tai, and C.S. Liu, Compos. Part A-Appl. Sci. Manufac.. 31[2] (2000) 133-142.
-
- 20. J.H. Choi, S. Kim, S.H. Kim, I.S. Han, Y.H. Seong, and H.J. Bang, J. Ceram. Process. Res. 20[1] (2019) 48-53.
- 21. Y. Zhang, L. Zhang, L. Cheng, H. Mei, Q. Ke, and Y. Xu, J. Ceram. Process. Res. 10[3] (2009) 248-256.
- 22. R.V. Krishnarao, Y.R. Mahajan, and T.J. Kumar, J. Eur. Ceram. Soc. 18[2] (1998) 147-152.
-
- 23. R. Dhiman, E. Johnson, and P.J.C.I. Morgen, Ceram. Int. 37[8] (2011) 3759-3764.
-
- 24. V.H. Le, C.N.H. Thuc, and H.H. Thuc, Nanoscale Res. Lett. 8[1] (2013) 58-68.
-
- 25. G.N. Yushin, Z.G. Cambaz, Y. Gogotsi, K.L. Vyshnyakova, and L.N. Pereselentseva, J. Am. Ceram. Soc. 91[1] (2007) 83-87.
-
- 26. J.J. Biernacki and G.P. Wotzak, J. Am. Ceram. Soc. 72[1] (1989) 122-129.
-
- 27. F.K.V. Dijen and R. Metselaar, J. Eur. Ceram. Soc. 7[3] (1991) 177-184.
-
- 28. T. Holopainen, L. Alvila, J. Rainio, and T. Pakkanen, J. Appl. Polym. Sci. 69[11] (1998) 2175-2185.
- 29. A.A. Taha and S.A.A. Ghani, J. Dispersion Sci. Technol. 37[2] (2016) 173-182
-
- 30. J. Huang, M. Xu, Q. Ge, M. Lin, Q. Lin, Y. Chen, J. Chu, L. Dai, and Y. Zou, J. Appl. Polym. Sci. 97[2] (2005) 652-658.
-
- 31. J. Cheriaa, M. Khaireddine, M. Rouabhia, and A. Bakhrouf, Sci. World J. 2012 (2012) 512454.
-
- 32. V. Martínez, M.F. Valencia, J. Cruz, J.M. Mejía, and F. Chejne, Ceram. Int. 32[8] (2006) 891-897.
-
- 33. J. Bange, L. Patil, and D.K.Gautam, Prog. Electromagn. Res. M 3 (2008) 165-175.
-
- 34. R. Dong, L. Wang, J. Zhu, L. Liu, and Y. Qian, Appl. Phys. A: Mater. Sci. Process. 125[8] (2019) 551.
-
- 35. K. Sujirote and P. Leangsuwan, J. Mater. Sci. 38[23] (2003) 4739-4744.
-
- 36. Y. Shinohara and N. Kohyama, Ind. Health 42[2] (2004) 277-285.
-
- 37. R.A. Bakar, R. Yahya, and S.N. Gan, Procedia Chem. 19 (2016) 189-195
-
- 38. D.M. Ibrahim and M. Helmy, Thermochim. Acta 45[1] (1981) 79-85.
-
- 39. N.C. Chen, W.H. Wu, Z. Li, and A.P. Deng, Mater. Sci. Forum 686 (2011) 692-695.
-
- 40. I. Markovska and L. Lyubchev, J. Therm. Anal. Calorim. 89[3] (2007) 809-814.
-
- 41. S. Somiya, in “Handbook of Advanced Ceramics: Materials, Applications, Processing, and Properties (Academic Press: Elsevier, 2013).
- 42. M.A. Azmi, N.A.A. Ismail, M. Rizamarhaiza, W.M. Hasif. A.A.K., and H. Taib, in Proceedings of the AIP Conf. Proc. 1756 (2016) 020005.
-
- 43. M. Salvatore, G. Carotenuto, S.D. Nicola, C. Camerlingo, V. Ambrogi, and C. Carfagna, Nanoscale Res. Lett. 12 (2017) 167.
-
- 44. V.V. Pujar and J.D. Cawley, J. Am. Ceram. Soc. 78[3] (1995) 774-782.
-
- 45. S. Henke, B. Stritzker, and B. Rauschenbach, J. Appl. Phys. 78[3] (1995) 2070-2073.
-
- 46. A.L. Ortiz, F.S. Bajo, F.L. Cumbrera, and F. Guiberteau, Mater. Lett. 49[2] (2001) 137-145.
-
- 47. J. Aguilar, J. Rodríguez, and M. Hinojosa, J. Microw. Power Electromagn. Energ. 36[3] (2001) 169-177.
-
- 48. B.V.R. Bhat and G.P. Sanghi, Bull. Mater. Sci. 9[4] (1987) 295-303.
-
 This Article
-
2021; 22(2): 246-251
Published on Apr 30, 2021
- 10.36410/jcpr.2021.22.2.246
- Received on Dec 20, 2020
- Revised on Feb 11, 2021
- Accepted on Mar 2, 2021
Services
- Abstract
introduction
experimental
results and discussion
conclusions
- Acknowledgements
- References
- Full Text PDF
Shared
Correspondence to
- Kieu Do Trung Kien
-
aFaculty of Materials Technology, Ho Chi Minh City University of Technology, 268 Ly Thuong Kiet street, Ward 14, District 10, Ho Chi Minh City, Vietnam
bVietnam National University Ho Chi Minh City, Linh Trung Ward, Thu Duc District, Ho Chi Minh City, Vietnam
Tel : +(84.8) 8 661 320 Fax: +(84.8) 8 661 843 - E-mail: kieudotrungkien@hcmut.edu.vn
Clean-Energy Research Institute(CRI), Hanyang University, 222, Wangsimni-ro, Seongdong-gu, Seoul, 04763, Korea
E-mail: jcpr@hanyang.ac.kr