


- A novel inverse opal zirconia pigment with controllable color saturation
Li-li Wang*, Xin-xin Liu, Xiao-peng Li, Xiu-feng Wang, Li-na Feng and Xu-ri Hou
School of Materials Science and Engineering, Shaanxi Key Laboratory of Green Preparation and Functionalization for Inorganic Materials, Shaanxi University of Science and Technology, Xi’an 710021, China
This article is an open access article distributed under the terms of the Creative Commons Attribution Non-Commercial License (http://creativecommons.org/licenses/by-nc/4.0) which permits unrestricted non-commercial use, distribution, and reproduction in any medium, provided the original work is properly cited.
The inverse opal zirconia pigments were prepared by template method using polystyrene microspheres with the size of 340 ± 10 nm as raw material and the in situ carbon was formed to achieve controllable and adjustable color saturation by sintering at various temperatures in nitrogen atmosphere with various nitrogen flow rates. The effects of nitrogen atmosphere, nitrogen flow rate and sintering temperature on the morphology, phase and color saturation of the inverse opal zirconia were investigated. The results showed that when the inverse opal zirconia was sintered at 450 oC to 600 oC in nitrogen atmosphere, the green color saturation could be adjusted by changing the nitrogen flow rate from 0.2 L/min to 0.8 L/min. When the nitrogen rate was 0.8L/min, the green color saturation of the inverse opal zirconia could be adjusted by changing the sintering temperature from 450 oC to 600 oC. It indicated that the more the amount of in-situ carbon was generated, the more stray light was absorbed and the higher green color saturation of the inverse opal zirconia could be obtained. Further increasing the sintering temperature to 700 oC would destroy the inverse opal morphology of zirconia and affect the carbonization of the organic component
Keywords: inverse opal, color saturation, carbonization, zirconia, controlled
In nature, color divided into structure color and pigment color, which are closely related to light [1]. Structure color originates from interference, diffraction or scattering of visible light on the photonic crystal, which results from the well-ordered arrangement of a periodic microstructure [2,3]. The photonic crystal is a kind of optical material composed of materials with different refractive indexes in an orderly alternating arrangement in three-dimensional space. Based on the characteristics of the photonic bandgap, optical materials can control the transmission of light [4, 5]. If the photonic bandgap falls into the visible light range between 380 and 780 nm, visible light of specific wavelengths not allowed to propagate in the photonic crystal structure, thus selectively reflected [6, 7]. Then the structural colors with high brightness, less discoloration, and the iridescent effect would be produced on the surface of periodic photonic crystals [8]. It is precisely these excellent characteristics that the structural color has attracted people's attention as a unique application in anti-counterfeiting, advertising, and military fields [9, 10].
In recent years, inverse opal photonic crystal materials have formed three-dimensional periodic pore arrays in the matrix of some functional materials due to its unique structural characteristics [11]. It reported that inverse opal materials include metal oxides [12-14] such as ZrO2, CeO2, TiO2 [15, 16], which has been widely concerned in structural color. F Liu [17] prepared Fe3+-doped inverse opal SnO2 samples with high color saturation by the direct template method. Fe3+ absorbed most of the scattered light and improved the refractive index of the sample to highlight the bandgap color. Liu [18] prepared the PDMS/SnO2 inverse opal material by the direct template method, which increased the refractive index of the sample and reduced its angular dependence, thus increasing the color saturation.
Sufficient refractive index contrast is the precondition to obtain high color saturation, and the air with the lowest refractive index plays an essential role [19]. High refractive index materials are conducive to the construction of photonic crystals with high refractive index differences and the realization of color photonic crystals with high saturation structure. Zirconia is a significant metallic oxide that has applied in domestic ceramics, medical applications [20, 21]. The refractive index of zirconia is up to 2.17, so it can be used as a high refractive index material to construct an ideal structure color.
The study of inverse opal zirconia in the field of structural color and lay a solid foundation for the application of artificially prepared structural color. There had been many reports in the past on the application of inverse opal as structural color. D. Josephson [22] introduced exogenous carbon and added a sucrose solution to improve the color saturation of inverse opal zirconia. G. I. N. Waterhouse [23] successfully prepared ZrO2 inverse opal thin films with obviously color saturation at visible wavelengths.
To sum up, at present, the research on the color saturation of inverse opal zirconia has made certain progress, and the improvement of the color saturation is realized through the process improvement. However, the controllable color saturation of inverse opal zirconia has not been reported. Therefore, on the basis of the existing research on the inverse opal zirconia pigment, the color saturation of the inverse opal zirconia pigment would be controlled by adjusting the sintering temperature and nitrogen flow rate. The color saturation control mechanism of the inverse opal zirconia was studied also.
Polystyrene (PS) microspheres emulsion with the particle size of 340 ± 10 nm by emulsifier free emulsion polymerization was diluted to 5 wt% and dried at 40 oC in a crystal dish with a diameter of 60mm to prepare PS colloidal crystal template. Methanol and zirconium acetate were mixed at the mass ratio of 1:1 and stirred for 2 h on a magnetic mixer as the precursor of zirconia. About 1 g template was evenly coated on the quantitative filter paper and 15 g zirconia precursor was dropped. Then, immersed and extracted for about 5min, stood at room temperature for 24 h. A group of samples was sintered in nitrogen at 450 oC at a rate of 2 oC/min. The nitrogen flow rates were 0.2 L/min, 0.6 L/min and 0.8 L/min, respectively. The other group of samples was sintered at 450 oC, 600 oC and 700 oC with nitrogen flow rate of 0.8 L/min and heating rate of 2 oC/min, respectively. Then a group of samples was sintered in air by the above method and compared with the samples sintered in nitrogen.
The morphology of the inverse opal zirconia was characterized by scanning electron microscopy (S4800, Japan). The color saturation of the inverse opal zirconia was observed by a digital camera (Canon, Japan) and UV-visible near-infrared spectrometer (Beckman, America). Moreover, X-ray diffraction (D/max2200PC, Japan) was used to characterize the phase of the samples.
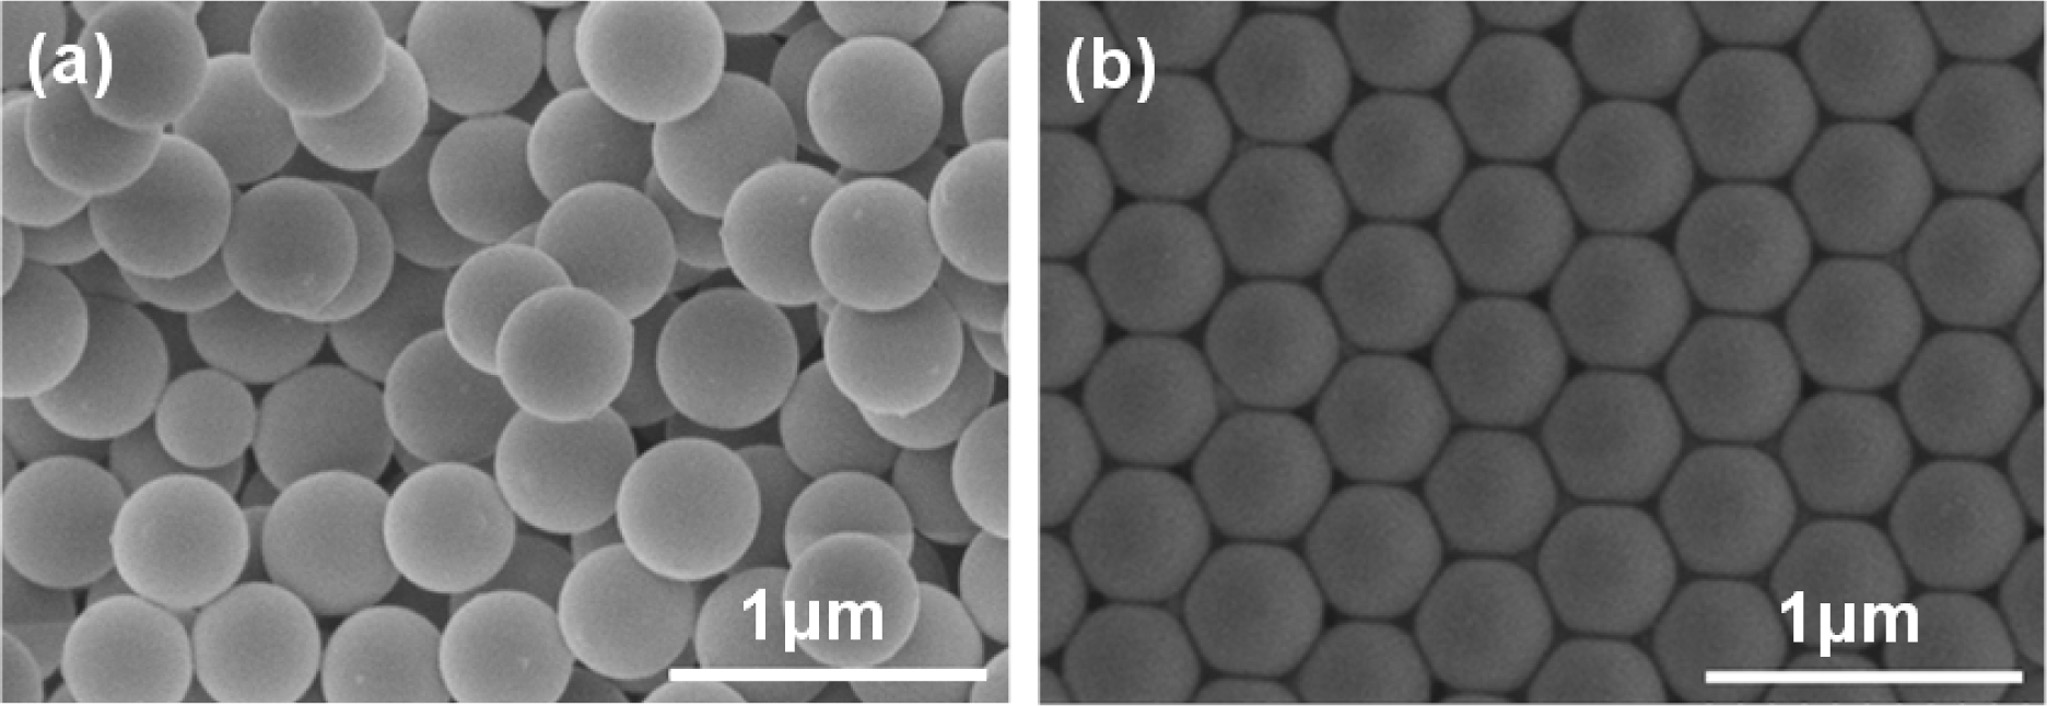
Fig. 1 shows the SEM images of PS microspheres and PS colloidal crystal templates. PS microspheres had regular spherical shape, good monodispersity and the crystal template was arranged periodically.
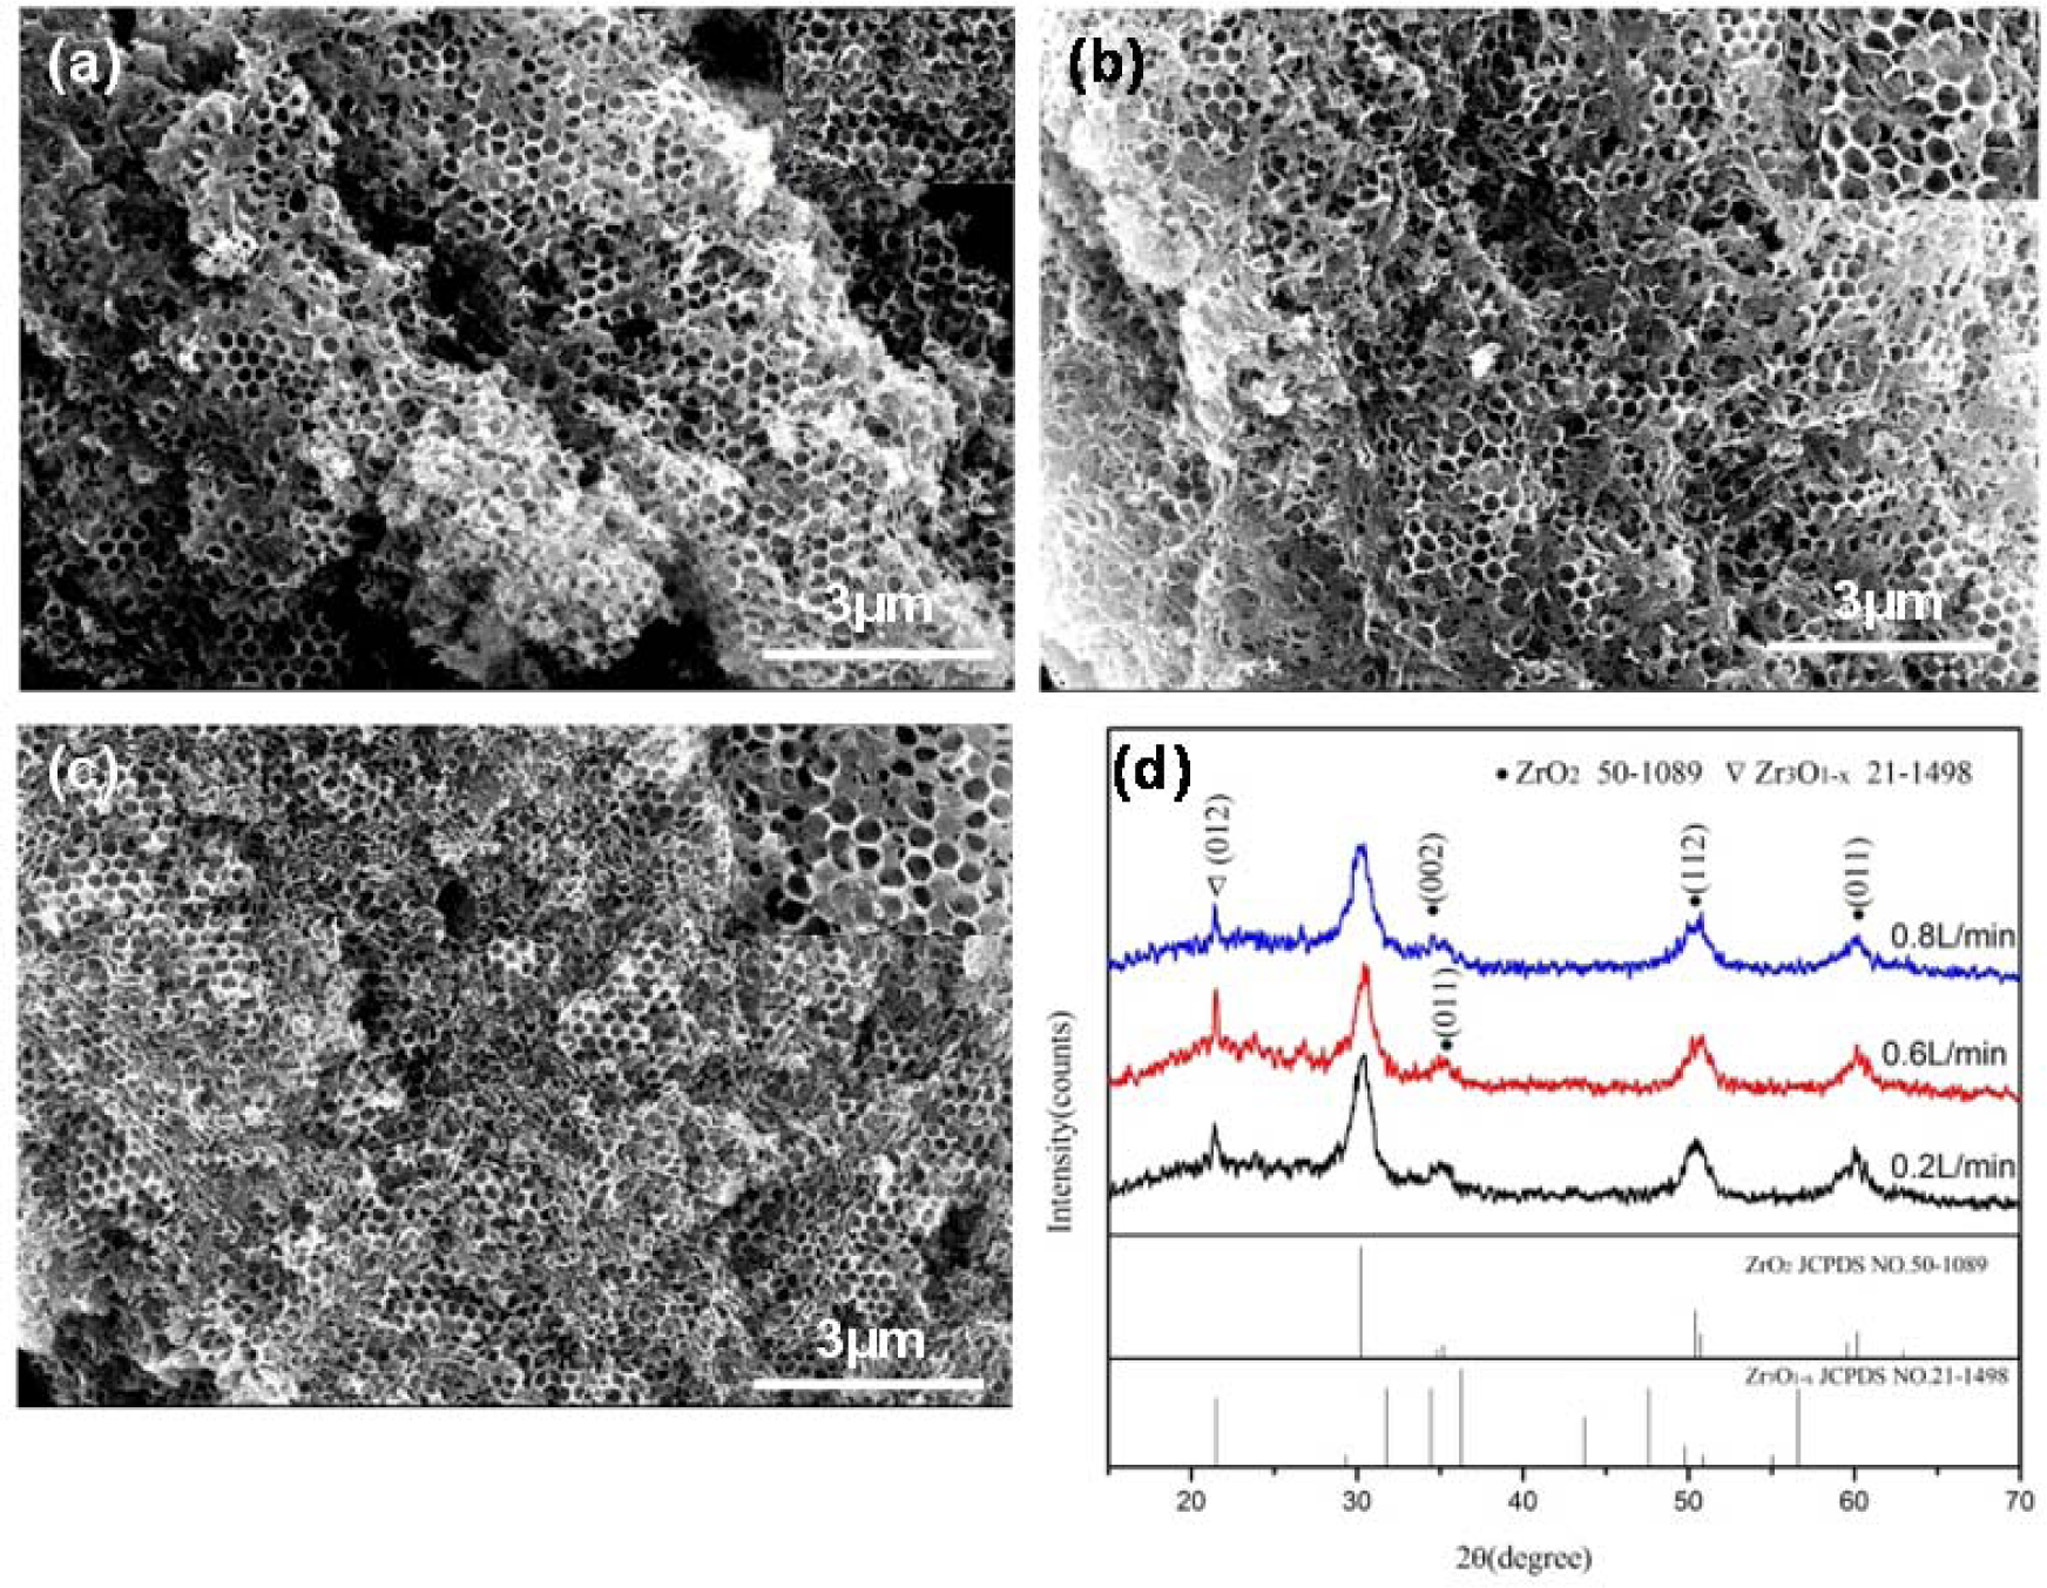
Fig. 2 shows SEM images of the inverse opal zirconia sintered at 450 oC with various nitrogen flow rate. With increasing of the nitrogen flow from 0.2 L/min to 0.8 L/min, the morphology of the inverse opal zirconia did not change significantly as shown in Fig. 2(a-c), suggesting that nitrogen flow did not have a considerable influence on the morphology, while the crystallinity of the inverse opal zirconia became worse (Fig. 2(d)). When the nitrogen flow rate was increased from 0.2 L/min to 0.6 L/min, the main cubic phase peak decreased significantly, while the hexagonal Zr3O1-X diffraction peak on the (0 1 2) crystal plane increased. It indicated that with increasing of the nitrogen flow rate, the oxygen content in the furnace decreased and the Zr /O atomic ratio increased, which led to the increase of reaction temperature of zirconium acetate decomposition to zirconia. Therefore, the crystallinity of zirconia decreased while the anoxic phase Zr3O1-X increased. When the nitrogen flow rate was increased from 0.6 L/min to 0.8 L/min, the characteristic peak of the primary crystal orientation decreased slightly and the hexagonal Zr3O1-X diffraction peak also reduced, indicating that nitrogen as a protective atmosphere reduced the crystallinity of the inverse opal zirconia.
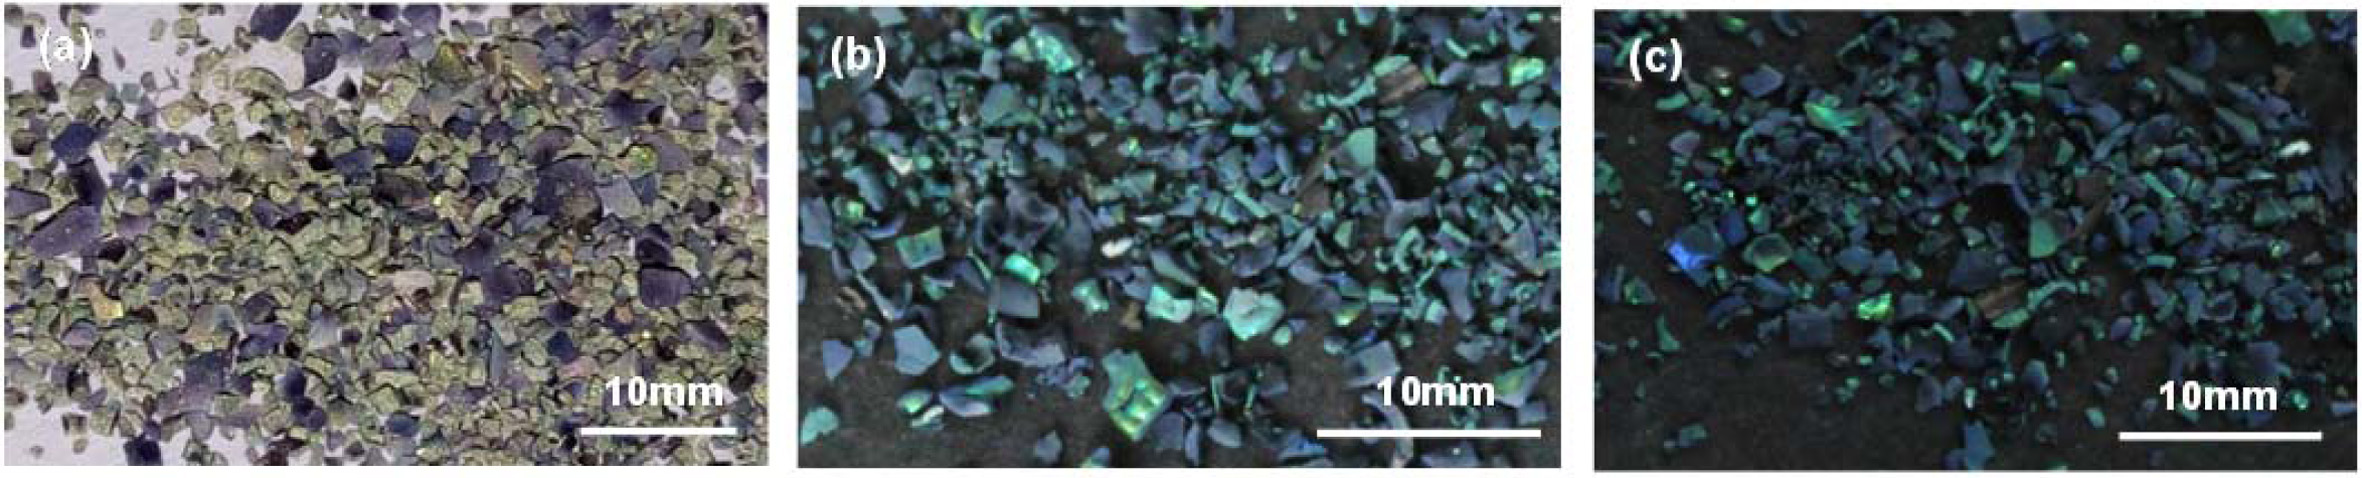
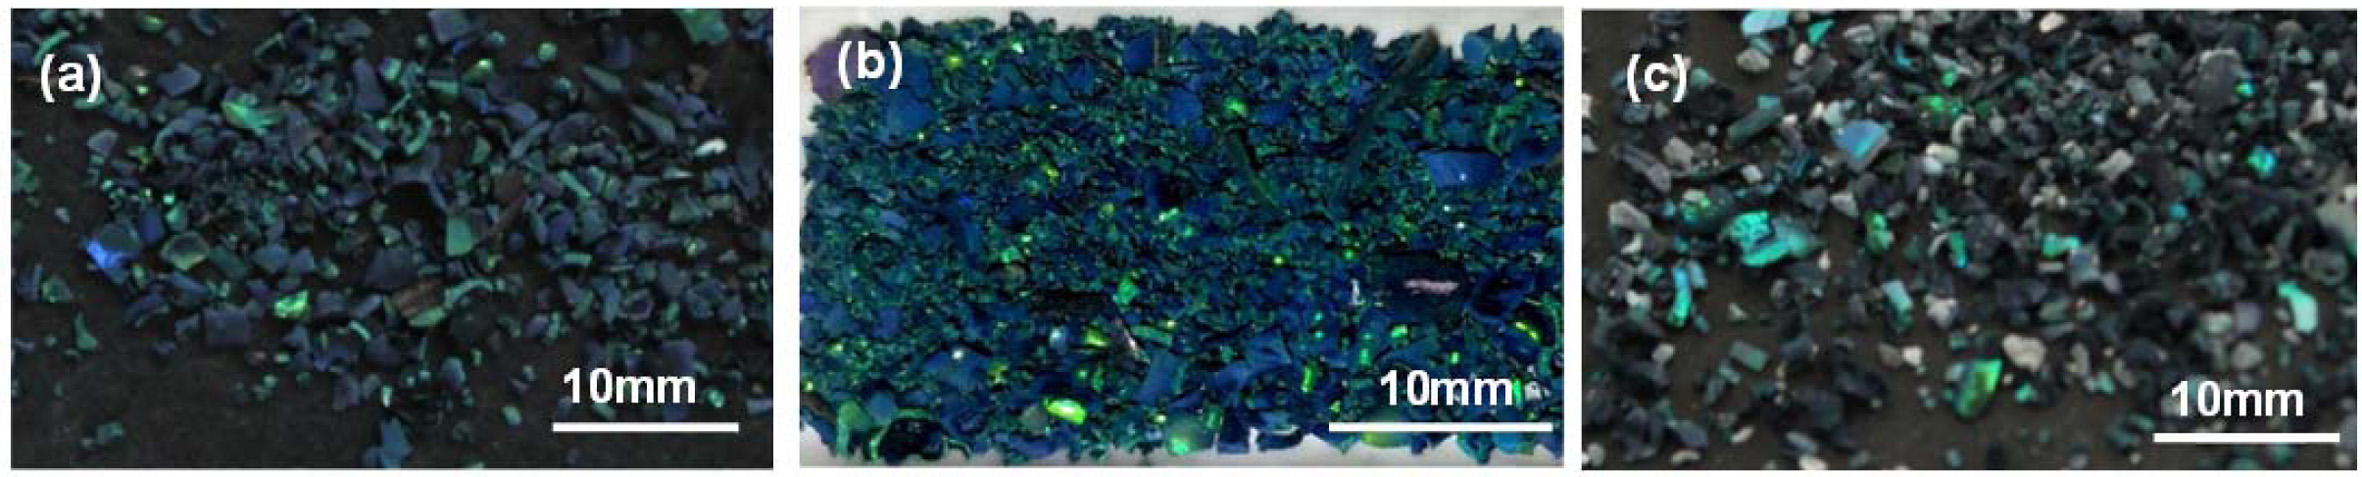
Fig. 3 shows the color saturation of the inverse opal zirconia sintered at 450 oC with various nitrogen flow rates. When the nitrogen flow rate was 0.2 L/min, the inverse opal zirconia was green with low saturation and has a certain angle dependence. When the nitrogen flow rate was increased from 0.2 L/min to 0.8 L/min, the green saturation of the inverse opal zirconia increased gradually, which indicated that changing the nitrogen flow rate could adjust the green color saturation of the inverse opal zirconia. When the inverse opal zirconia was sintered at 450 oC in nitrogen atmosphere, methanol evaporated completely, zirconium acetate and PS carbonized to form in-situ carbon. When the nitrogen flow rate increased from 0.2 L/min to 0.8 L/min, the amount of in-situ carbon generated increased, which led to the increase of stray light absorbed, thus effectively adjusting the color saturation of inverse opal zirconia.
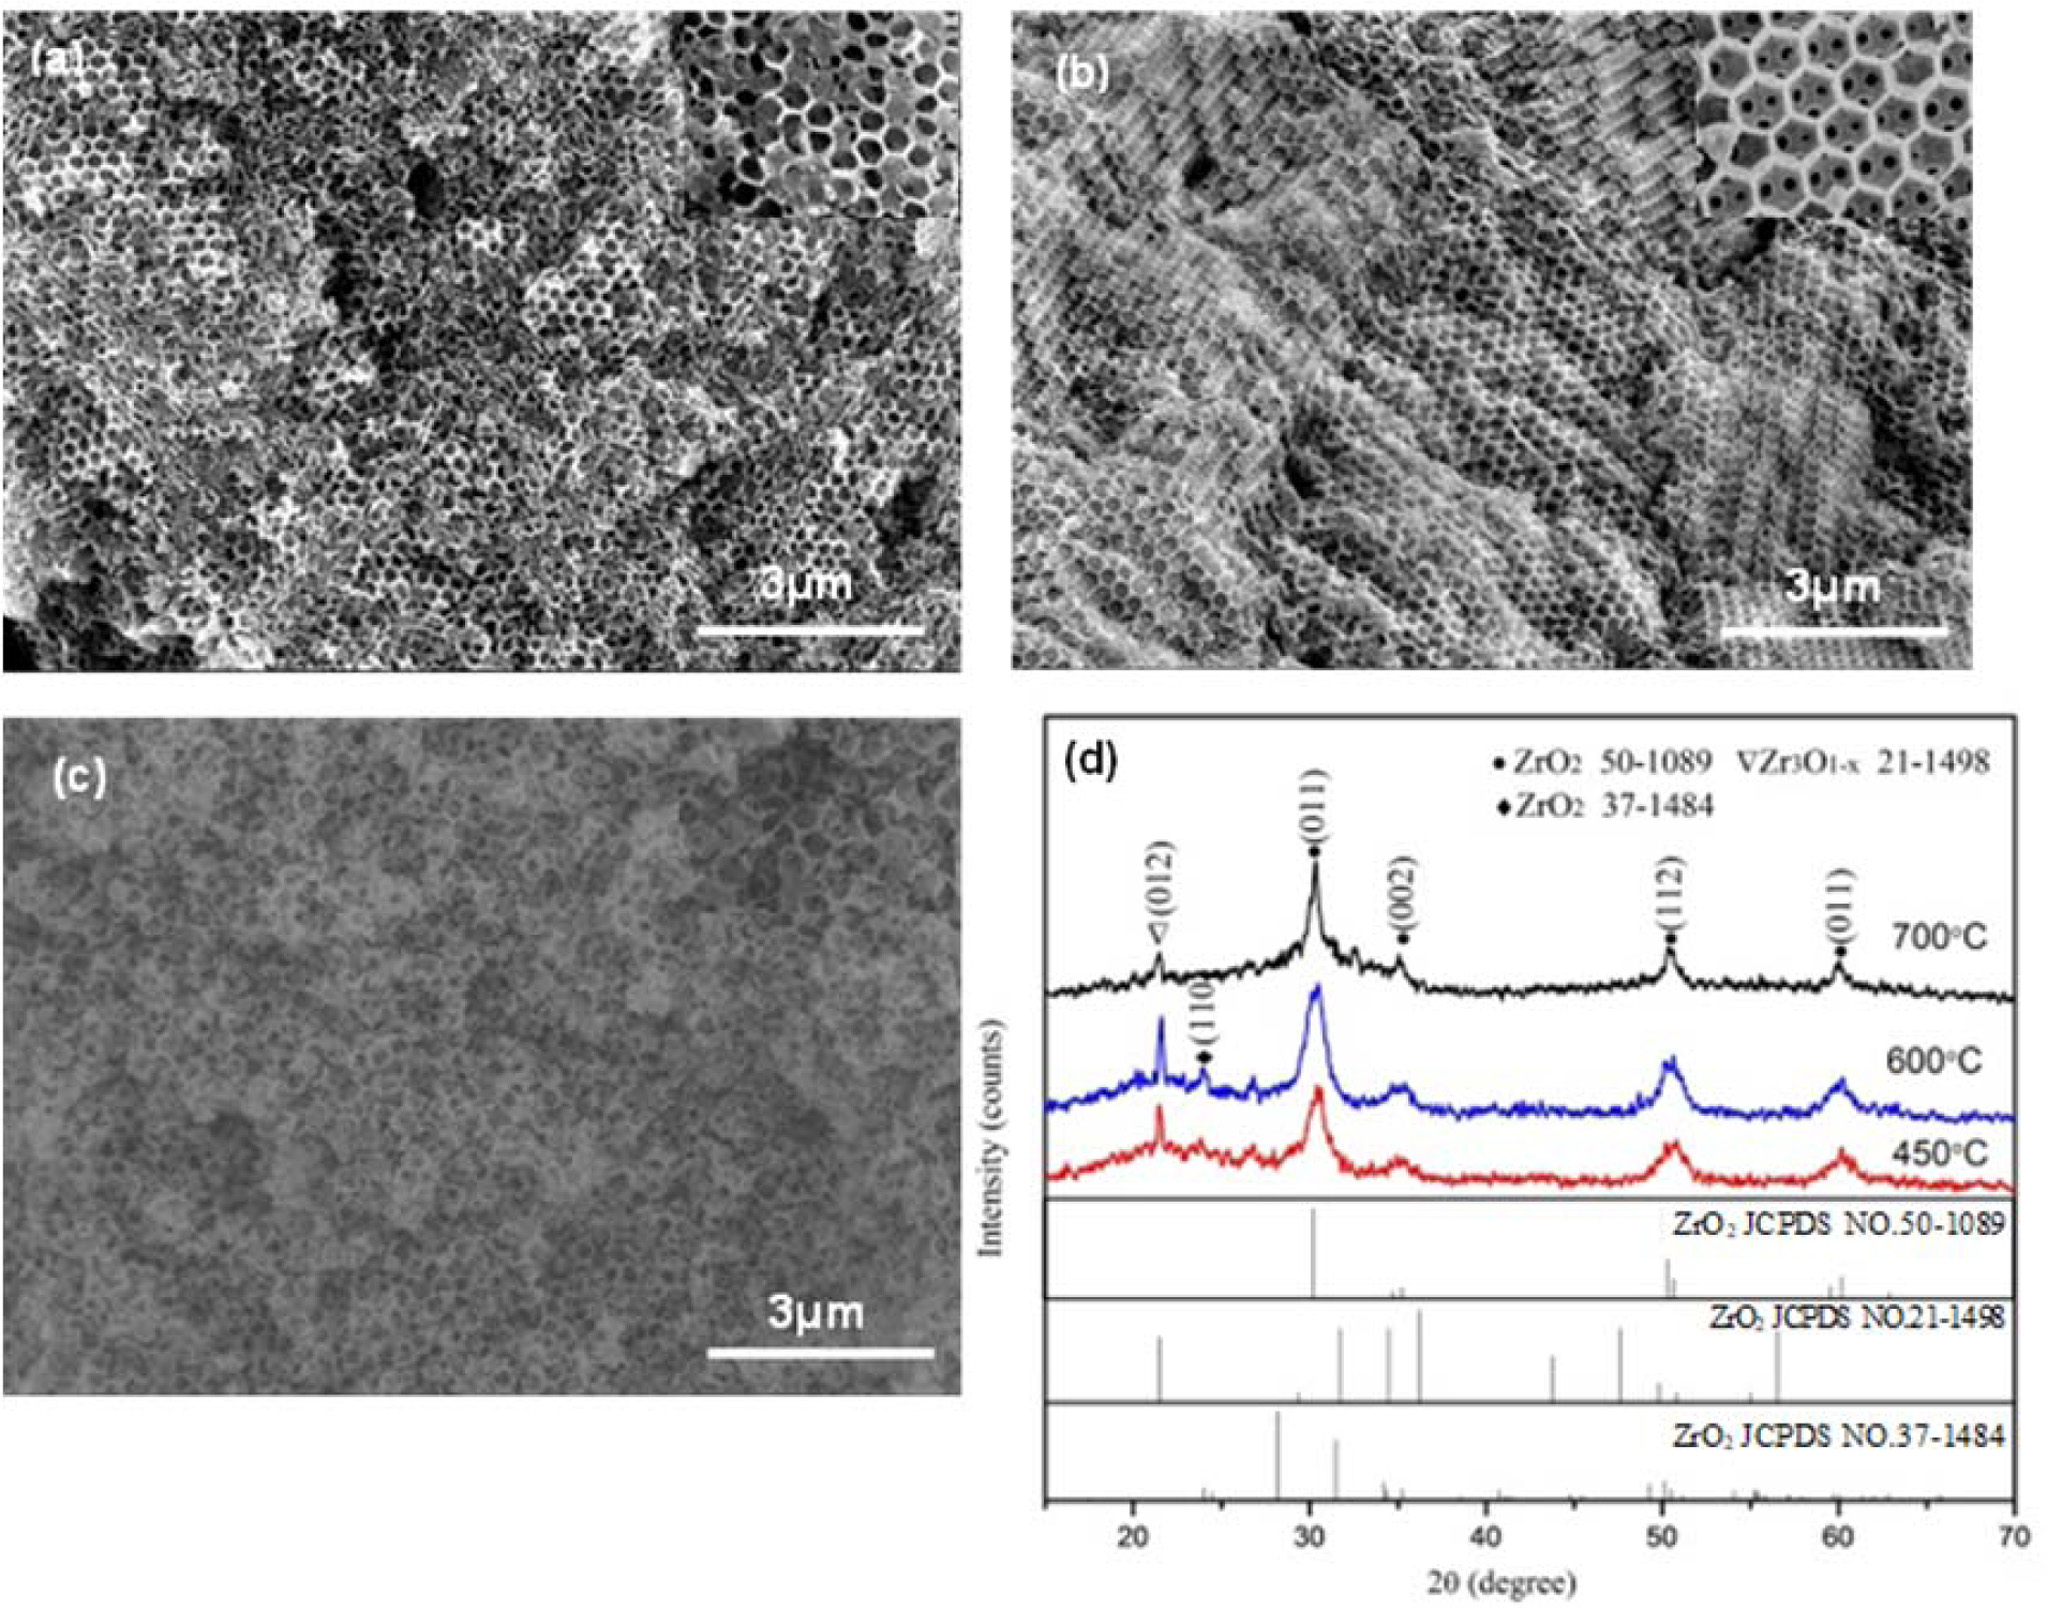
SEM images of the inverse opal zirconia sintered at various temperatures with 0.8 L/min nitrogen rate were shown in Fig. 4(a-c).W hen the calcination temperature was 600 oC, the zirconia had complete inverse opal morphology (Fig. 4(a)). When sintered at 450 oC, a small part of the inverse opal structure of the samples destroyed due to the shrinkage during the sintering process and most part of the samples showed inverse opal morphology. When the sintering temperature was further increased to 700 oC, the morphology of the samples was further destroyed, which was due to the increasing of internal stress caused by high temperature sintering. The XRD patterns of the inverse opal zirconia sintered at different sintering temperatures in nitrogen atmosphere with a flow rate of 0.8L/min is shown in Fig. 4(d). The diffraction peaks were narrower and sharper with increasing the calcination temperature in nitrogen atmosphere, indicating that sintering in nitrogen had no significant effect on its crystallinity.
The color saturation of the inverse opal zirconia sintered at different calcination temperature with 0.8L/min nitrogen rate is shown in Fig. 5. All the samples were green with different color saturation. When the sintering temperature increased from 450 oC to 600 oC, the green saturation of the samples increased and further increased to 700 oC, the color saturation of the samples decreased, which indicated that the color saturation of the inverse opal zirconia could be adjusted by changing the sintering temperature. This was due to the photonic band gap formed by the good inverse opal structure sintered at 600 oC, which promoted the formation of structural color and made the sample show high color saturation. At the same time, the stray light shinning on the samples was absorbed by the carbonized components that were not vaporized at this sintering condition such as the PS template and zirconium acetate, which further adjusted the color saturation of the sample. When sintered at 700 oC, the color saturation of the samples decreased, which was obviously due to the partial destruction of the inverse opal morphology of the samples. At the same time, due to the high temperature sintering, part of the carbonized components evaporated, leaving only a small amount of carbonized components in the samples.
Marte l[24] systematically studied the thermal de- composition, oxidation and carbonization of PS in different atmospheres. Differential thermal analysis shows that PS is carbonized and oxidized at 400 oC ~ 420 oC in air and further oxidized to disappear at 500 oC ~ to 550 oC. However, no oxidation occurs at 800 oC in nitrogen atmosphere. The results showed that zirconium acetate carbonized at 450 oC in protective atmosphere. When heated at a rate of 5 oC/min in nitrogen, zirconium acetate began to carbonize at about 300 oC and continued to about 650 oC. According to the results, the main components of carbonization were PS template and zirconium acetate sintered at 450 oC to 600 oC and PS template was the main carbonization component when sintered at 700 oC.
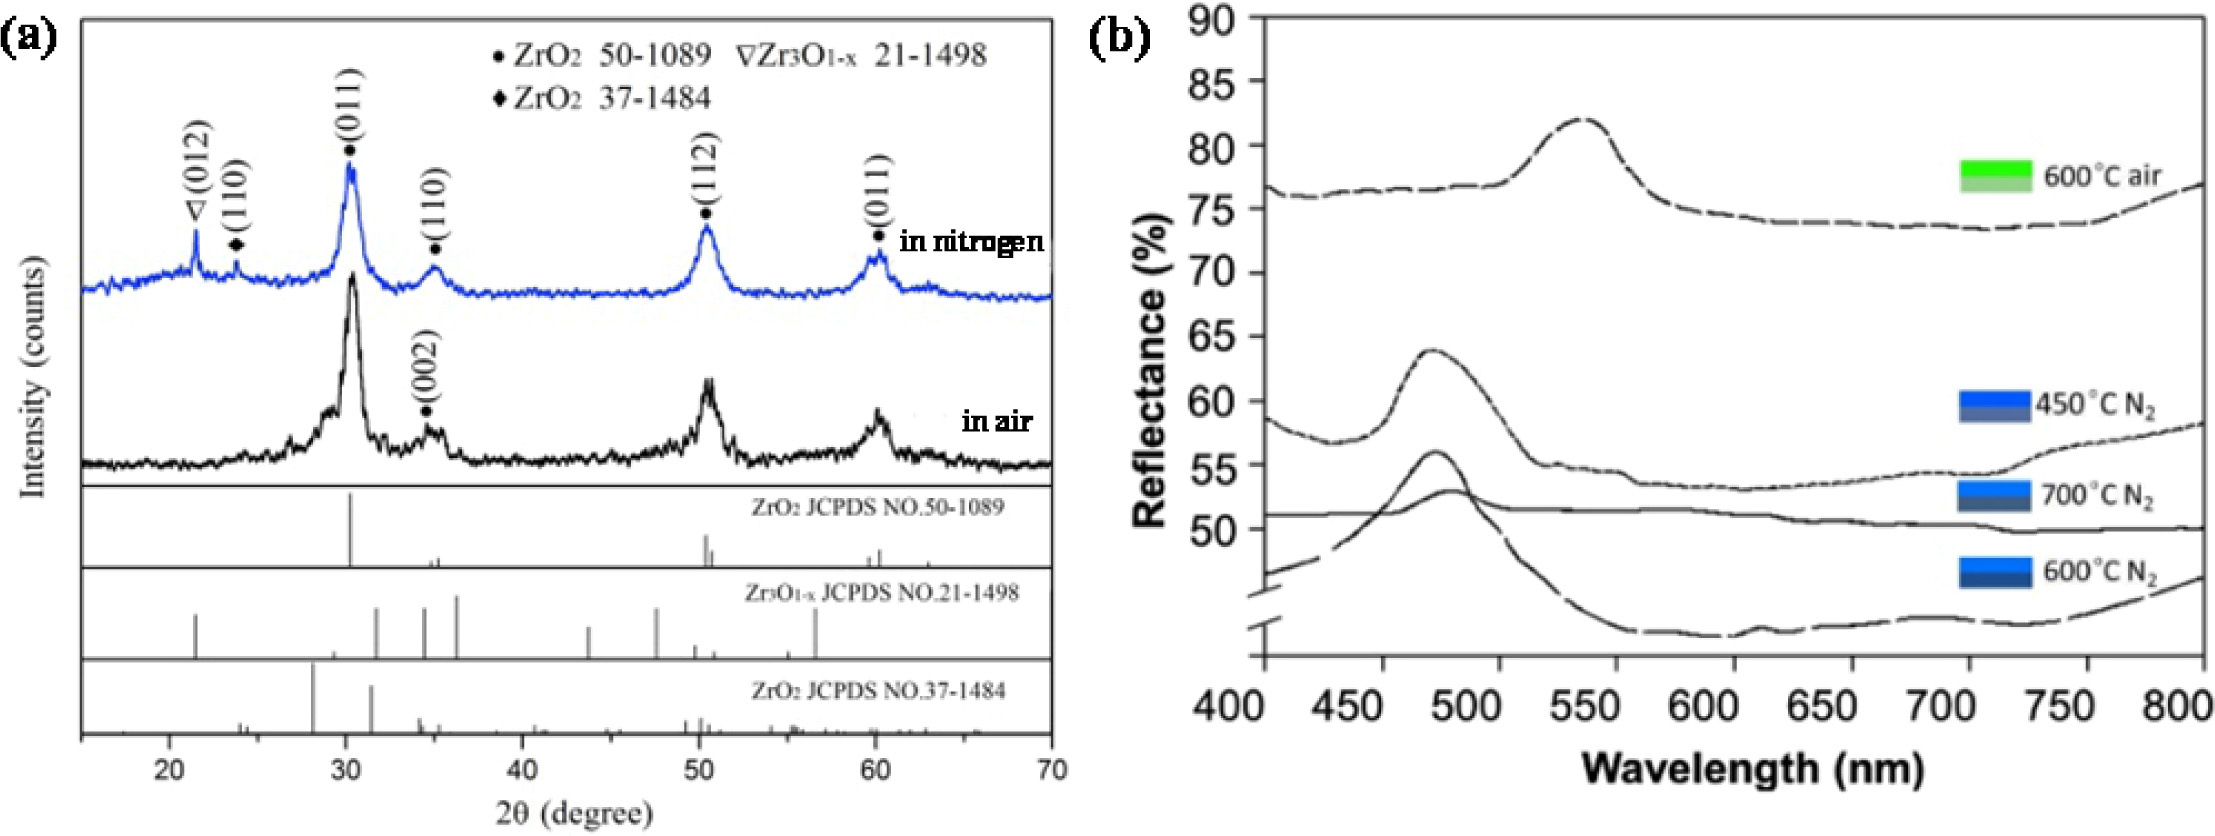
It can be seen from the XRD diffraction pattern in Fig. 6(a) that the diffraction peak of the samples sintered in the air was higher than that sintered in nitrogen atmosphere. However, the color saturation of the samples sintered in nitrogen atmosphere was much higher than that sintered in air. It was because the carbonation component in the sample was not retained when sintered at 600 oC in air, resulting in low green color saturation of the sample. However, when the sintering temperature was 600 oC and the nitrogen flow rate was 0.8 L/min, the internal carbonization environment of the samples was better. The residual carbonized components in the samples absorbed stray light, increased the proportion of light forbidden and the color saturation was much higher than that sintered in air.
The reflection spectrum of the samples was shown in Fig. 6(b). All the samples displayed a single band gap in the visible region. The diffraction peaks of the samples sintered at 600 oC with various sintering atmospheres shifted from green range to blue range in the spectrum for which the formation of carbon on the pore wall of zirconia in the nitrogen atmosphere would reduce the refractive index of zirconia and lead to the shift of the forbidden band position. Since the organic matter carbonized in this process, the in-situ carbon absorbed some stray light produced by the difference of pore size and structural defects in other bands in the sample, which made the bandgap width narrow and affected the position and intensity of the bandgap. Therefore, the color saturation of the inverse opal zirconia could be controlled by adjusting the content of in-situ carbon produced in it.
|
Fig. 1 SEM images of (a) PS monodisperse spheres and (b) PS template. |
|
Fig. 2 SEM images and XRD pattern of the inverse opal zirconia sintered at 450 o C with various nitrogen flow rate (a) 0.2L/min; (b) 0.6L/ min; (c) 0.8L/min. |
|
Fig. 3 The color saturation images of the inverse opal zirconia sintered at 450 o
C with various nitrogen flow rate (a) 0.2 L/min; (b) 0.6 L/min;
(c) 0.8 L/min. |
|
Fig. 4 SEM images and XRD pattern of the inverse opal zirconia sintered at various temperatures with 0.8 L/min nitrogen rate (a) 450 oC; (b) 600 oC; (c) 700 oC. |
|
Fig. 5 The color saturation of the inverse opal zirconia sintered at various temperatures with 0.8 L/min nitrogen rate (a) 450 oC; (b) 600 oC; (c) 700 oC. |
|
Fig. 6 RD pattern and reflection spectrum of the inverse opal zirconia sintered at 600 oC in air and nitrogen, respectively |
The color saturation of the inverse opal zirconia pigment was successfully controlled by adjusting the nitrogen flow rate from 0.2 L/min to 0.8 L/min and sintering temperature from 450 oC to 600 oC. By adjusting the sintering temperature and the nitrogen flow rate, the amount of in-situ carbon produced by the carbonization of organic matter in the sample was controlled. Therefore, stray light in the samples absorbed by in-situ carbon produced was controlled either, which indicated that this was an effective way to adjust the color saturation of the inverse opal zirconia pigment. When the nitrogen flow rate was 0.8L/min and the sintering temperature was 600 oC, it was more conducive to the carbonization of the organic matter in the sample and did not cause the volatilization of the carbonized components. The successful preparation of the inverse opal zirconia pigment with controllable color saturation will promote the structural color to replace the traditional pigment and get further extensive application.
This work was supported by National Foundation of Natural Science, China (51402179, 51272149).
- 1. L. Zhou, Y. Li, G. Liu, Q. Fan, and J. Shao, Dye. Pigment. 133 (2016) 435-444.
-

- 2. B. Tang, X. Zheng, T. Lin, and S. Zhang, Dye. Pigment. 104 (2014) 146-150.
-
- 3. Y. Yang, Q. Jin, D. Mao, J. Qi, Y. Wei, R. Yu, A. Li, S. Li, H. Zhao, Y. Ma, L. Wang, W. Hu, and D. Wang, Adv. Mater. 29[4] (2016) 1-7.
-
- 4. Y. Takeoka, Polym. J.. 49[3] (2017) 301-308.
-
- 5. Y. Wang, D. Aurelio, W. Li, P. Tseng, Z. Zheng, M. Li, D.L. Kaplan, M. Liscidini, and F.G. Omenetto, Adv. Mater. 29[38] (2017) 1-9.
-
- 6. H. Kang, J. Lee, W.S. Chang, and S. Kim, Adv. Mater. 27[7] (2014) 1282-1287.
-
- 7. C. Ding, J.-C. Hu, W. Yuan, D.-Z. Du, Y. Yang, G. Chen, and K. Q. Zhang, RSC Adv. 6[60] (2016) 54976-54983.
-
- 8. Y. Li, L. Zhou, G. Zhang, G. Liu, Q. Fan, and J. Shao, Surf. Coat. Technol. 319 (2017) 267-276.
-
- 9. J.G. Kim, G.E. Jang, J. Ceram. Process. Res. 17[2] (2016) 103-108.
- 10. S. Rasouli, M. Valefi, S. J. Moeen, and A. M. Arabi, J. Ceram. Process. Res. 12[4] (2011) 450-455.
- 11. Q. Li and C. Yang, Mater. Lett. 199 (2017) 168-171.
-
- 12. B. Yi and H. Shen, J. Mater. Chem. C 5[32] (2017) 8194-8200.
-
- 13. F. Fu, Z. Chen, Z. Zhao, H. Wang, L. Shang, Z. Gu, and Y. Zhao, Proc. Natl. Acad. Sci. 114[23] (2017) 5900-5905.
-
- 14. Z. Liu, X. Tan, and C. Lv, Appl. Surf. Sci. 283[20] (2013) 290-296.
-
- 15. K. Kanamura, N. Akutagawa, and K. Dokko, J. Power Sources 146[1-2] (2005) 86-89.
-
- 16. T. Nakamura, Y. Yamada, and K. Yano, Microporous Mesoporous Mater. 117[1-2] (2009) 478-485.
-
- 17. F. Liu, Z. Gao, J. Hu, Y. Meng, S. Zhang, and B. Tang, J. Mater. Sci. 54[15] (2019) 10609-10619.
-
- 18. F. Liu, B. Shan, S. Zhang, and B. Tang, Langmuir 34[13] (2018) 3918-3924.
-
- 19. X. Zhang, F. Wang, L. Wang, Y. Lin, and J. Zhu, ACS Appl. Mater. Interfaces 8[34] (2016) 22585-22592.
-
- 20. R. Zhang, J. Cohen, S. Fan, and P. V Braun, Nanoscale 9[31] (2017) 11187-11194.
-
- 21. H. Liu, D. Shi, F. Duan, Z. Yang, M. Chen, and S. Liu, Mater. Lett. 150 (2015) 5-8.
-
- 22. D.P. Josephson, E.J. Popczun, and A. Stein, J. Phys. Chem. C 117[26] (2013) 13585-13592.
-
- 23. G.I.N. Waterhouse, W.T. Chen, A. Chan and D.S. Waterhouse, Acs Omega 3[8] (2018) 9658-9674.
-
- 24. B. Martel, J. Appl. Polym. Sci. 35[5] (1988) 1213-1226.
-
 This Article
-
2021; 22(2): 240-245
Published on Apr 30, 2021
- 10.36410/jcpr.2021.22.2.240
- Received on Nov 10, 2020
- Revised on Dec 29, 2020
- Accepted on Feb 5, 2021
Services
- Abstract
introduction
materials and methods
result and discussion
conclusion
- Funding
- References
- Full Text PDF
Shared
Correspondence to
- Li-li Wang
-
School of Materials Science and Engineering, Shaanxi Key Laboratory of Green Preparation and Functionalization for Inorganic Materials, Shaanxi University of Science and Technology, Xi’an 710021, China
Tel : +18391009638 Fax: +029-86168688 - E-mail: mariawanglili@126.com
Clean-Energy Research Institute(CRI), Hanyang University, 222, Wangsimni-ro, Seongdong-gu, Seoul, 04763, Korea
E-mail: jcpr@hanyang.ac.kr