


- Enhanced electrochemical performance of peony flower-like carbon-coated γ-Ga2O3 nanosheets for lithium-ion battery anodes
Injun Jeona, Jin Hyun Hwanga, Tae Gyun Kima, Linghong Yina, Hyung Woo Leea,b, Jong Pil Kimc, Hyung Soo Ahnd and Chae Ryong Choa,b,*
aDepartment of Nano Fusion Technology, Pusan National University, Busan 46241, S. Korea
bDepartment of Nanoenergy Engineering, Pusan National University, Busan 46241, S. Korea
cBusan Center, Korea Basic Science Institute, Busan 46742, S. Korea
dDepartment of Electronic Materials Engineering, Korea Maritime and Ocean University, Busan 49112, S. KoreaThis article is an open access article distributed under the terms of the Creative Commons Attribution Non-Commercial License (http://creativecommons.org/licenses/by-nc/4.0) which permits unrestricted non-commercial use, distribution, and reproduction in any medium, provided the original work is properly cited.
Peony flower-like γ-Ga2O3 nanosheets (γ-Ga2O3 NSs) were synthesized and carbon layers were coated on their surfaces using a simple hydrothermal process with subsequent carbonization. The γ-Ga2O3 NSs comprised ultrathin layers, which are tens of nanometers in thickness. The carbon-coated γ-Ga2O3 NS (γ-Ga2O3@C NS) electrode exhibited a specific capacity of 598 mAh g-1 at 200 cycles, at a current density of 0.5 A g-1, higher than that of γ-Ga2O3 NSs (60 mAh g-1). Furthermore, a specific capacity of 100 mAh g-1 at 5 A g-1 was achieved owing to the low charge transfer resistance through the carbon layers. This study suggests that two-dimensional γ-Ga2O3@C NSs with both large specific area and high charge carrier transport are promising active materials for lithium-ion battery anodes with better electrochemical performance
Keywords: Lithium-ion battery, Anode, γ-Ga2O3, Carbon coating, Electrochemical performance
Lithium-ion batteries (LIBs) are essential for energy storage technologies such as in automobiles, portable electronic devices, and long-term energy storage systems [1, 2]. Despite their extensive applicability, the energy densities of commercial LIBs do not satisfy the increasing demands of high-capacity and high-power consuming electronic or automotive applications [3, 4]. Many currently employed active materials exhibit low capacities; therefore, to overcome this problem, new anode and cathode materials have to be developed [5-7]. Furthermore, the theoretical capacity of graphite as an LIB anode is limited to 372 mAh g-1 [8, 9]. Much effort has been devoted to enhancing its anode capacity; alternative materials have been developed that can store Li ions by conversion reactions (such as Fe3O4, Co3O4, and SnO2) [10-13] or reversible alloying reactions (such as Si and Ge) [14-17]
Among the potential candidates, gallium (Ga) appears to be a particularly attractive non-toxic metal. Ga melts close to room temperature (melting temperature: 29.8 oC). This unique property can prevent particle pulverization and structural collapse during lithiation/delithiation and can thus possibly enable high long-term cycle stability. However, for Ga2O3, several problems limit the electrochemical performance; these include, for example, the large volume expansion (>160% for Li2Ga) during lithiation/delithiation and poor electrical conductivity.
Coating LIB electrodes with conductive materials such as Si, Fe2O3, Li4Ti5O12, and LiFePO4, has improved the performance of LIBs. The conductivity of the carbon layer effectively decreases the electrode resistance and can 1) adjust the solid–electrolyte interphase (SEI) layer, 2) buffer the volume expansion during cycling, and 3) improve the surface chemistry of the electrode material. Wang et al. presented a free-standing membrane prepared from carbon fibers that encapsulated Ga nanodroplets, achieving enhanced cycling stability of 247 mAh g-1 at 0.65 A g-1 over 250 cycles [18]. Meligrana et al. reported the electrochemical response of electrodes based on novel ε-Ga2O3 nanorods using a template-free synthetic method for lithium and sodium ion batteries [19]. Tang and coworkers synthesized highly dispersed γ-Ga2O3 nanoparticles embedded in carbon (γ-Ga2O3@C) using a hydrothermal carbonization method, yielding a capacity approaching 721 mAh g-1 over 200 cycles [20].
Another effective approach is to control the morphology (porous or nanostructured) and particle size of the active materials. Among the viable nanostructures, two-dimensional (2D) nanostructures, such as nanosheets [21-23], nanoplates [24-26], nanowalls [27], and hierar- chical structures [28, 29] have attracted considerable interest because of their shortened diffusion path and larger surface area.
Herein, carbon-coated γ-Ga2O3 nanosheets (γ-Ga2O3@C NSs) were used as LIB anodes. NSs were synthesized by employing a hydrothermal process without shape control chemicals [30-32]. The electrochemical performance and the Li-ion kinetics of the samples were investigated through charge/discharge cycling, C-rate tests, cyclic voltammetry (CV), and electrochemical impedance spectroscopy (EIS).
The γ-Ga2O3 nanosheets were prepared through a hydrothermal reaction of Ga(NO3)3 (0.64 g, 99.9%, Kojundo Chemical) in 50 mL of ammonia solution (30%, NH4OH, Junsei Chemical). The mixture was stirred in a 60-mL stainless-steel Teflon-lined autoclave for 10 min at 20 oC. The hydrothermal reaction was carried out at 200 oC for 12 h and the samples were allowed to cool naturally to 20 oC. After washing the white powder produced from the reaction with ethyl alcohol several times, the γ-Ga2O3 NSs were collected by vacuum filtration and then dried at 80 oC for 8 h. To coat the γ-Ga2O3 NSs with a carbon layer, the sheets were hydrothermally processed in 40 mL of deionized water containing dissolved α-D-glucose (0.6 g, anhydrous, 96%, Sigma Aldrich). After cooling to 20 oC, the samples were heat-treated at 500 oC for 2 h under an argon gas atmosphere.
The morphology and crystallinity of the samples were investigated using field-emission scanning electron microscopy (FE-SEM, Hitachi, S4700), scanning trans- mission electron microscopy (FEG STEM, Talos F200X), and X-ray powder diffractometry (XRD, PANalytical, X’pert Powder). Thermogravimetric analysis (TGA, TA instrument, Q600) was carried out at temperatures ranging from 26 oC to 800 oC at a ramping rate of 10 oC min-1 in air.
The electrochemical performance was evaluated using a CR2032 coin cell assembly with the prepared anode material, Li metal foil, and 1 M LiPF6 salt dissolved in a mixture solution of ethyl carbonate and diethyl carbonate (1:1, v/v) with 10 wt% fluoroethylene carbonate additive as the working electrode, counter electrode, and electrolyte, respectively. The slurry for the working electrode was prepared by mixing the active materials (γ-Ga2O3 and γ-Ga2O3@C NSs), carboxymethyl cellulose, and acetylene black to obtain a ratio of 70:15:15 wt%. This slurry was doctor-bladed onto Cu foil as a negative current collector. The electrode was dried in a vacuum oven maintained at 60 oC; the active mass loading in each working electrode disc (diameter: 1.4 cm) was approximately 1.5 mg cm-2. The coin cells were assembled in a glove box filled with pure Ar (5 N). Galvanostatic cycling profiles were obtained using a battery test system (WMPG1000, Wonatech, Korea). The specific capacity values of the prepared electrodes were calculated based on the mass of the active materials (γ-Ga2O3 NSs and γ-Ga2O3@C NSs) [17, 33]. Measurements were performed at 20 oC, from 0.01 to 3.00 V (vs. Li/Li+) at various current densities and scanning rates. Nyquist plots for the coin cells were obtained using an EIS system (ZIVE MP1, Wonatech, Korea).
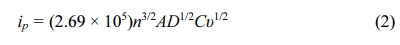
Fig. 1 presents the XRD patterns of the hydrothermally synthesized γ-Ga2O3 and γ-Ga2O3@C NSs. The XRD peaks of the samples indicate a face-centered cubic (FCC) γ-Ga2O3 structure in the Fd3m space group (JCPDS No. 20-0426), corresponding to the (111), (022), (113), (222), (004), (133), (224), (115), (044), and (226) crystalline planes. This phase has a defective spinel-type structure comprising cationic vacancies at octahedral and tetrahedral sites that are suitable for the storage of Li ions [34, 35]. In addition, no significant impurities or structural phase changes were observed after the hydrothermal and subsequent carbonization processes.
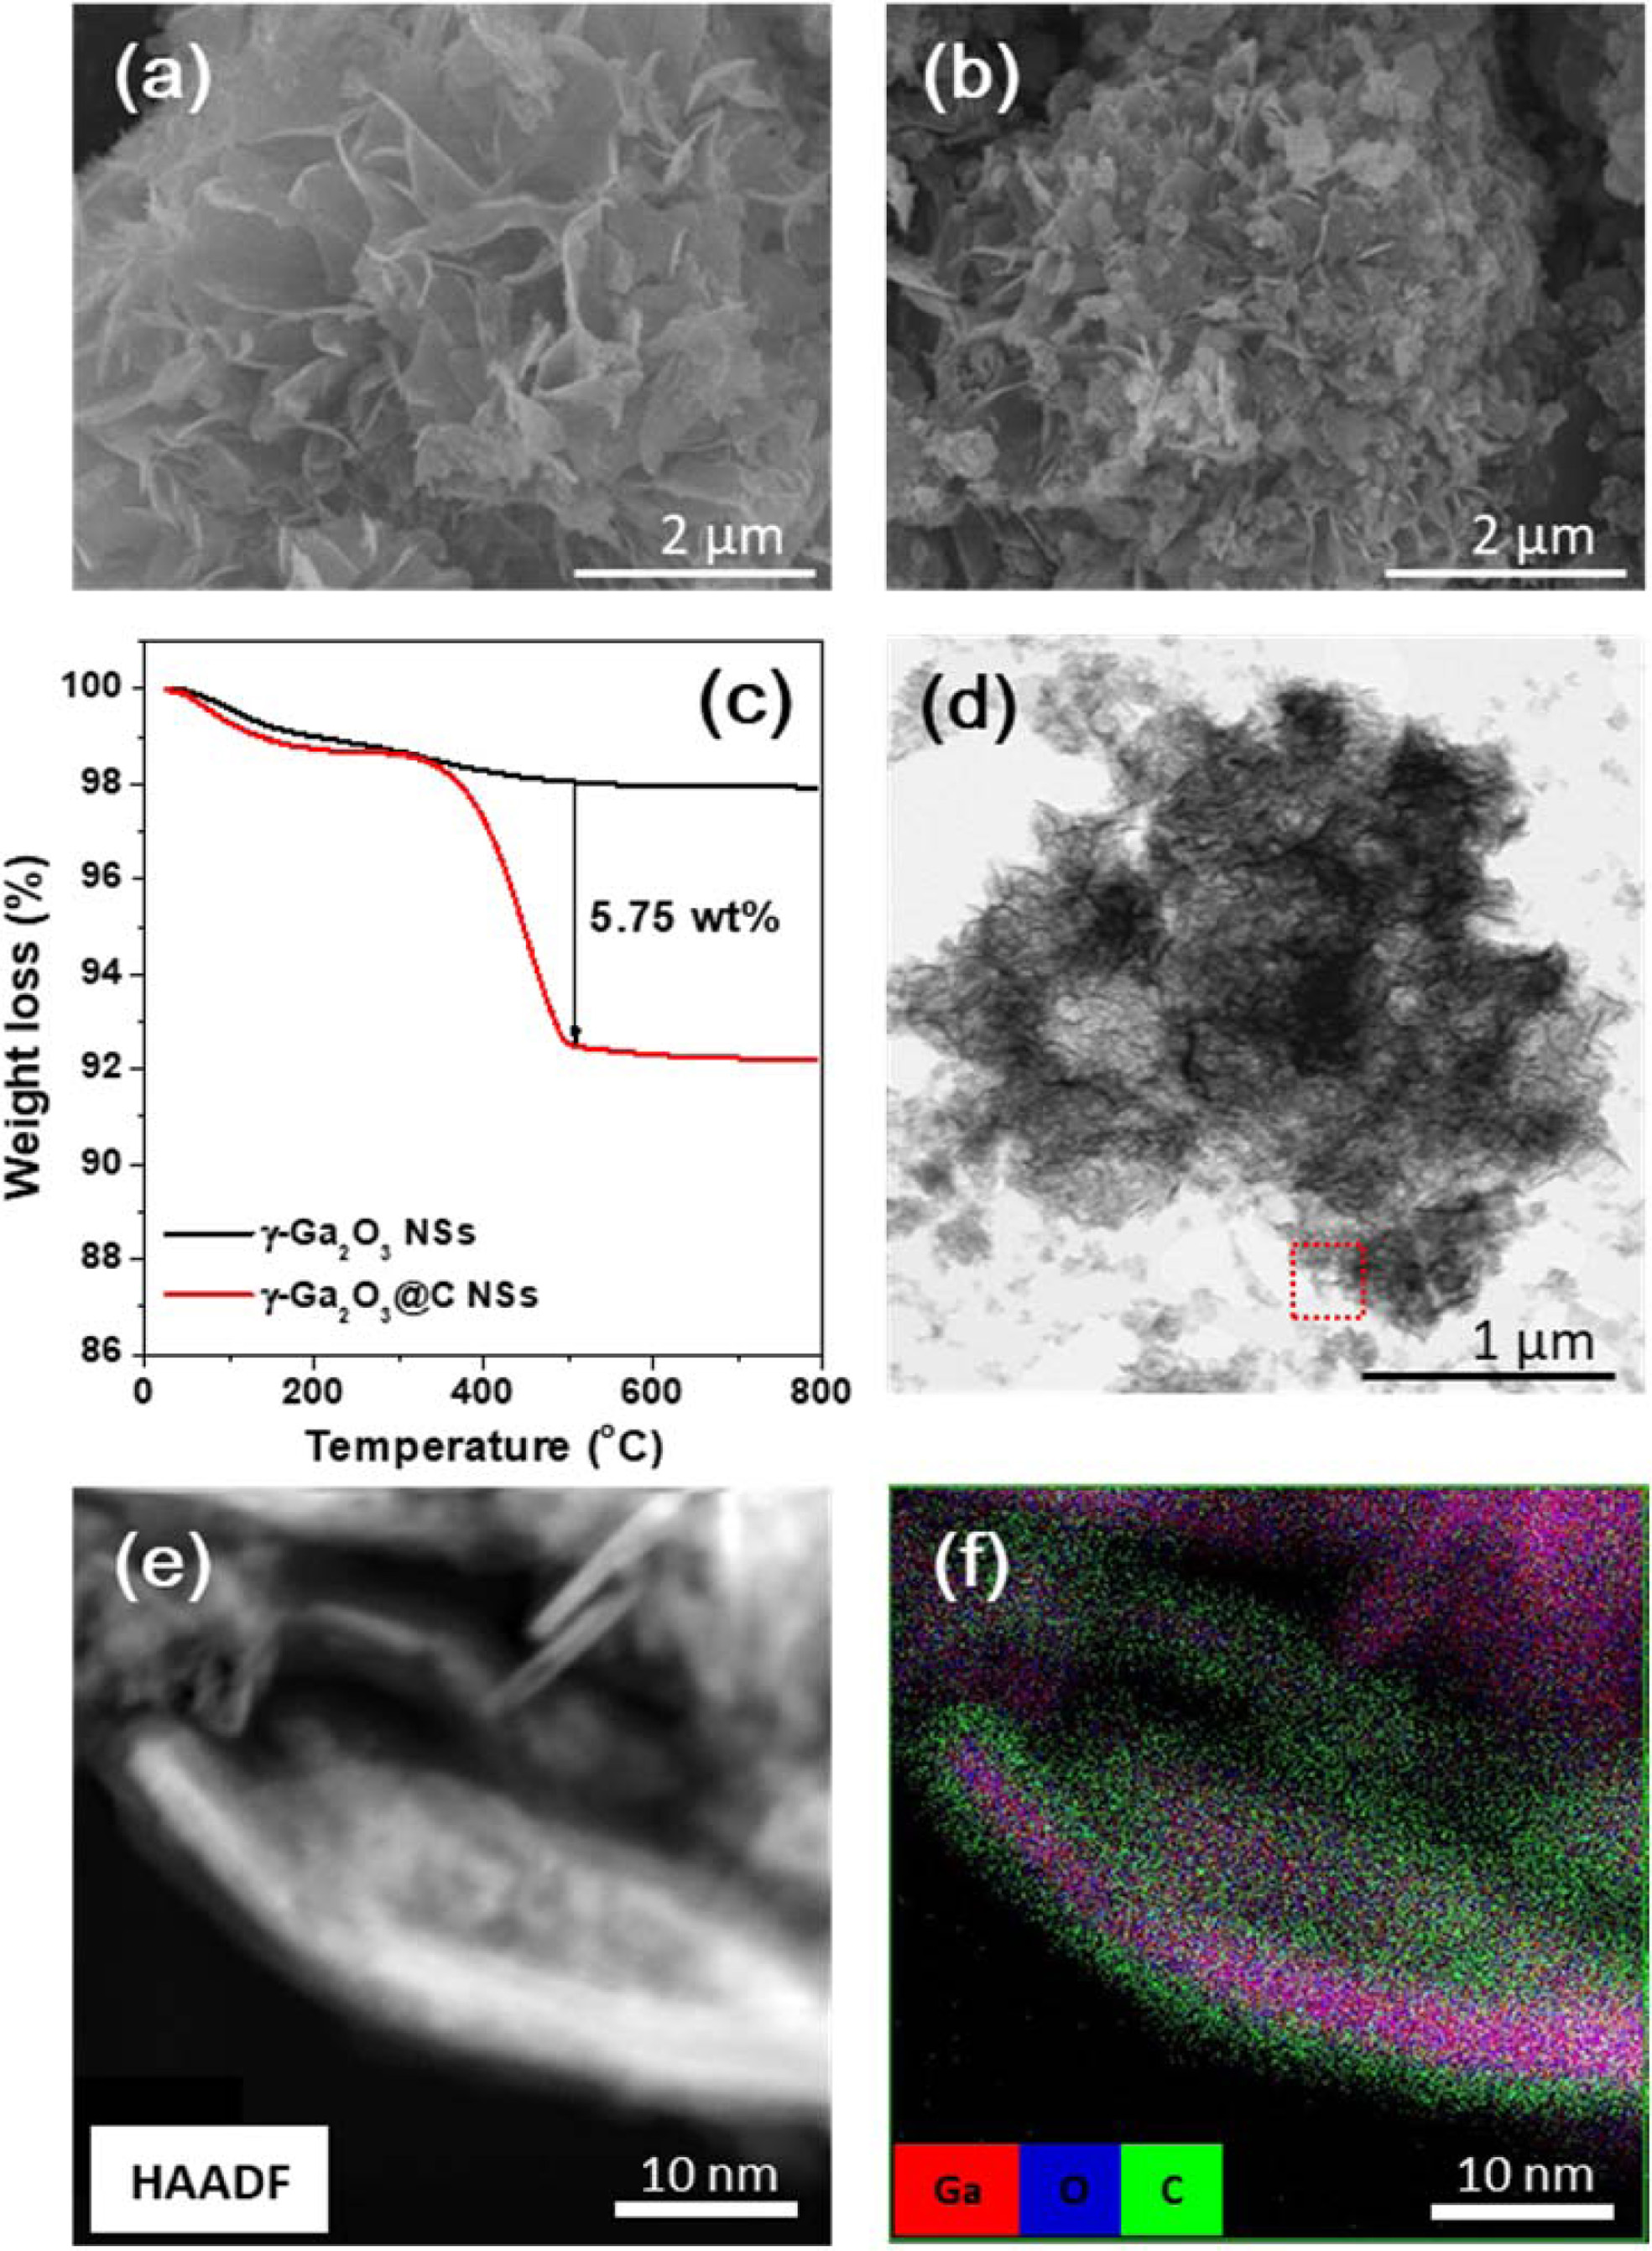
The surface morphologies of the samples are shown in Fig. 2(a) and 2(b). The γ-Ga2O3 NSs grew as flower-like nanosheets by Ostwald ripening through the hydrothermal reaction. The γ-Ga2O3 NSs exhibited peony flower shapes consisting of hundreds of ultrathin nano- sheets; the individual nanosheets were tens of nano- meters in thickness (Fig. 2(a)). After the hydrothermal process and subsequent carbonization, no significant morphological changes were observed in the γ-Ga2O3@C NSs; however, the presence of the carbon-coating layer and aggregated carbon particles between the nanosheets were detected (Fig. 2(b)). Fig. 2(c) shows the TGA of the prepared active materials to quantify the carbon content in the samples. The γ-Ga2O3 NSs and γ-Ga2O3@C NSs were heated in air from 26 oC to 800 oC at a ramping rate of 10 oC min–1. The weight (~2 wt%) of the γ-Ga2O3 NSs gradually decreased as the temperature increased from 26 oC to 700 oC due to the evaporation of moisture, and excess oxygen and hydroxide in pristine γ-Ga2O3. In the case of γ-Ga2O3@C NSs, the first weight loss slope in TGA corresponds to the oxidation of carbon to carbon dioxide observed from ~320 oC; no weight loss was observed from 600 oC. The total carbon content in the γ-Ga2O3@C NSs was measured to be ~5.75 wt% by the TGA result.
Fig. 2(d) presents the low-magnification TEM image of the γ-Ga2O3@C NSs. It shows that the prepared samples exhibited agglomerated materials with thin and curved nanosheets. The related high-angle annular dark field (HAADF) image and elemental mapping on the magnified region in Fig. 2(d) were used to observe the distribution of elements in the γ-Ga2O3@C NSs, as shown in Fig. 2(e) and 2(f), respectively. The HAADF image in Fig. 2(e) shows high-crystalline and ultra-thin γ-Ga2O3@C NSs several nanometers thick. Figure 2(f) shows the elemental mapping image of gallium (red), oxygen (blue), and carbon (green), indicating that the carbon layer was uniformly coated with an approximate thickness of 2–3 nm on the entire surface of the γ-Ga2O3@C NSs.
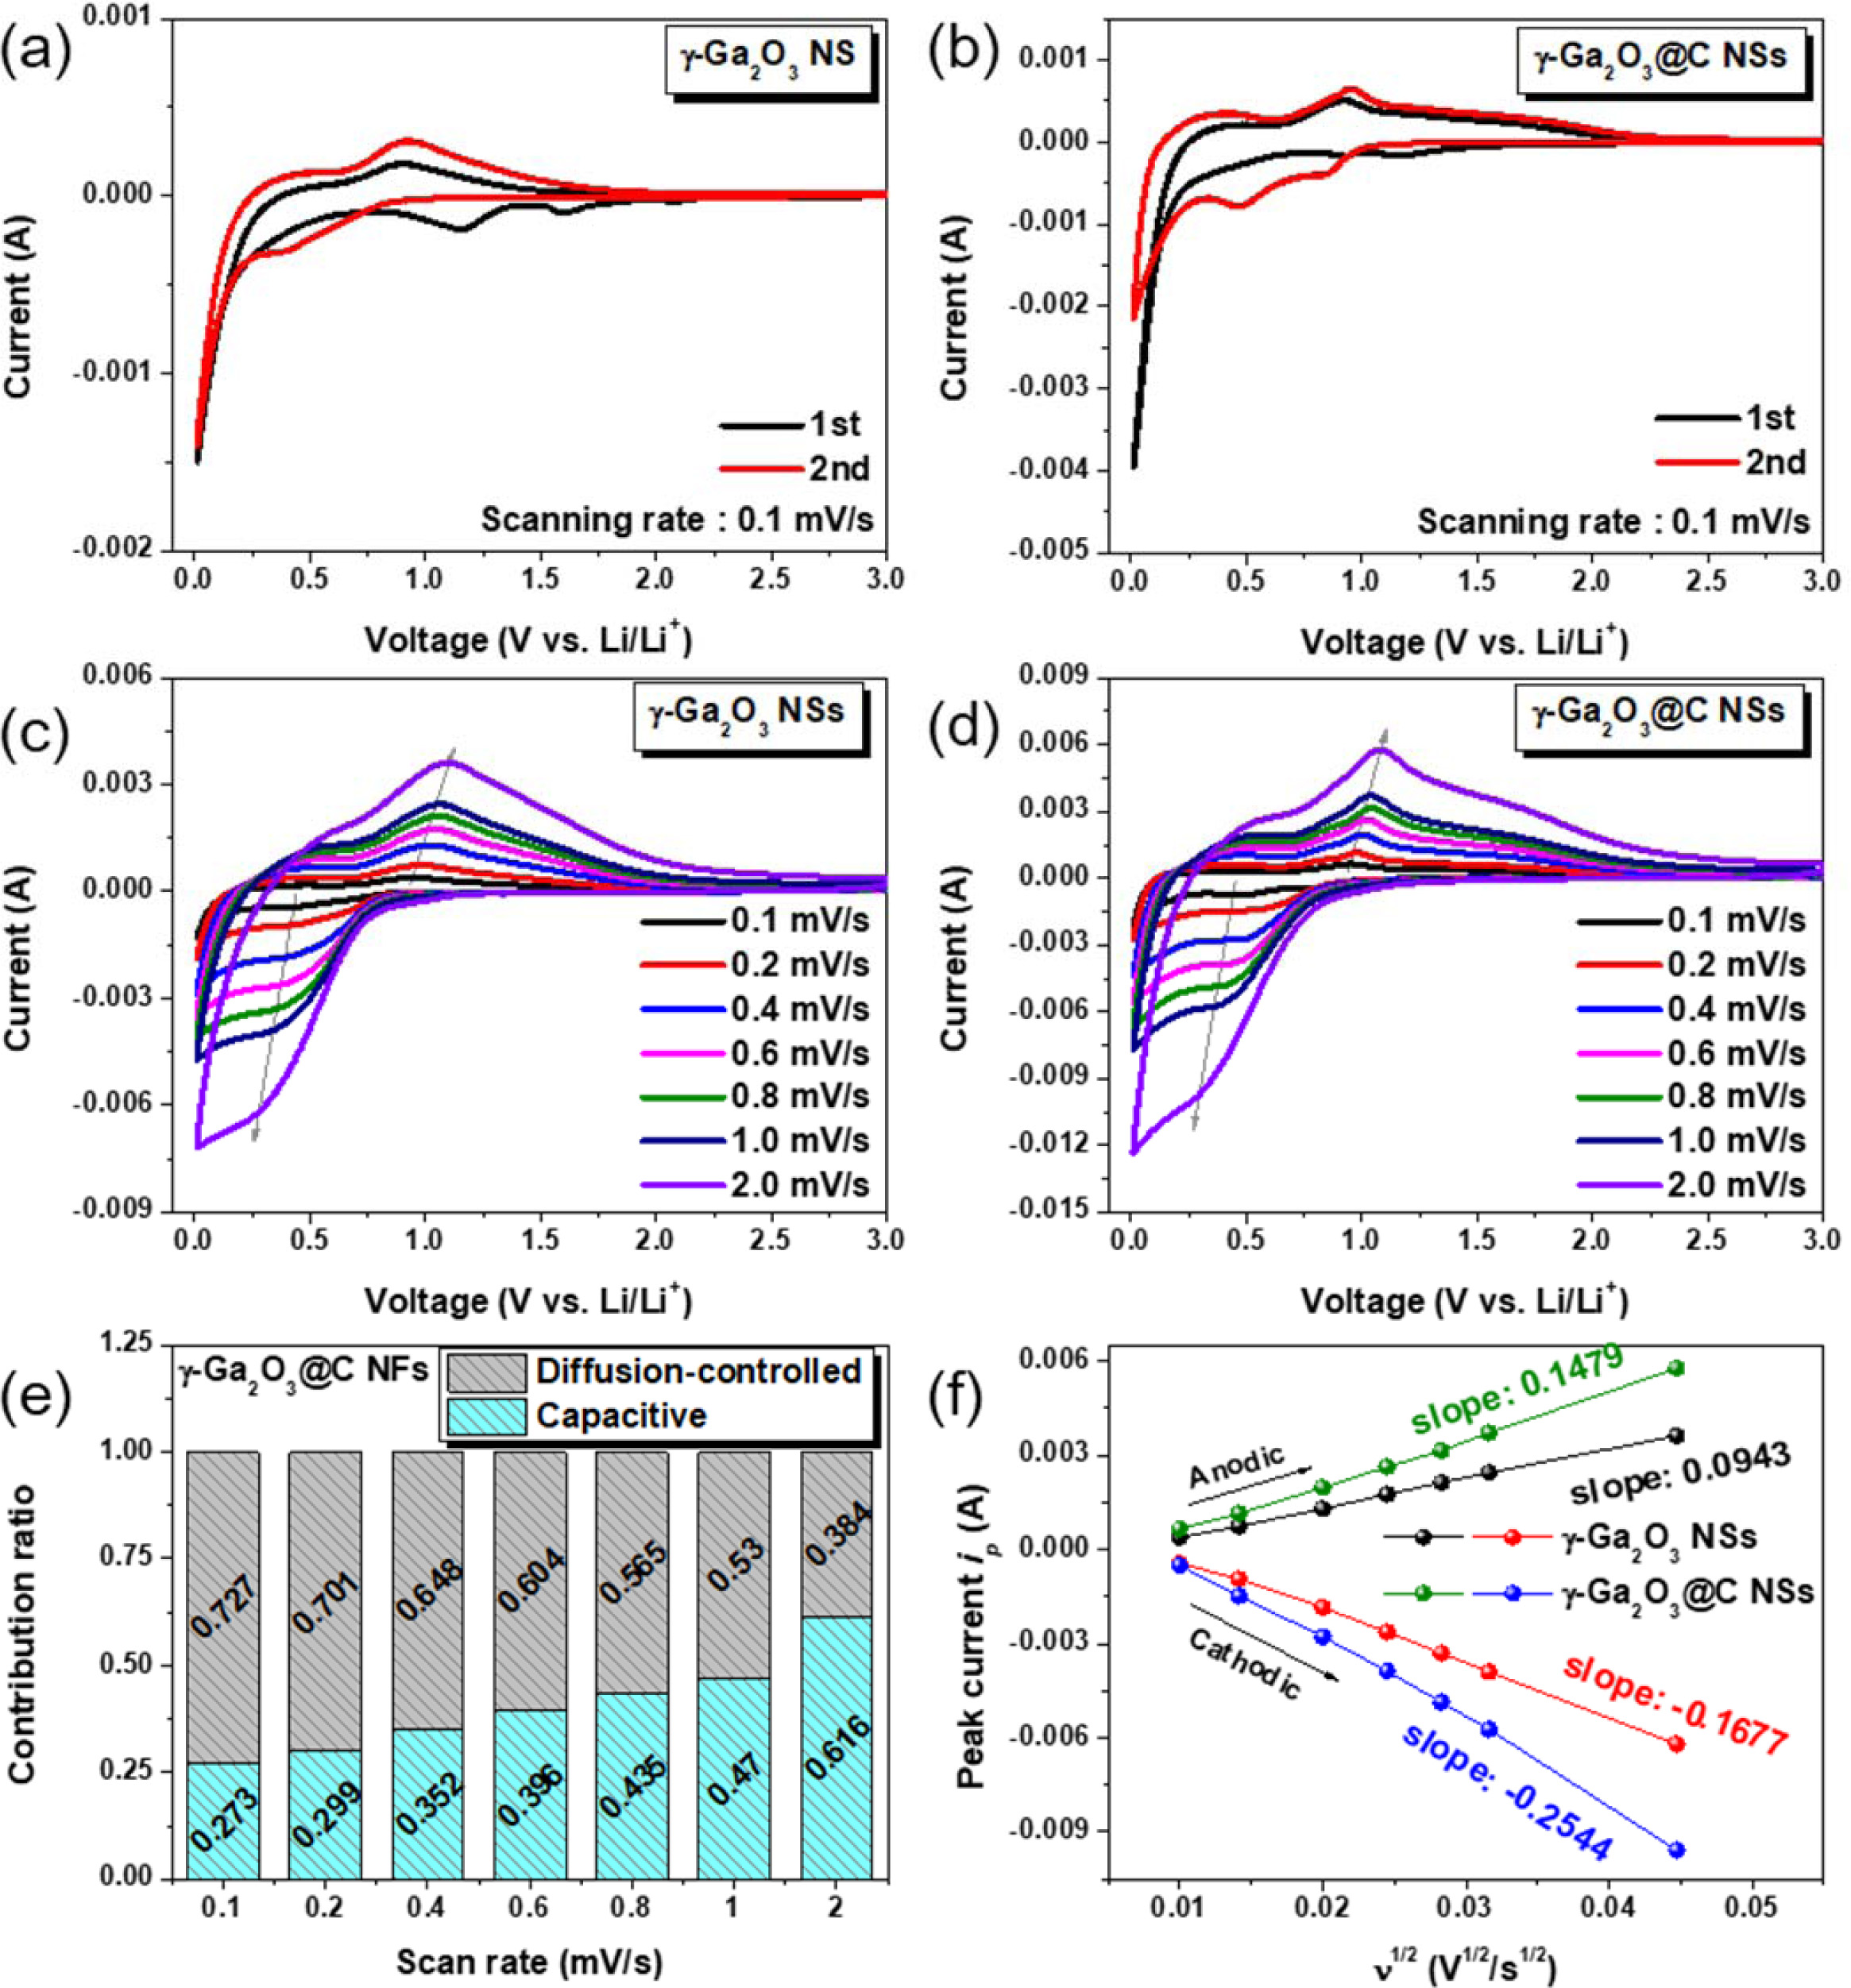
In Fig. 3, the electrochemical performance was evaluated using a half-cell test configuration. Figs. 3(a) and (b) illustrate the CV curves for the first two cycles of γ-Ga2O3 and γ-Ga2O3@C NS half cells, respectively, in the voltage range 0.01-3.00 V (vs. Li/Li+). In Fig. 3(a), the first cathodic scan for the γ-Ga2O3 NS electrode displayed two reduction peaks at approximately 1.6 and 1.2 V, indicating the formation of SEI layers as a result of the decomposition of the carbonate in the electrolyte and the irreversible conversion reaction of Ga2O3, respectively [36, 37]. The broad cathodic peak between 0.25 and 0.01 V and the anodic peaks at approximately 0.25 and 1.1 V were caused by the reversible alloying/dealloying process Ga ↔ LixGa, respectively [38]. In the second cycle, cathodic and anodic peaks were observed at 0.39 and 0.03 V, and 0.25 and 0.94 V, respectively, indicating insufficient lithiation/delithiation for the LixGa ↔Li2Ga (x<2) process. The low electrical conductivity of the γ-Ga2O3 NSs restricted ionic con- duction and, in part, the reversible reaction. Meanwhile, for the γ-Ga2O3@C NS electrode, cathodic peaks are at approximately 0.8, 0.49, and 0.03 V; broad anodic peaks are at approximately 0.25 and 0.94 V; and a broad peak above 1.1 V was observed in the second cycle, as shown in Fig. 3(b). According to Meligrana et al., these peaks could be attributed to the reversible multistep alloying/dealloying process Ga ↔ LiGa, LiGa ↔ Li3Ga2, and Li3Ga2 ↔ Li2Ga. The clear redox peaks observed in the γ-Ga2O3@C NS electrode indicated full lithiation/delithiation according to Li2Ga↔Ga during the charge/discharge process owing to the low resistance of the carbon layer.
Figs. 3(c) and (d) show the CV curves (with varying scan rate) of the γ-Ga2O3 and γ-Ga2O3@C NS electrodes, respectively. When the scan rate was increased, the anodic and cathodic peaks shifted to higher and lower voltages, respectively. This behavior was caused by the polarization of the redox reaction, which affected the electrochemical properties [39-41]. The polarization values of the two electrodes were calculated from the anodic peaks to be approximately 1.1 V, as marked by the arrows in the figures. The measured polarization values of the γ-Ga2O3 and γ-Ga2O3@C NS electrodes were 0.15 and 0.11 V, respectively, indicating that the carbon-coated active materials improved the electro- chemical performance as a result of low polarization.
To investigate the ratio of surface-limited capacitive to diffusion-controlled contributions for the samples, the power law for the relationship between the scan rate and the measured current was used. The total capacitive contribution of the electrode reaction at a fixed scan rate can be determined quantitatively as follows [28, 29, 40, 42]
where i is the current (A) at a specific potential, υ is the scan rate (mV s-1), and k1 and k2 are constants. Here, k1υ and k2υ.1/2 denote the surface capacitive and diffusion-controlled contribution components, respectively. After dividing Eq. (1) by υ1/2 and plotting i υ1/2 vs. υ1/2, we obtained k1 and k2 constants from a straight line with a slope and y-intercept, respectively, providing quantitative information regarding the capacitive and diffusion-controlled contribution values. Accordingly, the capacitive contribution ratio based on the different scan rates for the γ-Ga2O3@C NS electrode is presented in Fig. 3(e). The total capacitive contribution value was 27.3% at a scan rate of 0.1 mV s-1; this value increased to 61.6% at 2 mV s-1.
The peak current ip (A) for the anodic and cathodic scans was plotted against the square root of the scan rate (V1/2 s-1/2), as shown in Fig. 3(f). From Eq. (2), the diffusion coefficient of Li ions (D) can be calculated [10, 22, 28, 29, 40-42] as follows:
where n is 1 for Li ion, A (cm2) is the area of the electrode (1.54 cm2), C (mol cm-3) is the bulk con- centration of Li ions (0.17 mol cm-3 for Li2Ga), D (cm2 s-1) is the diffusion coefficient for Li ions, and υ is the scan rate in the test. The corresponding values of the slopes of ip vs. υ1/2 were calculated and are presented in Fig. 3(f). According to Eq. (2), the values of D for the γ-Ga2O3@C NS electrode were calculated to be 1.36× 10⁻¹¹ cm2 s-1 for the lithiation process and 4.60×10⁻¹¹ cm2 s-1 for the delithiation process. These values were higher than those (5.91×10⁻¹² cm2 s-1 for the lithiation process and 1.87×10⁻¹² cm2 s-1 for the delithiation process) obtained for the γ-Ga2O3 NS electrode.
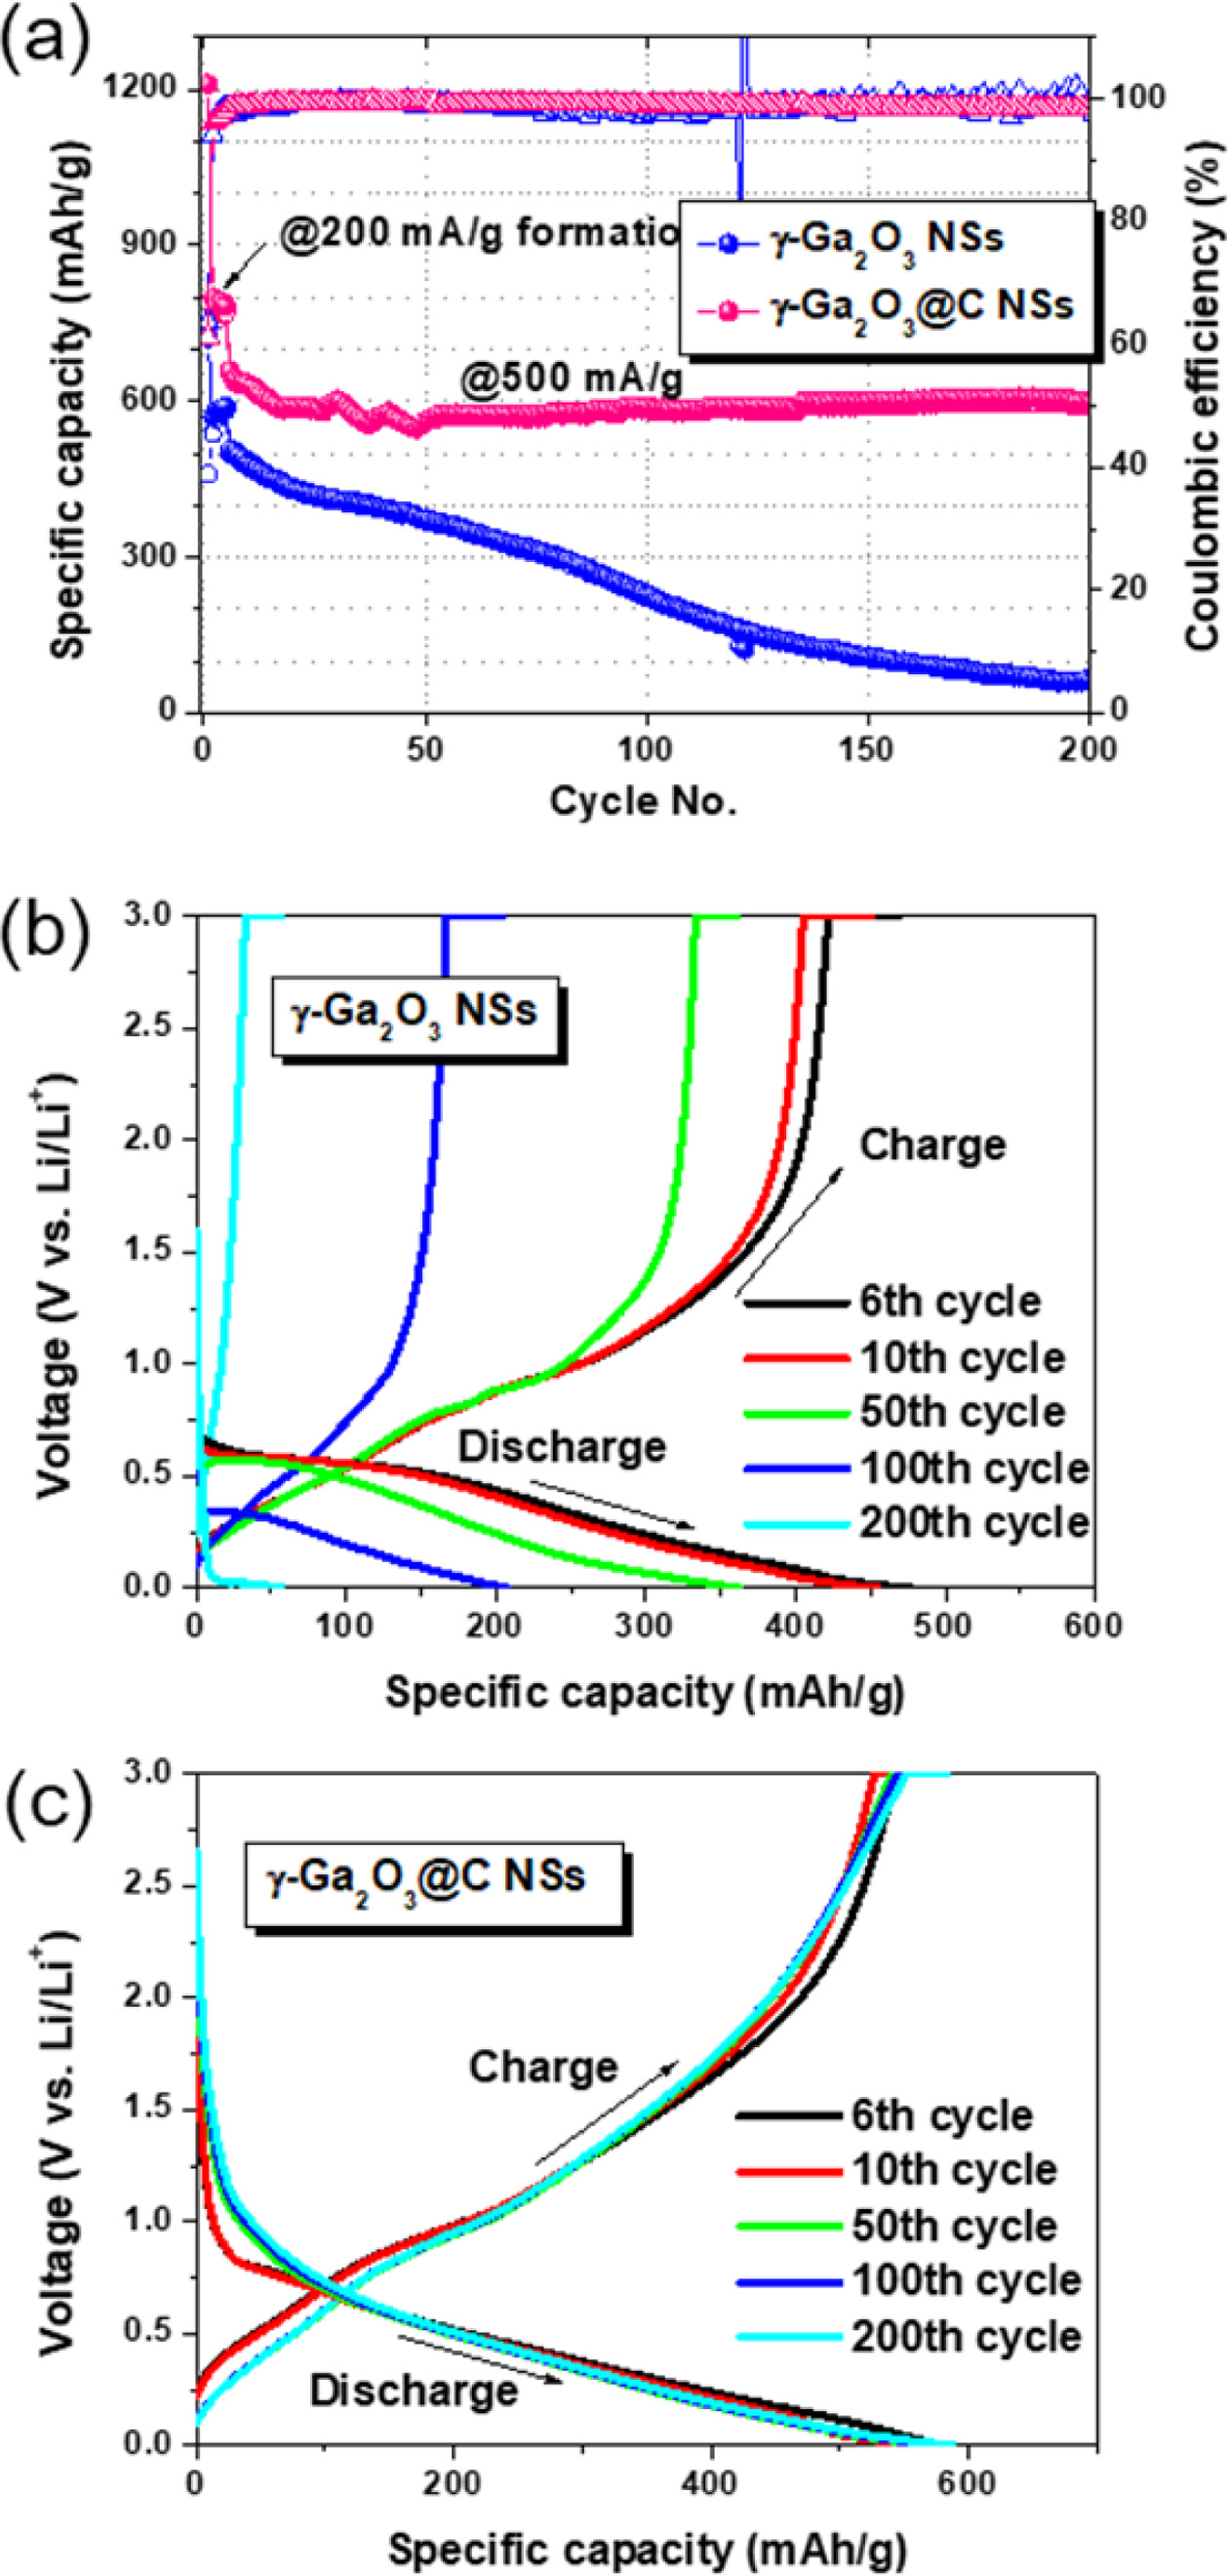
The sample stability test was carried out by cycling the galvanostatic charge–discharge process, as shown in Fig. 4(a). All cells were initially cycled five times at 0.2 A g-1 to form a stable SEI layer; the cells were subsequently tested at 0.5 A g-1. The discharge specific capacity of the γ-Ga2O3@C NS electrode remained constant at 598 mAh g-1 at 200 cycles and showed good cycling stability owing to the carbon-coating layers. By contrast, when the pure γ-Ga2O3 NS electrode was cycled, the specific capacity rapidly decreased from 506.9 mA g-1 at 6 cycles to 60.2 mA g-1 at 200 cycles, thereby indicating inferior performance. This result could be attributed to the enhancement of the electrical conductivity and low charge transfer resistance provided by the carbon coating. In Figs. 4(b) and (c), the charge-discharge curves at specific cycle numbers (6, 10, 50, 100, and 200 cycles) for the γ-Ga2O3 and γ-Ga2O3@C NS electrodes are illustrated in the voltage range 0.01-3.00 V (vs. Li/Li+) and at 0.5 A g-1. The galvanostatic charge–discharge curves showed similar behavior, as shown in Fig. 4(a).
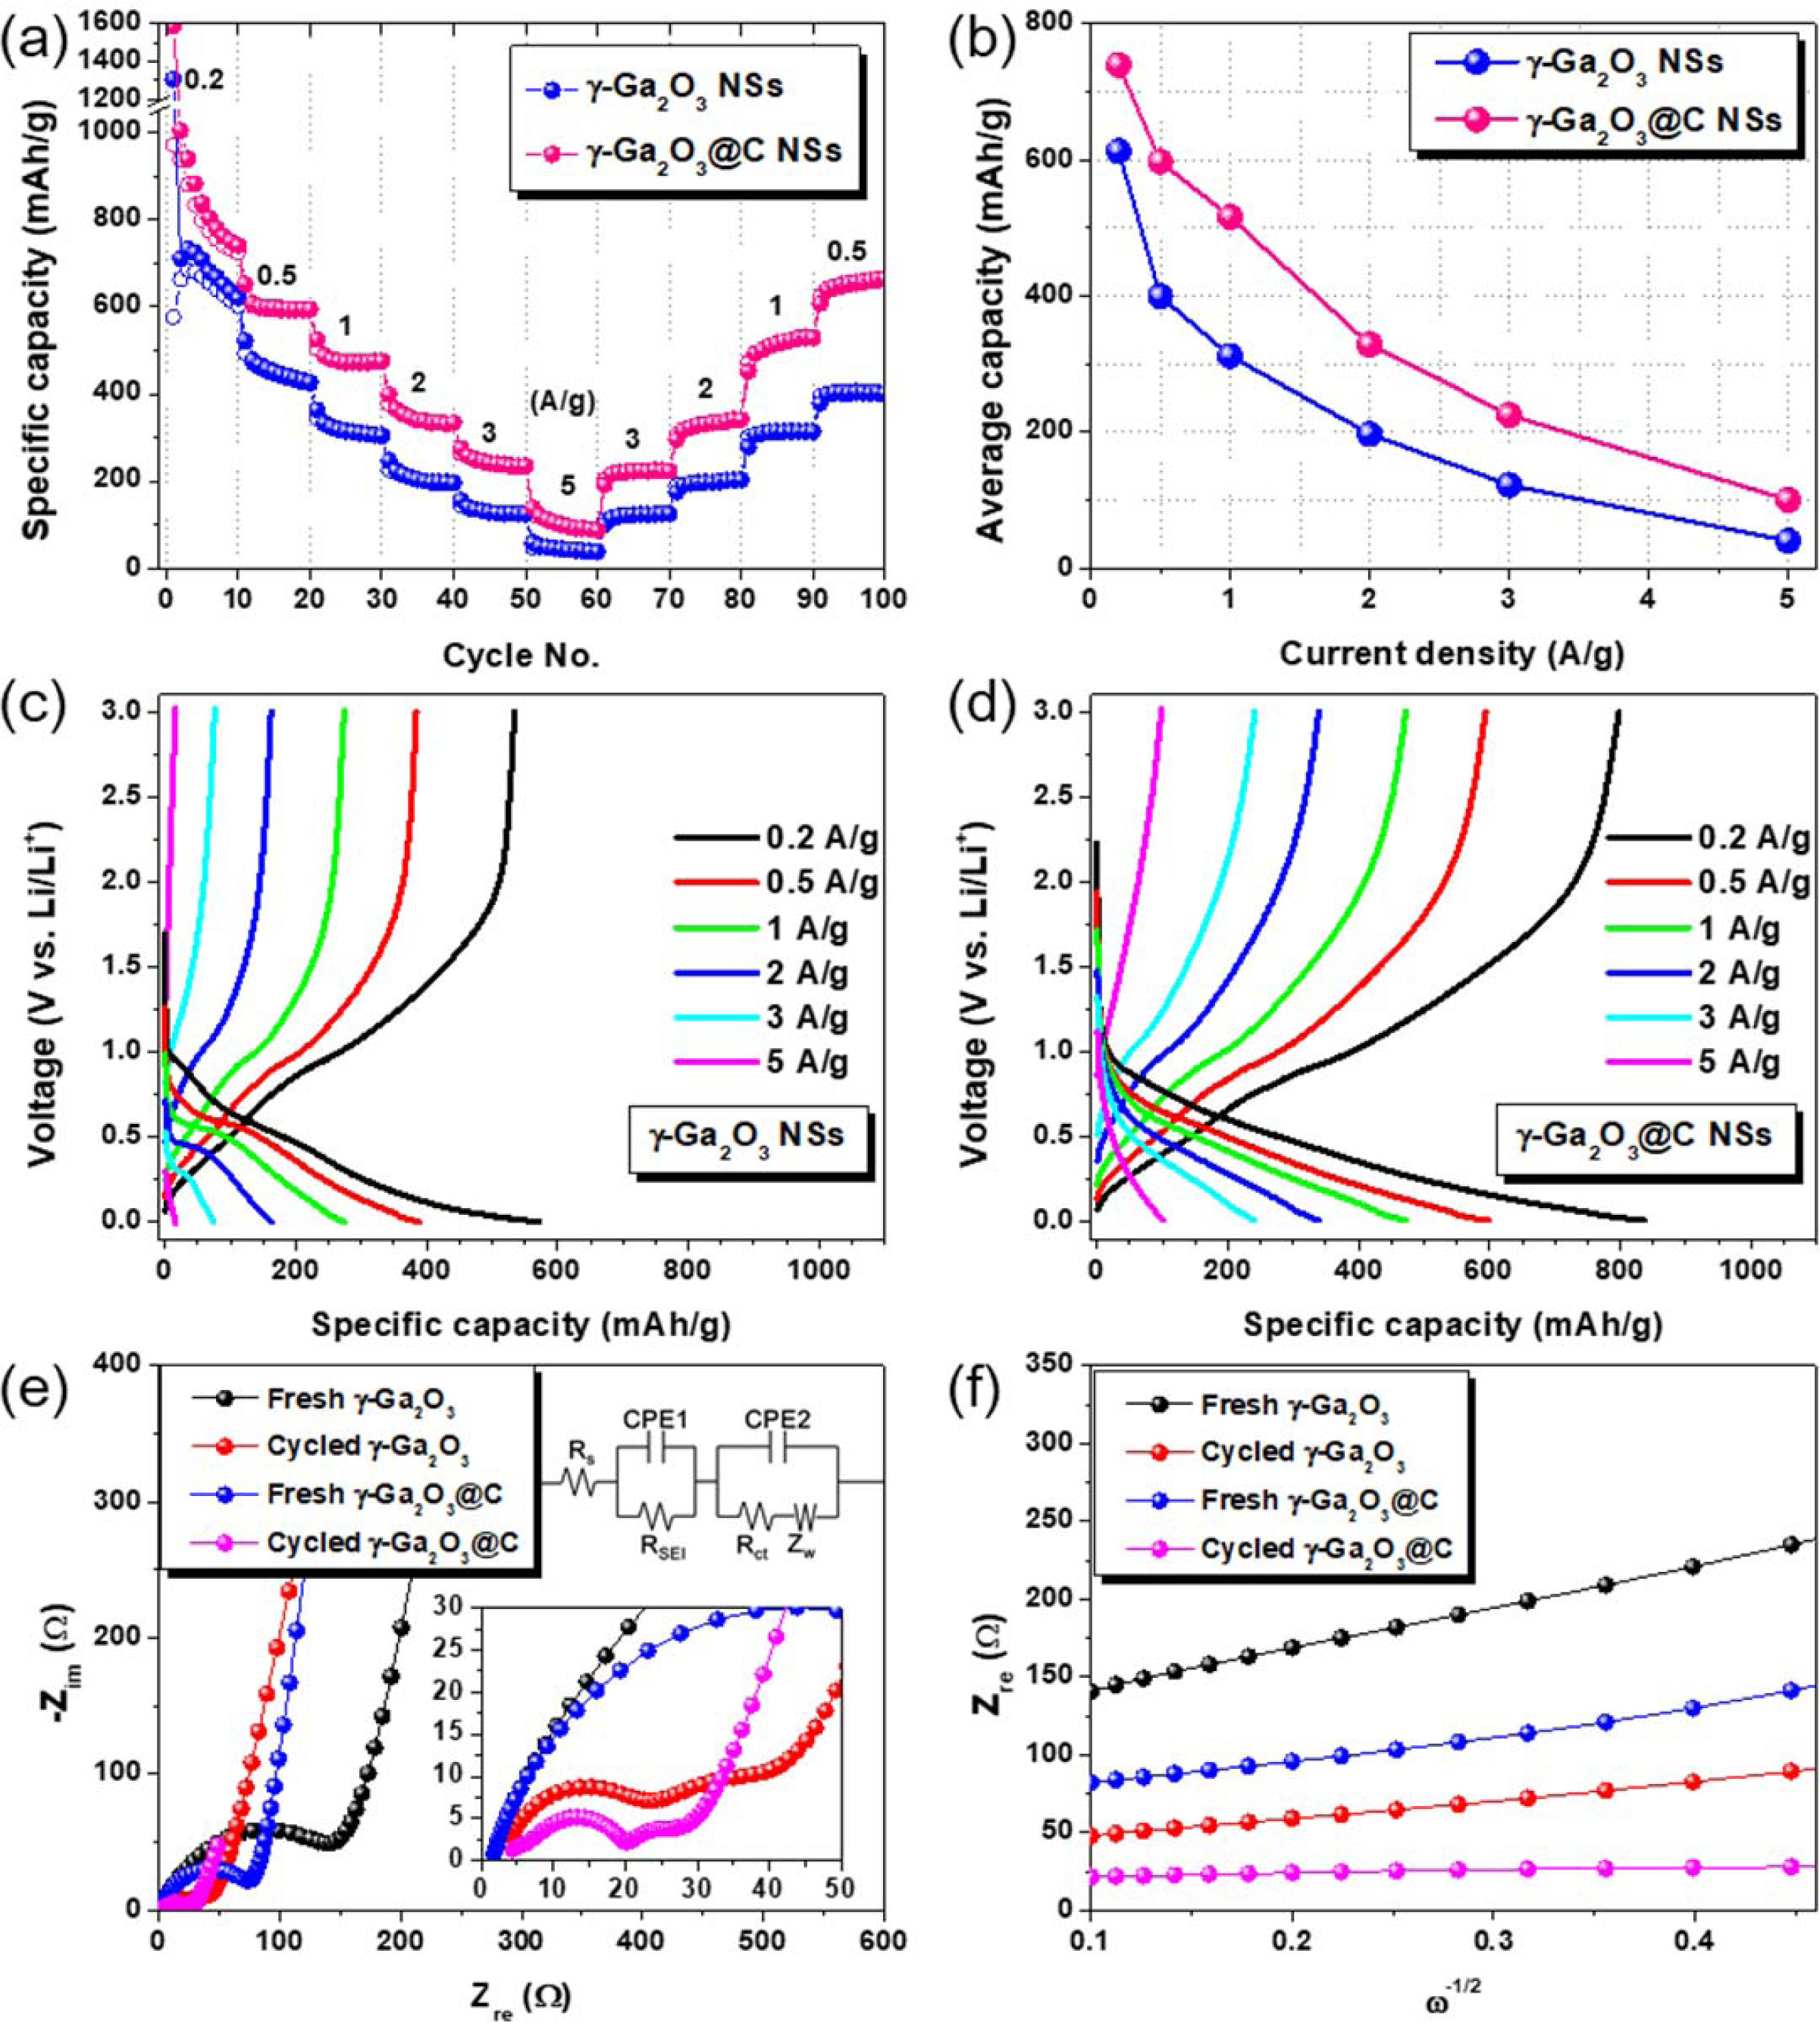
The specific capacities of the γ-Ga2O3 and γ-Ga2O3@C NS electrodes as a function of the current density were compared, as shown in Fig. 5(a). Each rate test was performed for 10 cycles. The γ-Ga2O3@C NS electrode exhibited excellent rate performance with discharge capacities of 740, 598, 516, 329, 225, and 100 mAh g-1 at 0.2, 0.5, 1, 2, 3, and 5 A g-1, respectively. The γ-Ga2O3 NS electrode delivered lower discharge capacities of 613, 400, 312, 197, 122, and 40 mAh g1, respectively, at the same current densities. The average specific capacities at different current densities are presented in Fig. 5(b). The decrease in the specific capacity as the current density increased was smaller for the carbon-coated electrode, indicating excellent charge transfer and demonstrating that the diffusion behavior of Li ions occurred even at high current densities. In Fig. 5(c) and (d), the galvanostatic charge/discharge curves for the γ-Ga2O3 and γ-Ga2O3@C NS electrodes, in the current densities range of 0.2-5 A g-1, are presented, respectively. In both curves, for both samples, charge/discharge plateaus were formed at the same potential, regardless of the current density; these were considered to be due to the alloying/dealloying reactions between Ga and Li. The specific discharge capacity of the γ-Ga2O3@C NS electrode was 740 mAh g-1 at 0.2 A/g, which is close to the theoretical specific capacity (798 mAh g-1) of the Li2Ga alloy. The variation in the resistances of the samples before and after cycling was evaluated by EIS measurements. Fig. 5(e) shows typical Nyquist plots for the fresh and cycled samples. The resistances (Rs, RSEI, and Rct) and diffusion coefficients (DLi+) were calculated by fitting the EIS data using equivalent circuit models and the following equations:
where R, T, A, n, F, CLi, and ω are the gas constant, absolute temperature, area of the electrode, number of electrons in the reaction, Faraday’s constant, concentration of Li ions, and angular frequency (ω=2πf), respectively. The Warburg factor, σ, is determined by the slope of the Zre vs. ω-1/2 plot in the low-frequency region, as shown in Fig. 5(f).
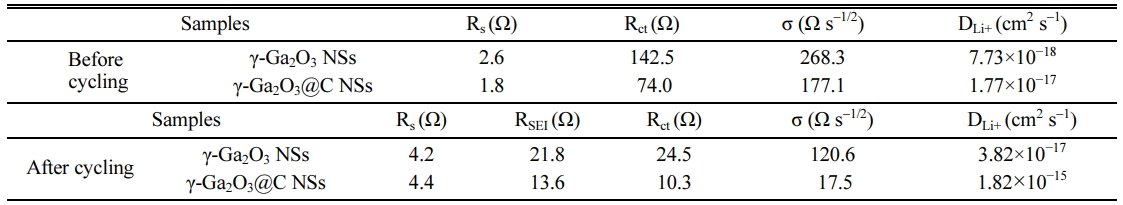
The values of Rs, RSEI, Rct, σ, and DLi+ were calculated using Eqs. (3) and (4) for the pristine and cycled γ-Ga2O3 and γ-Ga2O3@C NS electrodes; they are listed in Table 1. The charge-transfer resistance (Rct) of the γ-Ga2O3@C NS electrode was two times higher than that of the γ-Ga2O3 NS electrode in both the pristine and cycled cells. These results indicate that the carbon coating increases the conductivity related to the charge transfer through the electrode, resulting in superior electrochemical performance compared to the uncoated electrode. After cycling, the σ values for both samples decreased. The value of σ for the γ-Ga2O3@C NS electrode was lower (17.5 Ω s-1/2) than that of the γ-Ga2O3 NS electrode (120.6 Ω s-1/2), indicating efficient Li ion diffusion into the active materials. Furthermore, the γ-Ga2O3@C NS electrode presented a DLi+ of 1.82×10⁻¹⁵ cm2 s-1, significantly higher than the 3.82× 10⁻¹⁷ cm2 s-1 of the γ-Ga2O3 NS electrode. The excellent Li ion diffusion ability of the γ-Ga2O3@C NSs can be ascribed to the high charge transfer behavior afforded by the carbon coating on the γ-Ga2O3 NSs.
|
Fig. 1 XRD patterns of the hydrothermally synthesized γ-Ga2O3 and γ-Ga2O3@C NSs. |
|
Fig. 2 FE-SEM images of (a) γ-Ga2O3 NSs and (b) γ-Ga2O3@C NSs. (c) TGA curves for γ-Ga2O3 NSs and γ-Ga2O3@C NSs. (d) Low magnification TEM image, (e) HAADF image, and (f) the overlapped elemental mapping of gallium (red), oxygen (blue), and carbon (green) of the γ-Ga2O3@C NSs |
|
Fig. 3 CV curves (a, b) at a scan rate of 0.1 mV s−1 and (c, d) at various different scan rates for γ-Ga2O3 and γ-Ga2O3@C NS electrodes, respectively. (e) The contribution ratio of the diffusion-controlled and surface capacitive area in the CV curves as a function of the scan rate. (f) peak current values as a function of root mean square of scan rate. |
|
Fig. 4 (a) Charge/discharge cycle performance in the voltage range 0.01–3.00 V at 0.5 A g−1 , and (b, c) galvanostatic charge/ discharge voltage profiles for cycles 6, 10, 50, 100, and 200 at 0.5 A g−1 for γ-Ga2O3 and γ-Ga2O3@C NS electrodes, respectively. |
|
Fig. 5 (a) Rate performance, (b) average specific capacity vs. the current density, and (c, d) galvanostatic charge/discharge curves for the Crate from 0.2 to 5 A g−1 for γ-Ga2O3 NS, and γ-Ga2O3@C NS electrodes, respectively. (e) Nyquist plots and (f) graph of Zre vs. ω–1/2 for the pristine and the cycled γ-Ga2O3 and γ-Ga2O3@C NS electrodes. The inset in (e) shows the semi-circle of the Nyquist plots in the highfrequency region and equivalent circuit used for simulation. |
|
Table 1 Electrochemical impedance parameters and diffusion coefficients of Li ions obtained from the Nyquist plots and Eqs. (3) and (4). |
We demonstrated the synthesis of peony-flower-like carbon-coated γ-Ga2O3 nanosheets using simple hydrothermal carbonization. The γ-Ga2O3@C NS electrode exhibited an excellent reversible capacity of 598 mAh g-1 at 0.5 A g-1 over 200 cycles and a good rate performance of 100 mAh g-1 at 5 A g-1. These results can be attributed to the enhanced charge transfer behavior as a result of the large specific area provided by the conductive carbon-coated nanosheets. Therefore, the findings of this study indicate that γ-Ga2O3@C NSs may lead to a new anode material with improved cycle stability and high energy density for applications in LIBs.
This work was supported for two years by a Pusan National University Research Grant.
- 1. J.-M. Tarascon, and M. Armand, Nature 414[6861] (2001) 359-367.
-

- 2. A.S. Aricò, P. Bruce, B. Scrosati, J.-M. Tarascon, and W.V. Schalkwijk, Nat. Mater. 4[5] (2005) 366-377.
-
- 3. L. Lu, X. Han, J. Li, J. Hua, and M. Ouyang, J. Power Sources 226 (2013) 272-288.
-
- 4. S.B. Peterson, J. Apt, and J.F. Whitacre, J. Power Sources 195[8] (2010) 2385-2392.
-
- 5. M. Armand, and J.-M. Tarascon, Nature 451[7179] (2008) 652-657.
-
- 6. P.G. Bruce, B. Scrosati, and J.-M. Tarascon, Angew Chem., Int. Ed. 47[16] (2008) 2930-2946.
-
- 7. Y. Sun, N. Liu, and Y. Cui, Nat. Energy 1[7] (2016) 16071.
-
- 8. M. Yoshio, H. Wang, K. Fukuda, T. Umeno, T. Abe, and Z. Ogumi, J. Mater. Chem. 14[11] (2004) 1754-1758.
-
- 9. N.A. Kaskhedikar, and J. Maier, Adv. Mater. 21[25-26] (2009) 2664-2680.
-
- 10. D. Pham-Cong, S.J. Kim, S.Y. Jeong, J.-P. Kim, H.G. Kim, P.V. Braun, and C.R. Cho, Carbon 129 (2018) 621-630.
-
- 11. L. Ji, Z. Lin, M. Alcoutlabi, and X. Zhang, Energy Environ. Sci. 4[8] (2011) 2682-2699.
-
- 12. M.V. Reddy, G.V. Subba Rao, and B.V.R. Chowdari, Chem. Rev. 113[7] (2013) 5364-5457.
-
- 13. L. Zhang, H.B. Wu, and X.W.D. Lou, Adv. Energy Mater. 4[4] (2014) 1300958.
-
- 14. A. Casimir, H. Zhang, O. Ogoke, J.C. Amine, J. Lu, and G. Wu, Nano Energy 27 (2016) 359-376.
-
- 15. H. Tian, F. Xin, X. Wang, W. He, and W. Han, J. Materiomics 1[3] (2015) 153-169.
-
- 16. X. Li, Z. Yang, Y. Fu, L. Qiao, D. Li, H. Yue, and D. He, ACS Nano 9[2] (2015) 1858-1867.
-
- 17. S. Yuvaraj, M.-S Park, V.G. Kumar, Y.S. Lee, and D.-W. Kim, J. Electrochem. Sci. Technol. 8[4] (2017) 323-330.
-
- 18. J. Wang, L. Wang, Y. Ma, and S. Yang, Mater. Lett. 228 (2018) 297-300.
-
- 19. G. Meligranam W. Lueangchaichaweng, F. Colò, M. Destro, S. Fiorilli, P.P. Pescarmona, and C. Gerbaldi, Electrochim. Acta 235 (2017) 143-149.
-
- 20. X. Tang, X. Huang, Y. Huang, Y. Gou, J. Pastore, Y. Yang, Y. Xiong, J. Qian, J.D. Brock, J. Lu, L. Xiao, H.D. Abruňa, and L. Zhuang, ACS Appl. Mater. Interfaces 10[6] (2018) 5519-5526.
-
- 21. J. Mao, T. Zhou, Y. Zheng, H. Gao, H.K. Liu, and Z. Guo, J. Mater. Chem. A 6[8] (2018) 3284-3303.
-
- 22. S. Chen, Y. Xin, Y. Zhou, Y. Ma, H. Zhou, and L. Qi, Energy Environ. Sci. 7[6] (2014) 1924-1930.
-
- 23. Y. Cheng, J. Huang, L. Cao, H. Xie, Y. Wang, Y. Wang, H. Wu, S. Xi, and J. Li, Ionics 26[6] (2020) 2855-2862.
-
- 24. Y. Sha, B. Zhao, R. Ran, R. Cai, and Z. Shao, J. Mater. Chem. A 1[42] (2013) 13233-13243.
-
- 25. J. Choi, J. Jin, I.G. Jung, J.M. Kim, H.J. Kim, and S.U. Son, Chem. Commun. 47[18] (2011) 5241-5243.
-
- 26. L. Xu, Y. Tian, T. Liu, H. Li, J. Qiu, S. Li, H. Li, S. Yuan, and S. Zhang, Green Energy Environment 3[2] (2018) 156-162.
-
- 27. J. Wan, A.F. Kaplan, J. Zheng, X. Han, Y. Chen, N.J. Weadock, N. Faenza, S. Lacey, T. Li, J. Guo, and L. Hu, J. Mater. Chem. A 2[17] (2014) 6051-6057.
-
- 28. D. Pham-Cong, J.H. Choi, J. Yun, A.S. Bandarenka, J. Kim, P.V. Braun, S.Y. Jeong, and C.R. Cho, ACS Nano 11[1] (2017) 1026-1033.
-
- 29. L. Yin, D. Pham-Cong, I. Jeon, J.-P. Kim, J. Cho, S.-Y. Jeong, H.W. Lee, and C.R. Cho, Chem. Eng. J. 382 (2020) 122800.
-
- 30. X. Zhang, Z. Zhang, H. Huang, Y. Wang, N. Tong, J. Lin, D. Liu, and X. Wang, Nanoscale 10[45] (2018) 21509-21517.
-
- 31. Y. Teng, L.X. Song, A. Ponchel, Z.K. Yang, and J. Xia, Adv. Mater. 26[36] (2014) 6238-6243.
-
- 32. Y.Q. Wang, L.X. Song, Y. Teng, F. Wang, W.P .Wang, M.M. Ruan, Z. Yang and Z.Y. Xu, J. Mater. Chem. C 7[6] (2019) 1477-1483.
-
- 33. J.-K. Lee, and J.-R. Yoon. J. Ceram. Process. Res. 21[5] (2020) 533-538.
-
- 34. T. Wang, and P.V. Radovanovic, J. Phys. Chem. C 115[38] (2011) 18473-18478.
-
- 35. S. Yochioka, H. Hayashi, A. Kuwabara, F. Oba, K. Matsunaga, and I. Tanaka, J. Physics: Condens. Matter 19[34] (2007) 346211.
-
- 36. A. Bouibes, N. Takenaka, T. Fujie, K. Kubogta, S. Komaba, and M. Nagaoka, ACS Appl. Mater. Interfaces 10[34] (2018) 28525-28532.
-
- 37. M. Valvo, F. Lindgren, U. Lafont, F. Björefors, and K. Edström, J. Power Sources 245 (2014) 967-978.
-
- 38. J. Saint, M. Morcrette, D. Larcher, and J.M. Tarascon, Solid State Ionics 176[1-2] (2005) 189-197.
-
- 39. X. Zhu, X. Song, X. Ma, and G. Ning, ACS Appl. Mater. Interfaces 6[10] (2014) 7189-7197.
-
- 40. J. Liu, J. Wang, C. Xu, H. Jiang, C. Li, L. Zhang, J. Lin, and Z.X. Shen, Adv. Sci. 5[1] (2018) 1700322.
-
- 41. W. Deng, X. Feng, X. Li, S. O'Neill, L. Hu, L. Liu, W.-Y. Wong, Y.-Y. Hu, and C.M. Li, Chem. Commun. 54[100] (2018) 14120-14123.
-
- 42. L. Yin, Y.J. Gao, I. Jeon, H. Yang, J.-P. Kim, S.Y. Jeong, and C.R. Cho, Chem. Eng. J. 356 (2019) 60-68.
-
 This Article
-
2021; 22(2): 192-199
Published on Apr 30, 2021
- 10.36410/jcpr.2021.22.2.192
- Received on Sep 1, 2020
- Revised on Dec 3, 2020
- Accepted on Dec 29, 2020
Services
- Abstract
introduction
experimental
results and discussion
conclusions
- Acknowledgements
- References
- Full Text PDF
Shared
Correspondence to
- Ryong Cho
-
aDepartment of Nano Fusion Technology, Pusan National University, Busan 46241, S. Korea
bDepartment of Nanoenergy Engineering, Pusan National University, Busan 46241, S. Korea
Tel : +82-55-350-5297 Fax: +82-51-514-2358 - E-mail: crcho@pusan.ac.kr
Clean-Energy Research Institute(CRI), Hanyang University, 222, Wangsimni-ro, Seongdong-gu, Seoul, 04763, Korea
E-mail: jcpr@hanyang.ac.kr