


- Thermal oxidation temperature effect on the phases and photocatalytic properties of silver-doped TiO2 thin film prepared by co-sputtering
Hui-Ru Xua, Ping-Yuan Leeb, Ya-Wei Tsaia and Ying-Chieh Leea,*
aDepartment of Materials Engineering, National Pingtung University of Science & Technology, Pingtung 91201, Taiwan
bDepartment of Materials Science and Engineering, National Cheng Kung University, Tainan, 701 TaiwanThis article is an open access article distributed under the terms of the Creative Commons Attribution Non-Commercial License (http://creativecommons.org/licenses/by-nc/4.0) which permits unrestricted non-commercial use, distribution, and reproduction in any medium, provided the original work is properly cited.
Titanium dioxide thin films with silver dopant (Ag-TiO2) were successfully prepared on glass substrates using the thermal oxidation method. Ag-doped titanium films were prepared using direct current (DC) and radio frequency (RF) magnetron co-sputtering systems. The thermal oxidation temperature and Ag content effects on the phase evolution, microstructure, and photo catalytic activity of TiO2 film were studied. The crystalline structures and photo catalytic activity of the annealed Ag-doped TiO2 films were methodically investigated using transmission electron microscopy (TEM), field emission scanning electron microscopy (FESEM), X-ray diffraction (XRD), and ultraviolet spectrophotometry. The results exhibited that the thermal oxidation process at 550 oC clearly caused rutile phase formation in the 2.7% Ag-doped TiO2 films directly affecting the photo catalytic activity. The Ag-doped TiO2 films showed good photo catalytic activity under UV-light radiation, with 59% methylene blue dye degradation rate
Keywords: Ag-doped TiO2 film, Thermal oxidation, UV induced photo catalysis, Co-sputtering
TiO2 material is a semiconductor that has important photoactive characteristics. It is the most studied photo catalyst due to its high efficiency, nontoxicity, chemical and long-term stability, and low cost [1]. In particular, the TiO2 rutile and anatase phases are used primarily as a photo catalyst [2, 3]. However, the anatase phase commonly has higher level photo catalytic activity than the rutile phase.
TiO2 films can be fabricated using titanium film thermal oxidation [4]. The thermal oxidation method is applied after Ti films are sputtered. Therefore, this process is highly efficient, low-cost and convenient [5]. The additional introduction of reactive gas during sputtering deposition can be avoided and achieves a high growth rate.
Silver metal has been known as effective antimicrobial agents for centuries, owing to a width antibacterial activity and low toxicity towards cells [6]. Several papers researched silver-doped titanium dioxide Nano particles or thin films, because of their effects on TiO2 photo catalytic activity [7-9]. Ag-doped TiO2 can be prepared using a photo deposition process, chemical reduction, thermal deposition, pulsed laser deposition and co-sputtering [10-14].
In this study, Ag-doped TiO2 thin films were prepared onto glass using co-sputtered titanium and silver by thermal oxidation processing. The Ag amount and thermal oxidation temperature effects on the crystalline structures and photo catalytic activity Ag-TiO2 thin film were investigated. The Ag-TiO2 film photo catalytic performance was analyzed using degrading methylene blue dye under UV irradiation.
Titanium and silver with a diameter of 76.2 mm and 5 mm thicknesses were used as targets. The titanium target was fixed at the DC place. The silver target was fixed at the RF place. To get different Ag amount in the titanium films, the DC power is set at 100 W and the RF power is adjusted from 10 W to 30 W. A base pressure of 6.66×10⁻⁵ Pa in the sputtering chamber was set. Magnetron sputtering was carried out in a high purity Ar (99.999%) atmosphere at a flowrate of 60 sccm using mass flow controllers. The working pressure was set at 0.4 Pa. Ti and Ag-doped Ti films were deposited onto (001) Si wafers and glass at 25 oC. These as-deposited films were thermal oxidation in air at temperatures of 450, 500 and 550 oC for 6 h.
Film phase structure was determined by X-ray dif- fraction (XRD, Bruker D8A Germany). Microstructural and thickness observations of thin film cross-sections were analyzed with field-emission scanning electron microscopy (FE-SEM, Hitachi S-4700 Japan). The microstructure of films was analyzed using a field-emission transmission electron microscope (FE-TEM, FEIE.O. Tecnai F20) equipped with an energy-dispersive spectrometer.
The Ag-TiO2 film photo catalytic was determined with C16H18N3SCl (Methylene Blue, MB) decomposition solution. The samples were immersed in MB solution at an initial concentration (10 mg/L) in distilled water (10 mL), which was irradiated by UV light (~253 nm). The UV-vis spectrophotometer (U-3310, Hitachi Ltd., Japan) is used.
Antibacterial activity test: raw eggs were placed into coated and uncoated egg glasses. The eggs were irradiated with UV light for 15 min. The surface bacteria were cultured at 37 oC for 24 h. A number of 3M bacteria were transferred onto test paper to calculate the total number of bacteria in the area. The analysis results calculated the total number of bacteria on the raw egg surface using the 3M rapid test strip. The experiments were repeated 6 times.
Ag-TiO2 thin films
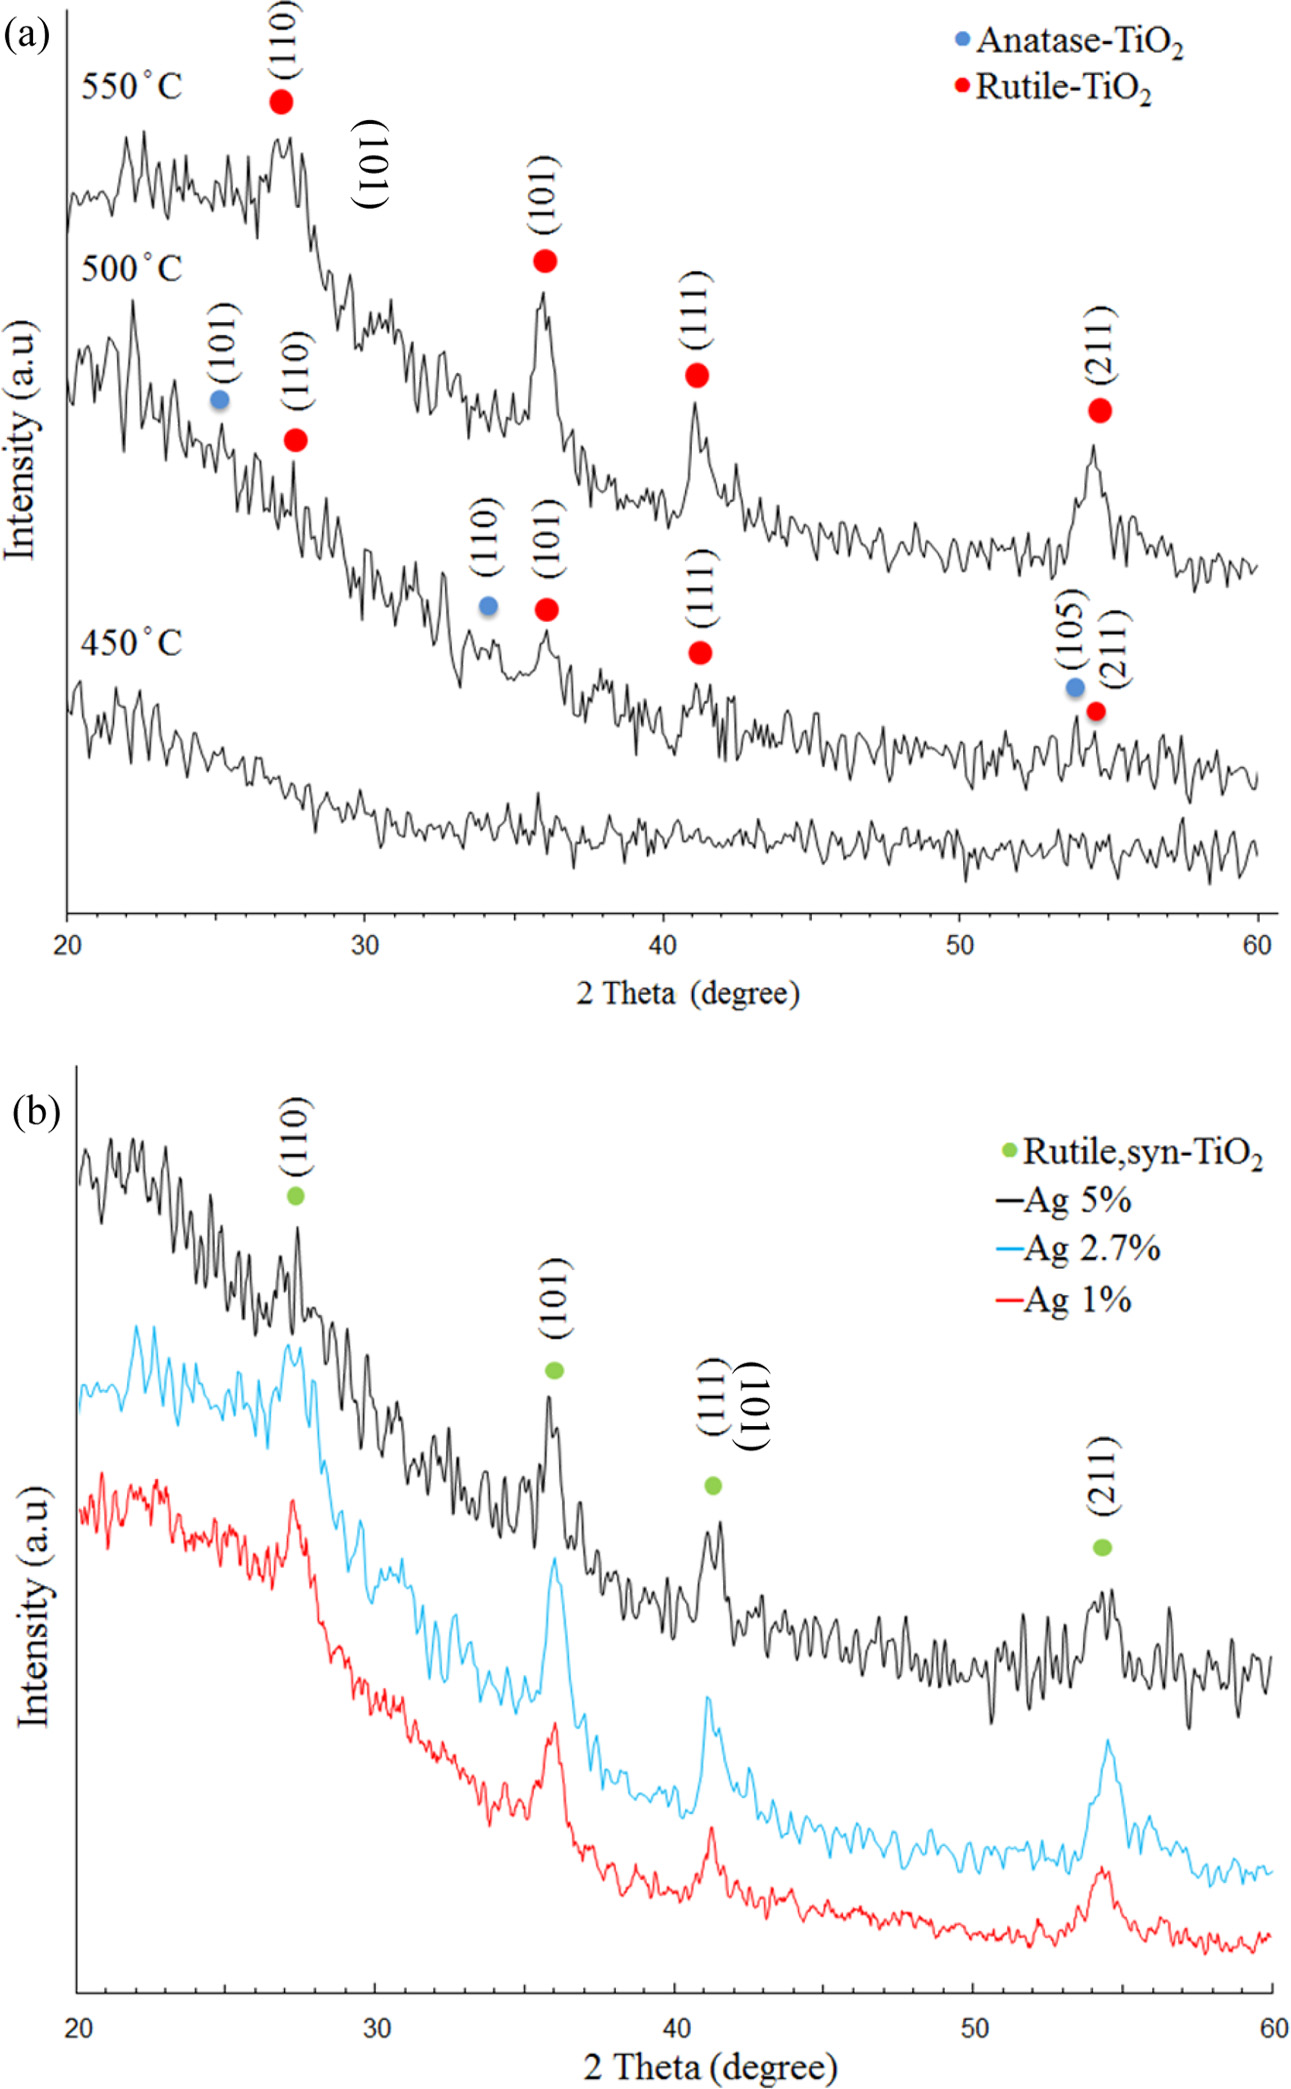
To study the TiO2 crystal structure changes influenced by Ag doping, XRD analysis was executed in the 2θ = 20o~60o range for different Ag contents and at different thermal oxidation temperatures, as shown in Fig. 1. The Ti films XRD patterns with 2.7 at.% Ag addition annealed at a temperature range of 450~550 oC is shown in Fig. 1(a). The intensity of crystallinity increased gradually with increasing thermal oxidation temperatures. An amorphous structure was observed in the Ag-doped Ti films treated at 450 oC. The rutile and anatase mixture phases coexisted at 500 oC. When the annealing reached 550 oC, the characteristic peaks at 27.4, 36.1, 41.4 and 55.0 corresponding to the rutile phase were found but intensity of anatase peaks reduced obviously. It is deduced that the anatase transition temperature into rutile phase is about 500 oC in the Ag-doped Ti films. Ti films with different Ag dopants were annealed at 550 oC as shown in Fig. 1(b). For all films heat treated at 550 oC for 6 h in air, the resultant films exhibited a pure rutile phase structure. No anatase TiO2 was detected in this investigation, when films were subjected to 550 oC temperature. It could be explained that a significant quantity of oxygen vacancies in the oxidized film is existed. This is known to evidently accelerate the anatase-to-rutile transformation [15-17].
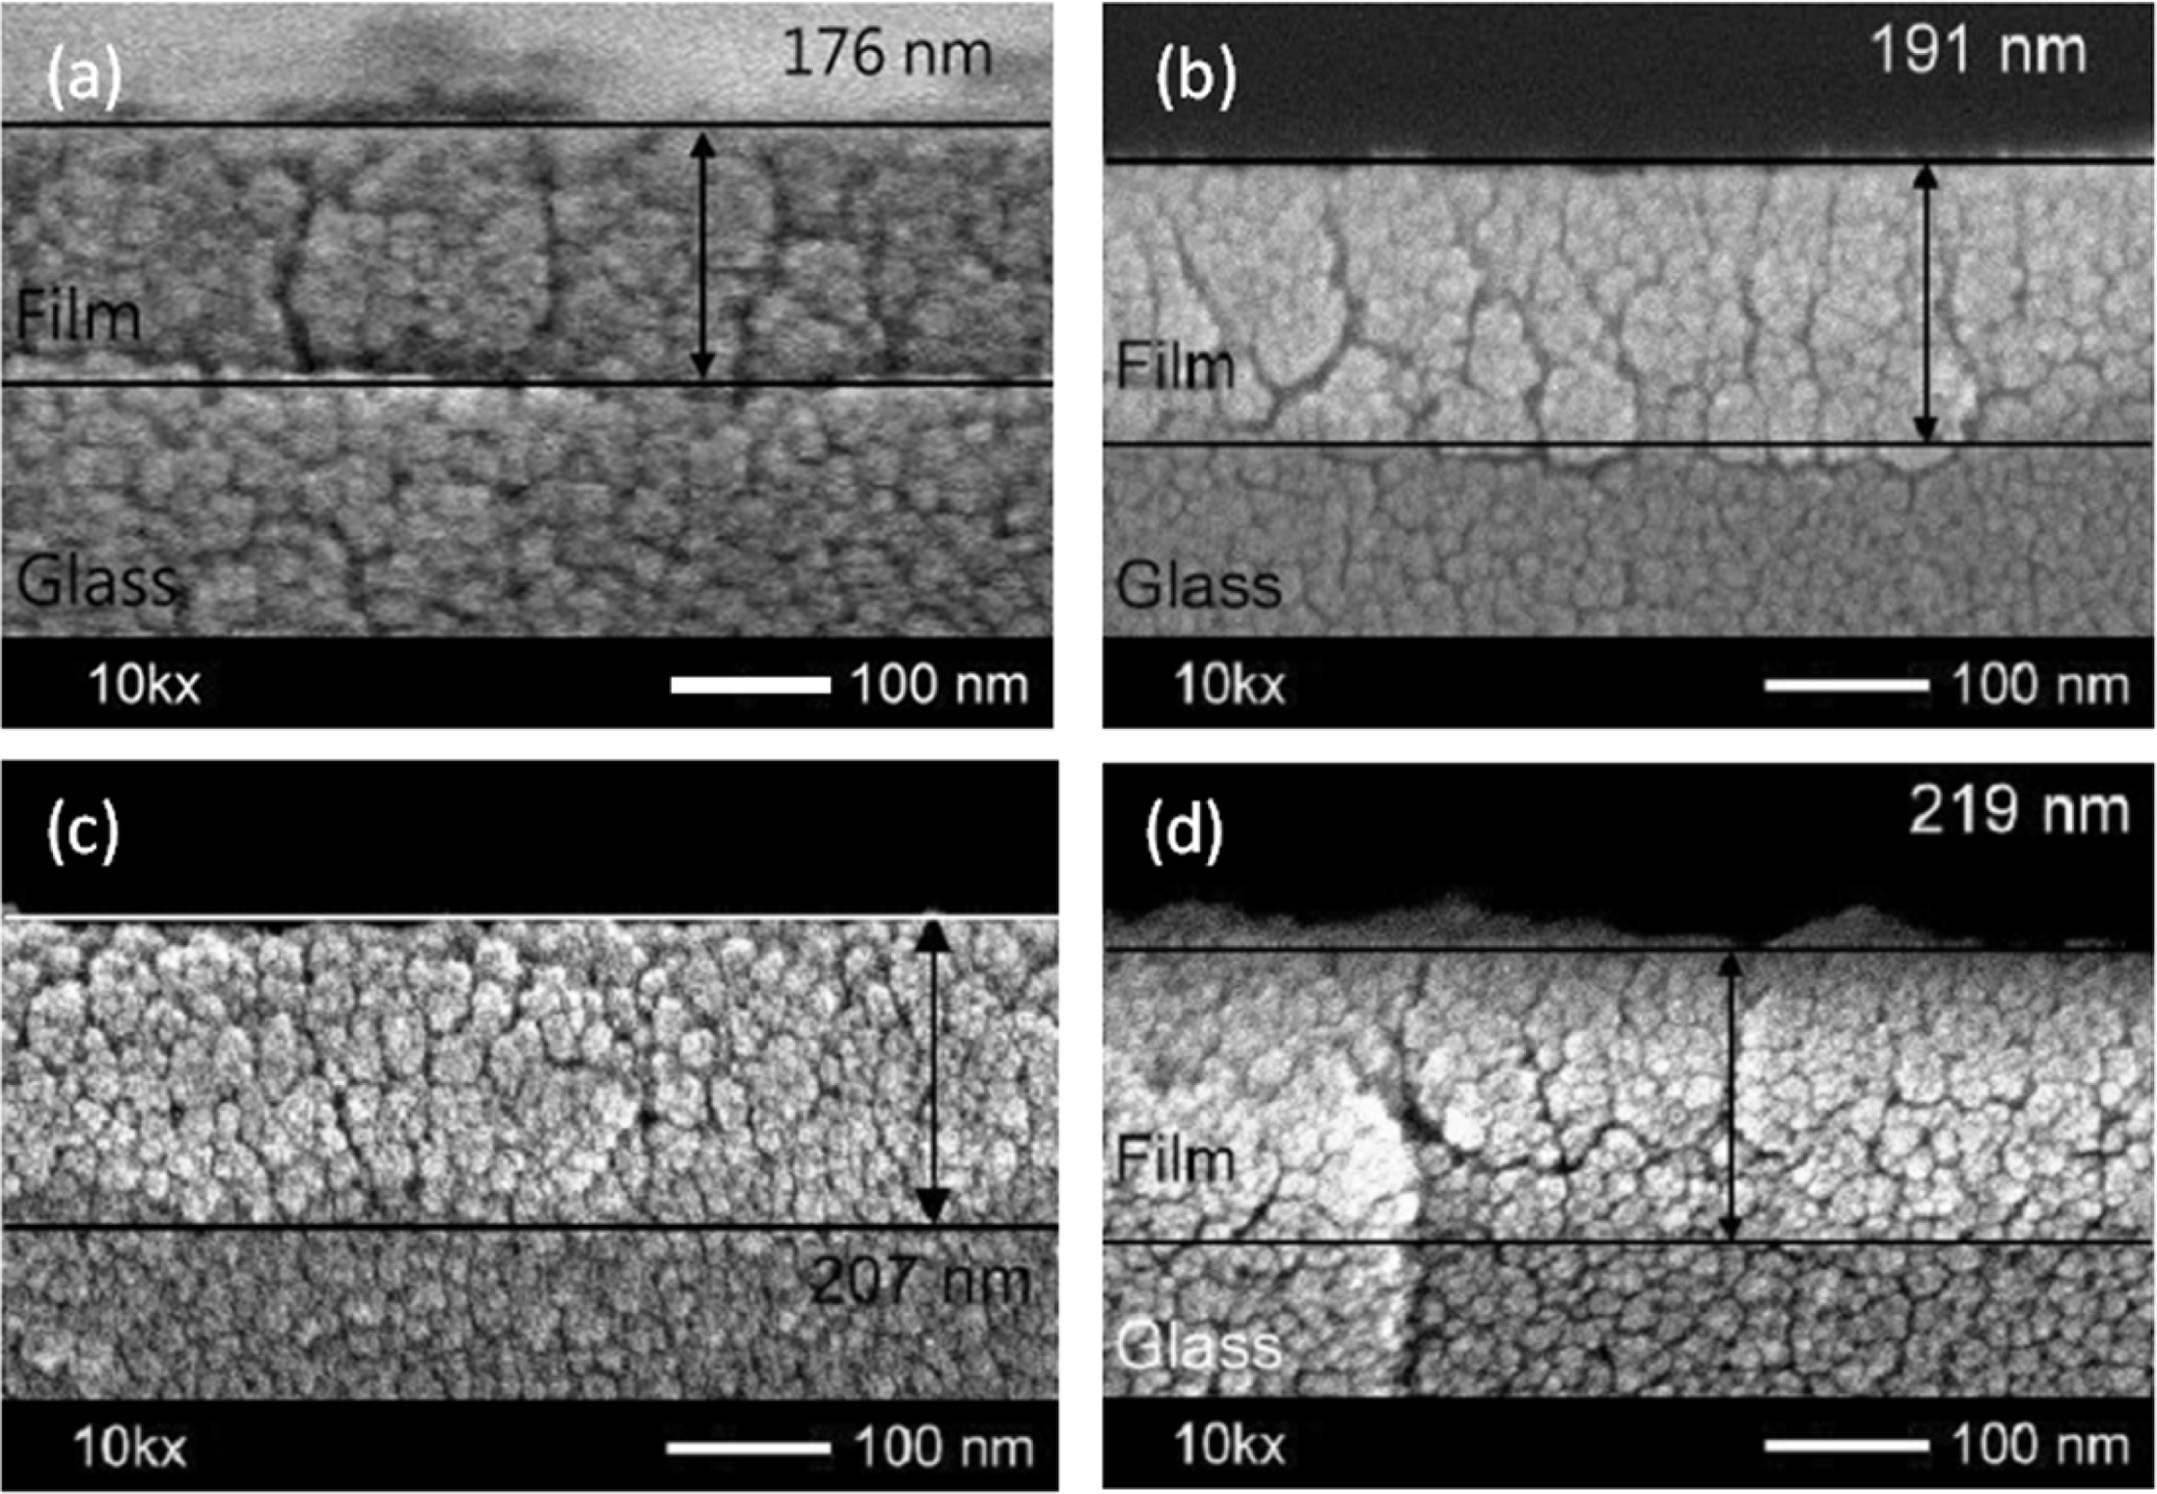
Fig. 2 shows the thickness of 2.7% Ag-doped Ti films treated at different thermal oxidation temperatures. As-deposited film with a thickness of around 176 nm was observed from the cross-section images as shown in Fig. 2(a). The film thickness increased with increasing annealing temperatures, such as at 450 oC = 191 nm, 500 oC = 200 nm, 550 oC = 219 nm, respectively. This is due to Ti films oxidizing to become TiO2 films during annealing. However, the cross-sectional FESEM images show that the film surface is uniform, and homogeneous, consisting of dense layers.
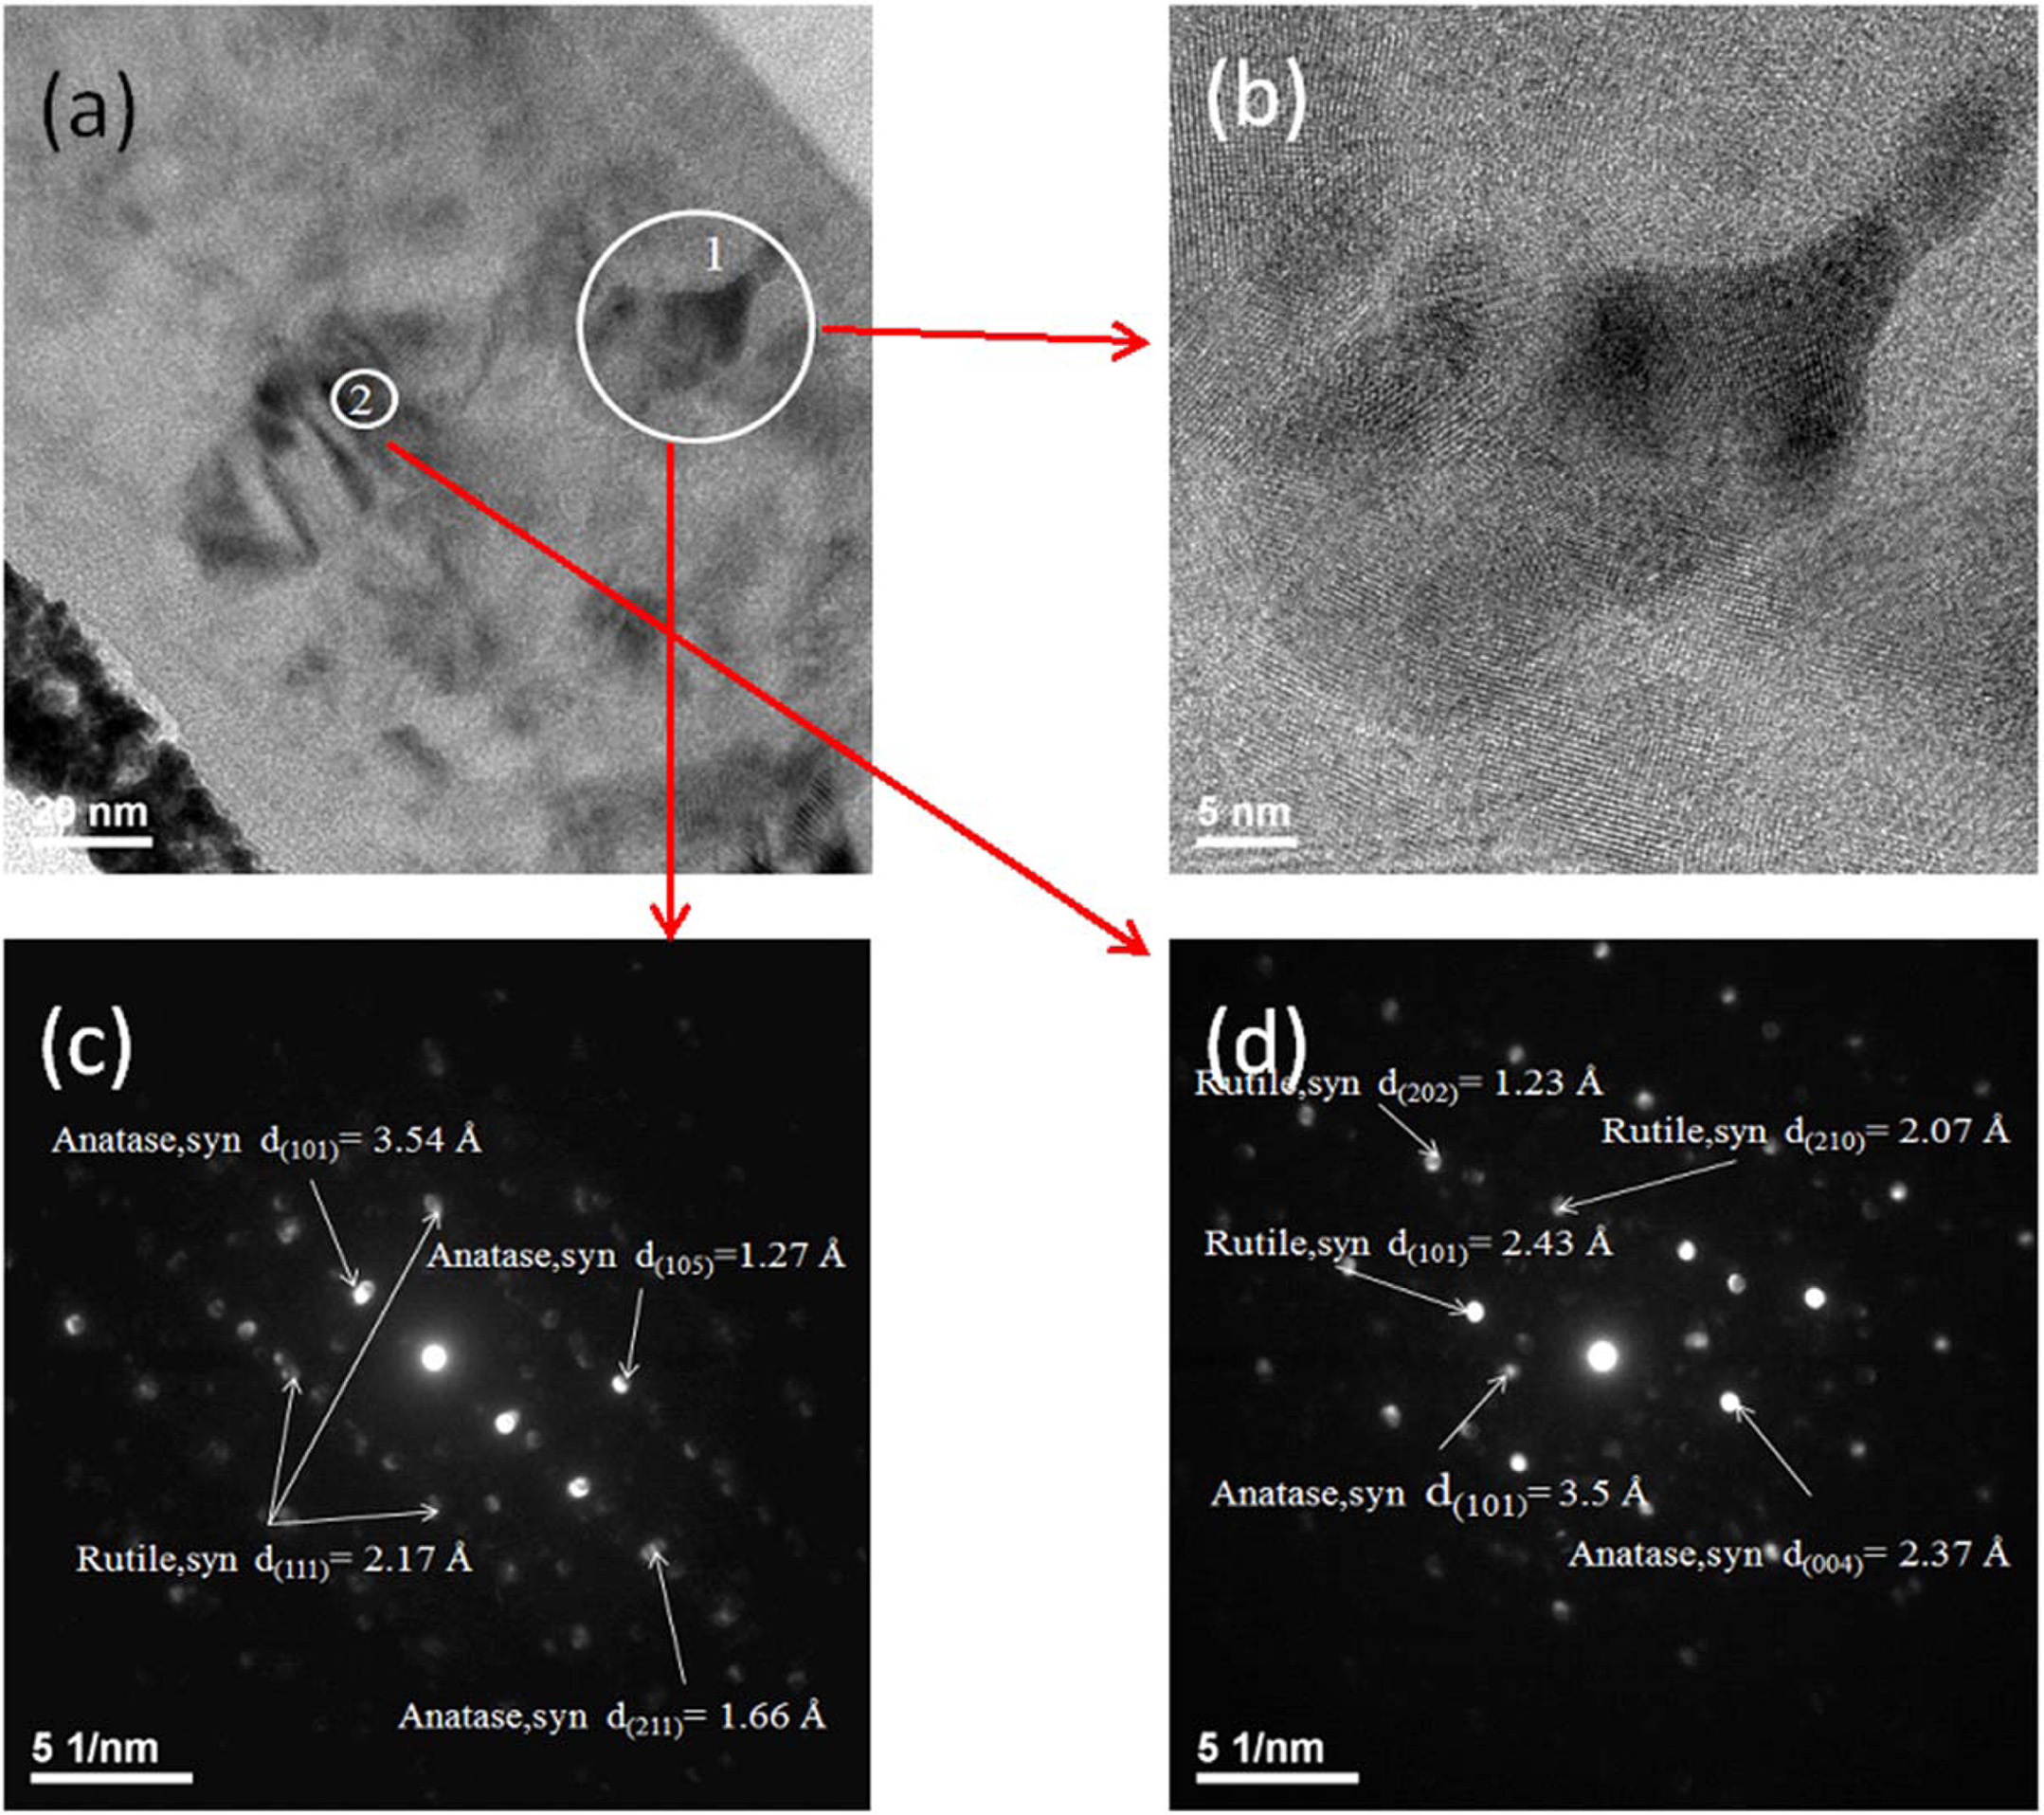
HRTEM micrographs and selected electron diffraction (SAD) patterns of the Ti films with 2.7% Ag addition annealed at 500 oC are shown in Figure 3. The HRTEM images show that 2.7% Ag-doped Ti films with some microcrystalline were observed at 500 oC, as shown in Figs. 3(a) and 3(b). The SAD pattern displays there is two phases (rutile and anatase) coexisted at 500 oC as shown in Fig. 3(c) and 3(d). This result is consistent with the XRD analysis (Fig. 1(a)) No metallic silver crystalline phase formation was detected in this study.
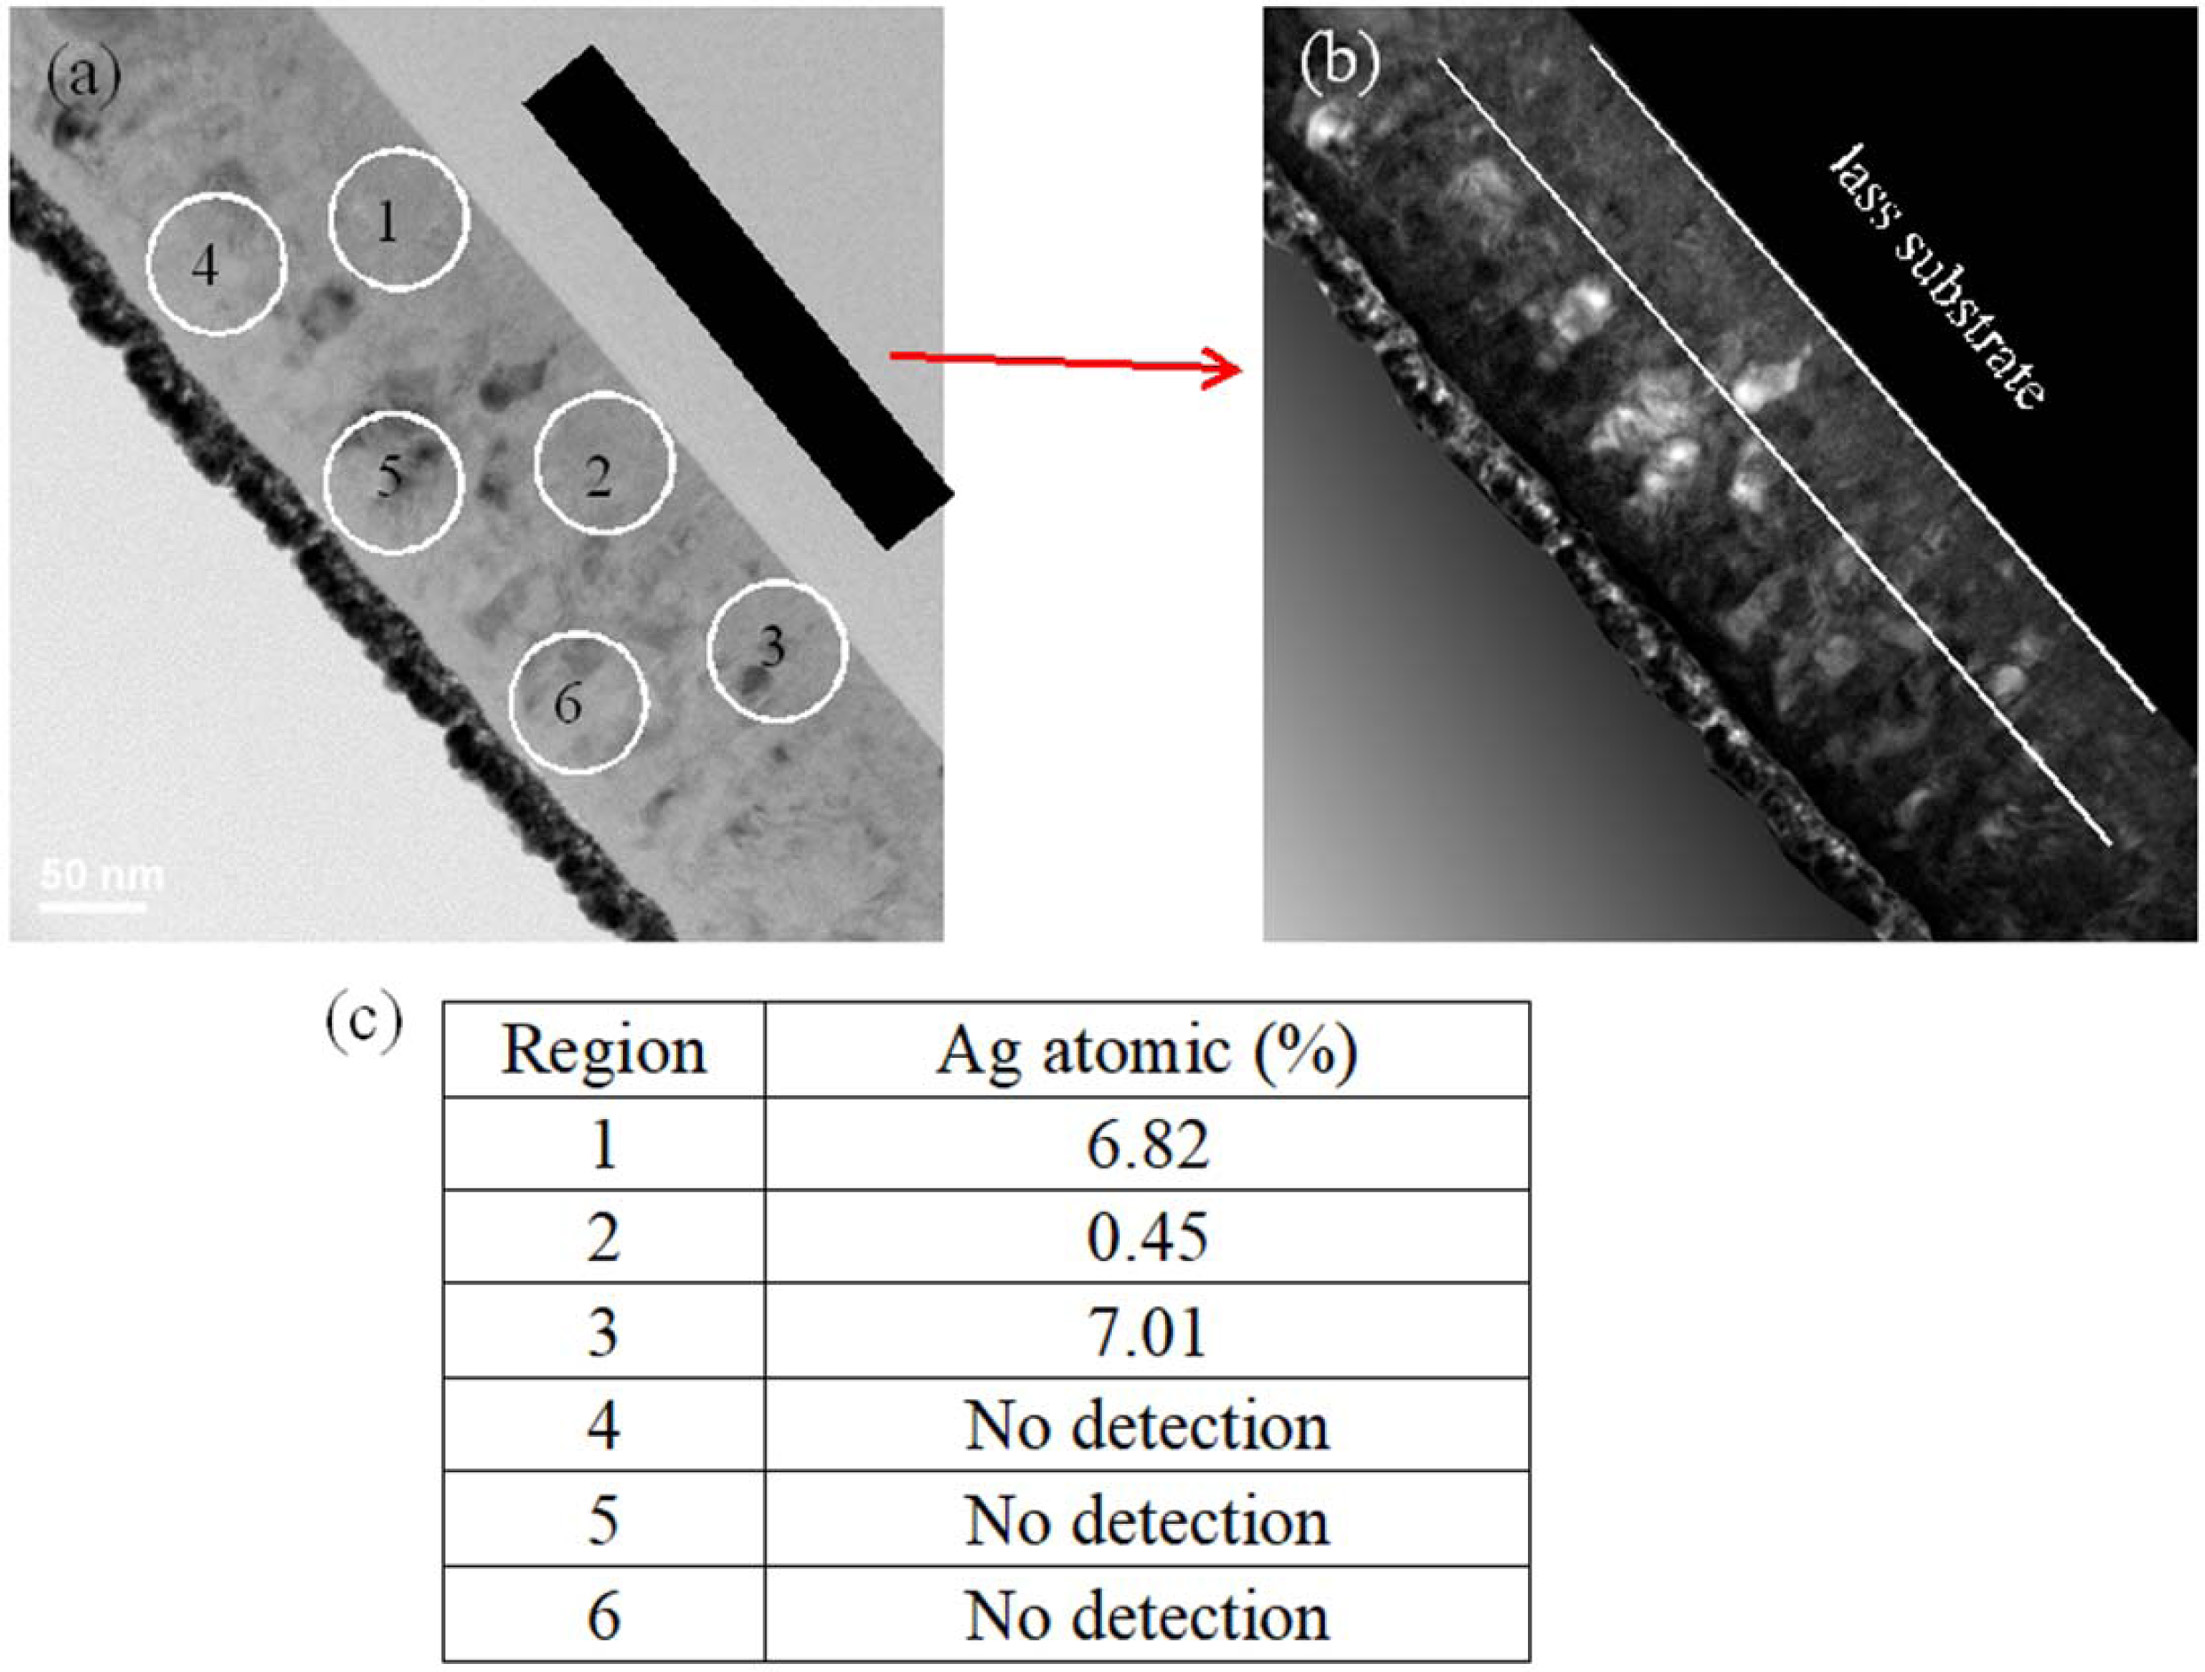
Fig. 4 displays HRTEM micrographs and EDX analysis of 2.7% Ag-doped Ti film annealed at 500 oC. The backscattered electron image (BEI) is plain with contrast indicating that 2.7% Ag-doped Ti film is signi- ficantly separated into two parts, as shown in Fig. 4(b). Obviously, there is less crystallization in the bottom zone. To understand the difference in the film composition, the TEM-EDX was used to analyze different positions in the films, as shown in Fig. 4(a). No Ag element was detected in the upper zone, with Ag elements detected in bottom zone as shown in Fig. 4(c). This means that Ag elements are concentrated in the bottom zone, indicating that Ag elements migrated to the bottom zone during annealing.
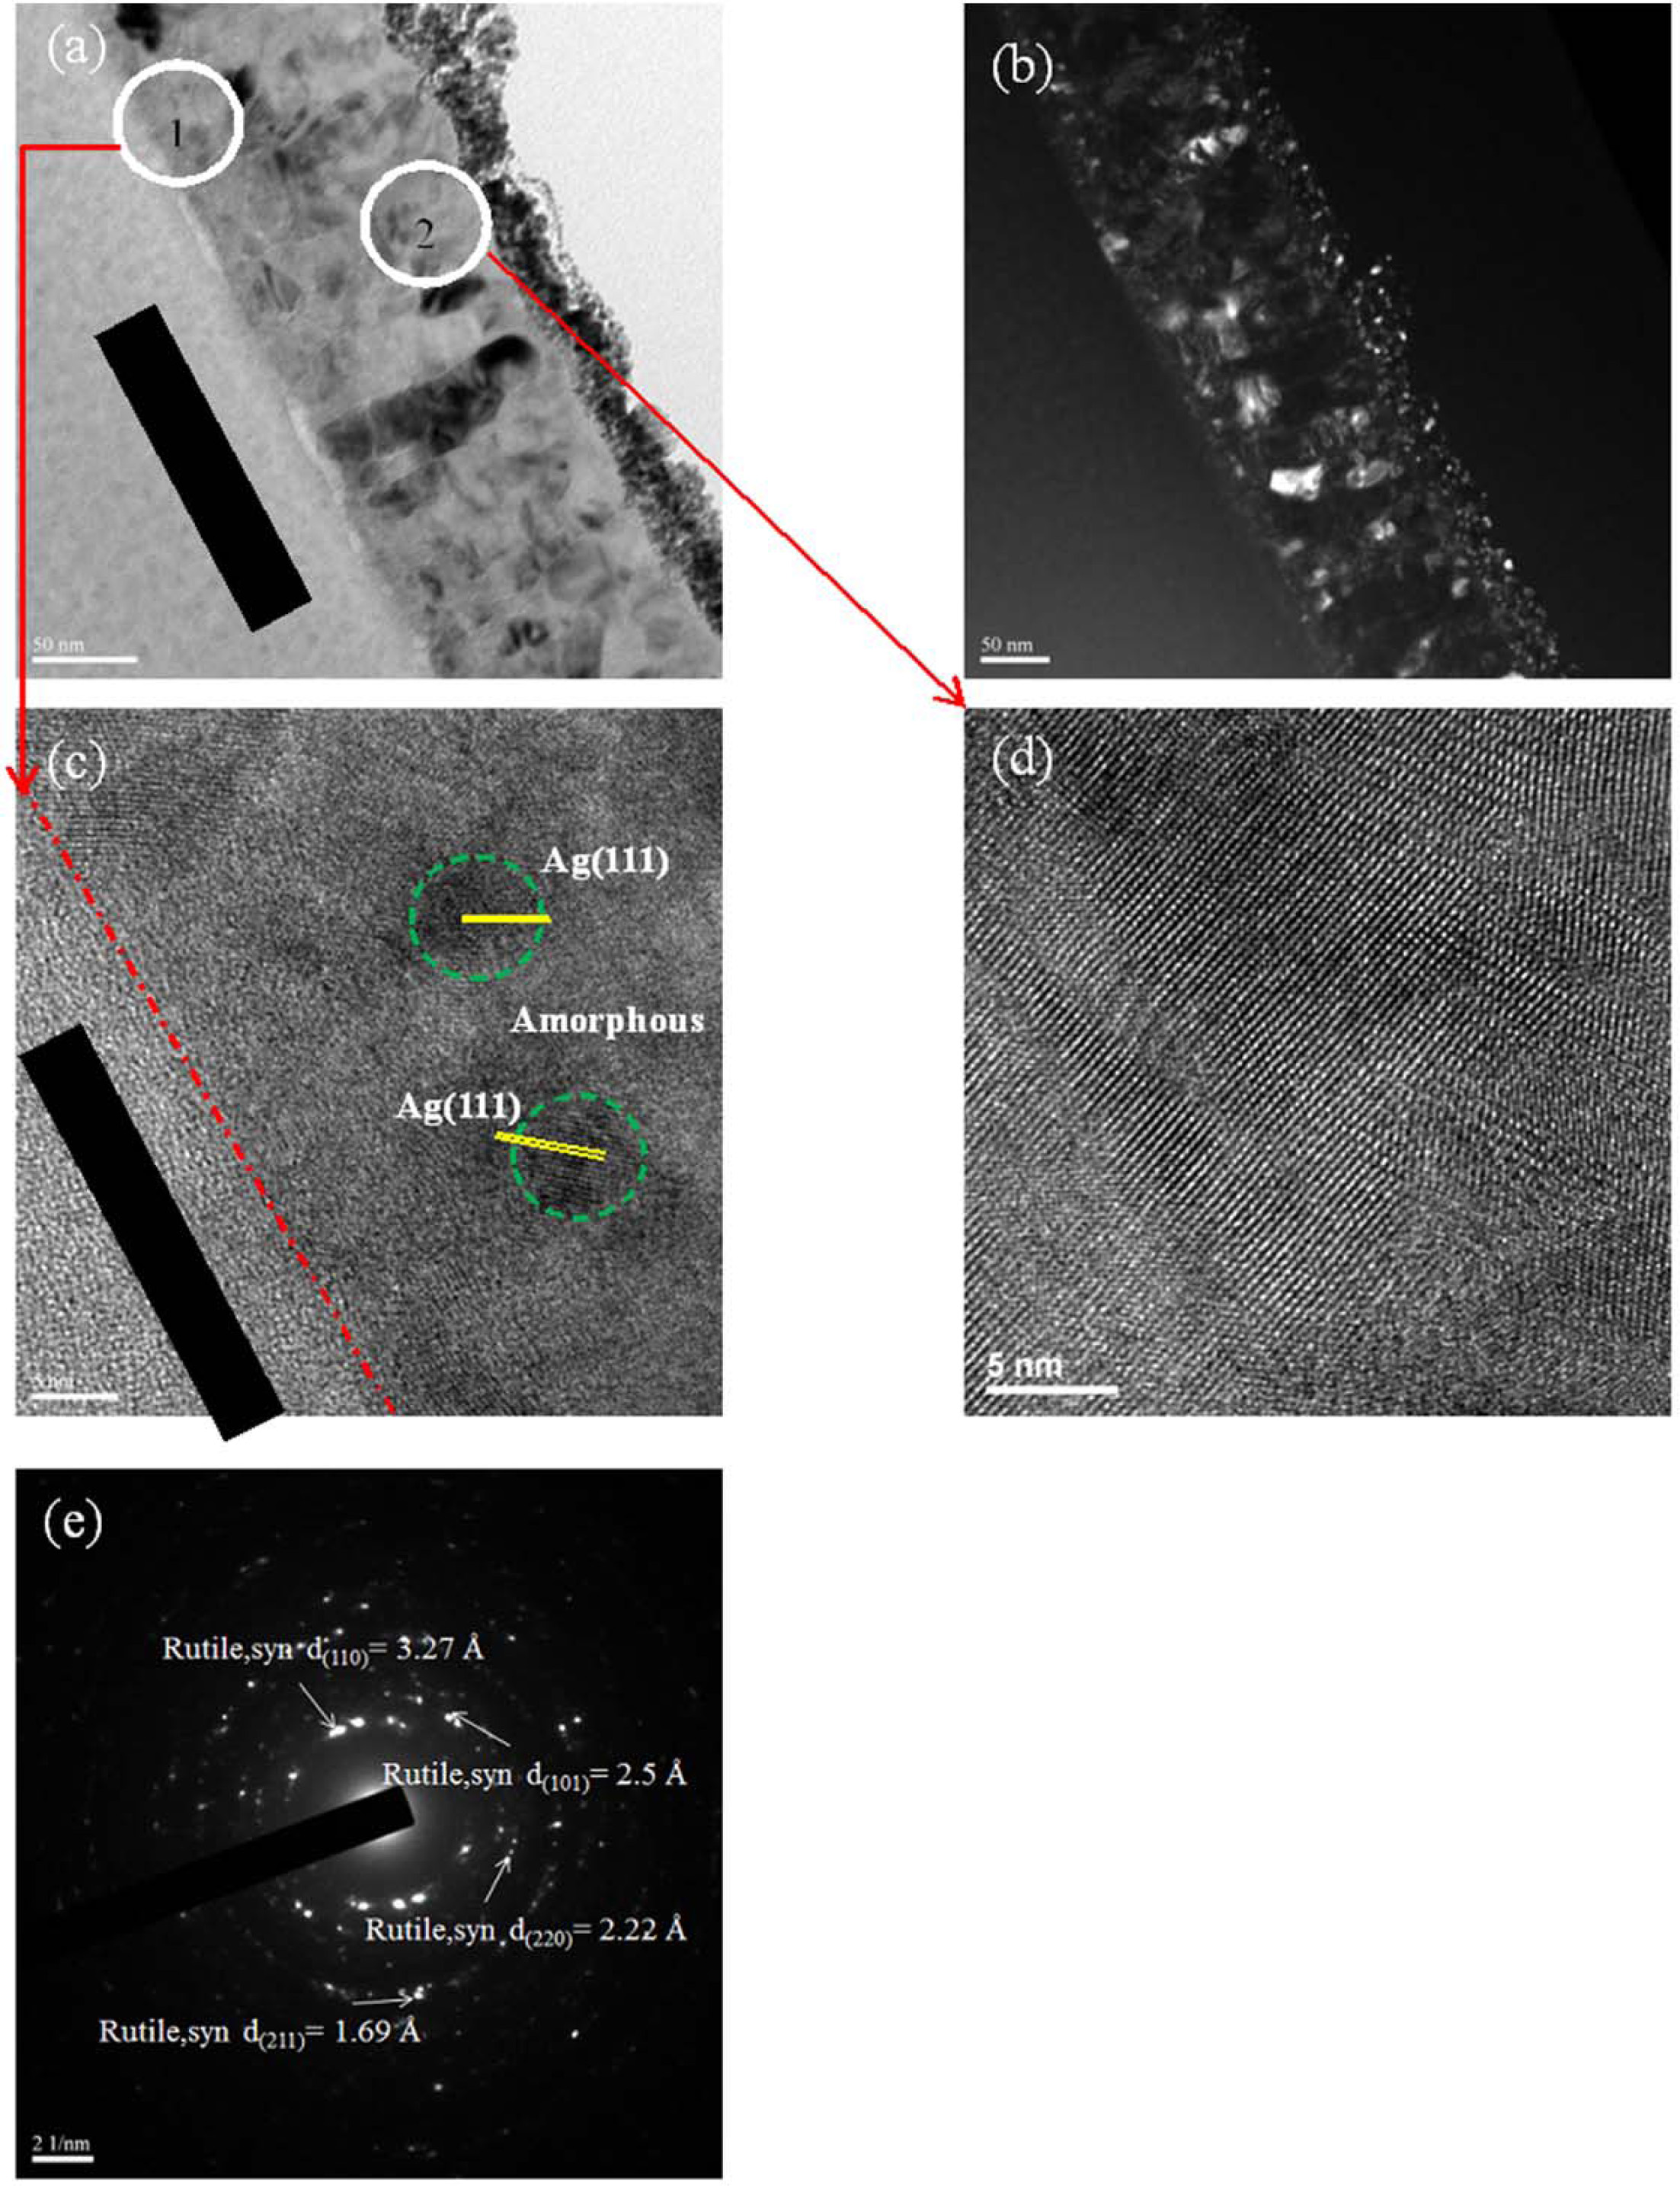
HRTEM micrographs and SAD patterns of the Titanium films with 2.7% Ag addition annealed at 550 oC for 6 h are shown in Fig. 5. The backscattered electron image (BEI) is plain with contrast indicating that Ag-doped Ti film is polycrystalline as shown in Fig. 5(b). Comparing Ag-doped Ti films annealed at 500 oC and 550 oC, the Ag-doped Ti film annealed at 550 oC has more crystallized zones than annealed at 500 oC as shown in Figs. 4(a) and 5(a). Higher crystallinity was found in the upper zone than the bottom zone, as shown in Figs. 5(c) and 5(d). The reason for this may be that thermal oxidation produced a thin layer of oxide on the Ti film surface. Subsequently, the oxygen diffusion through the TiO2 layer causes further Ti film oxidation into TiO2. However, oxygen diffused into the internal film from the surface over a long period of time. Therefore, insufficient oxygen is expected in the bottom zone. As shown in Fig. 5(c), HRTEM analysis exhibits the presence of Ag clusters in 2.7% Ag-TiO2 films following annealing at 550 oC that are 8 nm in size on average. Mosquera et al. reported that the silver atoms easily agglomerated to create clusters in the TiO2 film [18]. The crystalline grains of samples were analyzed using electron diffraction pattern to identify the phase structures, as shown in Fig. 5(e). The SAD pattern displays that only rutile phase is present. This result is consistent with the XRD analysis in the above section (Fig. 1). Ting et al. reported that Ti film is readily transformed into a TiO2 rutile phase at temperatures below 550 oC in air, no going through an anatase to rutile phase transformation [16].
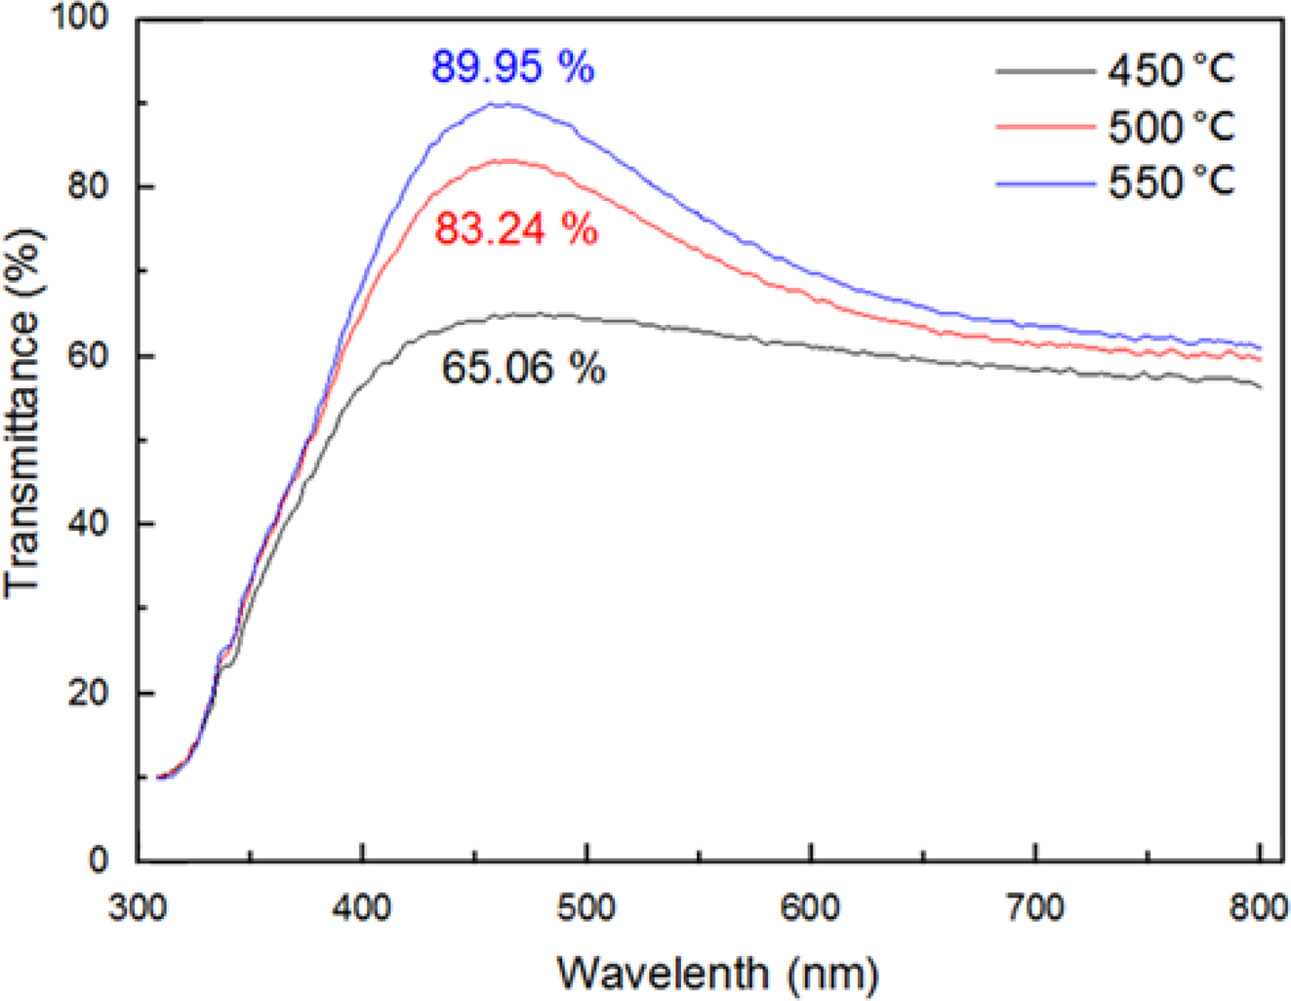
UV-Vis spectroscopy is used to show the optical transmission of the Ag-doped TiO2 films with different annealing temperatures, as shown in Fig. 6. The 2.7% Ag-doped Ti film annealed at 450 oC was transparent in the visible region with 65% transmission, as shown in Fig. 6. With increasing annealing temperatures, the films displayed a better optical transmittance at a wavelength of 460 nm, and the highest value appeared at ~90% for 550 oC annealing.
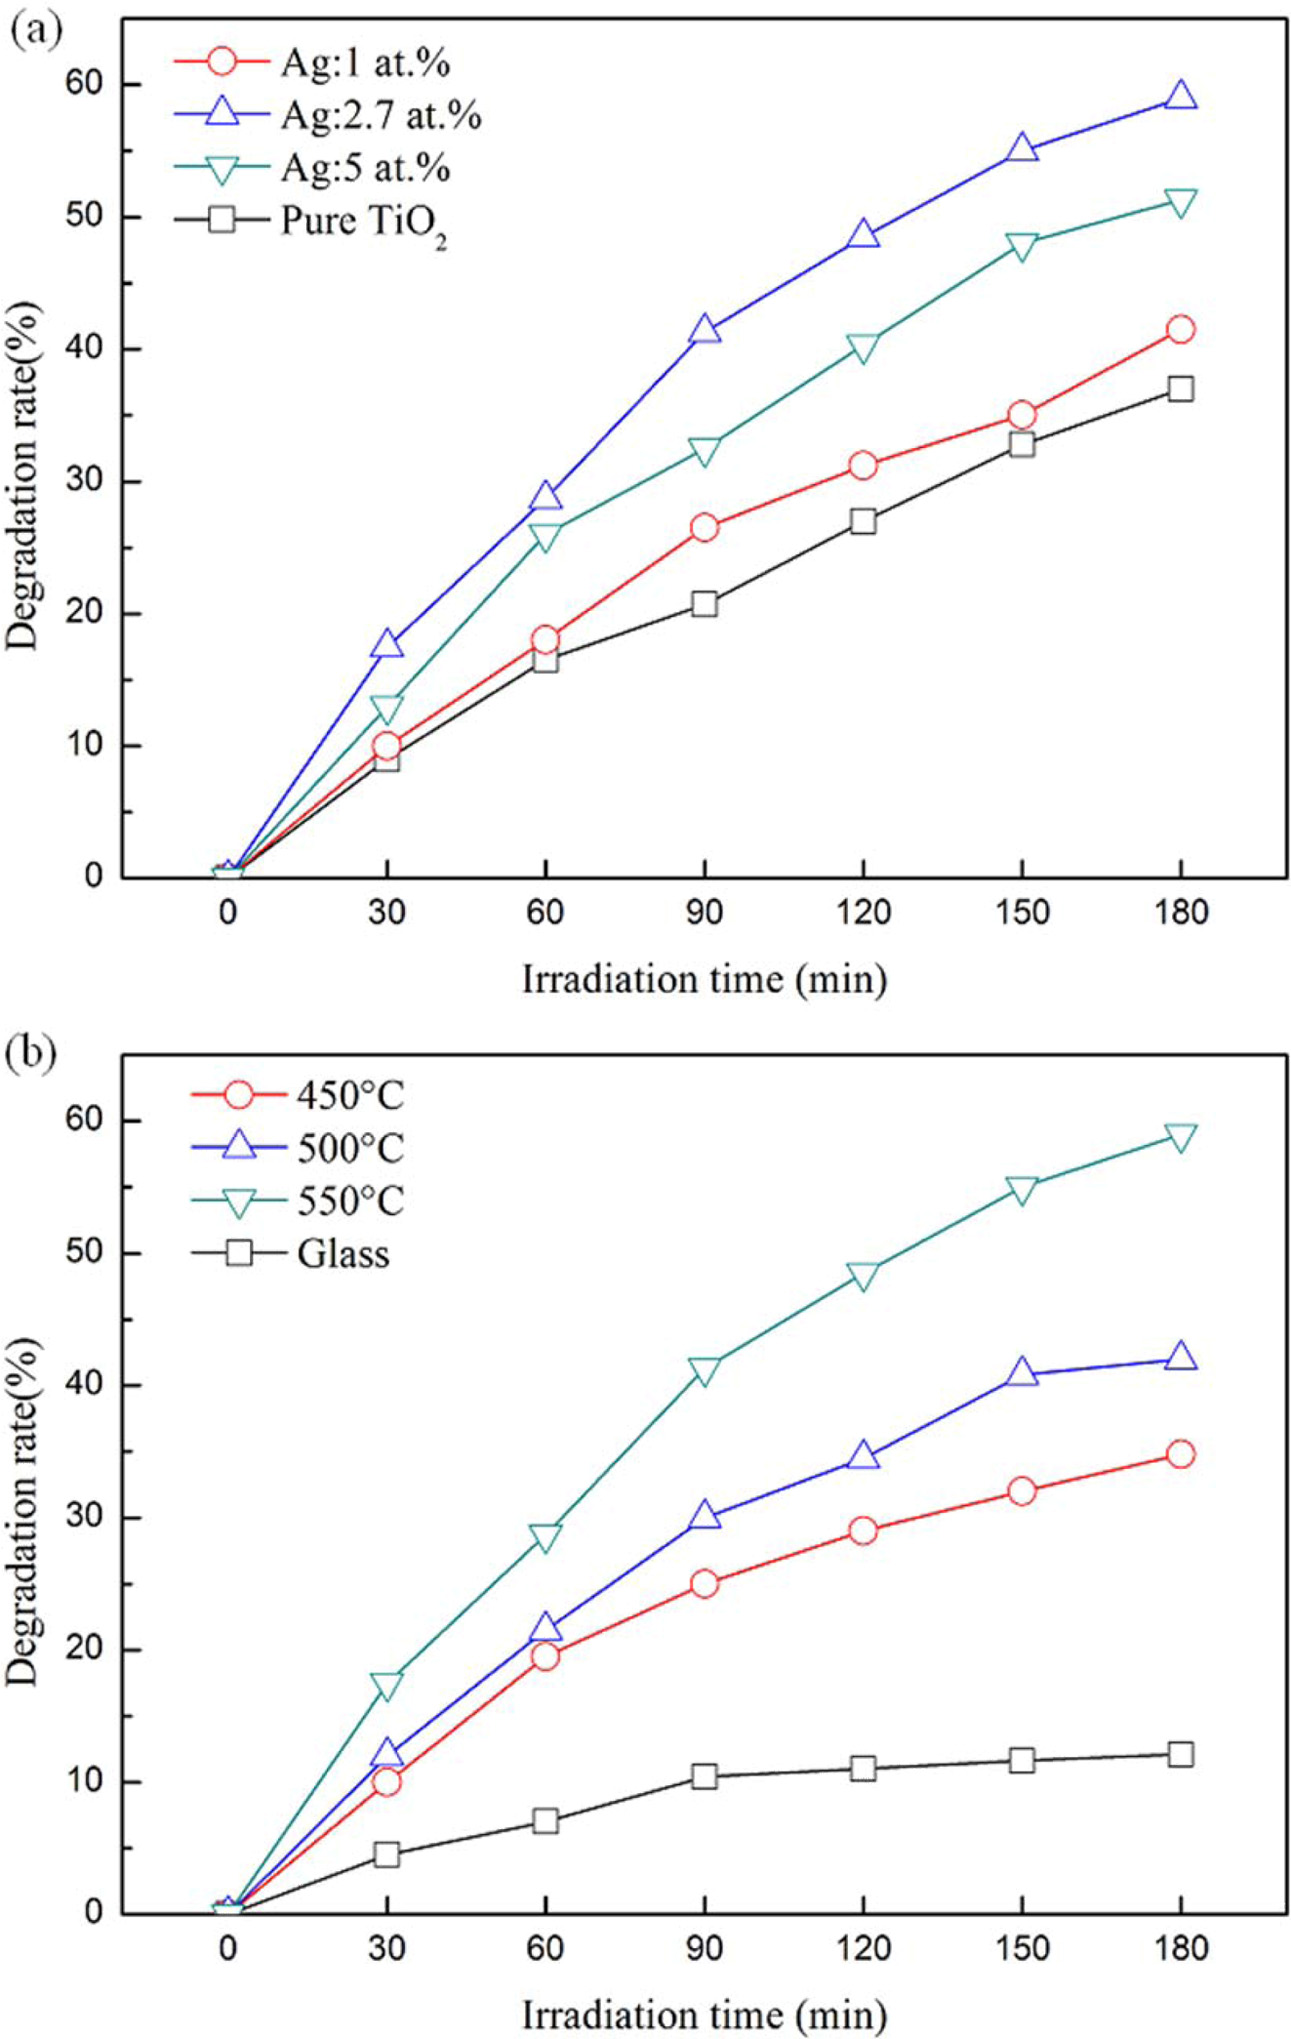
The photo catalytic parameters of the Ag-doped TiO2 films were given in Fig. 7. Fig. 7(a) shows the degradation rate evolution for Ag-doped Ti films annealed at 550 oC. It is found that the Ag amount in Ti films influenced the degradation rate of TiO2 films. It can be clearly seen that all samples showed good photo catalytic activity, but the Ag-doped TiO2 films increased the film photo catalytic capability when compared to pure TiO2 films. The degradation rate of the 2.7% Ag-doped TiO2 film is ~59%, while that of the pure TiO2 film is about 37.8%. Furthermore, when the Ag amount exceeded 2.7% the photo catalytic activity of the 5.0% Ag-doped TiO2 film was decreased. As is well known, the film photo catalytic enhancement behavior when the Ag amount is increased in the Ag-doped TiO2 films might be due to narrowing the film band gap, enhancing film wettability and defects in the films [19, 20].
Fig. 7(b) shows the degradation rate evolution for Ag-doped TiO2 films annealed at 550 oC. With increasing annealing temperature, the Ag-doped TiO2 film degradation rate increased significantly. The Ag-doped TiO2 film degradation rate is roughly 35.6%, 43.3% and 59.1% for annealing temperatures at 450 oC, 500 oC and 550 oC (irradiated for 180 min), respectively. However, the Ag-doped TiO2 films annealed at 550 oC produced the highest degradation rate, reaching about 59.1%. According to TEM analysis, the microcrystalline and amorphous characteristics coexisted in 2.7% Ag-doped TiO2 film, which was annealed at 500 oC. However, 2.7% Ag-doped TiO2 film has more crystallinity at 550 oC. This may result in a decrease in the electron-hole pair recom- bination rate photo generated during UV irradiation, promoting the film photo catalytic activity [21].
Application of Ag-TiO2 thin films
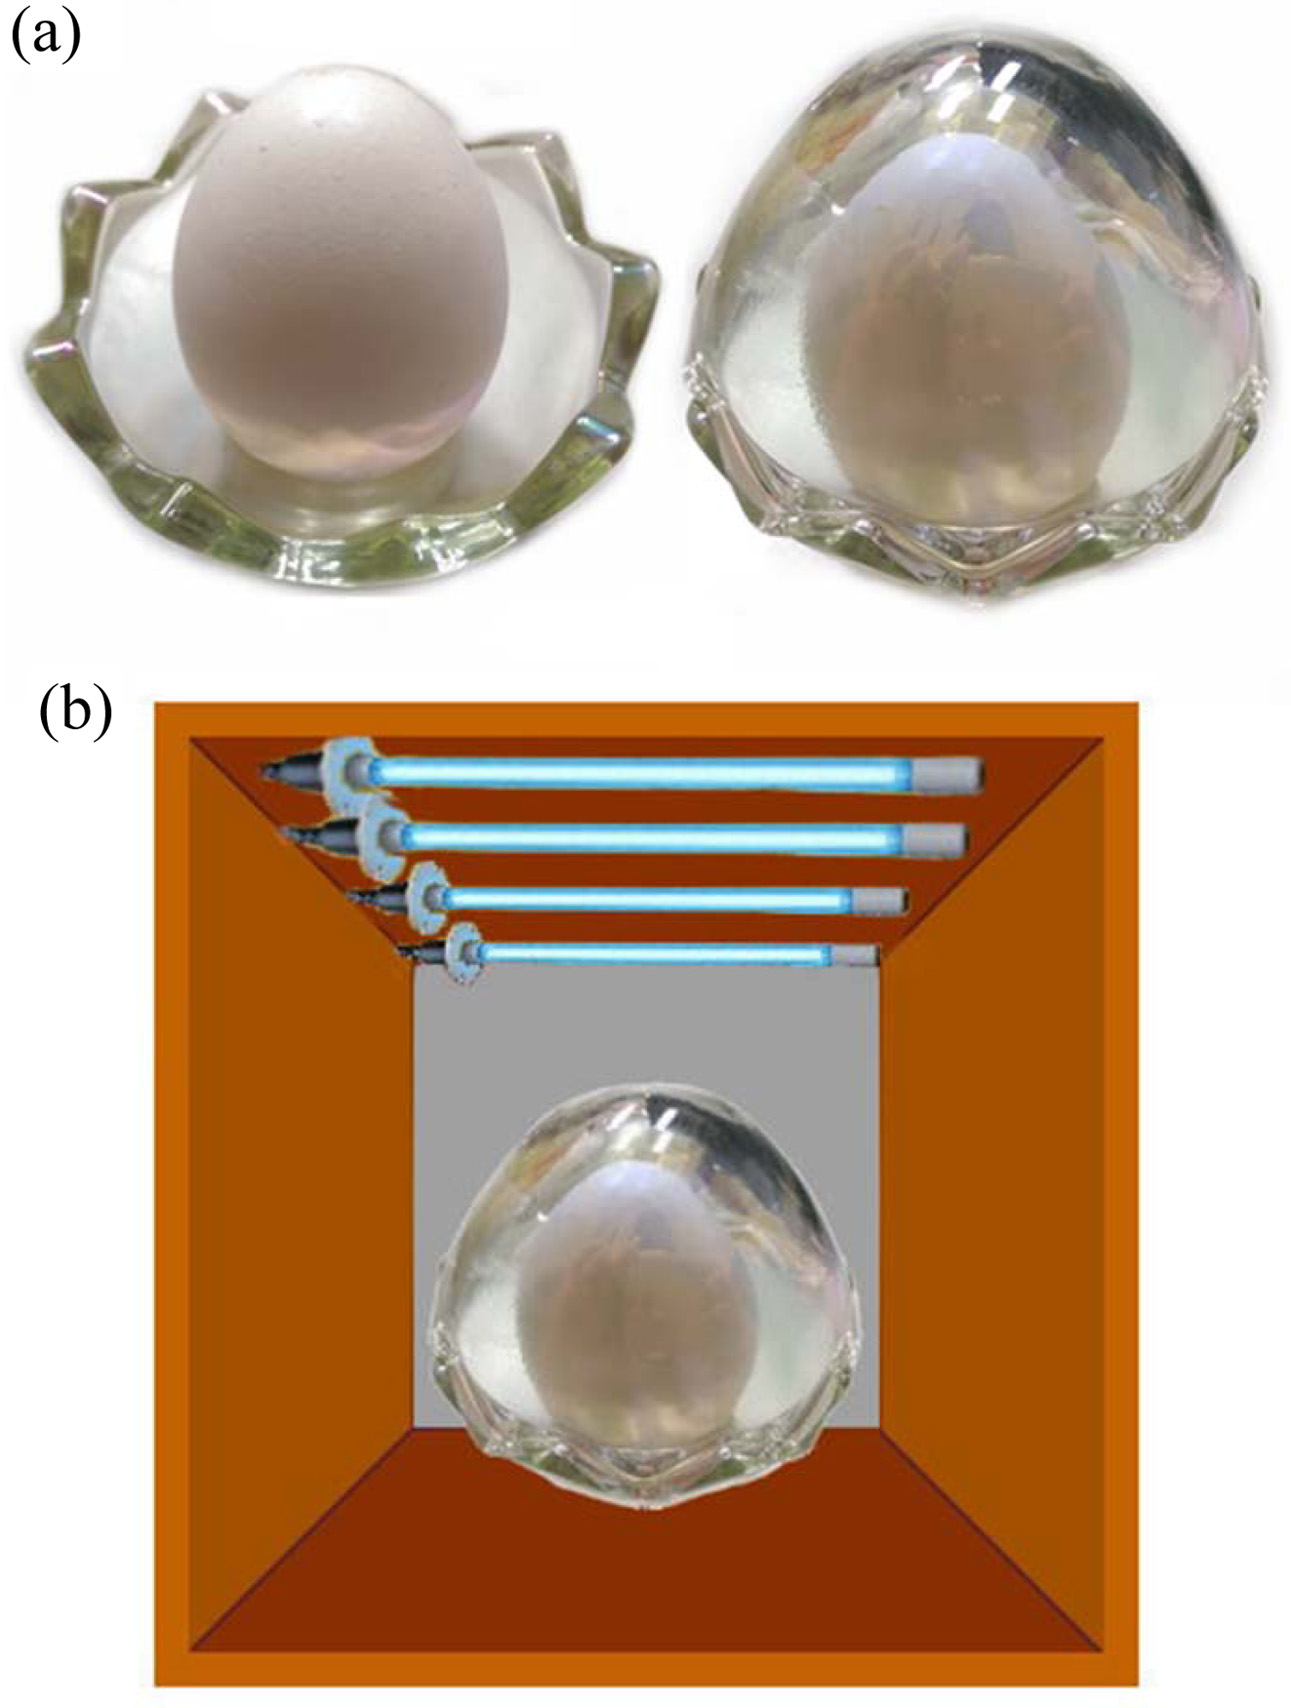
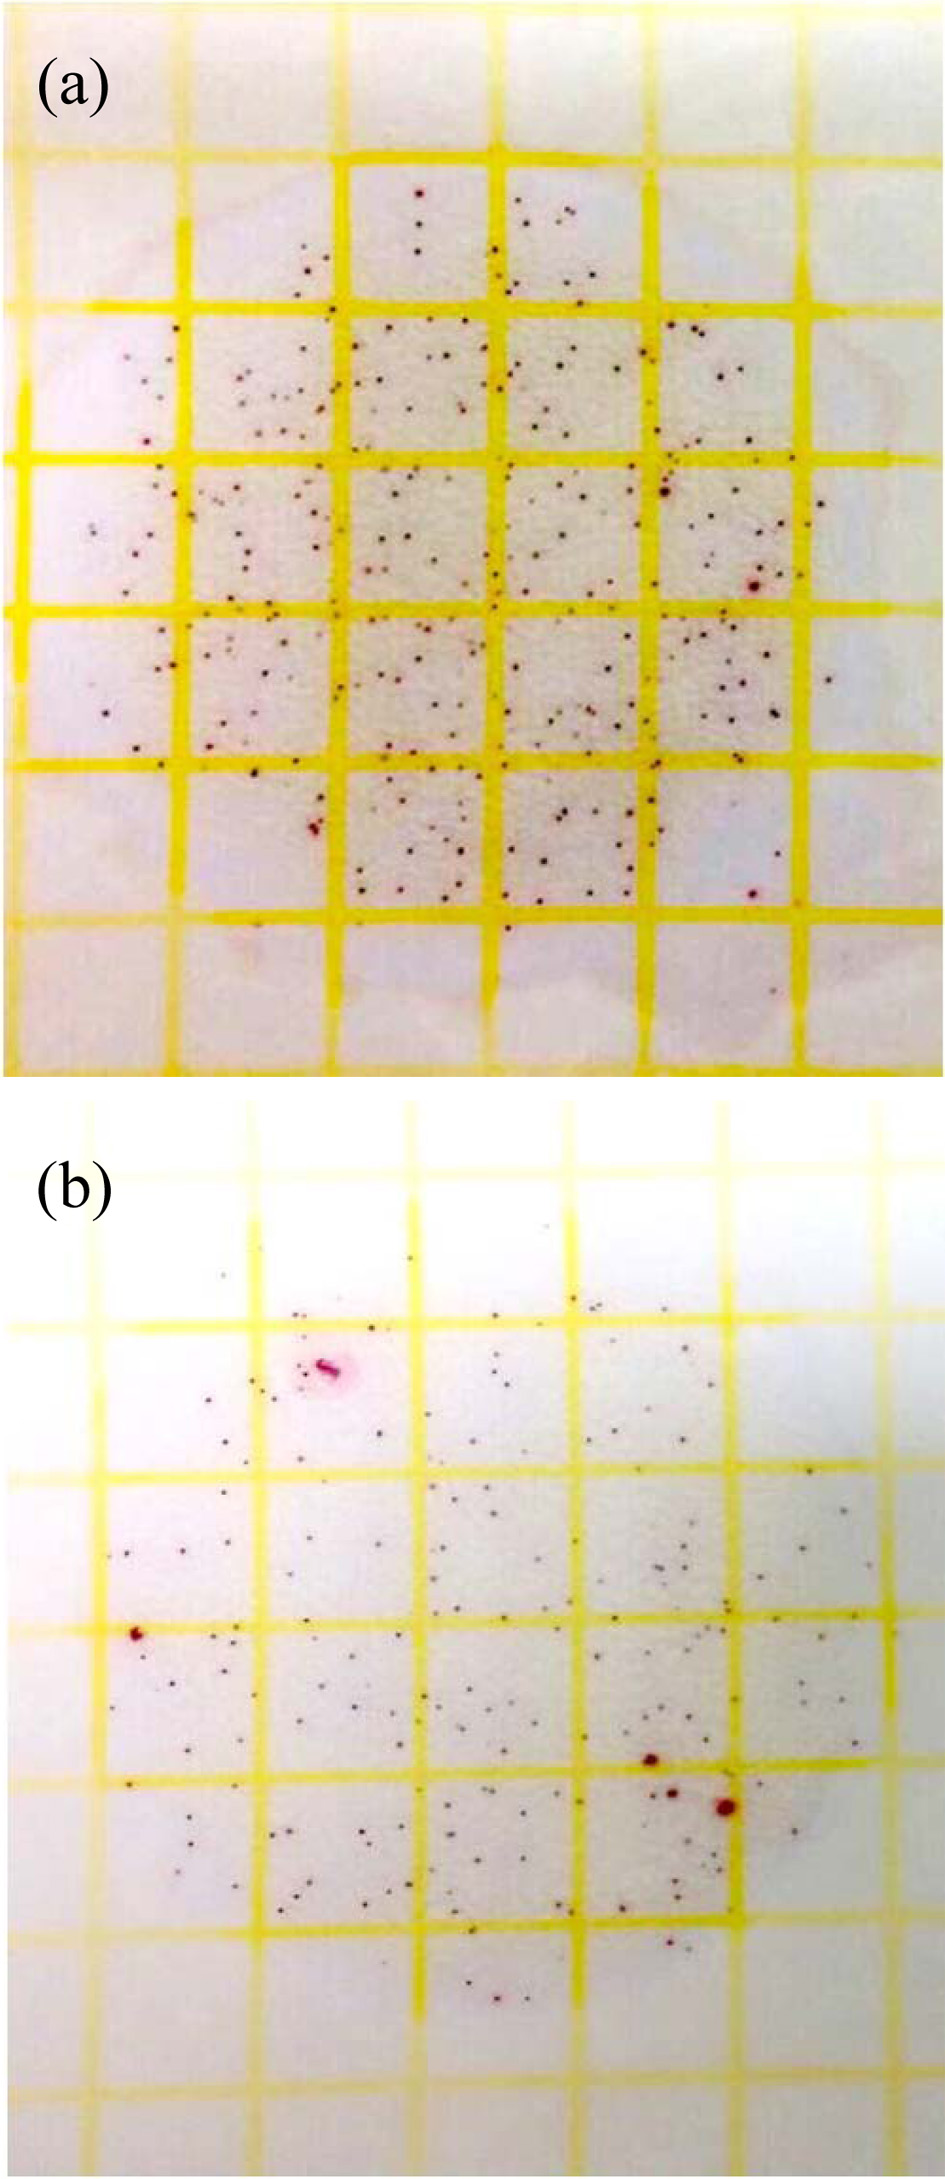
To evaluate the antibacterial activity of film, the inner layer of the glass-egg was coated with Ag-TiO2 thin films as shown in Fig. 8(a). A schematic diagram of the Ag-TiO2 thin film bactericidal activity was investigated using atmospheric bacteria under UV irradiation, as shown in Fig. 8(b). Figure 9 reveals the antibacterial properties of the tested substances. The average bacteria on the raw egg surface were calculated after placing in an egg glass under UV irradiation. The number of bacteria was 4.2 x 10³ CFU/mL as shown in Fig. 9(a). However, the number of bacteria was 2.8 x 10³ CFU/mL when the raw egg was put into a Ag-TiO2 thin film coated glass under UV irradiation, as shown in Fig. 9(b). Significantly, glass-egg coated with Ag-TiO2 thin films by UV irradiation exhibit antibacterial activity, compared with egg glass without coating treatment exhibited no antibacterial activity.
|
Fig. 1 X-ray diffraction patterns; (a) 2.7% Ag doped Ti thin films annealed at different temperatures in air (b) Ti thin films with different Ag dopants annealed at 550 C in air |
|
Fig. 2 Thickness of 2.7% Ag doped Ti films treated at different oxidation temperatures; (a) as-deposition (b) 450 oC (c) 500 oC (d) 550 oC. |
|
Fig. 3 TEM micrographs of 2.7% Ag doped Ti thin films deposited on glass and annealed at 500 oC, (a) cross-section micrographs (b) Position “1” HRTEM micrographs (c) Position “1” selected-area electron diffraction patterns (d) Position “2” selected-area electron diffraction patterns. |
|
Fig. 4 TEM micrographs of 2.7% Ag doped Ti thin films deposited on glass and annealed at 500 oC, (a) cross-section micrographs, (b) dark field of cross-section, (c) EDX analysis. |
|
Fig. 5 TEM micrographs of 2.7% Ag doped Ti thin films deposited on glass and annealed at 550 oC, (a) cross-section micrographs, (b) dark field of cross-section, (c) Position “1” HRTEM micrographs, (d) Position “2” HRTEM micrographs, (e) Position “2” selected-area electron diffraction patterns. |
|
Fig. 6 UV–vis spectra for 2.7% Ag doped Ti thin films annealed at
different temperatures in air. |
|
Fig. 7 Comparison of photo catalytic activities (a) Ti thin films with different Ag dopants annealed at 550 oC in air (b) 2.7% Ag doped Ti thin films annealed at different temperatures in air. |
|
Fig. 8 Schematic diagram of sterilization experiment: (a) the raw eggs are placed in an Ag-TiO2 film-treated glass egg, (b) the sterilization of raw eggs by UV light. |
|
Fig. 9 The photograph of bacteria number of raw egg surface by 3M rapid test strip: (a) without treatment (b) after put in glass egg by UV radiation |
Ag-doped TiO2 thin films were successfully prepared onto glass substrates using co-sputtered Ag doped Ti film using thermal oxidation in the 400~550 oC temperature range. The microstructures, crystalline phases, optical and photo catalytic characteristics of the Ag-doped TiO2 films depended largely on the annealing temperature. The Ag-doped Ti films treated at 450 oC presented an amorphous structure, and the TiO2 rutile and anatase mixture phases coexisted at 500 oC. There is rutile phase only when the annealing temperature reached 550 oC. The Ag-doped Ti film annealed at 550 oC presented more crystallized zones than film annealed at 500 oC. However, Ag elements were found concentrated in the bottom zone using EDX analysis. This means that Ag elements migrated to the bottom zone during annealing. With increasing annealing tem- perature, the Ag-doped TiO2 film degradation rate increased significantly. However, 2.7 Ag-doped TiO2 films annealed at 550 oC displayed the best photo catalytic activity (59%) for Methylene Blue solution degradation. The egg glass coated with Ag-TiO2 thin films using UV irradiation exhibited antibacterial activity.
- 1. A. Di Paola, M. Bellardita, and L. Palmisano, Catalysts 3[1] (2013) 36-73.
-

- 2. Q. Deng, X. Xia, M. Guo, Y. Gao, and G. Shao, Mater. Lett. 65[13] (2011) 2051-2054.
-
- 3. C.-P. Lin, H. Chen, A. Nakaruk, P. Koshy, and C. Sorrell, Energy Procedia 34 (2013) 627-636.
-
- 4. I. Saeki, N. Okushi, H. Konno, and R. Furuichi, J. Electrochem. Soc. 143[7] (1996) 2226-2230.
-
- 5. B. Zhou, X. Jiang, Z. Liu, R. Shen, and A.V. Rogachev, Mater. Sci. Semicond. Process. 16[2] (2013) 513-519.
-
- 6. T. Berger, J. Spadaro, S. Chapin and R. Becker, Antimicrob. Agents Chemother. 9[2] (1976) 357-358.
-
- 7. A. Zielińska, E. Kowalska, J. W. Sobczak, I. Łącka, M. Gazda, B. Ohtani, J. Hupka, and A. Zaleska, Sep. Purif. Technol. 72[3] (2010) 309-318.
-
- 8. M. Behpour and M. Chakeri, J. Nanostruct. 2[2] (2012) 227-234.
-
- 9. R. Nainani, P. Thakur, and M. Chaskar, J. Mater. Sci. Eng. B 2[1] (2012) 52-58.
- 10. M.K. Seery, R. George, P. Floris, and S.C. Pillai, J. Photochem. Photobiol., A 189[2-3] (2007) 258-263.
-
- 11. M. Behnajady, N. Modirshahla, M. Shokri, and B. Rad, Global NEST Journal 10[1] (2008) 1-7.
- 12. H.-W. Wang, H.-C. Lin, C.-H. Kuo, Y.-L. Cheng, and Y.-C. Yeh, J. Phys. Chem. Solids 69[2-3] (2008) 633-636.
-
- 13. T.-J. Whang, H.-Y. Huang, M.-T. Hsieh, and J.-J. Chen, Int. J. Mol. Sci. 10[11] (2009) 4707-4718.
-
- 14. J. Xiong, M.Z. Ghori, B. Henkel, T. Strunskus, U. Schürmann, L. Kienle, and F. Faupel, Acta materialia 74 (2014) 1-8.
-
- 15. R.D. Shannon and J.A. Pask, J. Am. Ceram. Soc. 48[8] (1965) 391-398.
-
- 16. C.-C. Ting, S.-Y. Chen, and D.-M. Liu, J. Appl. Phys. 88[8] (2000) 4628-4633.
-
- 17. M. Suwarnkar, R. Dhabbe, A. Kadam, and K. Garadkar, Ceram. Int. 40[4] (2014) 5489-5496.
-
- 18. A. A. Mosquera, J. M. Albella, V. Navarro, D. Bhattacharyya, and J. L. Endrino, Sci. Rep. 6[1] (2016) 1-14.
-
- 19. S. Demirci, B. Öztürk, S. Yildirim, F. Bakal, M. Erol, O. Sancakoğlu, R. Yigit, E. Celik, and T. Batar, Mater. Sci. Semicond. Process. 34 (2015) 154-161.
-
- 20. S. Demirci, T. Dikici, M. Yurddaskal, S. Gultekin, M. Toparli, and E. Celik, Appl. Surf. Sci. 390 (2016) 591-601.
-
- 21. P. Periyat, K. Baiju, P. Mukundan, P. Pillai, and K. Warrier, Appl. Catal., A 349[1-2] (2008) 13-19.
-
 This Article
-
2021; 22(2): 179-185
Published on Apr 30, 2021
- 10.36410/jcpr.2021.22.2.179
- Received on Aug 26, 2020
- Revised on Nov 4, 2020
- Accepted on Nov 11, 2020
Services
Shared
Correspondence to
- Ying-Chieh Lee
-
Department of Materials Engineering, National Pingtung University of Science & Technology, Pingtung 91201, Taiwan
Tel : +886 7 7703202 ext. 7556 Fax: +886 7 7740552 - E-mail: YCLee@mail.npust.edu.tw
Clean-Energy Research Institute(CRI), Hanyang University, 222, Wangsimni-ro, Seongdong-gu, Seoul, 04763, Korea
E-mail: jcpr@hanyang.ac.kr