


- Experimental and numerical investigation on in-flight synthesis of Ga-doped ZnO nano-powder by Radio-Frequency induction plasma
Jun-Seok Nama, Sang-Min Jeonga, Min-Gyu Choia, Jun-Ho Seoa,* and Shi-Young Yangb,*
aDepartment of Quantum System Engineering, Chonbuk National University, Jeonju 54896, Republic of Korea
bGraduate School of Flexible & Printable Electronics, Chonbuk National University, Jeonju 54896, Republic of KoreaThis article is an open access article distributed under the terms of the Creative Commons Attribution Non-Commercial License (http://creativecommons.org/licenses/by-nc/4.0) which permits unrestricted non-commercial use, distribution, and reproduction in any medium, provided the original work is properly cited.
In this work, in-flight synthesis route of Ga doped ZnO (GZO) nano-powders was investigated experimentally and numerically, using Radio-Frequency (RF) induction plasmas. For experimental study, mixture of micron-sized ZnO and Ga2O3 powders were treated by RF induction plasmas, then, the as-treated powders were retrieved from reactor bottom and filtration for characterization. For numerical study, single particle model was combined with two-dimensional simulation code of RF induction plasma to predict the particle behaviors of ZnO and Ga2O3 depending on their sizes. First, experimental results showed that filtration-retrieved powders were characterized as GZO nano-powders although gallium content can be decreased due to Ga2O3 decomposition into sub-oxides at the elevated temperatures. From reactor bottom, however, spherical structures consisting of Ga2O3 and ZnO particles were observed in sub-millimeter sizes. Numerical results predicted that micron-sized (≤ 10 µm) ZnO and Ga2O3 particles can vaporize easily during the flight of plasma, while particles with the sizes of 25~100 um were simulated to be partially evaporated or unevaporated. Comparing these experimental and numerical results indicates that GZO nano-powders can be synthesized from vapor species of ZnO and Ga2O3, which are primarily produced by in-flight treatment of micron-sized ZnO and Ga2O3 powders in RF induction plasmas
Keywords: Ga doped ZnO, Radio-Frequency induction plasma, Numerical analysis, Nano powder, in-flight heat treatment
As an alternative to ITO (Indium Tin Oxide) facing indium depletion problems, ZnO-based TCO (Transparent Conductive Oxide)s have attracted much attention owing to the low-cost, earth-abundance and the non-toxicity of ZnO [1,2]. Because of the relatively low electrical conductivity of ZnO, however, most of the ZnO-based TCOs have been prepared in the form of the ZnO doped with the group III and IV elements, such as Al, In and Ga [3-5]. Among the dopants of the group III and IV elements, the atomic radius of Ga is closest to that of Zn and the covalent bond lengths of Ga-O and Zn-O have similar values of 1.92 Å and 1.97 Å respectively. Thanks to these structural advantages, Ga doped ZnO (GZO) has been expected to show the minimized deformation of ZnO lattice as well as the improved electrical conductivity for high concentration of Ga metal [6, 7].
In order to produce GZO material for TCO applications, a variety of synthesis routes have been suggested. For example, solvothermal, sol-gel combustion and co-precipitation methods have been explored to prepare GZO nano-powders as a building block for TCO applications [5, 8, 9]. However, these conventional doping processes usually produce nano-powders with poor crystalline quality because of the relatively low synthesis temperatures. In addition, relatively long pro- cessing time of several hours can lead to the formation of second phases, such as zinc gallate (ZnGa2O4) [8]. Accordingly, additional heat treatment processes, such as calcination and combustion, have been often required to improve the properties of the as-synthesized GZO nano-powders.
Normally, RF induction plasmas can produce not only a huge enthalpy but also relatively long residence time that is enough to melt and evaporate the refractory materials, such as gibbsite, alumina, zirconia, and titania [10]. In addition, due to the absence of electrodes, RF induction plasma torches facilitate axial injection of precursor along the centerline of the torch. Accordingly, the extremely high enthalpy of plasma can be used effectively for melting, evaporation and chemical reaction of the injected precursor. In particular, when injecting oxide mixtures as the precursor, this in-flight heating process by RF induction plasma can promote not only thermal decomposition of mixture oxides but also their re-condensation into nano-powders with newly formed composition through quenching process. Moreover, high crystallinity of the as-synthesized nano-powders can be obtained without additional heat treatment processes thanks to extremely high tempera- ture fields provided by RF thermal plasma. Based on these unique features, in-flight treatment of oxides by RF induction plasmas has been reported for the synthesis of the advanced nano-materials, such as lithium-metal oxide nanoparticles [11], heterogeneous catalysts [12], nano-sized glass powders [13] and functional TiO2 nano-particles [14].
In this work, we investigated the synthesis route of Ga doped ZnO nano-powder by this in-flight treatment method of oxide mixtures. For this purpose, first, micron-sized ZnO powders mixed with small amount of Ga2O3 were injected into a high-powered RF induction plasma with the plate power level of ~120 kVA. Then, the as-synthesized powders were characterized to confirm the doping of Ga into ZnO nano-powders. Finally, the obtained experimental results were discussed in the basis of numerical simulation on the particle behaviors of ZnO and Ga2O3 during their flight of RF thermal plasma.
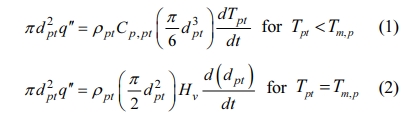
Fig. 1 illustrates the commercialized RF induction plasma torch system used in this work for the synthesis of GZO nano-powders. This system mainly consists of a high–powered RF induction plasma torch (Tekna, PS-100), a self-excited type RF power supply, a synthesis reactor, a reactor bottom and a filtration part for collecting the final nano particles. The RF power supply employed in Fig. 1 is designed to provide the maximum plate power of ~350 kVA to the RF induction torch at frequencies of 1~5 MHz. In addition, the synthesis reactor has an inner diameter of 700 mm and length of 1000 mm, respectively. RF induction plasma treatment of ZnO and Ga2O3 can be started by injecting the mixture precursor into the RF induction torch along the centerline through a water cooled injector, as shown in Fig. 1.
RF induction plasma treatment of ZnO and Ga2O3 powders
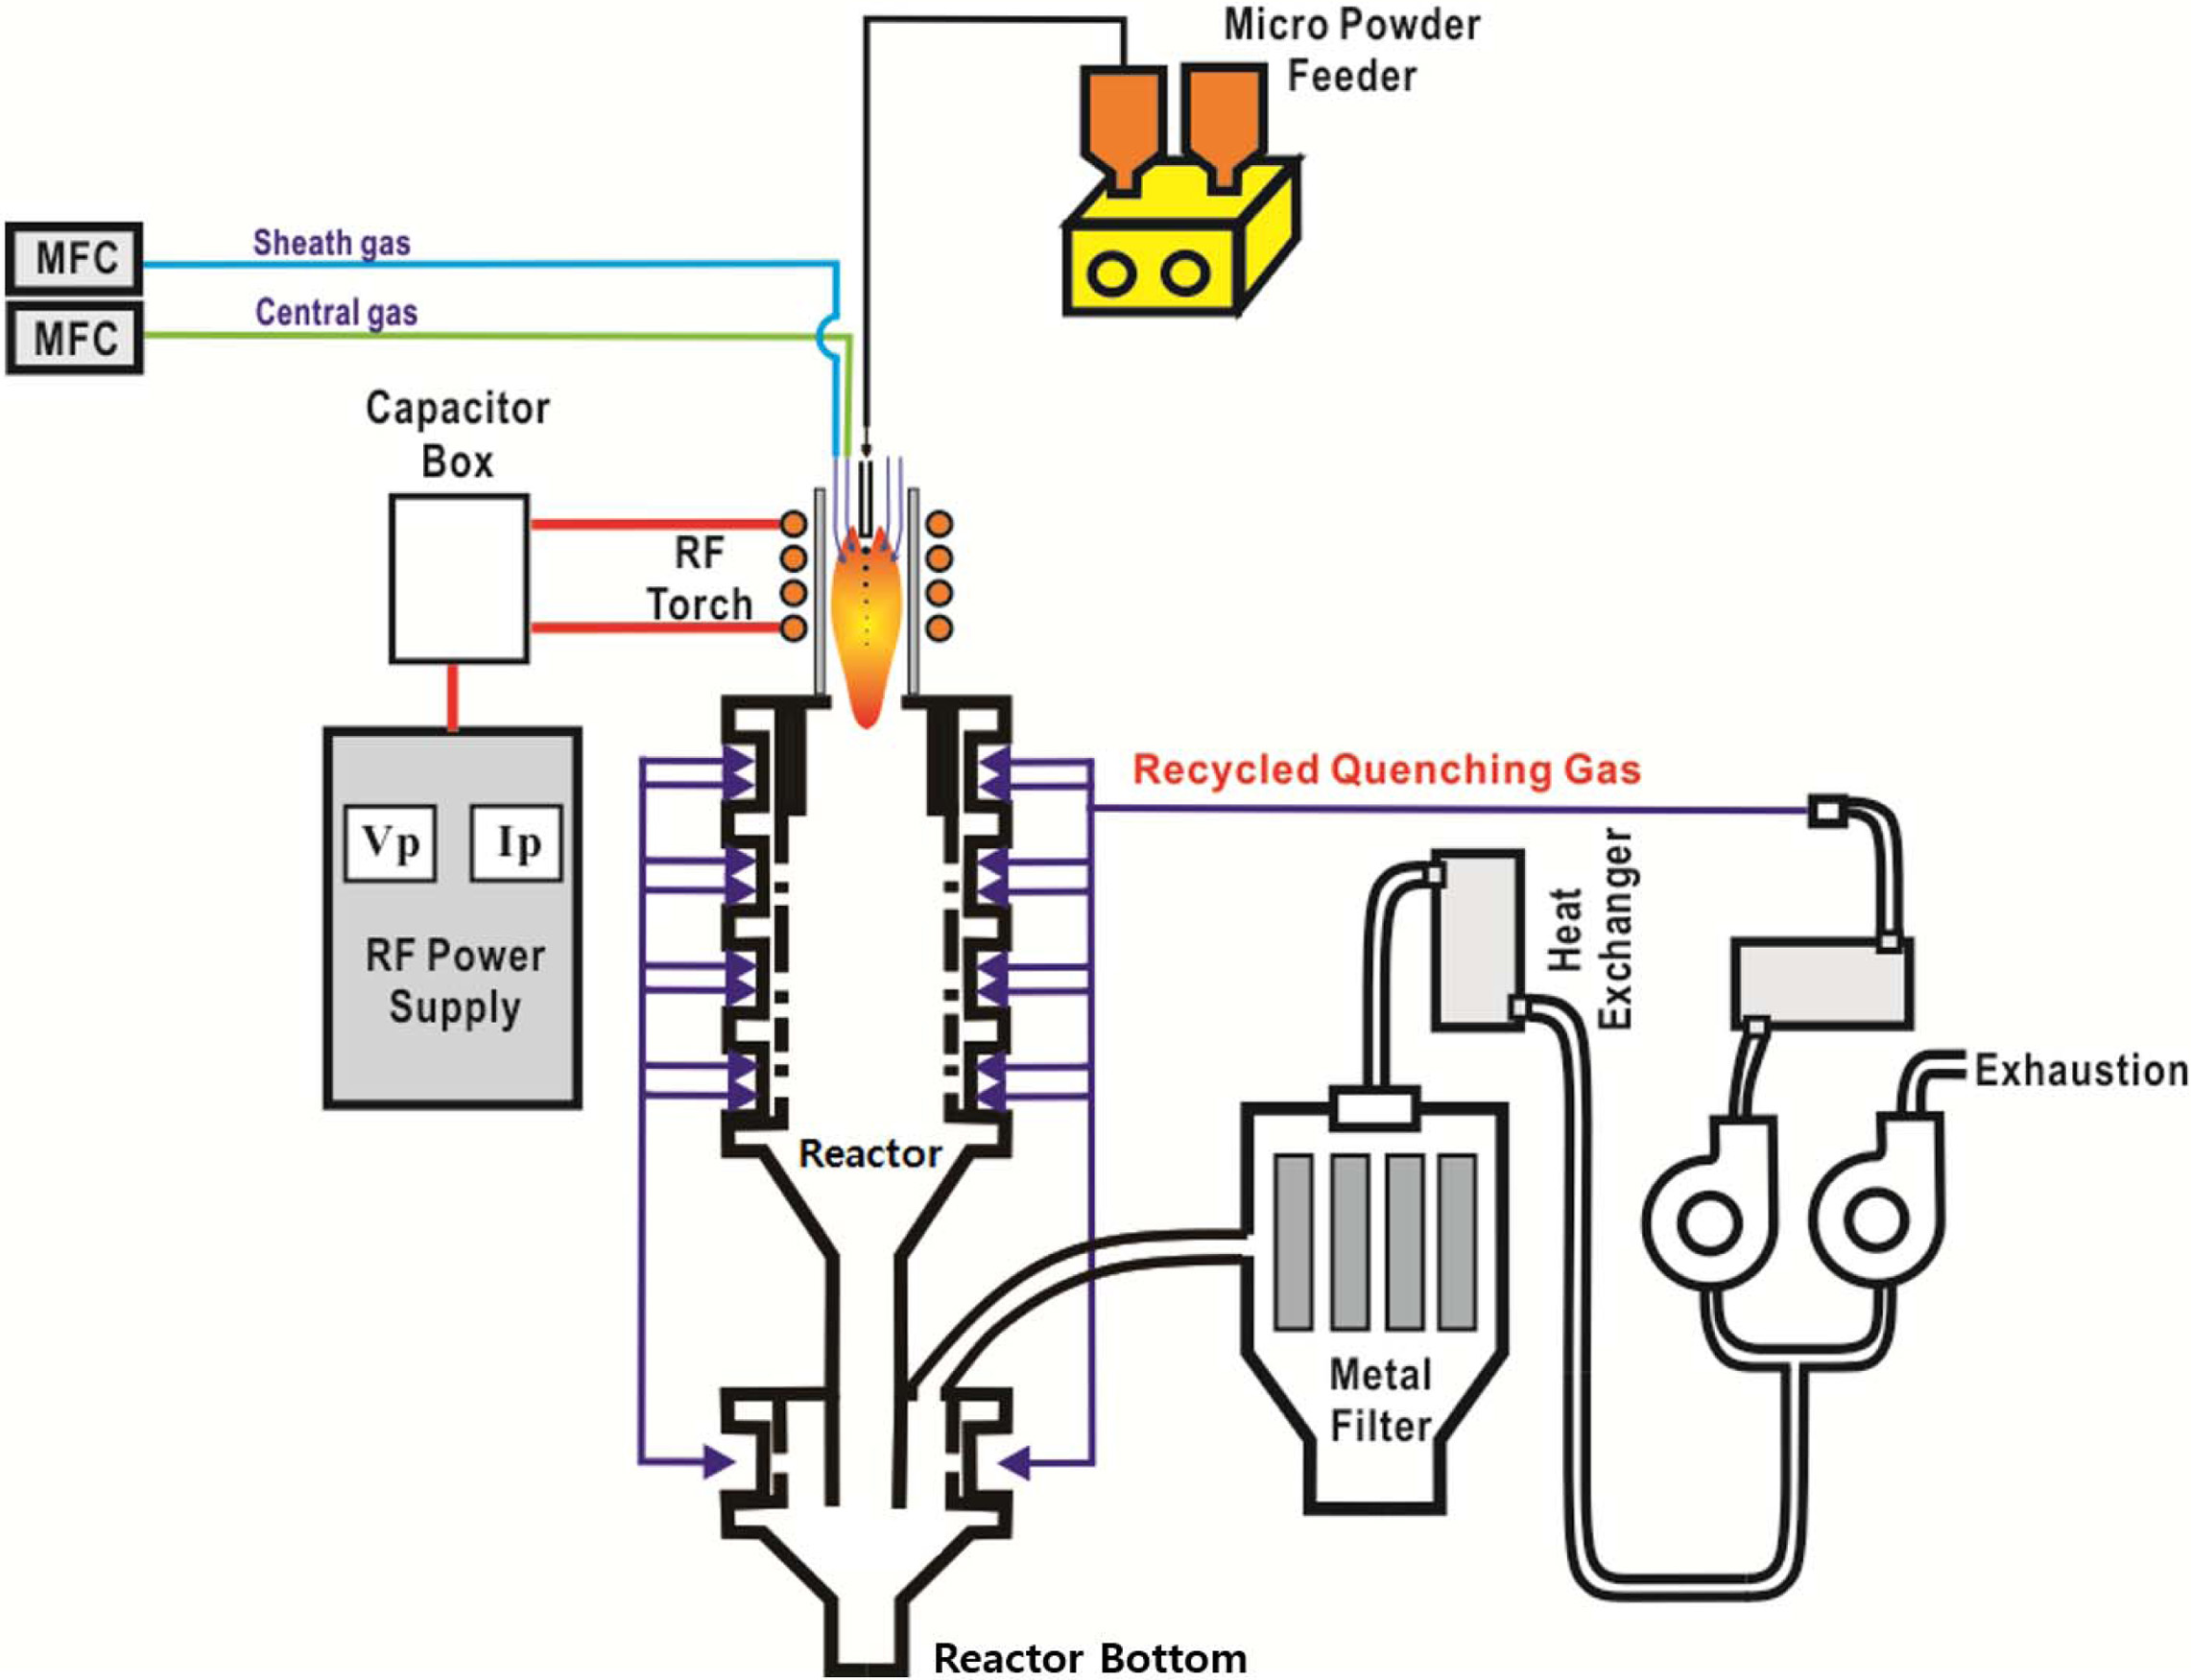
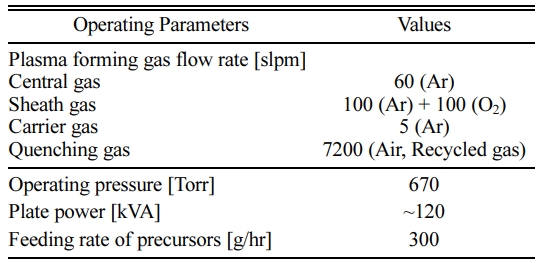
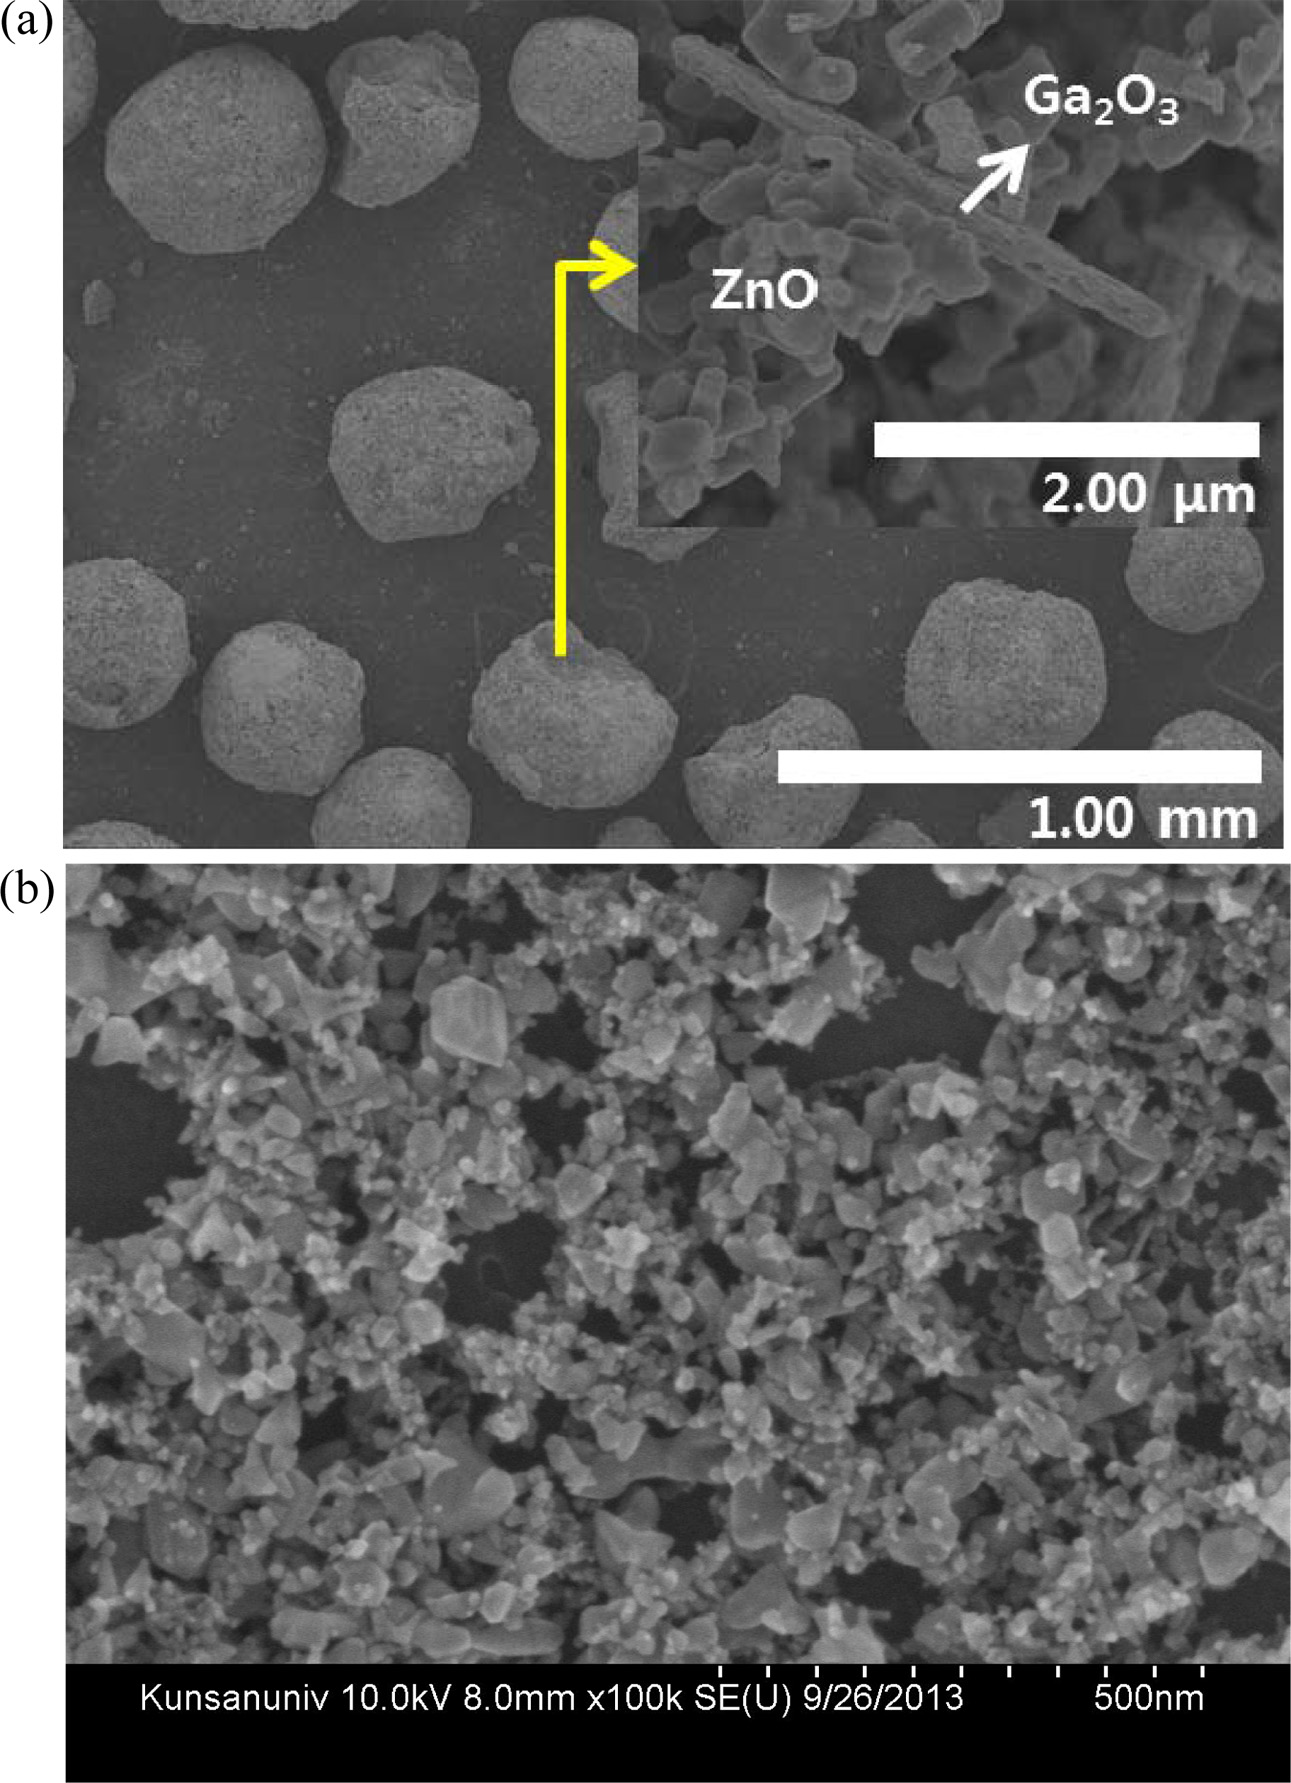
The mixture precursors used in this work was prepared by weighing the different sized powders of ZnO (< 1 um) and Ga2O3 (~1 um) at the weight ratio of 98 : 2 and 96 : 4, and then, mixing them for 8 hr by a tumbling ball mill. A plastic jar with inner diameter of 150 mm was employed as a mill body, which was filled with not only the oxide mixture precursor but also the mill media of zirconia balls having diameters of 0.5, 1 and 5 mm. Fig. 2(a) and (b) show the FE-SEM images of ZnO and Ga2O3 used in this work, respectively. The injected precursors were treated by RF induction plasma generated at the plate power level of 120 kVA and the as-treated products were retrieved at the filtration part, which consists of the stainless-steel metal filters. The details of the experimental con- ditions, such as, plasma gas flow rates and the feeding rates of the solid precursors, are listed in Table 1.
Characterization of Ga-doped ZnO nano-powders
The particle morphologies and sizes of the precursor and the plasma-treated powders were analyzed using a field emission scanning electron microscopy (FE-SEM, S4800, Hitachi Ltd., Japan). In addition, the phase and structure of the powders were analyzed with an X-ray diffractometer (D8Advance, Bruker AXS GmbH., Germany). The X-ray diffraction (XRD) patterns for the powders were obtained in 2-theta (Bragg angles: the angle between incident and reflected X-rays) range of 15o to 90o with copper Kα radiation source (λ = 1.5406 Å In addition, incorporation of Ga atoms into ZnO was also checked using a transmission electron microscope - energy dispersive X-ray spectroscopy (TEM-EDX, INCA X-sight, Oxford, UK). Finally, the composition of precursors and the as-synthesized powders were analyzed by x-ray fluorescence (XRF, ZSX Primus, Rigaku corporation, Japan).
Numerical modelling of plasma flow
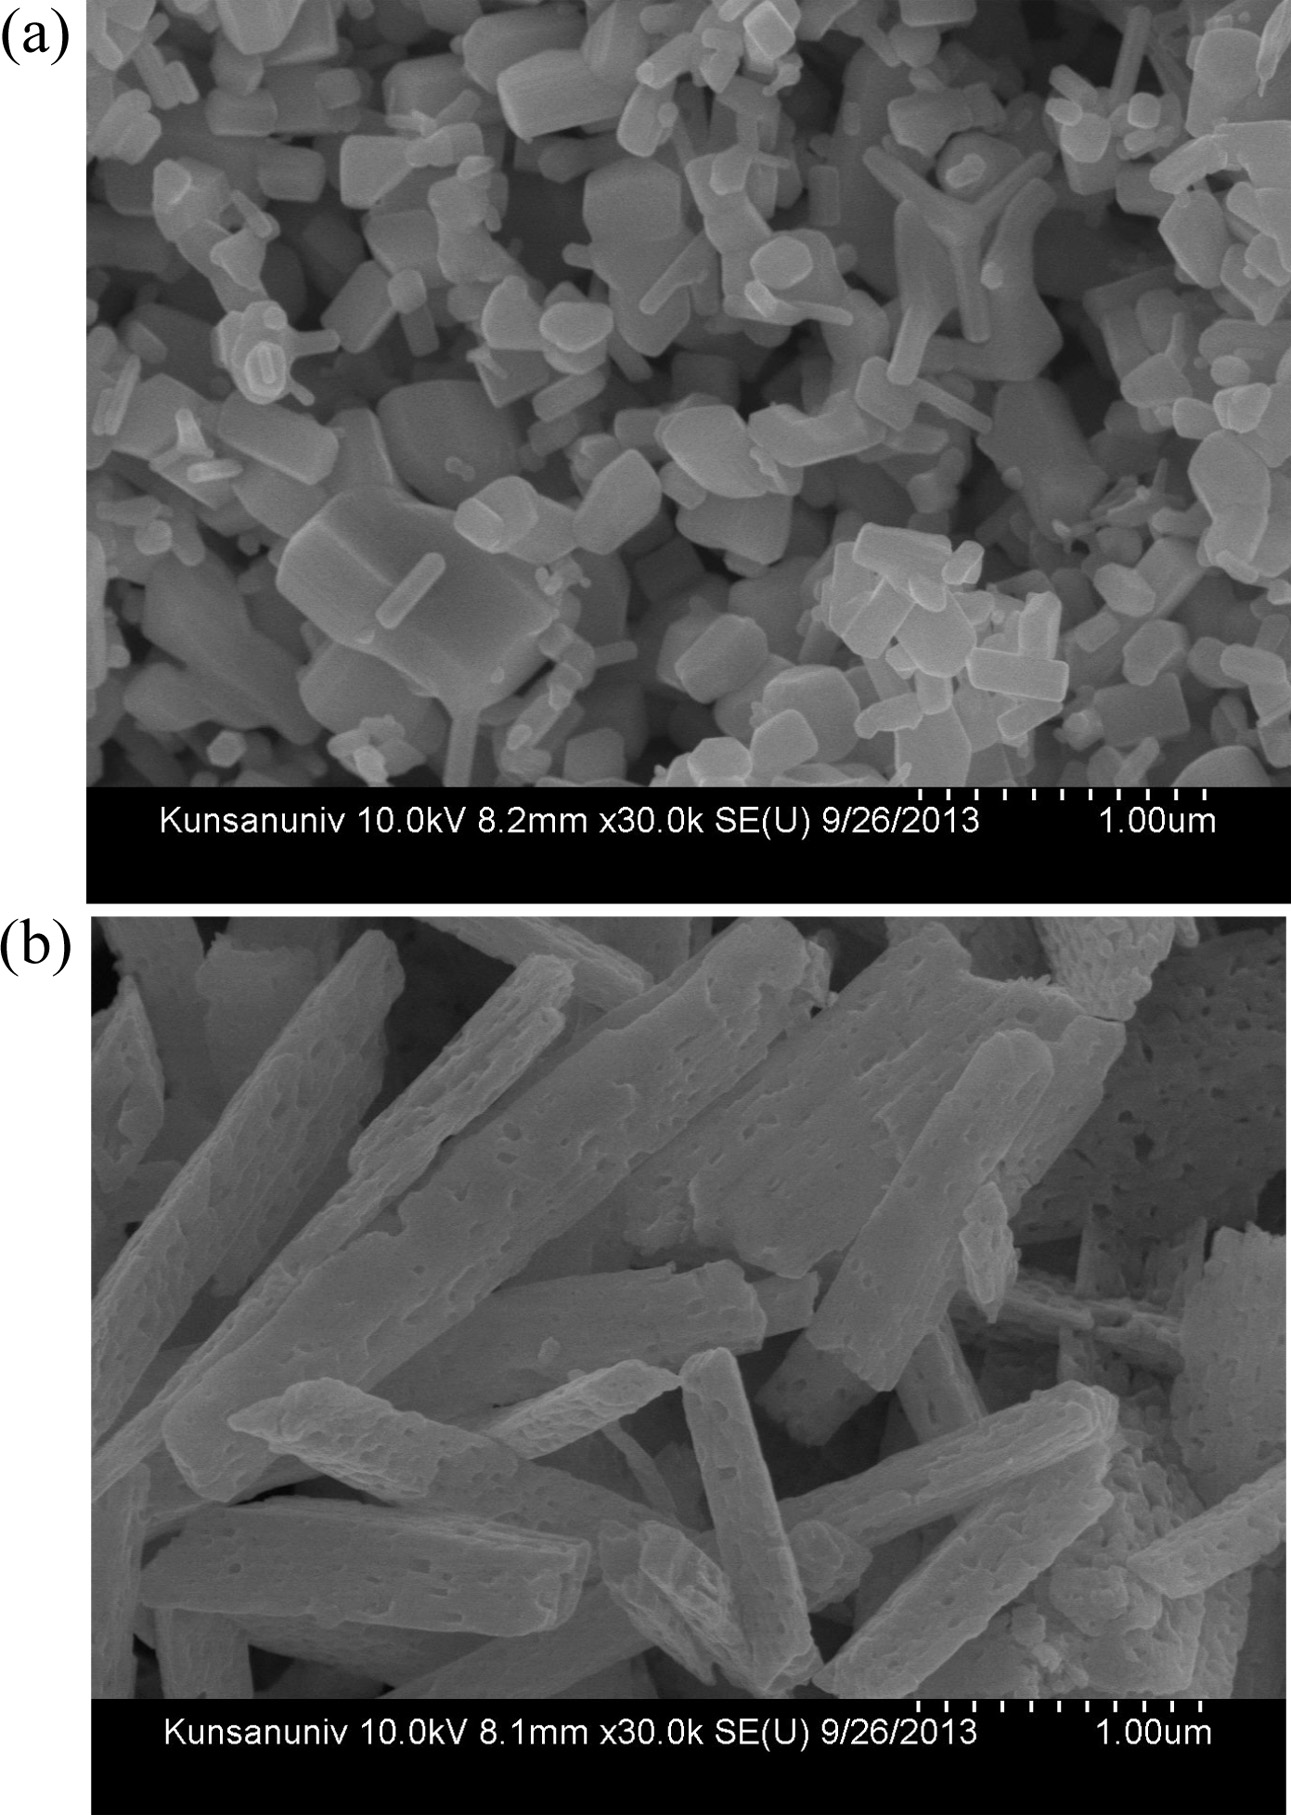
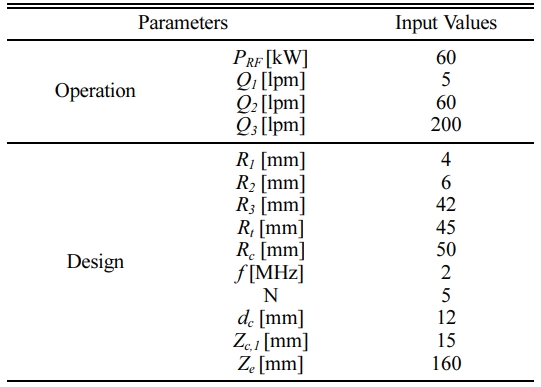
Fig. 3 shows a schematic diagram of an RF induction plasma torch employed for numerical simulation study. In this figure, the main design parameters, such as the inner diameter and the length of confinement tube, the coil turn numbers and the structure of the precursor injector are determined to have similar dimension of the commercial RF induction plasma torch (Tekna, PS-100). Table 2 list up the details of the torch dimensions and operating conditions used in the present numerical simulation. In this Table, the values of operating parameters were selected to reflect the experimental condition as listed in Table 1. For example, the terms of Q1, Q2 and Q3 in Table 2 represent the flow rates of carrier gas, central gas and sheath gas, respectively, each value of which are the same with that listed in Table 1. Different from the experimental condition in Table 1, however, we assumed that the carrier, central and sheath gases in Table 2 are injected into the torch as an Ar-O2 mixture with an averaged O2 content of 10 vol.% for practical computation of Ar-O2 RF induction plasmas. Normally, secondary gases, such as O2, N2 and He are injected as sheath gas in order to protect the torch wall from the excessive heating by Ar plasma [15-17]. In addition, sheath gases are normally supplied with a swirl for stable confinement of RF-induction plasmas, which allows most of secondary gases to flow down along the torch wall due to the centrifugal force. For example, Bhuyan et al. [17] showed that when the helium gases of 50 vol.% were injected as sheath gases with a swirl component, the He contents can be kept at the levels of ≤ 10 vol.% in most region of RF induction plasmas except near the torch wall. Taking into account that most of the injected solid precursor will pass the torch along the central column of the plasma [18, 19], accordingly, Ar-10% O2 RF induction plasma was expected to provide the Ga2O3 and ZnO particles with thermal flow fields similar to experimental conditions in Table 1.
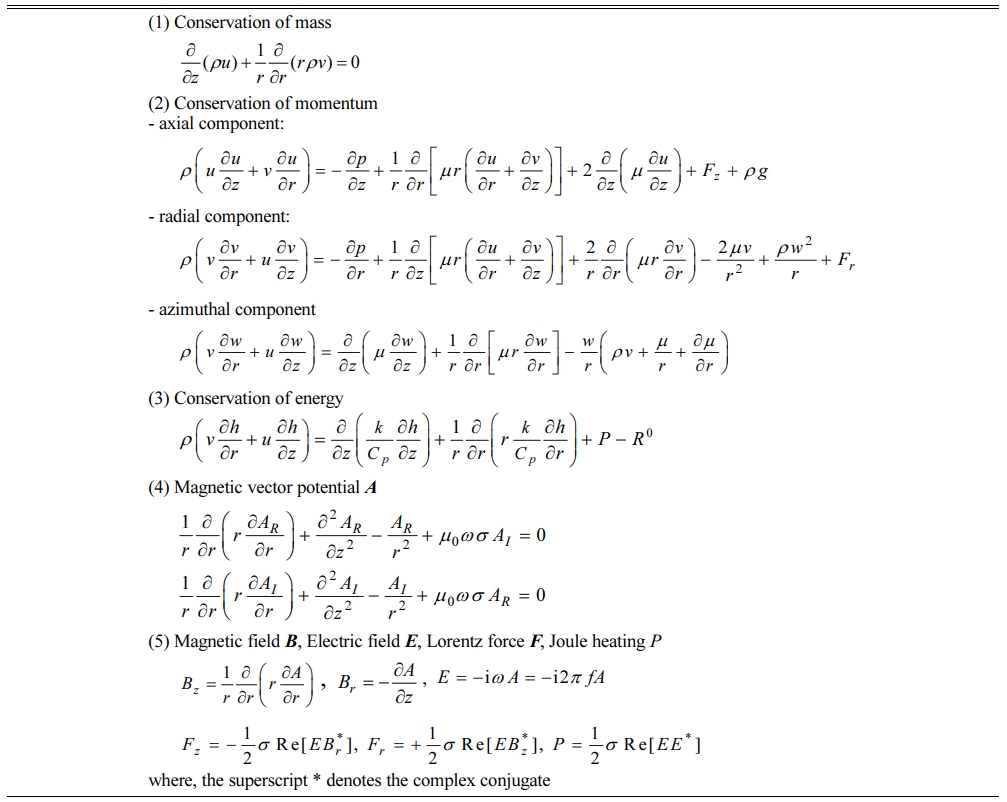
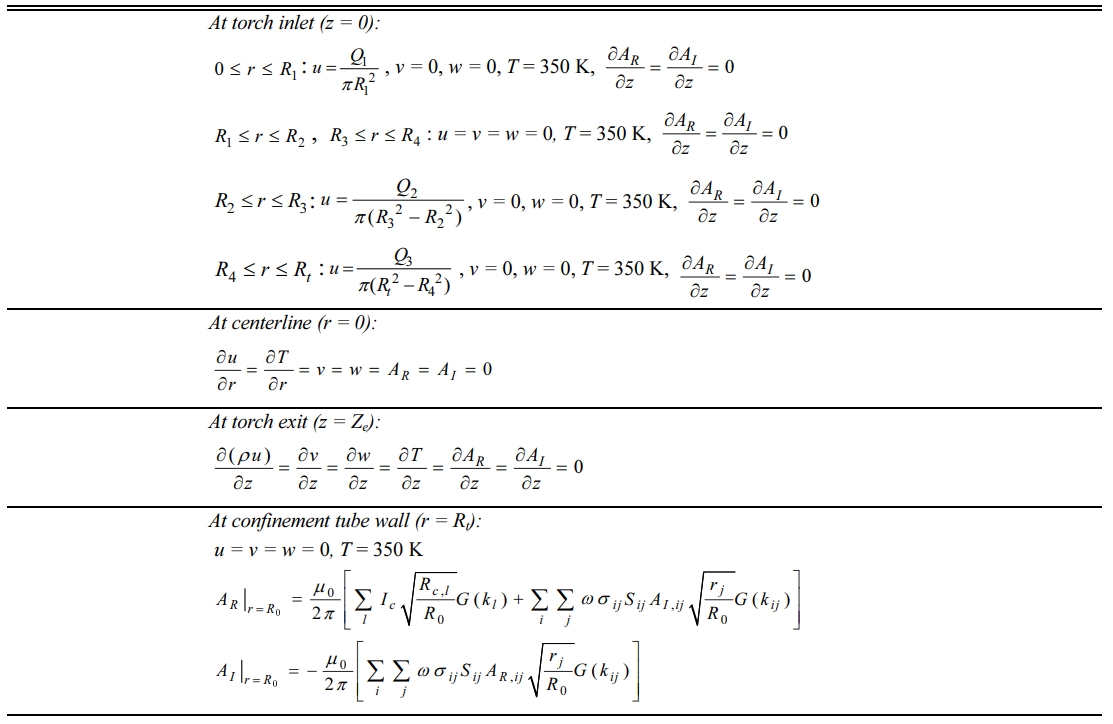
In addition, the term, PRF in Table 2 means the plasma power level, which corresponds to the electrical power delivered to the plasma from the plate power of the RF power supply listed in Table 1. Considering that the delivering efficiency of the plate power ranges in 40% - 60% for a commercial vacuum triode, the value of PRF was determined at 60 kW in this work for numerical modelling. Moreover, we summarized the governing equations and boundary conditions for this numerical study in Tables 3 and 4, respectively. Theses equations and boundary conditions have been widely employed in RF induction plasma simulation [15-21]. For example, the thermal flow dynamics of RF plasma can be depicted by the conservation equations of mass, momentum and energy listed in Table 3. In these con- servation equations, u, v, and w mean the axial, radial, and azimuthal components of the velocity vector, respectively while the terms r, p, m, and g are the density, pressure and viscosity of plasma forming gas, and gravity, respectively. In energy equation, k, Cp, P and R0 represent the thermal conductivity, the specific heat at constant pressure, the volumetric Joule heating and the radiation loss in an RF induction plasma, respectively.
Furthermore, Tables 3 and 4 list a set of mathe- matical expressions for the magnetic vector potential A, corresponding to the governing equations and boundary conditions for the calculation of the electromagnetic fields in an RF induction plasma torch. In these equations, the subscripts R and I indicate the real and imaginary parts of the magnetic vector potential A, respectively, i.e., A= AR + i AI , where i =  . The term of s indicates the electrical conductivity of an RF thermal plasma. From the magnetic vector potential A, the magnetic field and electric field can be calculated, which enables the computation of the Lorentz force and Joule heating according to the mathematical formulations presented in Table 3. Finally, the computational domains inside the RF torch are divided into 1,800 mesh shells by rectangular grids (45´40). All governing equations are discretized by the finite volume method (FVM) and calculated using the SIMPLE algorithm [22]. In addition, the following assumptions were employed for the present numerical model:
1) Negligible displacement current in the plasma,
2) Laminar flow,
3) Optically thin plasma, and,
4) Local thermodynamic equilibrium (LTE).
Numerical simulation of single particle behaviors
In order to understand the experimental result, particle behaviors were simulated for a single ZnO and Ga2O3 particle flying along the RF induction plasma flow. Normally, the particle injected into RF plasma torch is expected to undergo a complicated heating process including phase changes from the solid state to melted droplet or vapors. In order to simplify the calculation for this heating process, the following assumptions were adopted:
1) The injected ZnO and Ga2O3 are spherical shaped.
2) Particle behavior has no influence on the thermal flow fields of plasma
3) Particle motion is determined by gravity and drag force only.
4) Vaporization of particles by thermal plasma are calculated but the melting and re-solidification process is not considered.
5) Radiation heat transfer from the particle is neglected.
6) Particle is assumed to disappear when the radius of the particle becomes less than 10-10 m.
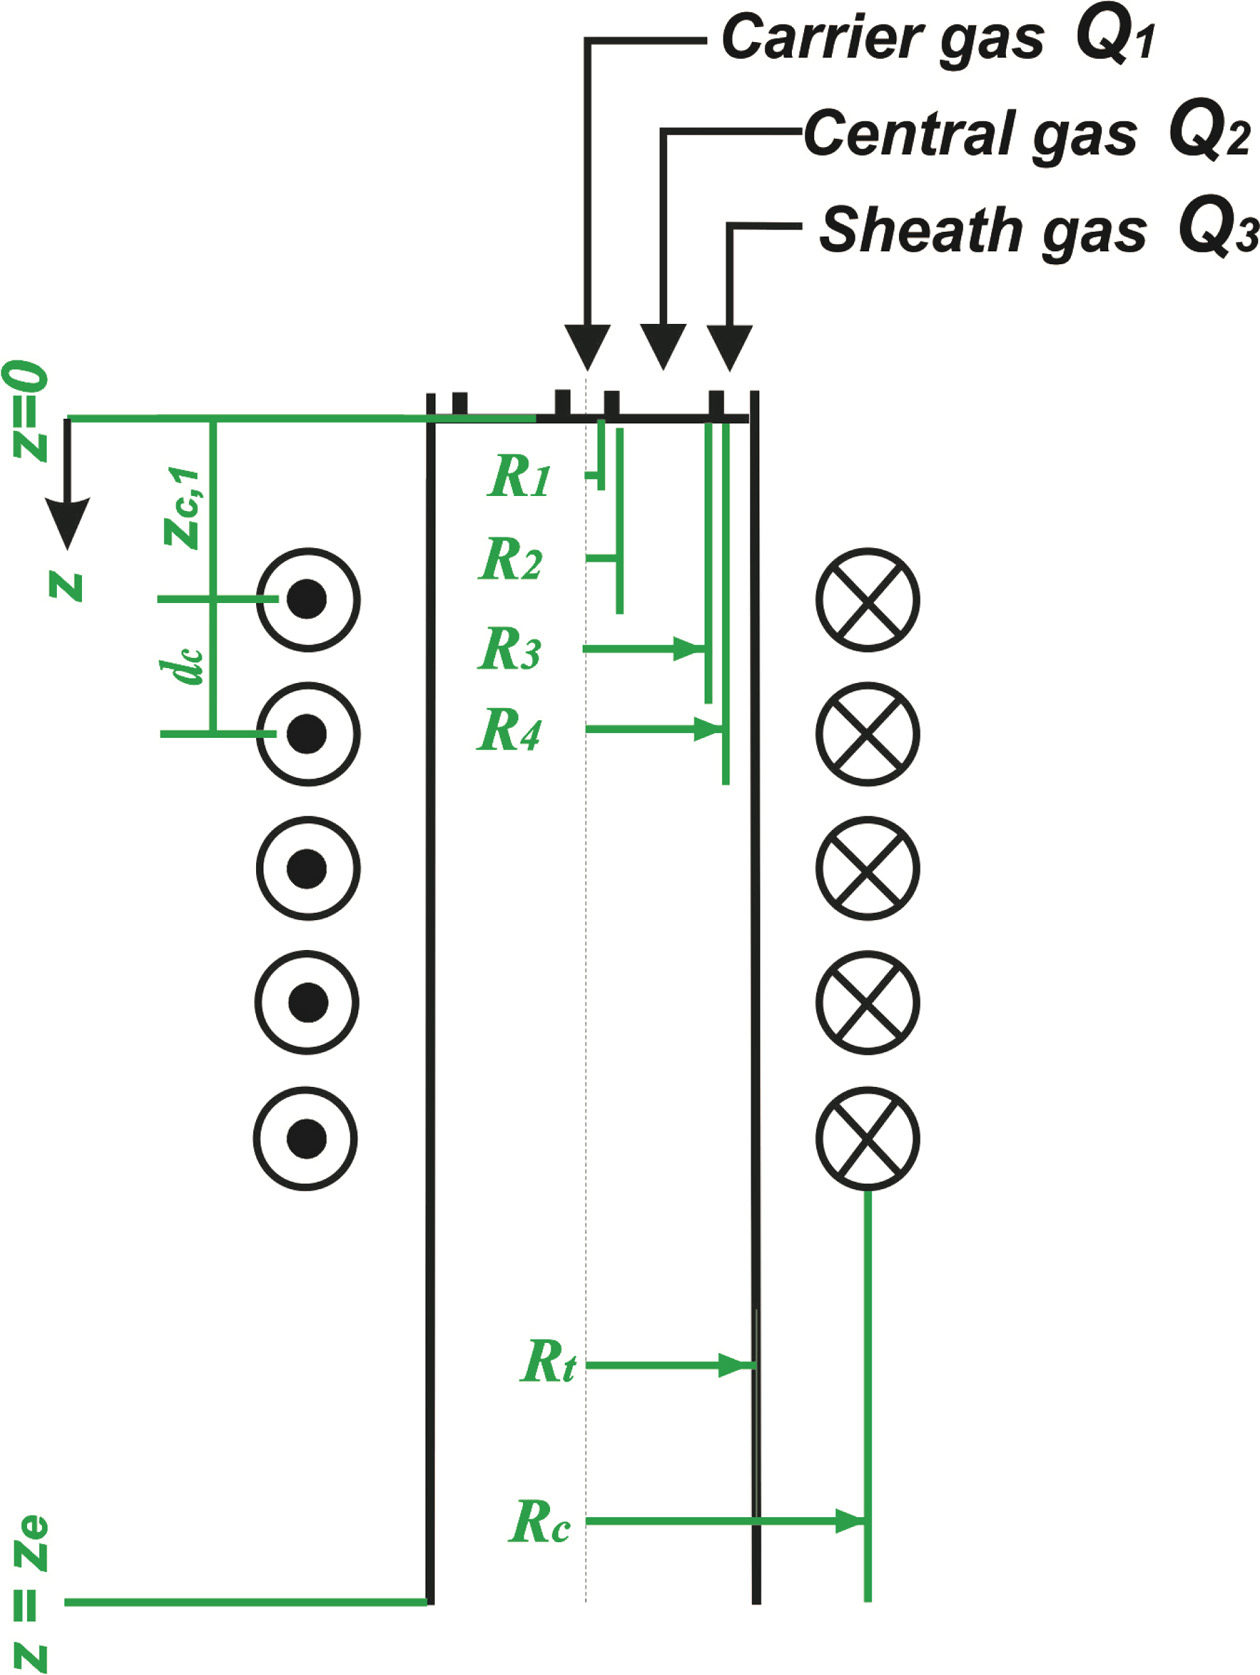
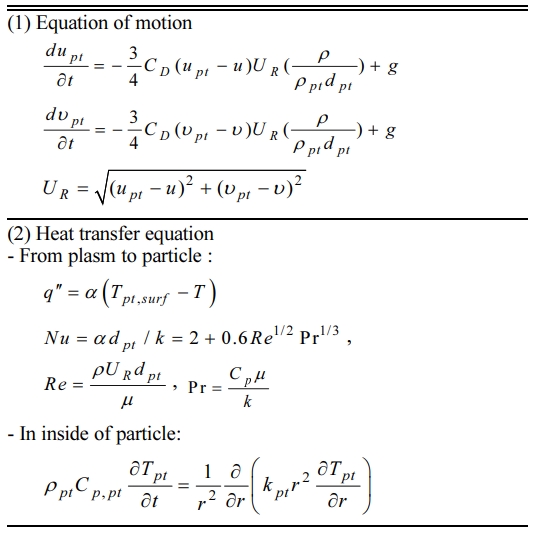
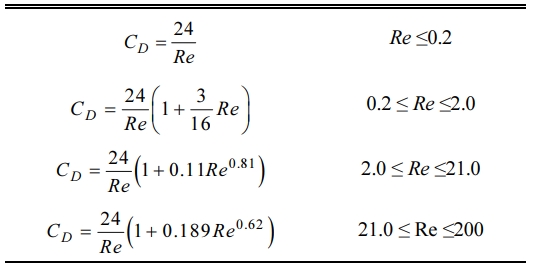
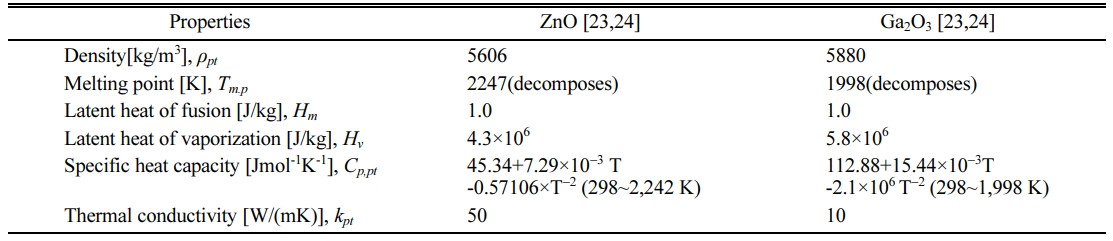
With these assumptions, the particle behaviors during the flight can be described by the equations of motion and heat transfer, which are listed in Table 5. In these equations, upt and vpt are the axial and radial components of the particle velocity vector, respectively, while the terms rpt, and dpt are the density and the diameter of the injected particle, respectively. In addition, CD means the drag coefficient of spherical particle placed in RF induction plasma flow, which is defined as a function of Reynolds number, Re = rURdpt/m, as presented in Table 6. In the equation of heat transfer, q'', α, Nu and Pr represent the heat flux from plasma to particle, convective heat transfer coefficient, Nusselt and Prandtl numbers, respectively. The terms, kpt, and Cp,pt are the thermal conductivity and the specific heat at constant pressure of the particle, of which values are listed in Table 7 together with other physical properties of ZnO and Ga2O3. Finally, Tpt,surf and Tpt mean the surface and bulk temperatures of the particle, respectively. Detailed calculation processes for the equations in Table 5 can be referred to our previous work [19] and other references of [23]. For example, in Table 5, the heat transfer process from plasma to particle was calculated from the energy balance on the particle surface, as expressed in following equation:
First, the surface temperature of the particle can reach the melting point, Tmp during the flight of RF torch due to the heat flux from plasma to particle as described in Eq. (1). At this melting point, the particle diameter is calculated according to Eq. (2). In this calculation step, the particle begins to decrease in diameter if heated above the latent heat of vaporization since both of ZnO and Ga2O3 decompose at the melting point as shown in Table 7. Then, the temperatures of particles are re-calculated according to heat conduction equation in inside of particle as presented in Table 5 and the above process is repeated. Finally, when the particle diameter becomes less than 10-10 m, the cal- culation process is stopped according to the assumption for complete evaporation.
|
Fig. 1 A schematic of the RF induction plasma system for the synthesis of nano-sized GZO powders |
|
Fig. 2 FE-SEM images of (a) ZnO and (b) Ga2O3 used for preparation of the mixture precursor. |
|
Fig. 3 A schematic of the RF induction plasma torch depicted with its operation and design parameters for numerical modeling. |
|
Table 1 Operating parameter values in the synthesis of nano GZO powders by RF induction plasma treatment. |
|
Table 2 Details on the operation and design parameters for the numerical simulations of RF thermal plasma |
|
Table 4 Boundary conditions for the numerical simulations of RF induction plasma. |
|
Table 5 Motion and heat transfer equation for a single particle injected into RF induction plasma torch. |
Synthesis of Ga-doped ZnO nano-powders
Fig. 4(a) and (b) show the FE-SEM images of the RF induction plasma treated powders with Ga2O3/ZnO ratios of 4 wt.%, which were retrieved from reactor bottom and filtration, respectively. For the bottom-retrieved powders, firstly, Fig. 4(a) reveals that the unevaporated Ga2O3 and ZnO powders sintered together to form the spherical structures with the sizes of sub-millimeters. These spherical structures seem to result from the injection of the agglomerated mixture precursor with sizes of sub-millimeters. Due to the poor fluidity of the micron-sized oxide powders, the mixed particles of ZnO and Ga2O3 are easily collected into a porous mass during their feeding. Normally, a porous mass injected into RF thermal plasmas can experience relatively large temperature gradients within the constitutive particles [24], thus, sintering process between constitutive particles can be preferred to their full evaporation. As a result, a sintered ceramic ball with the sizes of sub-millimeters can be formed as shown in Fig. 4(a). Different from the bottom-retrieved powders, however, small particles of < 100 nm were observed in the filtration-retrieved powders as presented in Fig. 4(b). Normally, ZnO decomposes into vapor species without melting at high temperatures of 2,247 K and Ga2O3 also becomes unstable higher than 1,998 K, boiling point [25, 26]. In addition, the filtration is connected to the reactor by a relatively long pipe for transporting the particles quenched at high flow rate of gas (~7,200 slpm) as recorded in Table 1. Accordingly, those nano-sized particles retrieved in the filtration can be formed through the nucleation and growth of the ZnO and Ga2O3 vapor species. Furthermore, the vapor species of ZnO and Ga2O3 can co-condense into the Ga doped ZnO nano-powders during the quenching process as expected in this work.
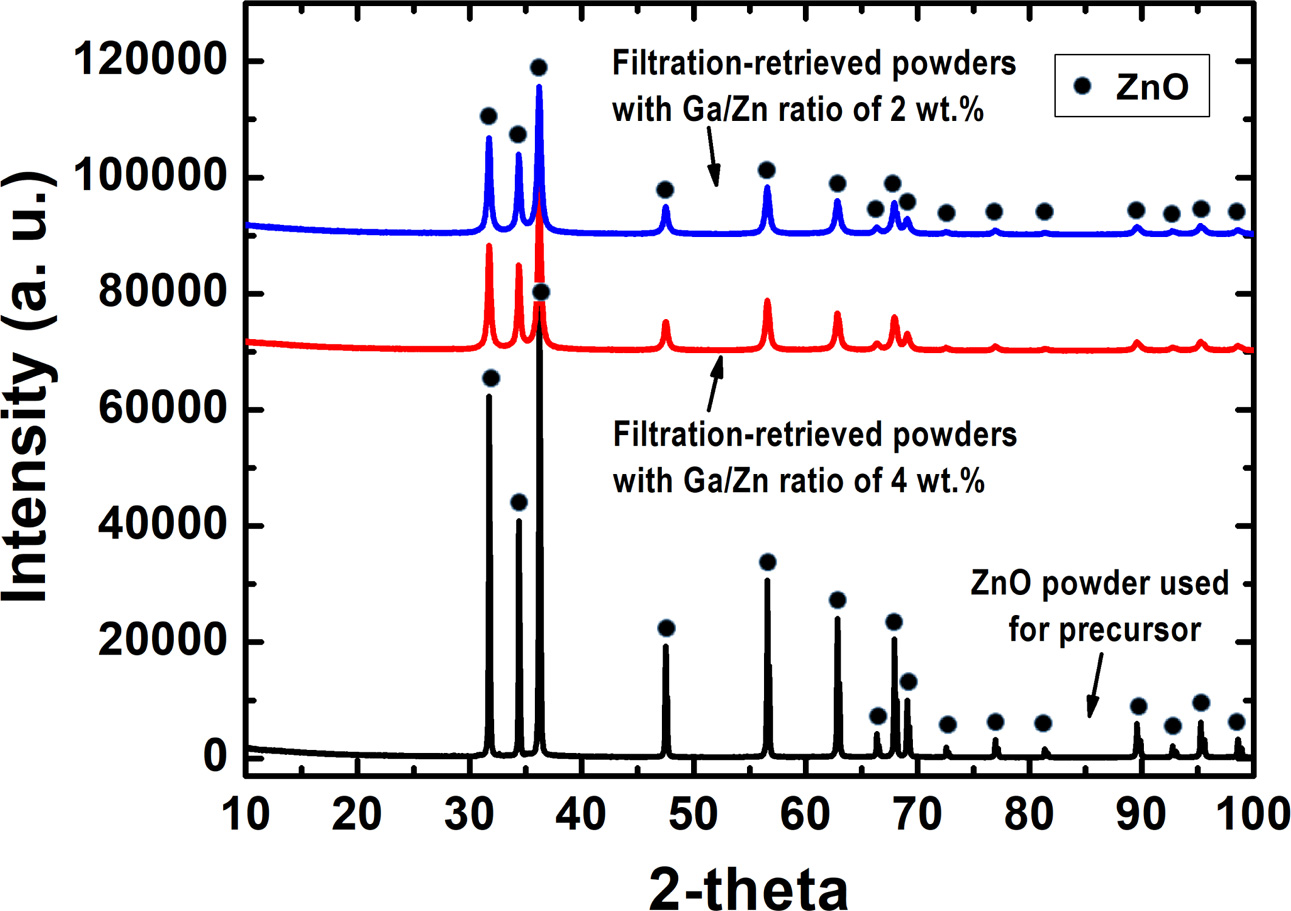
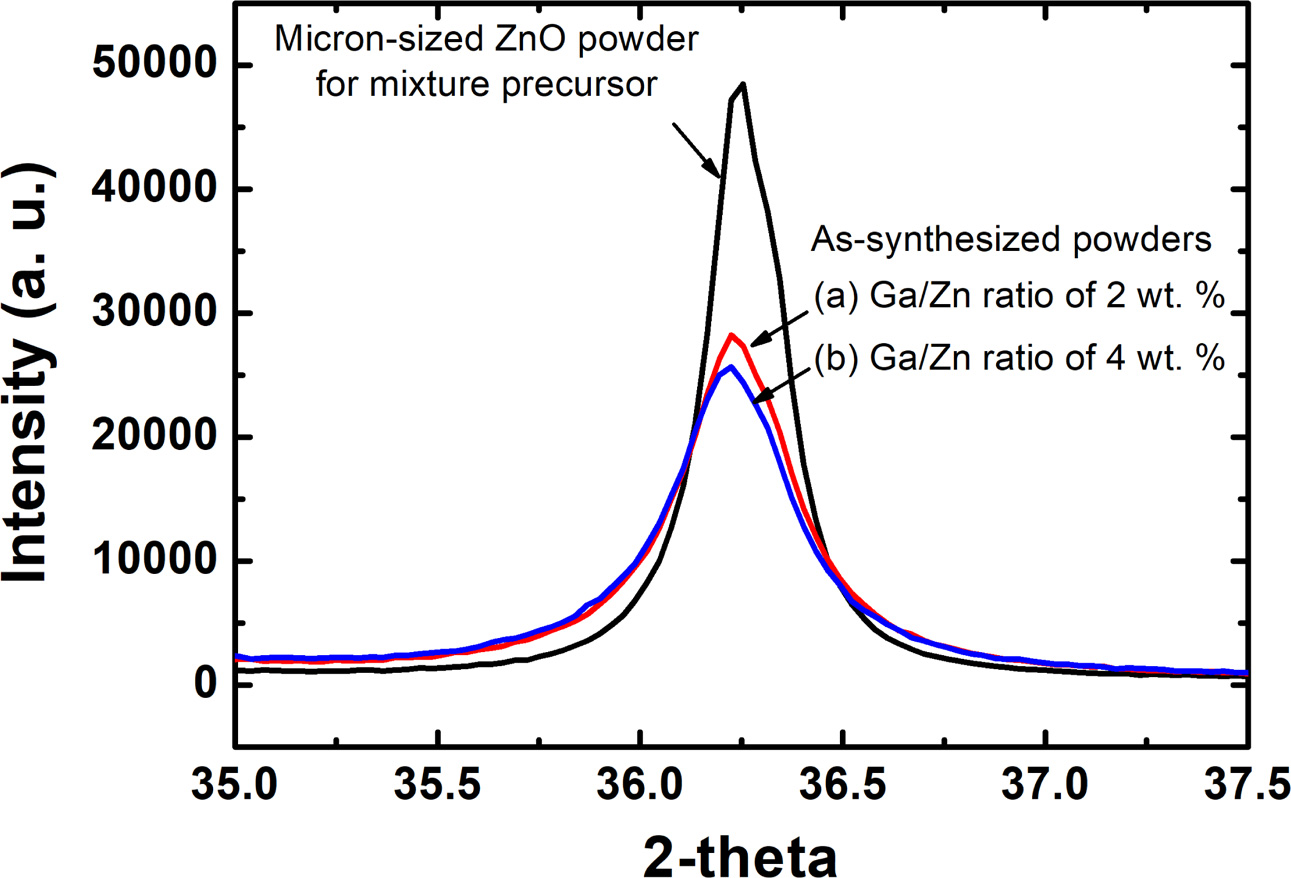
In order to confirm the formation of GZO nano-powders, the XRD patterns of the filtration-retrieved powders were compared with those of ZnO powders used for mixture precursors as shown in Fig. 5. In this XRD graph, one can see that the crystalline peaks of the filtration-retrieved powder correspond to the crystalline peaks of ZnO whereas those for Ga2O3 were absent, indicating that nano-powders with a single phase of ZnO structure were synthesized. In addition, the main peaks for the as-synthesized powders were broadened and shifted to lower Bragg angles (2-theta) due to the solid solution of Ga2O3 as observed in Fig. 6.
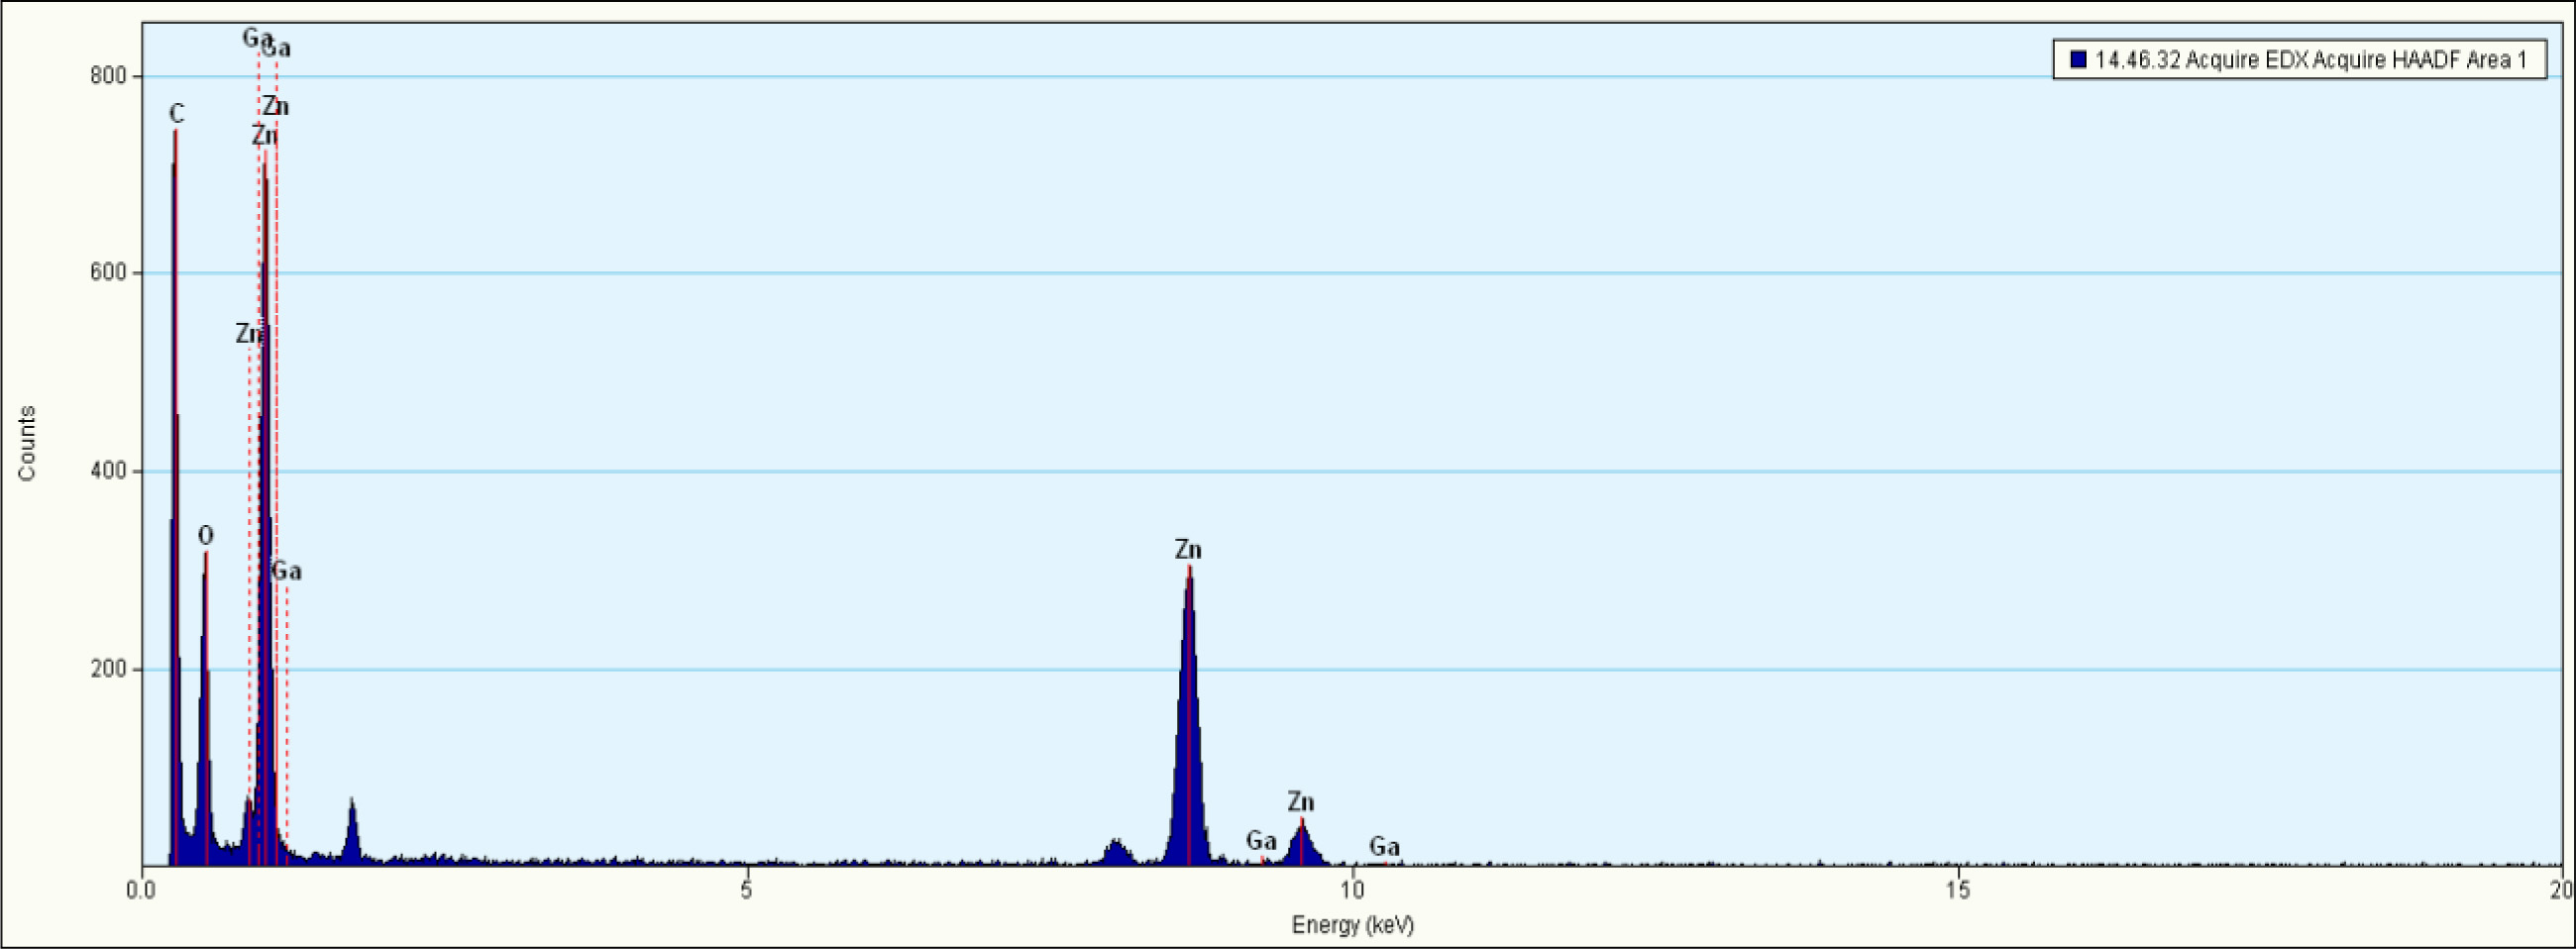
Fig. 7 shows TEM-EDX patterns of the filtration-retrieved powders with cation ratio of Ga2O3/ZnO = 2 wt.%. In this figure, the elements of Ga were obviously observed in the as-synthesized nano-powders. Together with the XRD results of Fig. 5 and 6, these TEM-EDX results indicate that nano-sized GZO powders with single phase of ZnO structure can be produced in the filtration-retrieved powders by the in-flight RF induction plasma treatment of the mixture precursor consisting of Ga2O3 and ZnO.
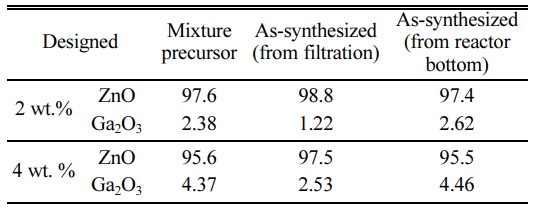
Finally, XRF analyses have been conducted to check the changes in the composition between the mixture precursors and the as-prepared nano-powders depending on the collected position, as listed in Table 8. In this table, the Ga content of the filtration-retrieved GZO nano-powders was reduced higher than 40% compared with the mixture precursors for both of Ga2O3/ZnO ratio of 2 and 4 wt.%. This decrease of Ga content in the filtration-retrieved nano-powders may be attributed to the relatively complicated vaporization process of Ga2O3. Normally, Ga2O3 particles in oxidizing environment vaporize into Ga2O (g), GaO (g) and Ga (g) at the temperatures higher than melting point, depending on the thermodynamically determined contents of each vapor species [25, 27]. However, when the temperatures are elevated under oxygen deficient atmosphere, the contents of volatile sub-oxides, such as Ga2O (g) and GaO (g) can be increased due to the early decomposition of Ga2O3 at the temperatures lower than melting point [27, 28]. Considering that, due to the O2 gas injection through the sheath gas port, oxygen deficient zone can be formed along the centerline of torch [16, 17], those sub-oxides can be produced easily during the in-flight treatment of Ga2O3. In the quenching zone including downstream of Ar-O2 RF induction plasma, however, oxygen is supplied sufficiently to form the oxidizing environment due to the high flow rate of quenching air and the fully diffused oxygen species from sheath gas. Accordingly, the volatile sub-oxides of Ga2O3 can pass the quenching zone without chemical reaction with ZnO or further decomposition into Ga (g) and oxygen, which can lead to the loss of Ga element in the filtration-retrieved nano-powders.
Numerical simulation of particle behavior
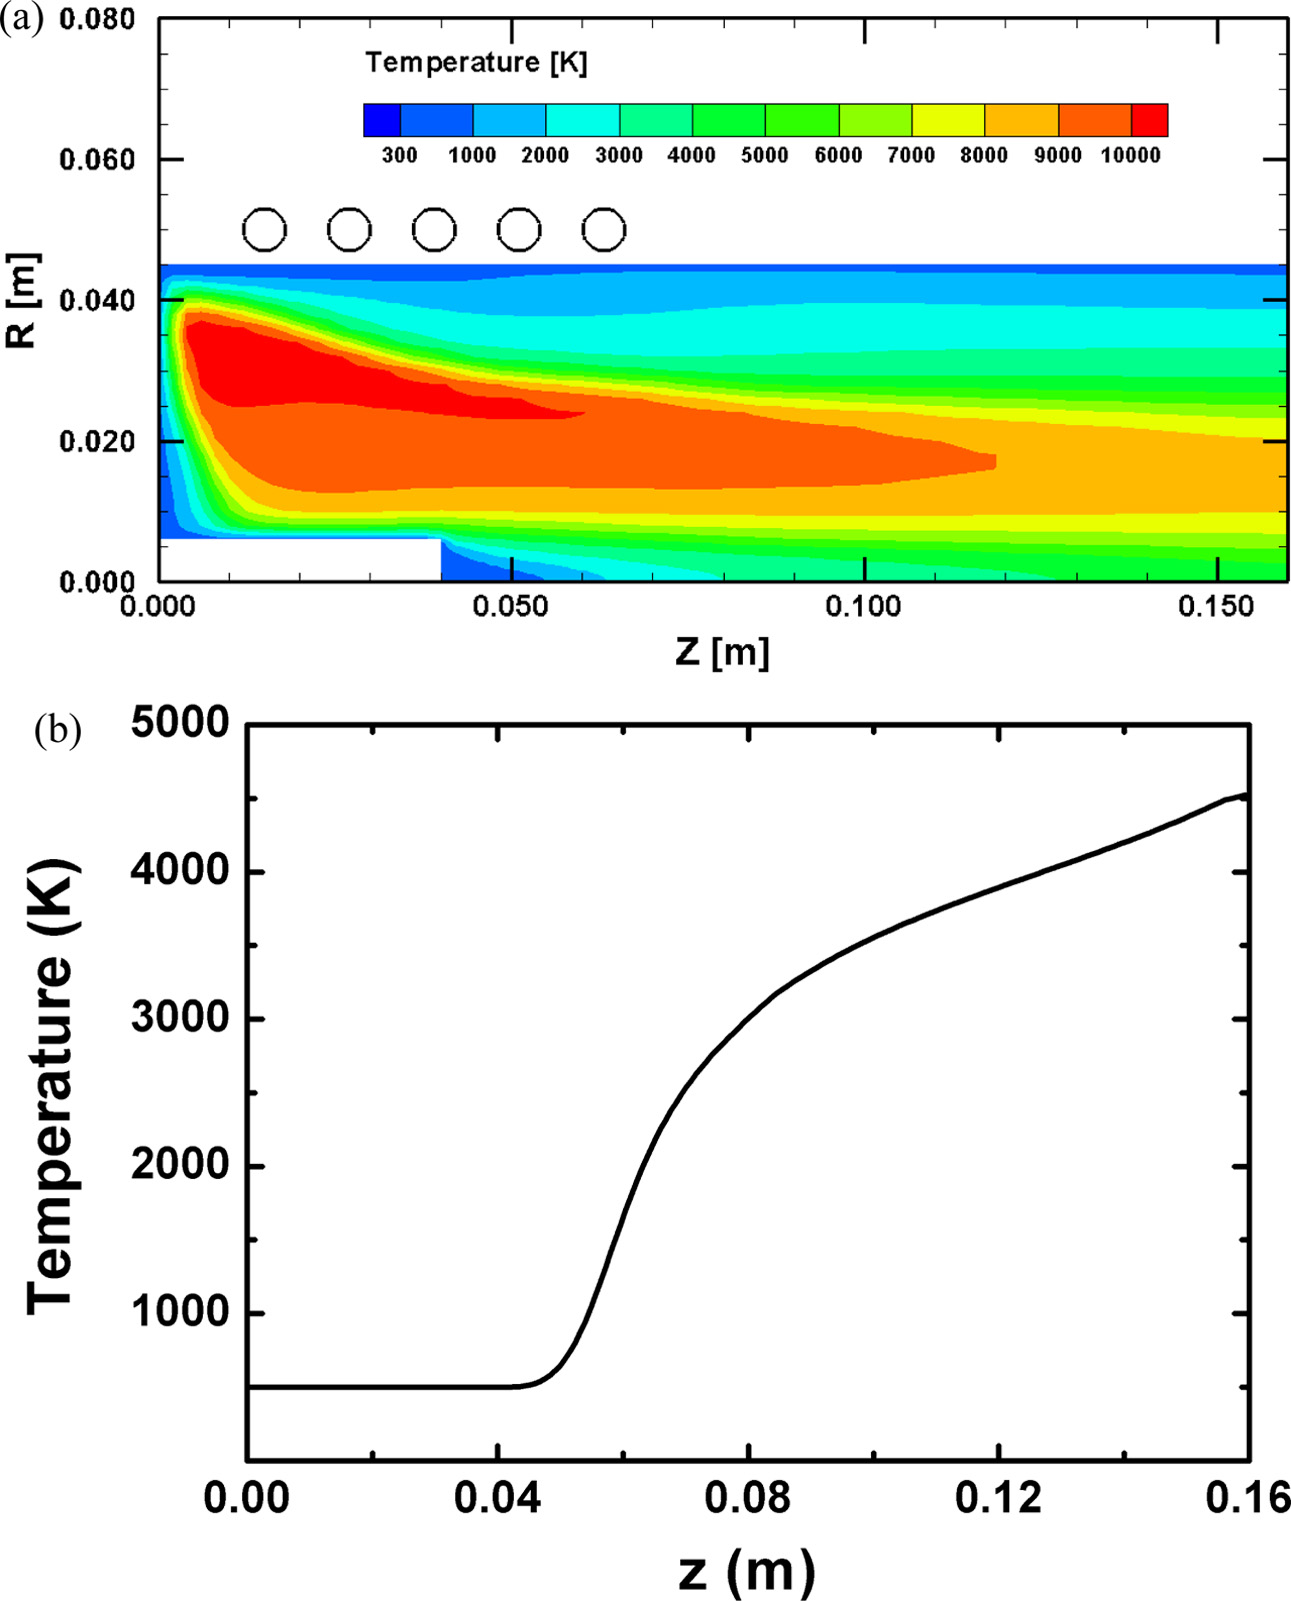
Fig. 8(a) and (b) show the temperature contours in inside of RF induction plasma torch and the plasma temperature distribution along the centerline, respectively. From these figures, the plasma temperatures are observed to monotonically increase to the torch exit along the centerline. In addition, except near the injector tip from z = 0.04 m to z = 0.063 m, the temperatures range in the values higher than melting points of ZnO and Ga2O3. Since most of the particles introduced into the plasma by an injector travel along the centerline of the torch due to the flow fields of RF induction plasma [18, 19], these distributions of plasma temperatures ensure the continuous heat transfer from ambient plasma to the injected oxide particles over their trajectories.
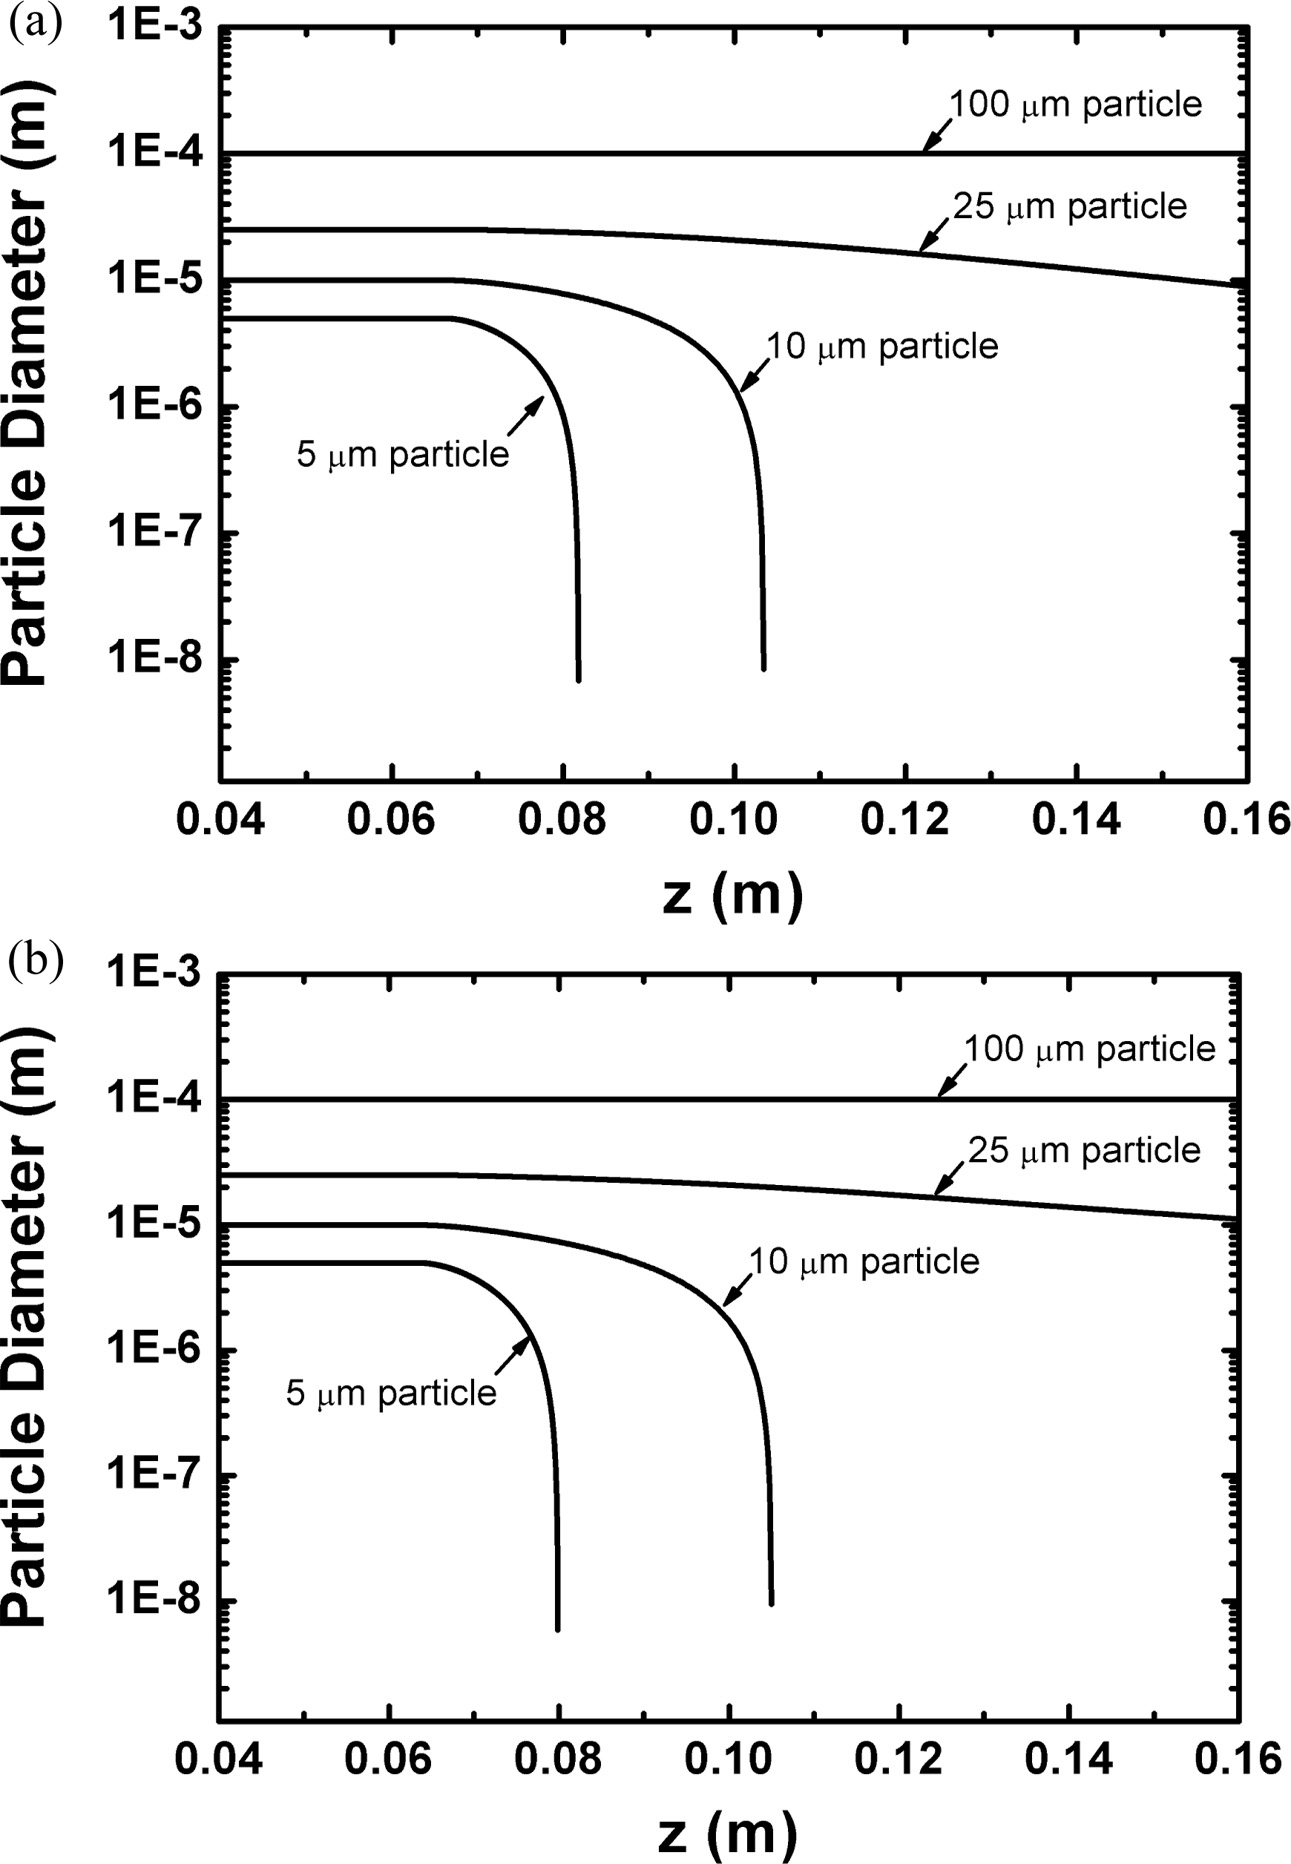
Fig. 9(a) and (b) show the numerical results of this heat transfer process to a single particle of ZnO and Ga2O3, respectively, with the diameters of 5, 10, 25 and 100 um. As expected, these figures reveal that both of ZnO and Ga2O3 particle with the diameters of ≤ 10 um can experience a full evaporation during the flight of RF torch. Considering that the sizes of mixture precursor were around 1 um as presented in Fig. 2, these numerical results support theoretically the formation mechanism of filtration-retrieved nano-powders, assuming that they are formed from the co-condensation between vapor species of ZnO and Ga2O3. In Fig. 9(a) and (b), however, large particles with diameters of 100 um are observed to hardly experience evaporation even at high power level of 60 kW due to the short residence time in inside of RF torch. These computational results for the 100 um particles indicate that the sub-millimeter sized spherical structures in the reactor bottom came from the injection of large particles with sub-millimeter sizes. Taking into account of poor flowability of the micron-sized oxides, these large particles with the sub-millimeter sizes can be attributed to the agglomeration of the micron-sized raw oxides (≤1 um) in the mixture precursor. On the other hand, the calculation results for the 25 um particles reveal that both of ZnO and Ga2O3 particle can experience partial evaporation. However, due to the poor thermal conductivity of Ga2O3 combined with high specific heat ratio as listed in Table 7, Fig. 9 show that ZnO vaporizes more than Ga2O3 during the passage of the torch, bringing the slight increase of Ga content to the bottom-retrieved powders. In addition, during the partial evaporation, the surfaces of Ga2O3 particles are kept in the melting state, which is in favor of Ga2O3 decomposition into volatile sub-oxides, such as Ga2O (g) and GaO (g) in oxygen deficient environ- ment [27, 28]. Consequently, relatively large amount of gaseous sub-oxides can be generated from the agglo- merated mixture precursor with several tens um sizes, leading to the Ga loss in the filtration-retrieved GZO nano-powders as observed from the XRF data in Table 8.
|
Fig. 4 FE-SEM images of the RF induction plasma treated powders with Ga/Zn ratios of 4 wt. % retrieved from (a) reactor bottom and (b) filtration |
|
Fig. 5 Comparison of XRD patterns between the filtrationretrieved powder and the micron-sized ZnO powder used for mixture precursor. |
|
Fig. 6 XRD patterns for the [002] plane of the filtration-retrieved powders with Ga/Zn ratios of (a) 0.0 wt.%, (b) 2.0 wt.% and (c) 4.0 wt.%. |
|
Fig. 7 TEM-EDX patterns of the filtration-retrieved powders with the preset cation ratio of Ga/Zn = 2 wt. %. |
|
Fig. 8 Numerical simulation results of (a) temperature contours in inside of RF induction plasma torch and (b) temperature distribution of plasma along the centerline of the torch. |
|
Fig. 9 Numerical simulation results of the particle behaviors for (a) ZnO and (b) Ga2O3. Both particles were assumed to have the diameters of 5, 10, 25 and 100 um. |
|
Table 8 Relative cation composition changes between the asmixed precursors and the as-synthesized powders (XRF Analysis). |
In this paper, we investigated the doping route of Ga into ZnO by in-flight RF induction plasma treatment of ZnO and Ga2O3 experimentally and numerically. As found in the FE-SEM images and the XRD data for the filtration-retrieved powders, first, the as-treated oxides were reformed into nano-powders with a single phase of ZnO. In addition, the peak shift shown in the XRD data confirmed that Ga3+ was incorporated into ZnO lattices, together with TEM-EDX patterns of the filtration-retrieved powders. Furthermore, the numerical results presented a theoretical possibility for the in-flight doping route of Ga into ZnO by revealing that micron-sized ZnO and Ga2O3 particles can be fully evaporated during the flight of RF torch. From these experimental and numerical results, we conclude that high-crystalline Ga doped ZnO nano-powders with a single phase of ZnO can be synthesized by RF induction plasma treatment of ZnO and Ga2O3.
Different from the filtration-retrieved powders, however, sub-millimeter sized powders were retrieved in the reactor bottom. FE-SEM images for the reactor bottom-retrieved powders revealed that raw particles of ZnO and Ga2O3 just sintered into these sub-millimeter sized powders without evaporation. Considering that the 100 um particles were predicted to experience no evaporation while the micron-sized can be fully evaporated from numerical results, these results can be attributed to the injection of agglomerated mixture precursor with sub-millimeter sizes. Finally, X-ray Fluorescence analysis data showed that gallium element was reduced for the filtration-retrieved powders while the slight increase of Ga content was observed in the reactor bottom-retrieved powders. From the numerical results for 25 um particles, predicting partial evaporation during their flight of RF induction plasma, these changes of Ga content seem to be caused by the decomposition of Ga2O3 into volatile sub-oxides. For the practical applications requiring a high doping concentration of Ga, accordingly, these composition changes need to be minimized by feeding the micron-sized oxides without agglomeration. Despite these composition changes, however, RF induction plasmas are promising in the production of the advanced nano-powders, such as GZO nano-powders since the composite oxides can be easily obtained simply by injecting the raw oxide mixture into the plasma as shown this work.
This paper was supported by research funds of Chonbuk National University in 2019. This work was also partly supported by the Korea Institute of Energy Technology Evaluation and Planning (KETEP) grant funded by the Korea government (MOTIE) (20191510301420). We, authors, give special thanks to the late Dr. Mi-Yeon Lee for her assistance in experimental data analysis and her devotion to the thermal plasma-material science.
- 1. A. Janotti, and C.G.V. Walle, Rep. Prog. Phys. 72[12] (2009) 126501.
-

- 2. T. Minami, and T. Miyata, Thin Solid Films 517[4] (2008) 1474-1477.
-
- 3. K.J. Chen, T.H. Fang, F.Y. Hung, L.W. Ji, S.J. Chang, S.J. Young, and Y.J. Hsiao, Appl. Surf. Sci. 254[18] (2008) 5791-5795.
-
- 4. H.M. Kim, K. Bae, and S.Y. Sohn, Jpn. J. Appl. Phys. 50[4R] (2011) 045801
-
- 5. S. Cimitan, S. Albonetti, L. Forni, F. Peri, and D. Lazzari, J. Colloid Interface Sci. 329[1] (2009) 73-80.
-
- 6. V. Assuncao, E. Fortunato, A. Marques, H. Aguas, I. Ferreira, M.E.V. Costa, and R. Martins, Thin Solid Films 427[1-2] (2003) 401-405.
-
- 7. E. Fortunato, A. Goncalves, A. Pimentel, P. Barquinha, G. Goncalves, L. Pereira, I. Ferreira, and R. Martins, Applied Physics A 96[1] (2009)197-205.
-
- 8. X. Zhang, X. Pu, Y. Chen, X. Gu, D. Xu, and S. Zhang, Mater. Lett. 112 (2013) 129-132.
-
- 9. S. Du, Y. Tian, J. Liu, H. Liu, and Y. Chen, Mater. Lett. 60[25-26] (2006) 3133-3136.
-
- 10. J.H. Seo, and B.G. Hong, Nucl. Eng. Technol. 44[1] (2012) 9-20.
-
- 11. M. Tanaka, T. Kageyama, H. Sone, S. Yoshida, D. Okamoto, and T. Watanabe, Nanomaterials 6[4] (2016) 60.
-
- 12. M.Y. Lee, J.S. Nam, and J.H. Seo, Chinese J. Catal. 37[5] (2016) 743-749.
-
- 13. J.H. Seo, J.S. Kim, M.Y. Lee, W.T. Ju, and I.T. Nam, Thin Solid Films 519[20] (2011) 7111-7115.
-
- 14. A.F. Arif, R. Balgis, T. Ogi, F. Iskandar, A. Kinoshita, K. Nakamura, and K. Okuyama, Sci. Rep. 7[1] (2017) 3646
-
- 15. J.S. Nam, M.Y. Lee, J.H. Seo, and G.H. Kim, J. Korean Phys. Soc. 72[7] (2018) 755-764.
-
- 16. M. Shigeta, N. Atsuchi, and T. Watanabe, J. Chem. Eng. Japan 39[12] (2006) 1255-1264.
-
- 17. P.J. Bhuyan, and K.S. Goswami, arXiv:1304.3173
- 18. P. Proulx, J. Mostaghimi and M.I. Boulos, Plasma Chem. Plasma Process. 7[1] (1987) 29-52.
-
- 19. J.S Nam, E. Park, and J.H Seo, Met. Mater. Int. 26[4] (2020) 491-500.
-
- 20. J. Mostaghimi and M.I. Boulos, Plasma Chem. Plasma Process. 9[1] (1989) 25-44.
-
- 21. S.H. Paik and E. Pfender, Plasma Chem. Plasma Process. 10[1] (1990) 167-188.
-
- 22. S.V. Patankar in “Numerical Heat Transfer and Fluid Flow”(Hemisphere, 1980).
- 23. A.A. Samarskii, in “Introduction to the Theory of Difference schemes” (Nauka, 1971) p. 275.
- 24. J.W. McKelliget, and N. El-Kaddah, in Proceedings of the International Symposium Metallurgical Processes for the Year 2000 and Beyond, February 1989, edited by H.Y. Sohn and E.S. Geskin (T.M.S, 1989) p.169.
- 25. P. Walker and W.H. Tarn, in “CRC handbook of metal etchants” (CRC Press, 1990).
-
- 26. M. Binnewies and E. Milke, in “Thermochemical data of elements and compounds 2ndEd.” (Wiley-VCH, 2002).
-
- 27. Z. Galazka, R. Uecker, K. Irmscher, M. Albrecht, D. Klimm, M. Pietsch, M. Brützam, R. Bertram, S. Ganschow, and R. Fornari, Cryst. Res. Technol. 45[12] (2010) 1229-1236.
-
- 28. S.I. Stepanov, V.I. Nikolaev, V.E. Bougrov, and A.E. Romanov, Rev. Adv. Mater. Sci. 44 (2016) 63-86.
 This Article
-
2021; 22(2): 169-178
Published on Apr 30, 2021
- 10.36410/jcpr.2021.22.2.169
- Received on Jul 28, 2020
- Revised on Nov 1, 2020
- Accepted on Nov 11, 2020
Services
- Abstract
introduction
experimental details and numerical modelling
results and discussion
conclusion
- Acknowledgements
- References
- Full Text PDF
Shared
Correspondence to
- Jun-Ho Seo a and Shi-Young Yang b
-
aDepartment of Quantum System Engineering, Chonbuk National University, Jeonju 54896, Republic of Korea
bGraduate School of Flexible & Printable Electronics, Chonbuk National University, Jeonju 54896, Republic of Korea
Tel: +82-63-270-4295 (Jun-Ho Seo)
Tel: +82-63-270-2022 (Shi-Young Yang) - E-mail: jhseo@jbnu.ac.kr (Jun-Ho Seo), yangsy@jbnu.ac.kr (
Clean-Energy Research Institute(CRI), Hanyang University, 222, Wangsimni-ro, Seongdong-gu, Seoul, 04763, Korea
E-mail: jcpr@hanyang.ac.kr