


- Control of the microstructure of lightweight geopolymer by pressure control
Minjeong Kim and Yootaek Kim*
Department of Materials Engineering, Kyonggi University, Suwon 16227, Republic of Korea
This article is an open access article distributed under the terms of the Creative Commons Attribution Non-Commercial License (http://creativecommons.org/licenses/by-nc/4.0) which permits unrestricted non-commercial use, distribution, and reproduction in any medium, provided the original work is properly cited.
Integrated gasification combined cycle (IGCC) slags and Si sludges were used as the raw material and bloating material for obtaining lightweight geopolymers, respectively. When Si sludge was used for the bloating reaction to obtain ultra-lightweight geopolymers, the specimens have large pores an inhomogeneous pore distribution, resulting in adverse effects on the mechanical properties of lightweight geopolymers. Three curing temperatures and two different curing methods were investigated for the control of the microstructure and pore distribution of lightweight geopolymers. Compressive strengths, pH changes, FT-IR spectra, microstructure observations, and ICP results before and after immersion were compared for the specimens obtained with different curing temperatures and methods. The highest compressive strength after immersion was obtained for the specimen cured at 123 oC in an autoclave because the degree of geopolymerization of this specimen was higher than for any other specimens as found from the analysis of the pH changes, FT-IR spectra, microstructure observation, and ICP results. In conclusion, curing at high temperature (123 oC) with an autoclave is the optimal curing for maintaining stable mechanical properties in a wet service environment
Keywords: Geopolymer, IGCC slag, Si sludge, Curing temperature and method
Environmental problems are some of the most important issues for mankind in the 21st century. Following the conference on environment and development held at Brazil in 1992, the framework convention on climate change for the prevention of global warming was adopted in Kyoto in 1997 that specified that advanced countries should reduce the production of carbon dioxide by 5.2% comparing to that of 90s. The purpose of “sustainable development” which is the term used in the report of the United Nations committee on the world environment and development for the economic and social development that is also consistent with environment protection, is to pursue the development that not only does not generate problems for future generations but also satisfies the current demands [1].
Although Portland cement is the most widely used construction material for making concrete and the concrete binder materials at present, it is important to develop environmental friendly materials instead of conventional Portland cement for the sustainable develop- ment in construction industry in the future [2, 3].Production of cement has been pointed out to be a major contributor to global warming because of the high consumption of energy and natural resources during the production process, and in particularly because of the large amounts of carbon dioxide produced in cement manufacturing [4]. There is a need of the ongoing development of cement and concrete industry through the application of environmentally friendly technique for the substantial reduction of carbon dioxide production in these industries and by studying the possible substitution of ordinary cement by more environmentally friendly materials [5, 6]. Geopolymer was invented by Davidovits in 1978 and unlike for cement, alkaline activated concrete was obtained by the condensation reaction between alumino-silicate minerals and an alkaline activator without the use of a sintering process. Therefore, geopolymer is an environmentally friendly material due to the much lower production of carbon dioxide during its manufacturing process compared to cement [7-9]. However, the control of factors determining property degradation of geopolymer has not been completely studied so far; therefore, additional studies on the control of geopolymer properties and reproducibility are necessary prior to its wide commercial use. Therefore, the main purpose of this work is to improve the compressive strength after immersion of geopolymers by controlling pressure in curing process using autoclave.
One of the reasons for the degradation of the geopolymer properties is an efflorescent phenomenon that usually appears in cement concrete when pore water containing dissolved calcium or magnesium ions migrates from the inner region of the material to its surface after the solidification reaction [10, 11]. The efflorescent phenomenon is also observed on the surface of geopolymers even though ideally, it should not observed if all of the alkaline metal ions and silicon ions are consumed in the geopolymer reaction and are fixed in the atomic structure of the geopolymer in a stable form [12]. In fact, residual ions migrated from the bulk to the surface of the geopolymer and then reacted with carbon dioxide in air prior to generating sodium carbonates on the surface because the alkaline metal ions are not totally consumed in the geopolymer reaction [13]. The efflorescent phenomenon on the surface of geopolymers is highly likely to lead to the degradation of the geopolymer properties. Therefore, it is necessary to study different approaches for preventing or suppressing the efflorescent phenomenon on the geopolymer surfaces by controlling the geopolymerization reaction (specifically, by increasing the degree of completion of the geopolymerization reaction) because the stability of geopolymer in water is closely related to the efflorescent phenomenon.
Materials
Integrated gasification combined cycle (IGCC) slags produced from the Seobu power plant in Taean province were used as a raw material for geopolymers and Si sludges produced during the polishing process used in the semiconductor wafer industry were used as the bloating material. The chemical compositions of the IGCC slag and Si sludge are described in Table 1. As observed from the data presented in Table 1, IGCC slag not only contains an abundance of (Si) and aluminum (Al) components but also a proper Al/Si ratio that is essential for obtaining geopolymers. Moreover, IGCC slags were found to be amorphous by X-ray diffraction (XRD) analysis, making them suitable for providing sufficient Si+4 and Al+3 ions by alkaline activator during the geopolymerization reaction [14].
Si sludge was produced as a by-product during the cutting and polishing process of Si single crystal or polycrystalline ingots. Therefore, it mostly consists of pure silicon (with some of the silicon found in the oxide form) and some trace materials as shown in Table 1. Si sludge can be used as a bloating material because it reacts with an alkaline activator as suggested in the previous study [15]. Because the hydrogen gas produced during the bloating process creates pores in the geopolymer, the control of the hydrogen gas by adjusting the Si amount, alkaline activator concentration, geopolymer paste plasticity, and mixing method is crucial for controlling the pore size and distribution, and eventually the properties of the geopolymer.
Experimental procedures
Geopolymerization reaction can be explained as follows: alumino-silicates were activated with an alkaline solution to develop a material with a structure similar to that of zeolite. This material uses the inorganic material ‘alumino-silicate’ for polymerization, and has a three-dimensional structure similar to that of a polymer. For this reason, it is called a geopolymer. Alkali-activated materials react with alumino-silicates and alkaline solutions, and hence are referred to as set and hardened materials [16]. Geopolymer consists of an alumino-silicate gel network including SiO4 connected to tetrahedral AlO4, and has cations such as Na+ in the framework cavities to strike a charge balance. Therefore, the quantities of SiO2 and Al2O as well as the concentration of alkali activator significantly affect geopolymer properties [17-19].
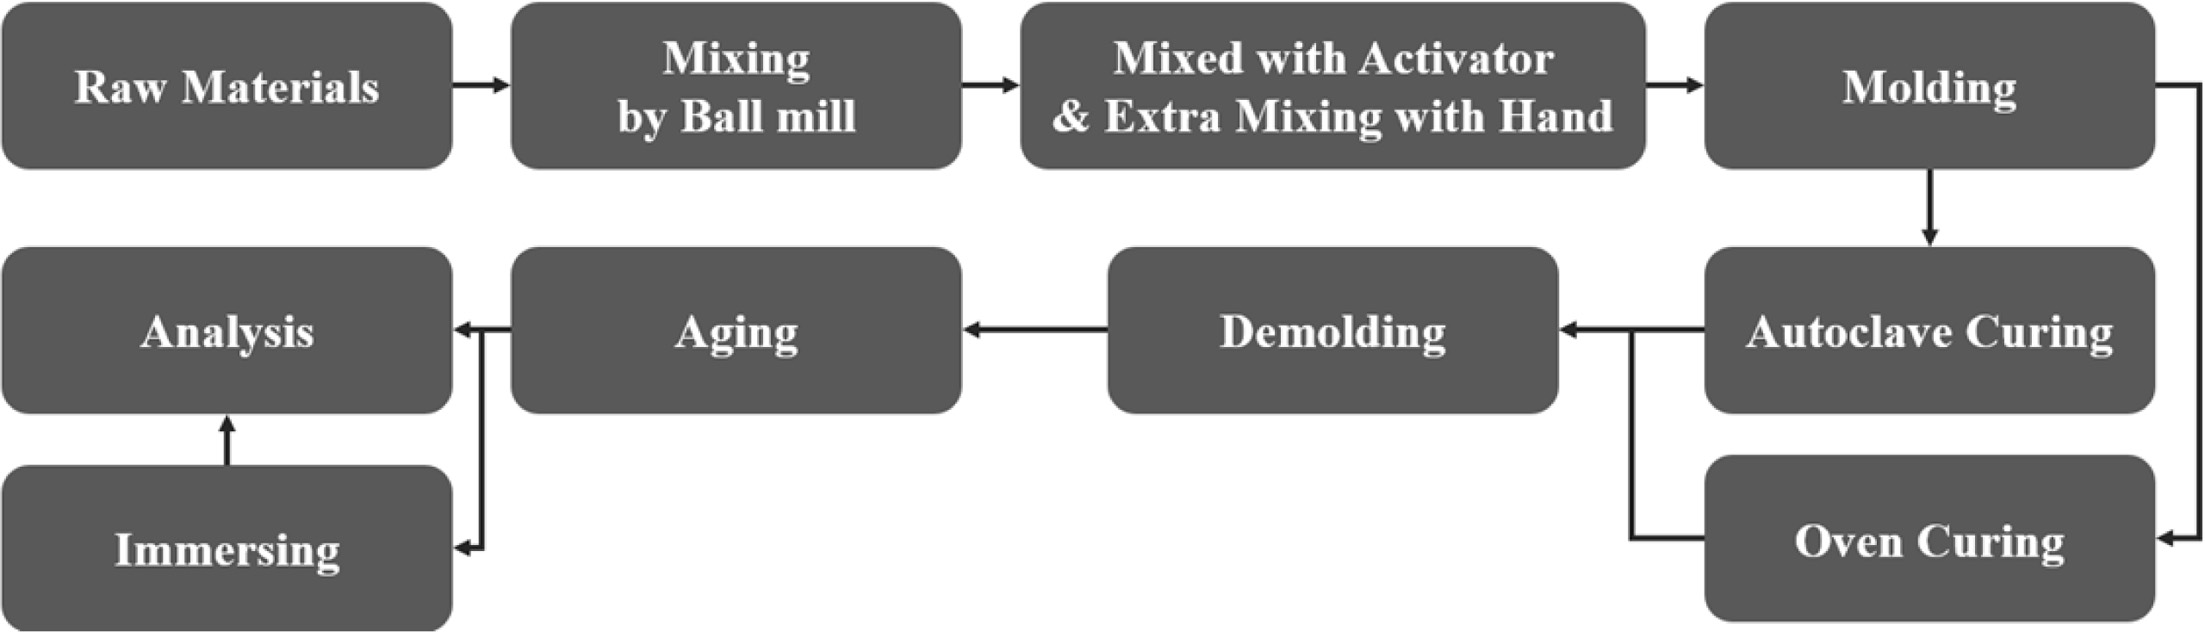
Fig. 1 illustrates the procedure used for the preparation of the specimens. IGCC slags were sieved by a 106-µm sieve and then the IGCC slags that passed through the sieve were milled by an alumina ball mill at 117 rpm for 8 h [20, 21]. Bulk Si sludge samples were also sieved by a 106-µm sieve but were not milled because they are already finely milled during the polishing and cutting process of Si ingots. Therefore, they were used directly for the bloating process without a further milling process after the sieving.
The mixed alkaline activator was used for the geopolymerization and bloating reactions by mixing NaOH pellets (97.0% NaOH; Daejung Co., Korea) and sodium silicates (Na2SiO3 · nH2O; Daejung Co., Korea), known as water glass with a ratio of 1:1. The concen- tration of NaOH was 15 M and the water solid ratio (W/S) was controlled by 0.2. The processed IGCC slags and Si sludge samples were mixed using a ball mill in a dry state for 1 h and then the mixed materials were mixed again with an alkaline activator by hand for more than 5 min prior to molding. The mixed pastes of the geopolymer were molded with a stainless steel mold (5 x 5 x 5 cm3) and then the whole mold was sealed by a polyethylene bag that can be used at the temperature above 150 oC during the curing process for preventing the early evaporation of water during the curing process.
The molded and sealed specimens were cured using either an autoclave (1.18-2.3 atm, 103-123 oC for 24 h) or a dry oven (83-103 oC for 24 h) and then were demolded. After the curing process, the specimens were aged at room temperature (15-25 oC) for 72 h and then the differences between the specimens cured using the two different curing processes were evaluated and their properties were compared.
Some of the specimens were immersed in distilled water long-term and then the stability of the specimens in water was estimated. The specimen stability was estimated by measuring the pH after the specimen immersion and by the observations of the microstruc- tural differences on the surface and in the bulk after the immersion. A previous study reported that the stability of the specimens is closely related to the degree of geopolymerization [22].
Finally, after the curing process, all of the specimens were aged at room temperature (15-25 oC) for 72 h prior to their immersion and property analyses.
|
Fig. 1 Schematic diagram of the procedure for making lightweight geopolymer specimens by using two curing processes, namely autoclave curing and oven dry curing |
|
Table 1 Chemical composition of the IGCC slag and Si sludge as evaluated by XRF (wt.%) |

Curing method and temperature
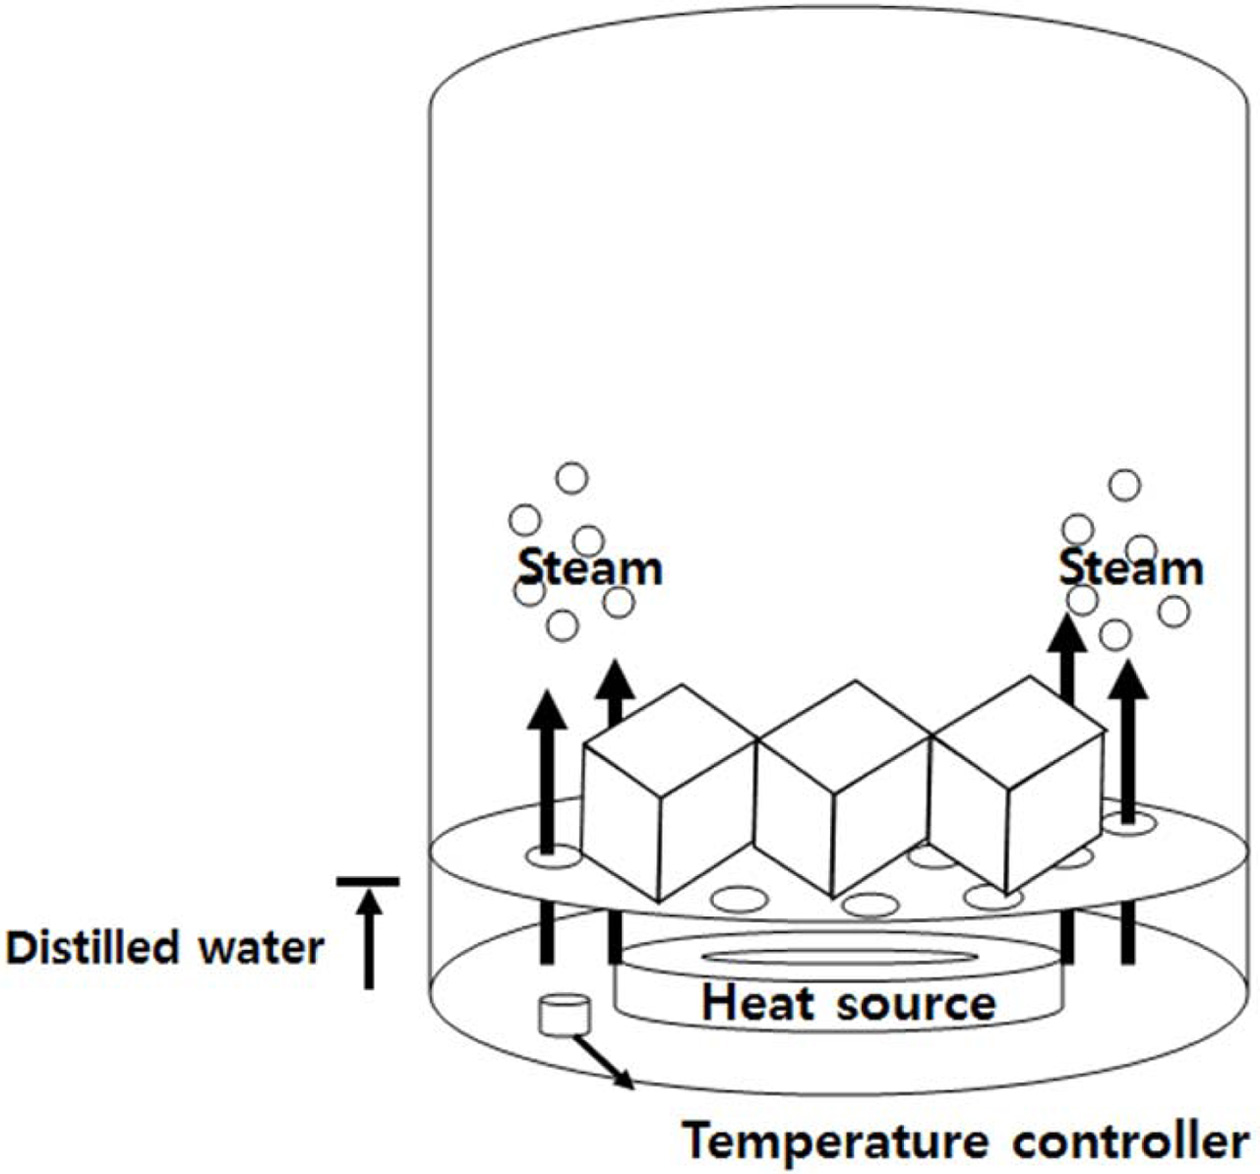
The specimens with the addition of 2.0 wt.% Si sludge were cured in a dry oven and an autoclave after the hand mixing of the geopolymer slurry for more than 5 min to maintain a homogeneous pore size and distribution. An autoclave that can control the chamber pressure through the heating of the water in the bottom of chamber as shown in Fig. 2 was used for the curing process because of the ability to control the water vapor pressure by the adjustment of the heating temperature.
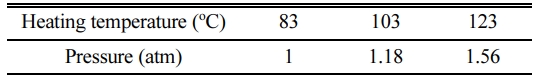
Table 2 shows the relationship between the curing temperature and pressure of the autoclave. We assumed that a smaller pore size and more homogeneous distribution will be obtained by increasing the pressure of the autoclave chamber because it is expected that the bloating will be more restricted with an increase in the chamber pressure.
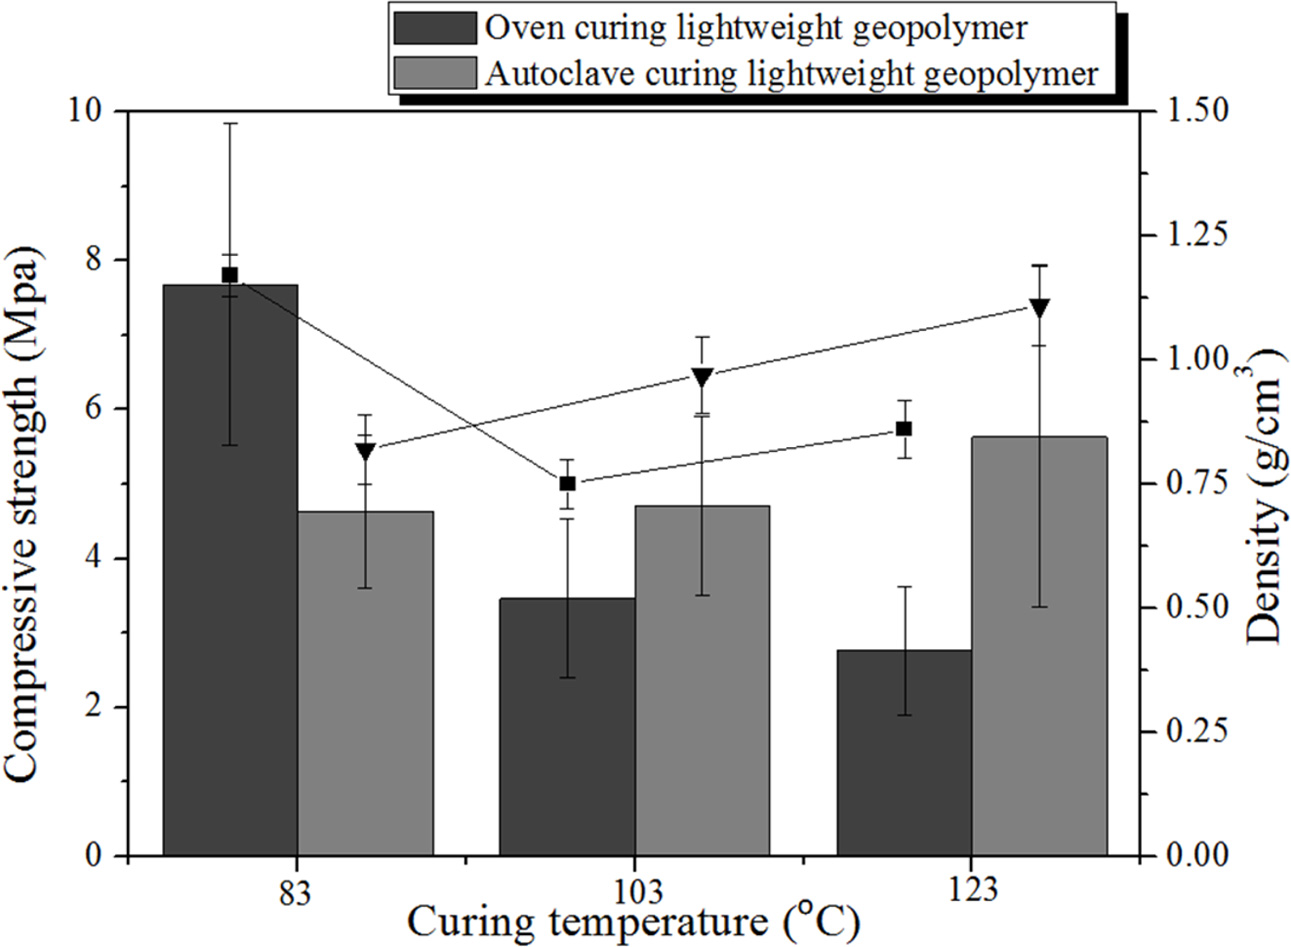
As shown in Fig. 3, the compressive strength of the specimen cured in the dry oven at 83 oC was not only higher than that of the autoclave-cured specimen but also shows the highest value (7.68 MPa) among all of the specimens regardless of their curing method and temperature. The compressive strength of the dry oven cured specimens decreased with increasing curing temperature which is different from the usual relationship between the compressive strength and curing temperature. This unusual trend is observed because the moisture contents of the geopolymer specimens in the sealed polyethelene bag rapidly vaporized and were either depleted or completely consumed by the geopolymeriz- ation reaction carried out at the temperatures higher than the water boiling temperature (103 and 123 oC) prior to the completion of the geopolymerization. Therefore, it appears that curing at a temperature above the water boiling point in a dry oven is not conducive to the enhancement of compressive strength. However, as shown in Fig. 3, the optimal curing conditions (method and temperature) that obtain the highest compressive strength are oven dry curing at 83 oC.
By contrast, the compressive strength of the autoclave-cured specimens increased with increasing curing temperautre. The compressive strength of the specimens autoclave-cured at 103 and 123 oC is even higher than those of the specimens cured in a dry oven at the same curing temperatures. It was speculated that the opposite trend of the change in the compressive strength between 83 and 103 oC was caused by the increase in the pressure in the autoclave chamber that suppressed the bloating, resulting in smaller pore size and a more homogenous pore distribution. Due to these changes in the pore size, shape, and distribution, the compressive strength of the specimens cured with an autoclave at the temperatures above 103 oC was increased with an increase in the curing temperature. The compressive strength (2.76 MPa) of the geopolymers cured with an autoclave at 123 oC was twice as high as that (5.63 MPa) of the speciment cured with a dry oven at the same temperature even though the specimen density increased by only 0.25 g/cm3 from 0.86 to 1.11 g/cm3. Moreover, another reason for the enhancement in the compressive strength of the autoclave-cured (AC) specimen relative to the oven-dried (OD) specimens is that in the autoclave chamber, sufficient moisture was continuously provided for the geopolymerization reaction even at the tempera- tures higher than the water boiling temperature, and the geopolymerization reaction occurred more rapidly in the unreacted part of the specimen with an increase in the temperature.
It was previously reported that curing at very high temperatures was not beneficial neither for increasing the compressive strength of the geopolymers nor for decreasing their density when the geopolymers are cured in a drying oven [23]. Therefore, it was concluded that the maximum compressive strength (7.68 MPa) can be obtained with a dry oven curing at 83 oC as shown in Fig. 3 which is as similar to the previously reported results.
The origin of the maximum compressive strength obtained for the OD specimens cured at 83 oC despite the lack of completion of the geopolymerization reaction for these specimen, is suggested to be as follows. The OD specimens cured at 83 oC satisfied the optimum conditions for the geopolymerization reaction because they were sealed in a polyethylene bag at a temperature under the water boiling point in order to prevent water evaporation during the curing process, and unlike for the AC specimens, there was no pressure on the outside surface of the specimen. Therefore, the gases produced during the bloating reaction were discharged into the environment of the specimen, resulting in the smaller total porosity of the OD specimens compared to the AC specimens.
By contrast, the total porosity values of the AC specimens were larger than those of the OD specimens even though the geopolymerization reaction was carried out to completion for the OD specimens because the gases produced during the bloating reaction could hardly be discharged to the environment due to the high pressure in the autoclave. Therefore, AC specimens had lower compressive strengths than the OD specimens cured at 83 oC.
In fact, even though the pore size and distribution can be controlled by curing in an autoclave, such curing is unfavorable for the enhancement in the compressive strength of the geopolymer. However, curing in an autoclave still appears to be useful not only for the control of the geopolymer microstructure but also to ensure that the geopolymerization reaction is carried out to completion by supplying additional moisture. Furthermore, autoclave curing is beneficial for the control of other physical properties such as enhancement of the water resistance during the practical service of the geopolymer.
The density variations shown in Fig. 3 are in the range between 0.82 and 1.17 g/cm3, and these changes are small compared to the changes in the compressive strength due to the use of different curing methods and temperatures in the density. Although changes in the microstructure and porosity of the geopolymers were expected for the specimen cured with an autoclave compared to those of the OD geopolymers, it is not easy to explain these small changes in the density based on the curing temperature and method. Nevertheless, it is well-known that density tends to decrease with decreasing compressive strength.
It is well-known that the density is closely related to the total porosity of the specimen and that the pore size and distribution are closely related to the compressive strength of the specimen. As mentioned above, the density of the specimen must be high when the total porosity of the specimen is small, as is in fact observed for the OD specimens cured at 83 oC. The density decreased with increasing curing temperature, particularly when for the temperatures higher than the water boiling point. In contrast, the density of the AC specimens increased with increasing curing temperature in the autoclave, which was closely related to the total porosity of the specimen.
FTIR
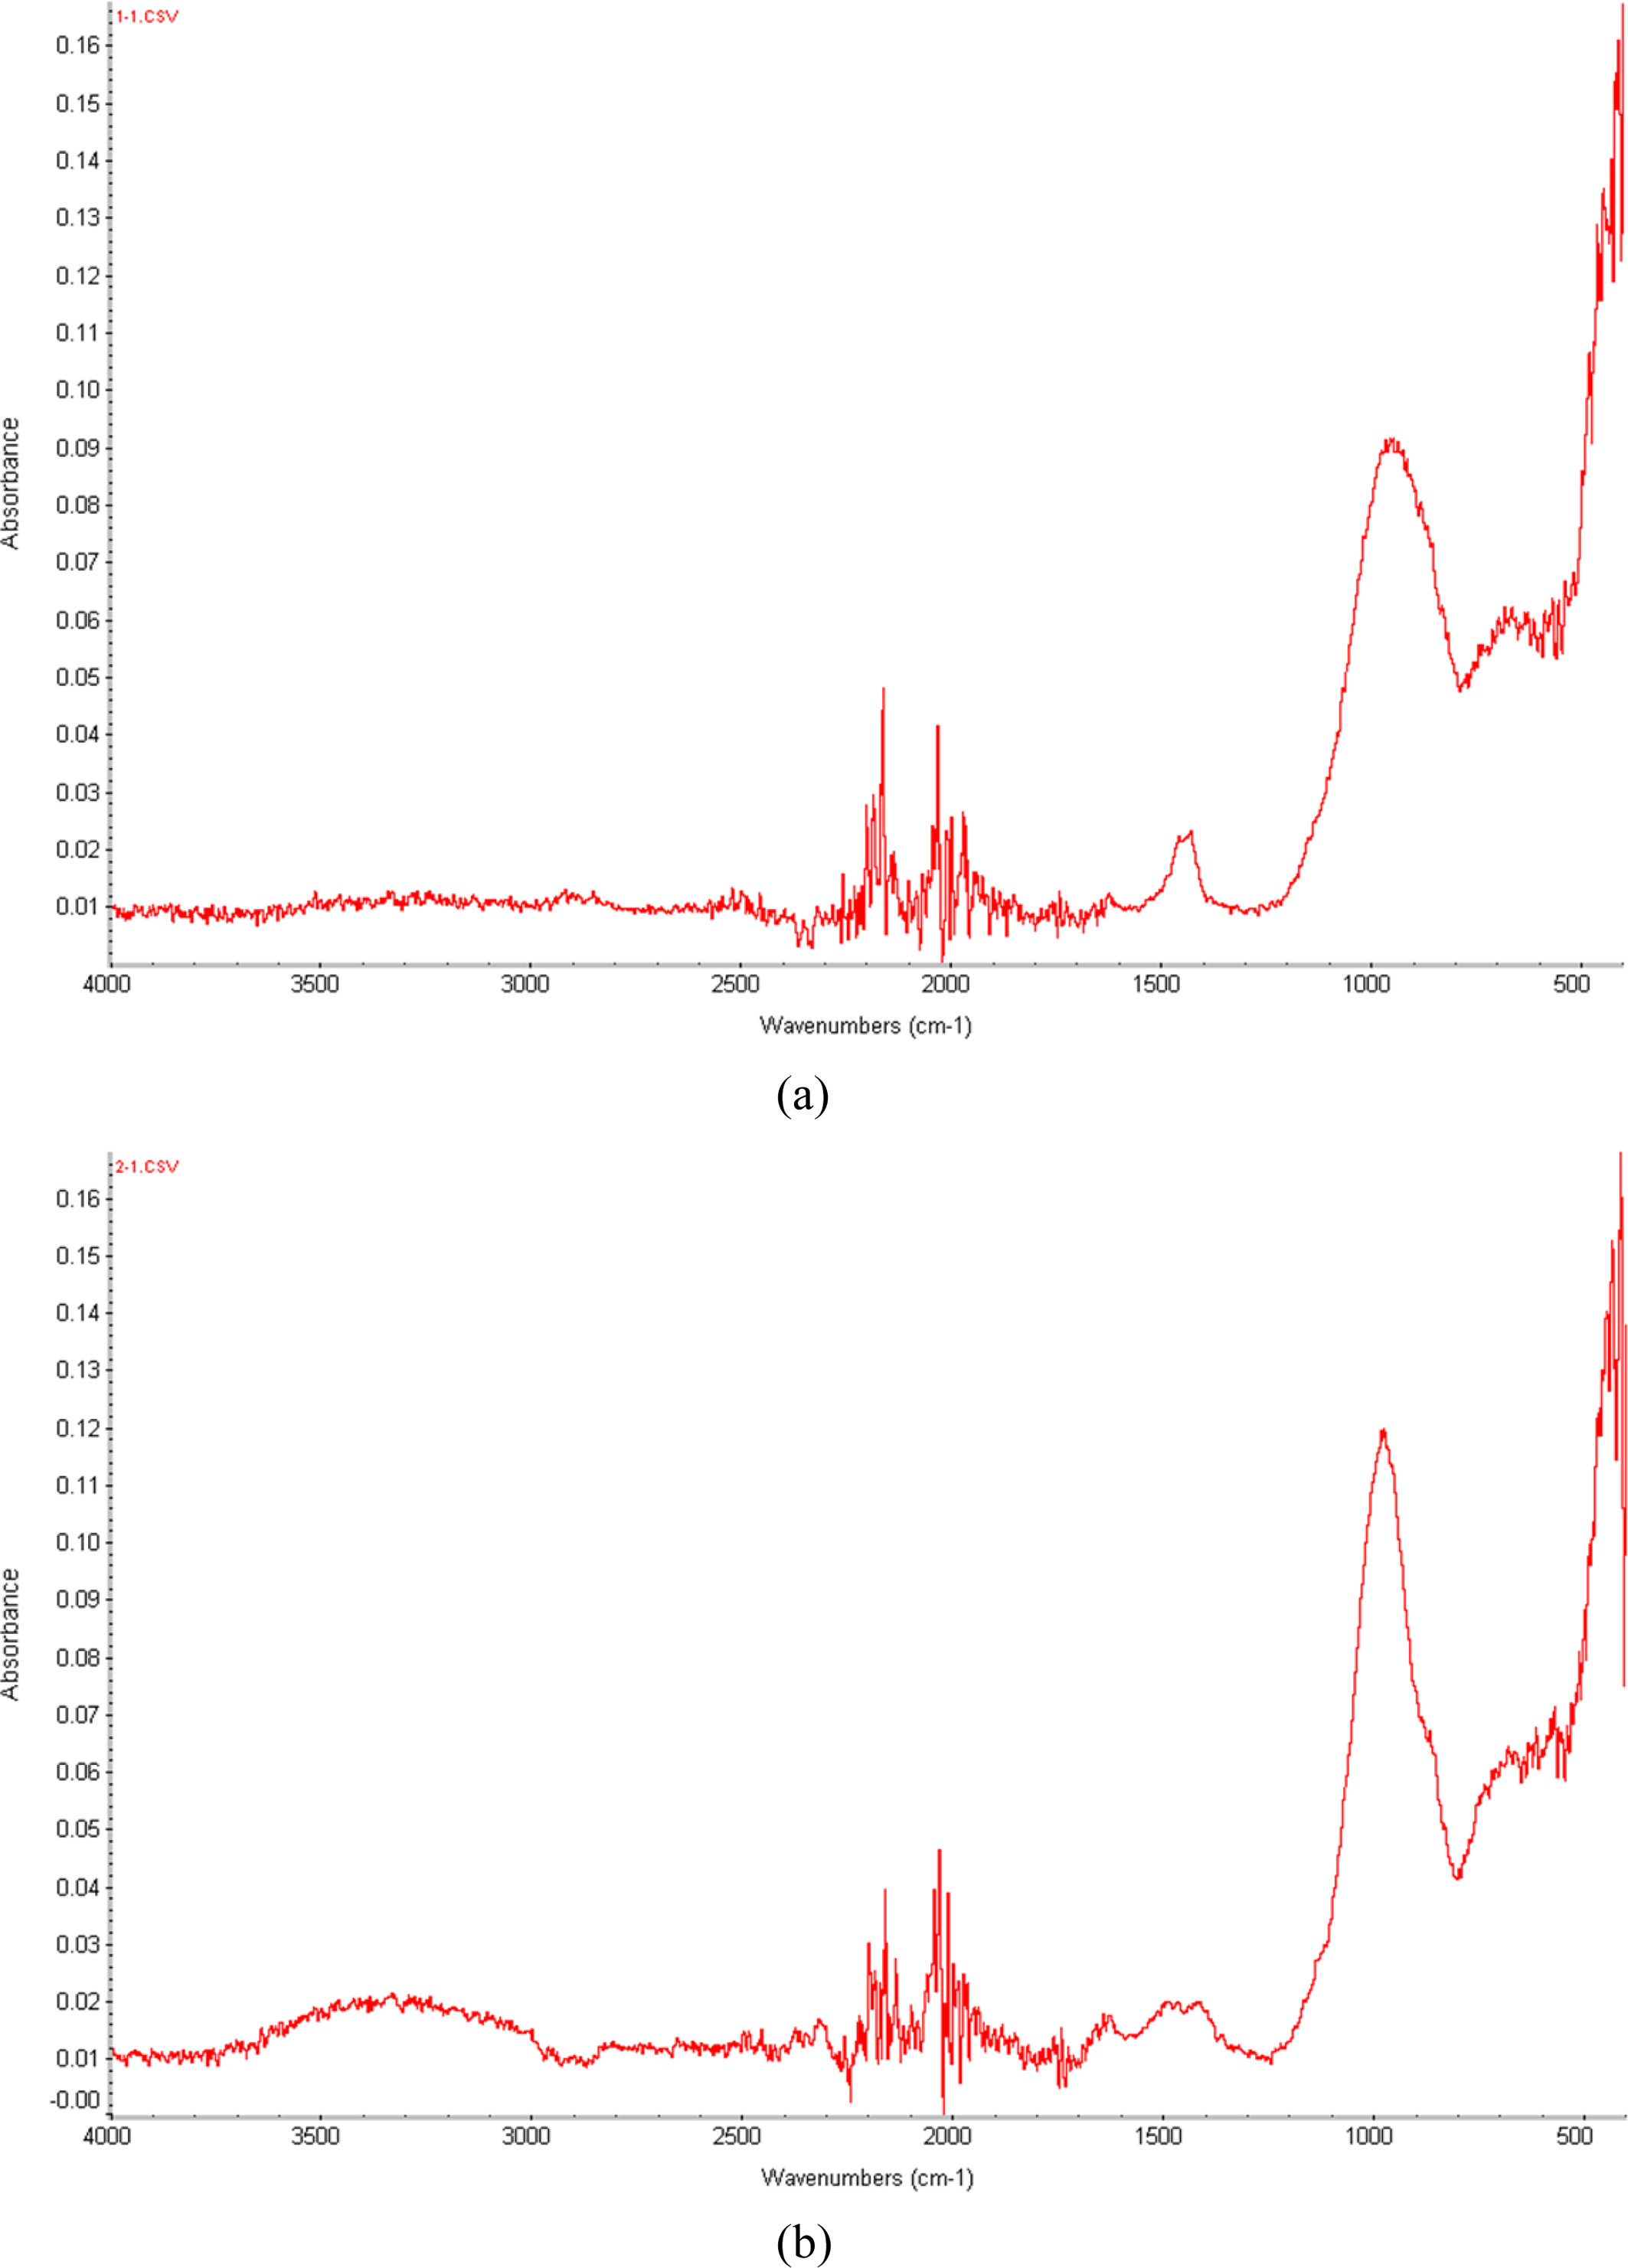
Fig. 4 shows the FT-IR spectra obtained for the specimens cured at 123 oC using a dry oven and the specimens cured at 123 oC using an autoclave. The higher peaks of the AC123 specimen (autoclave cured at 123 oC) compared to those of the DO123 specimen (dry oven cured at 123 oC) at 3700~2200 cm-1 indicate the greater moisture content in the AC123 specimen due to the sufficient water vapor supplied to the specimen during the autoclave curing. This suggests that the additional moisture supply for AC123 enhances the bloating reaction and produces more pores than compared to DO123.
The intensities of the AC123 peaks at 1200~950 cm-1 are stronger than those of DO123, due to the increasing number of main bonds (Si-O-Si and Al-O-Al) of the geopolymer arising from the enhanced geopolymerization reaction enabled by the additional moisture supply provided by autoclave curing.
Table 3 shows the XRF result of the specimens cured in the dry oven (DO123) and in the autoclave (AC123) at 123 oC. As shown in Table 3, the contents of both SiO2 and Al2O3 were increased in AC123 specimen as expected from the FT-IR results mentioned above. Because more moisture is provided during the autoclave curing, the extent of polymerization is greater and more O-Si-O and O-Al-O bonds were formed in the AC123 specimen during the aging process.
It is important for the specimen to not be completely solidified during the aging process. When the specimen was completely solidified by geopolymerization, the additional moisture may adversely affect the strength of the geopolymer specimen. Therefore, autoclave curing is not suitable for the already solidified specimens. When more than 5.0 wt.% Si sludge was added, the specimen became solidified rapidly and completely prior to the curing process, and it is expected that the compressive strength of the geopolymer specimens will be degraded rather than enhanced by the autoclave curing process. Additional studies of the specimen with greater than 5.0 wt.% Si sludge are required to identify the curing and aging conditions for the control of the water contents during curing and aging.
Microstructure
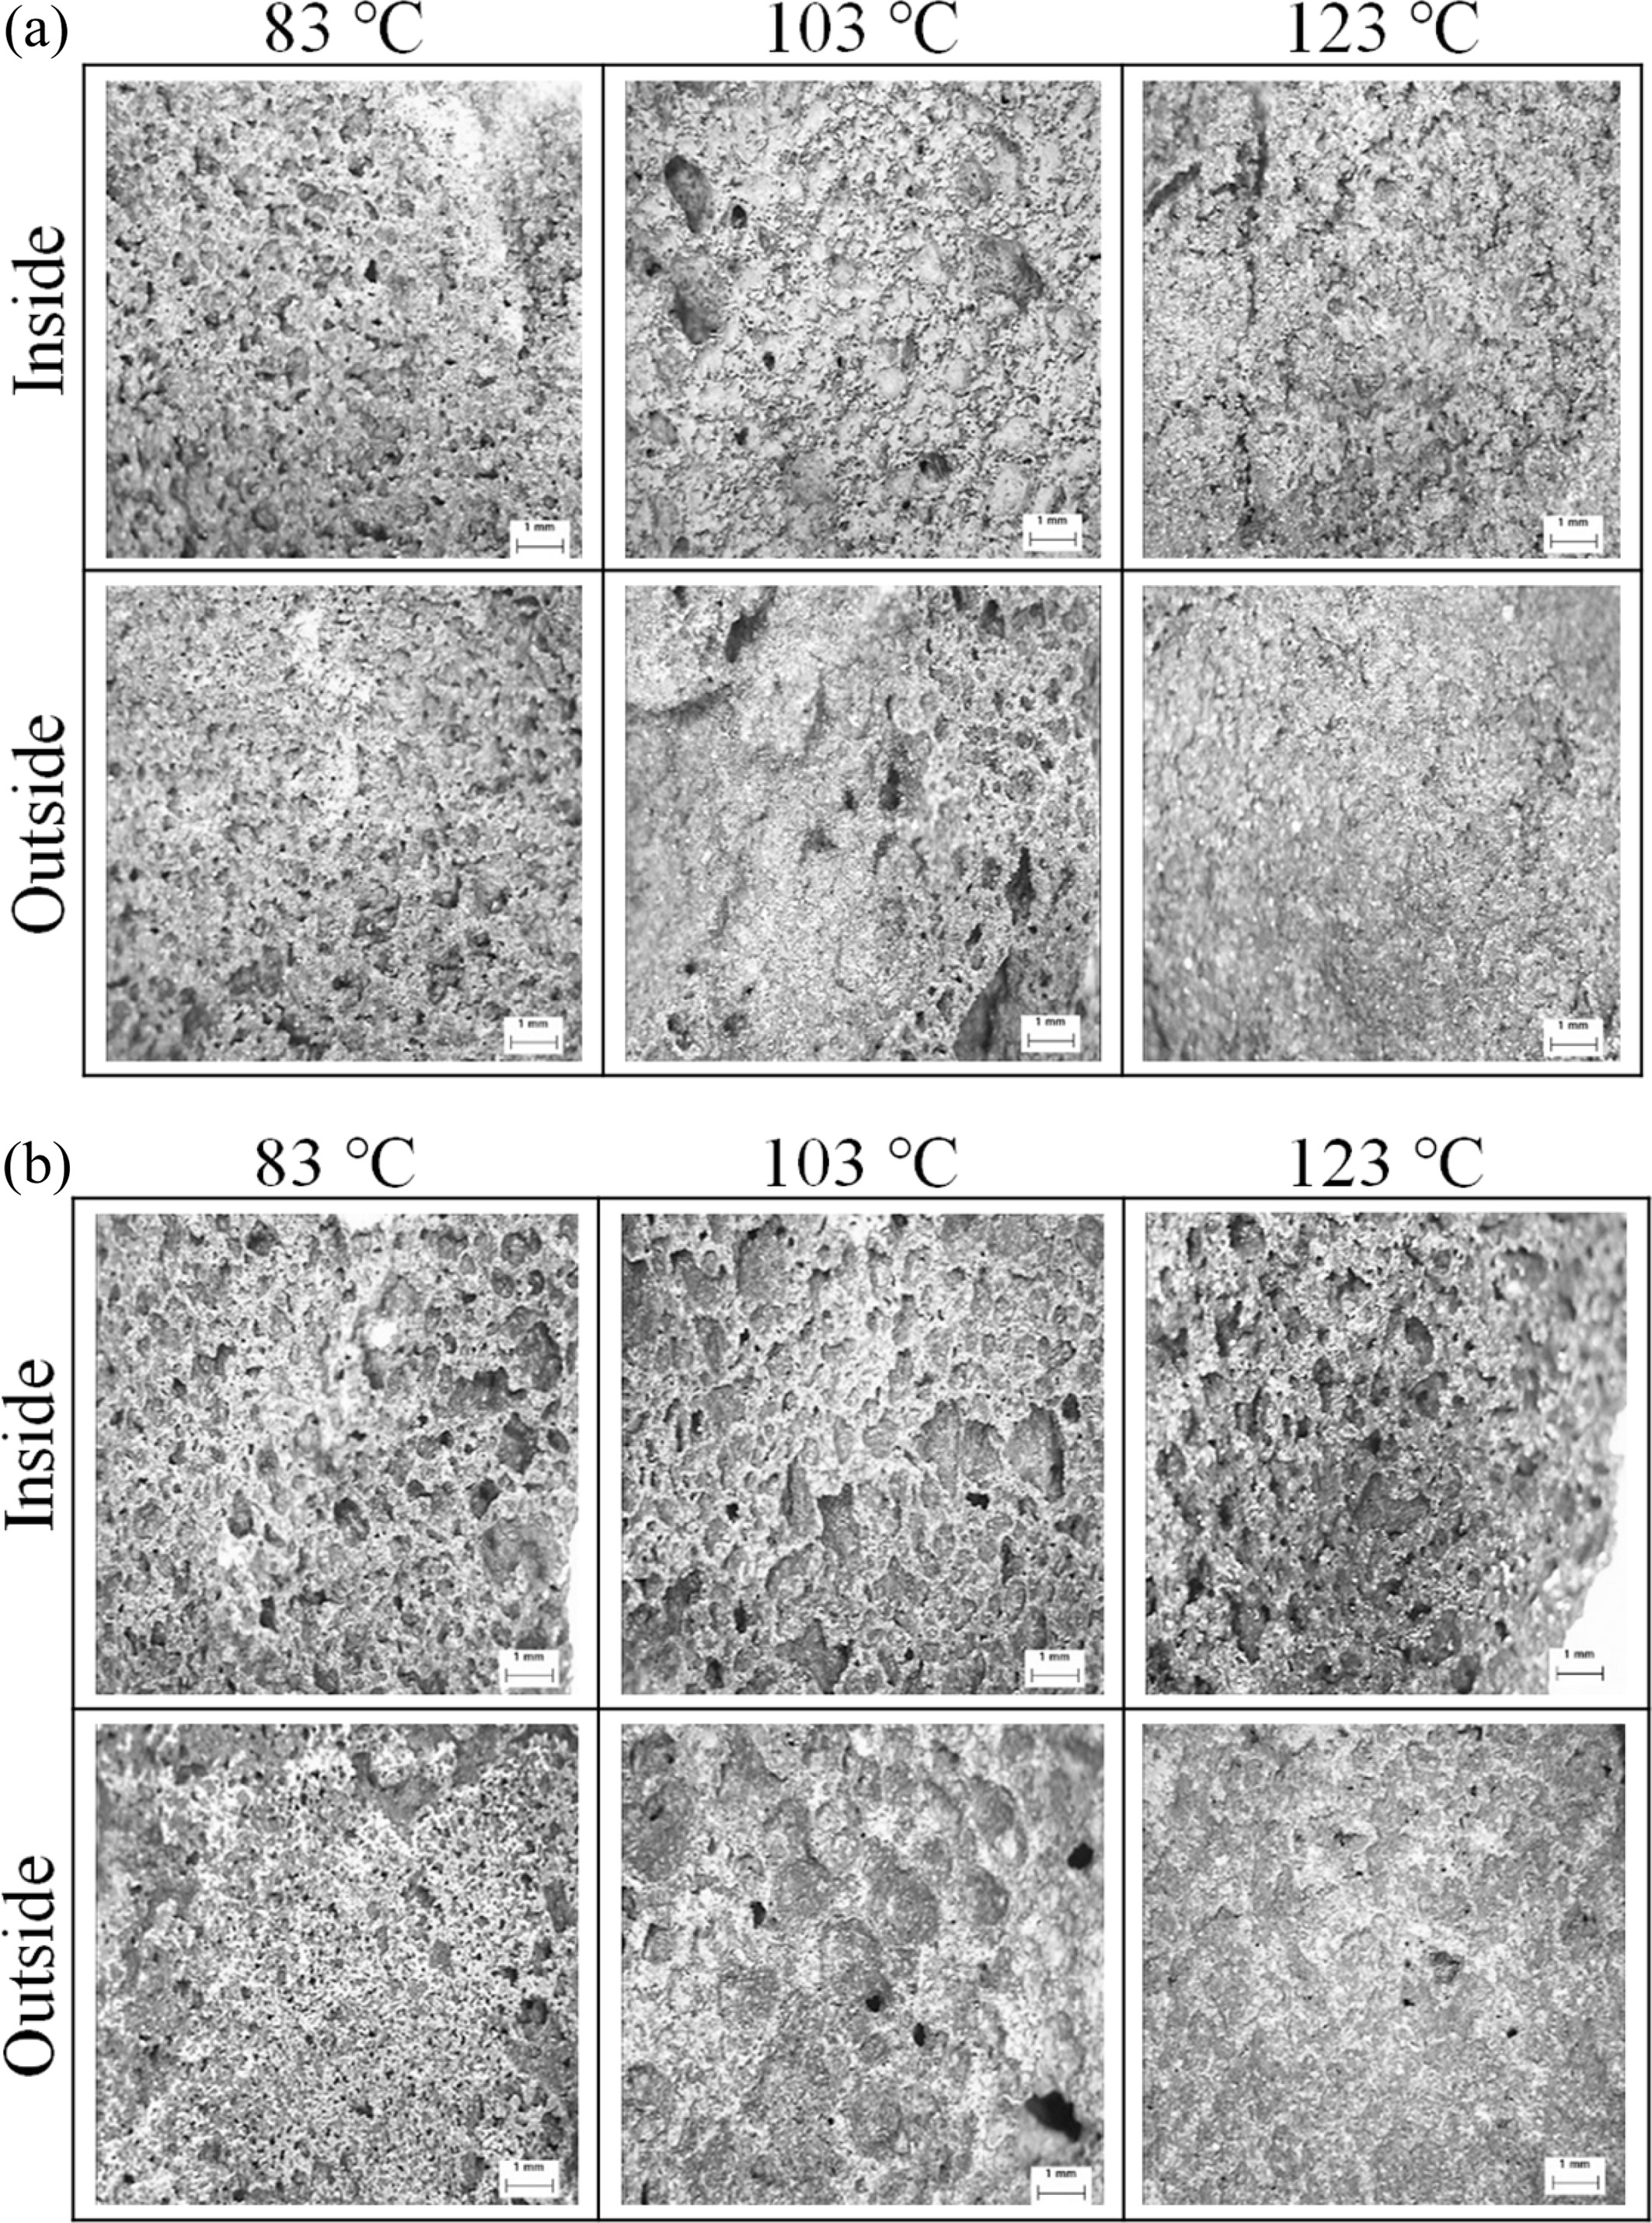
Optical microscopic observation of the outer surfaces and of the inner fracture surfaces of the specimens obtained with and without an autoclave curing were performed in order to understand the effects of the pressure and additional moisture caused by the water vapor in the autoclave chamber during the curing on the bloating reaction.
As shown in Fig. 5, there was little difference in the pore size and distribution between the fracture and outer surfaces of the OD specimens regardless of the curing temperature. Hence, larger pores and cracks were observed on both types of surfaces for the specimens cured in a dry oven at over 103 oC. The formation of such large pores and cracks may give rise to a decrease in the compressive strength with an increase in the curing temperature for the specimens cured in a dry oven. As mentioned above, the formation of large pores and cracks may be caused by the vaporization and rapid depletion of water during the dry oven curing at the temperature higher than the water boiling point and may cause the incomplete geopolymerization reaction that in turns gives rise to is a decrease in the compressive strength.
In contrast, the pores on the outer surface were smaller than those of the inner fracture AC surfaces. The difference in the pore size between the inner and outer surfaces of the AC specimen was due to the pressure in the autoclave chamber during the curing process. The pressure limited the growth of the pores near the outer surfaces and led to their greater homogeneity compared to the pores in the bulk of the AC specimen.
Hence, the pores inside the specimen were less influenced by the outside pressure in the autoclave and therefore merged more easily and became larger than the pores in the vicinity of the surfaces of the AC specimen. Another origin of the larger size of the pores inside the AC specimen is that the high flow rate of the geopolymer paste after mixing may also prevent the movement of the exhaust gases produced during bloating from the bulk to the surface region reaction.
It was expected that both bloating and the geopoly- merization reaction may occur to greater extent in the outer regions in the vicinity of the AC specimen surfaces because more water that is essential for both bloating and the geopolymerization reaction was continuously supplied from the autoclave chamber during the curing process. Therefore, more homogeneous and smaller pores influenced by the pressure and water effects were observe on the outer AC specimen surfaces and the stronger compressive strength of the outer region of the AC specimen was expected to be obtained due to the greater extent of the geopolymerization reaction. This was considered to be one of the main reasons for the enhancement of the compressive strength of the AC specimen with increased curing temperature.
Although the highest compressive strength was obtained for the OD specimen cured at 83℃, specimen curing in an autoclave is still necessary because a high curing temperature and a continuous water supply are required for the greater extent of both the geopoly- merization and bloating reactions that result in more homogeneous pore size and distribution. A high curing temperature and a continuous water supply also reduce the proportion of the unreacted region of the geopolymer specimens after the curing process, enhancing the long-term compressive strength and water and chemical resistance in practical use.
It is also speculated that curing in an autoclave will be suitable and necessary for the production of ultra-lightweight specimens obtained by producing a high number of pores during the bloating reaction. This is because a continuous geopolymerization reaction must be carried out to obtain the ultra-lightweight specimens with low density that maintain their structure until the completion of the geopolymerization reaction in order to obtain improved compressive strength.
Effect of the additional moisture supply
Compressive strength and density after immersion
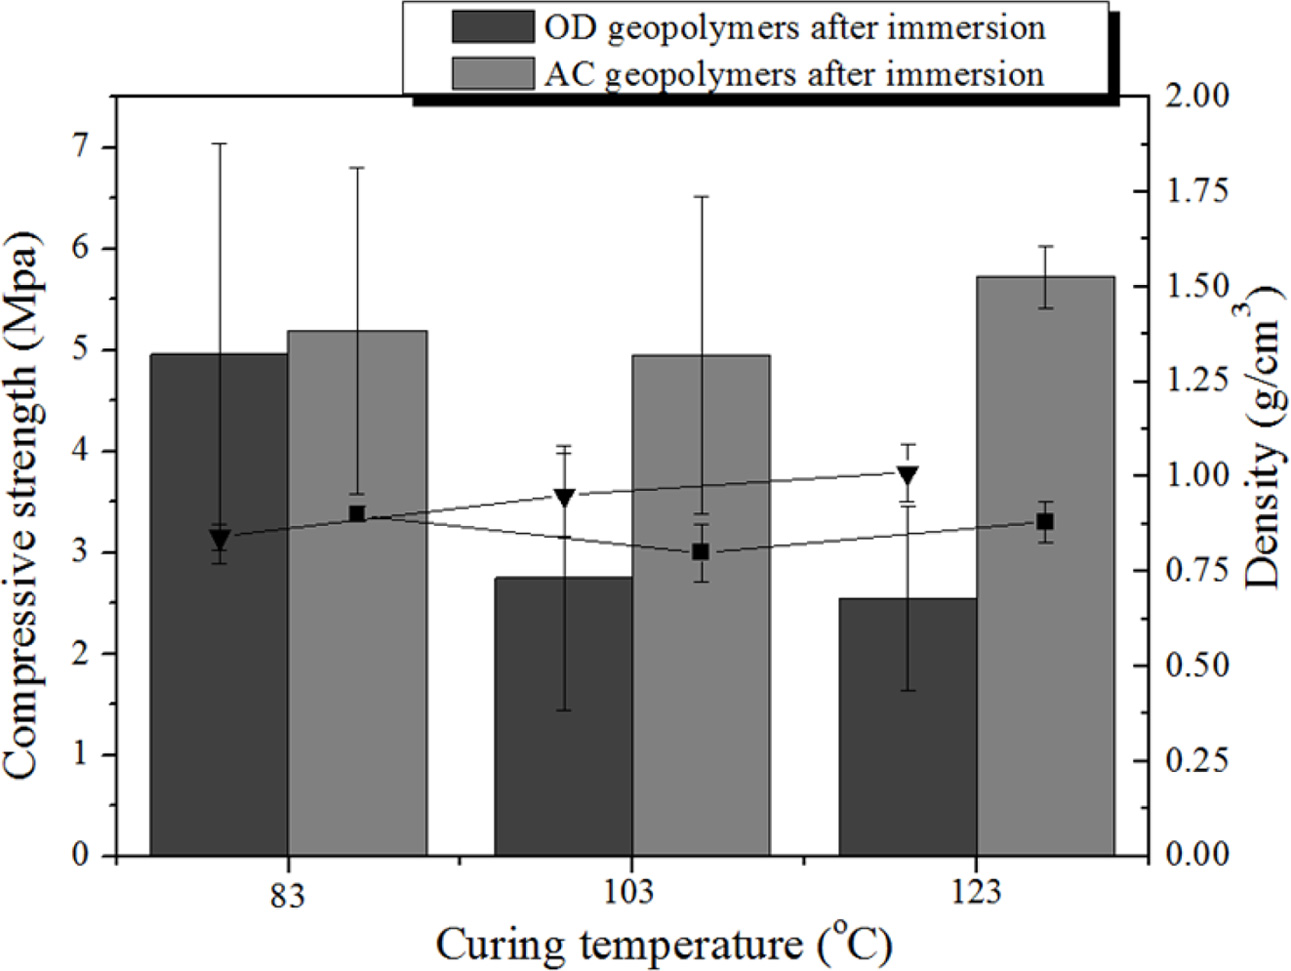
Fig. 6 shows the compressive strength and density changes of the dry oven and autoclave curing specimens for the three different curing temperatures after immersion for 40 h in water.
In contrast to the results presented in Fig. 3, the compressive strength values of all of the AC specimens were higher than those of the OD specimens. This indicates that AC specimens show enhanced water resistance to the water compared to the OD specimens due to the greater extent of the geopolymerization reaction enabled by the continuous supply of water and by the pressure in the autoclave chamber decreasing the size of the pores and obtaining a more homogenous pore distribution.
The compressive strength of the OD specimen cured at 83 oC decreased from 7.68 MPa to 4.96 MPa after immersion as shown in Figs. 3 and 6. This phenomenon occurred due to the dissolution of the unreacted part of the specimens during the immersion, implying that the geopolymerization reaction was not carried out to completion under the OD curing condition even though the OD specimen cured at 83 oC showed the highest compressive strength among all of the specimens as shown in Fig. 3.
On contrary, the compressive strength of the AC specimens cured at 83 oC increased from 4.63 MPa to 5.19 MPa after immersion. This indicates that the AC specimens continuously reacted with water during the immersion and reached the completion of the geopoly- merization reaction.
The compressive strength of the OD specimens after immersion decreased with increased curing temperature as shown in Fig. 6. The tendency of a decrease in the compressive strength of the OD specimen is similar as that of the OD specimen before immersion shown in Fig. 3. The tendency of an increase in the compressive strength of the AC specimen is also similar to that of the OD specimen prior to immersion shown in Fig. 3; however, it is important to note that the absolute values of the compressive strength of the AC specimens never decreased after immersion for all curing temperatures. This provides a clear proof that the geopolymerization reaction has been carried out to completion by autoclave curing even though the samples do not show the highest compressive strength and their strengths are lower than that of the OD specimen cured at 83 oC prior to immersion.
As shown in Fig. 6, a decrease (from 1.17 to 0.84) in the density of the OD specimen cured at 83 oC was observed after immersion. This was caused by the dissolution of the unreacted part of the specimen because the curing temperature 83 oC was not sufficient to complete the geopolymerization reaction so that more pores were produced during immersion. However, it appears that the rate of the decrease in the density was smaller than that for the compressive strength after immersion. Although the dissolution of the unreacted part of the specimen was not widespread, even the dissolution of a small region of the unreacted specimen may have a strong effect on the microstructure of the geopolymer leading to the greater decrease in the compressive strength of the OD specimens cured at 83 oC compared to all other specimens.
With the exception of the OD specimen cured at 83 oC, the density of all specimens tends to increase with increasing curing temperature after immersion. Moreover, the changes in the density with the curing temperature were small comparing to the changes in the compressive strength.
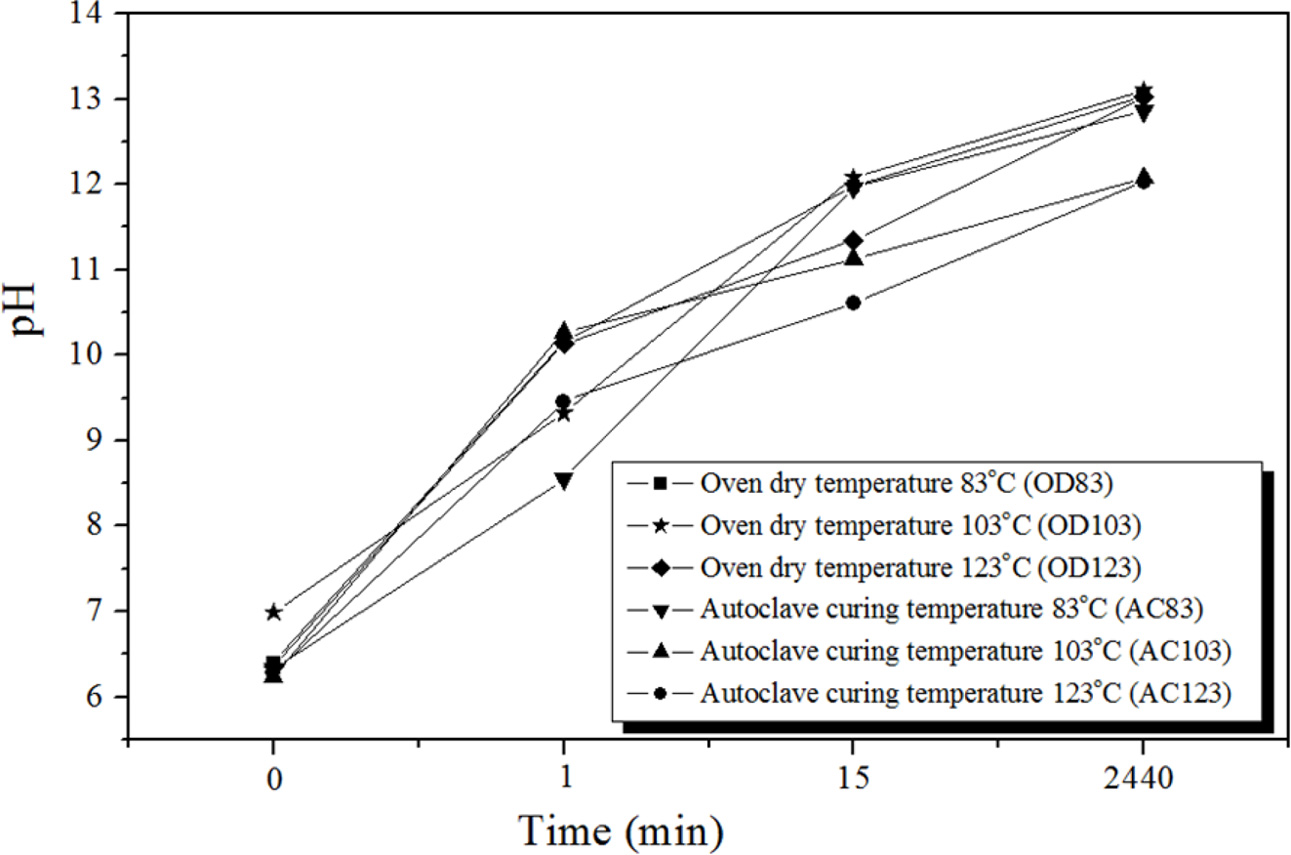
pH of solution after immersion
The pH of the solution after the immersion of the geopolymer is an indicator of the degree of geopoly- merization, with a higher solution pH after immersion corresponding to a higher degree of geopolymerization of the specimen.
As shown in Fig. 7, the pH of the solutions after immersion increases with longer immersion time in all cases. However, a clear difference was observed between the OD and AC specimens. Generally, the absolute pH values for the AC specimens at a given immersion time were lower than those for the OD specimens. This can be more clearly observed when the immersion time was longer than 15 min. In Fig. 7, an immersion time of zero means that the solution was sampled within 1 min after immersing the specimens. Therefore, the pH values of the solution at zero immersion time should be close to the pH of distilled water which is normally between 6.0 and 7.0 [24]. As expected, the pH values of the five solutions at zero immersion time overlapped and were close to 6.5 which is the pH of the distilled water used in this study. There was little difference between these 5 values except for the OD specimen cured at 103 oC.
The increase in the pH of the solutions after immersion with increased curing time was due to the dissolution of the unreacted alkaline activators into the solutions after immersion because the amount of the unreacted alkaline activator remaining in the specimen during or after the geopolymerization reaction should depend on both the curing time and the curing method. The pH values of the AC solutions were lower than those of the DO solutions because the degree of geo- polymerization of the AC specimens was higher than that of the DC specimens as mentioned above in Com- pressive strength and density after immersion. It is not difficult to expect that a lower content of unreacted alkaline activators remained in the specimen with a higher degree of geopolymerization. Therefore, naturally, the pH values of the AC solutions are lower than those of the DO solutions.
As shown in Fig. 7, the pH values of all OD solutions after immersion for 2440 min were above 13.0; hence, the pH values of the AC103 and AC123 solutions after the same immersion time were 12.08 and 12.03, respectively. The pH difference between the AC and DO solutions was greater than 1.0. This implies that the (AC) specimen cured using an autoclave is more stable in water than that cured with a dry oven even though they did not show the highest compressive strength prior to immersion.
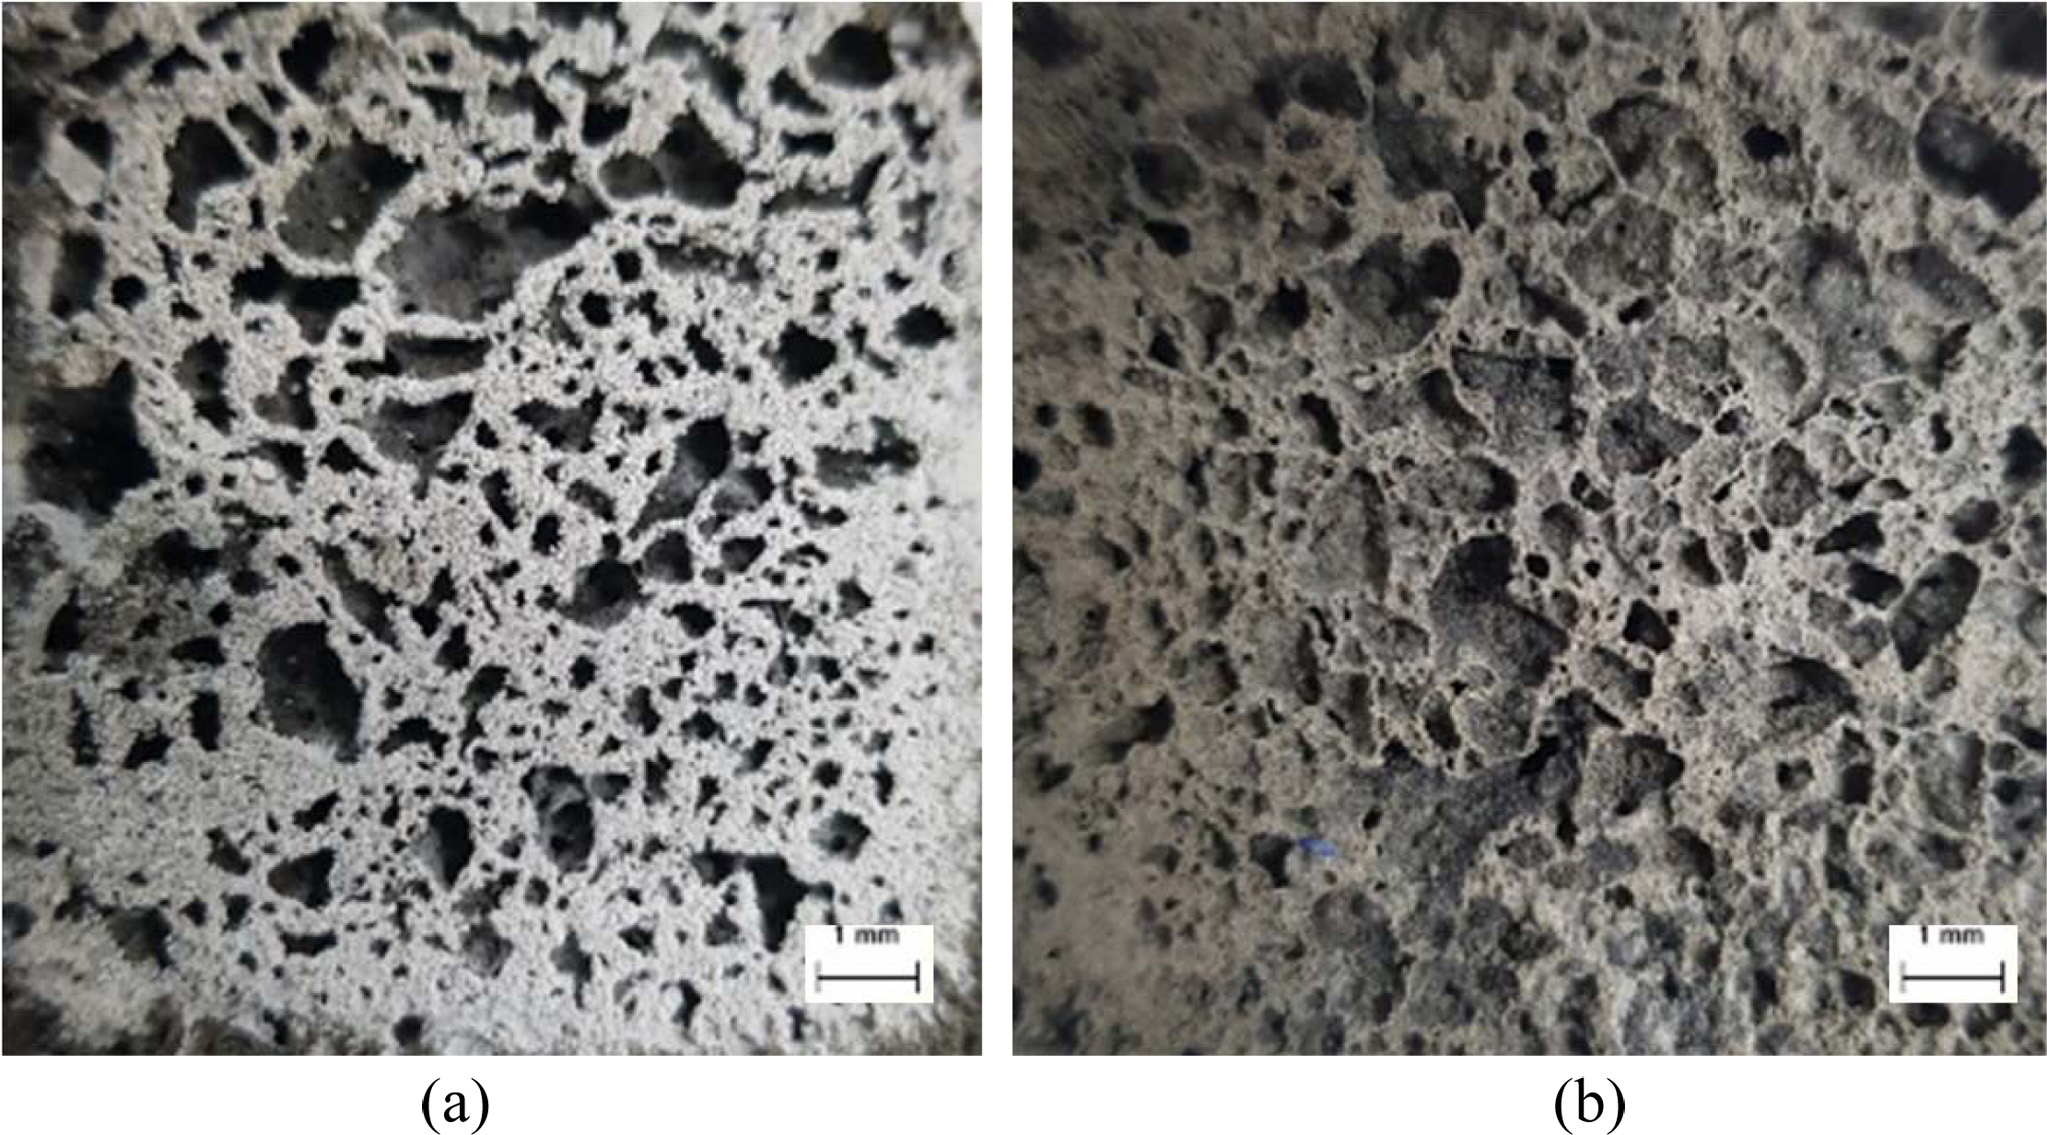
Fig. 8 shows the optical micrographs of the cutting surfaces of the AC123 and DO123 specimens after immersion into distilled water for 2440 min. Every specimen was dried for 24 h at room temperature prior to optical observation. As shown in Fig. 8, the AC123 specimen maintained its original structure because there was little or no difference between the micrographs obtained before and after immersion; however, DO123 specimen displayed many newly formed pores and loosened structures caused by the dissolution during the immersion due to the incomplete geopolymerization reaction. The micrographs in Fig. 8 unambiguously demonstrate the decrease after immersion in the com- pressive strength of the DO specimens with increased curing temperature, and show that the autoclave curing process is necessary for the completion of the geo- polymerization reaction and enhancement of the water resistance of the geopolymers.
ICP result of solution after immersion
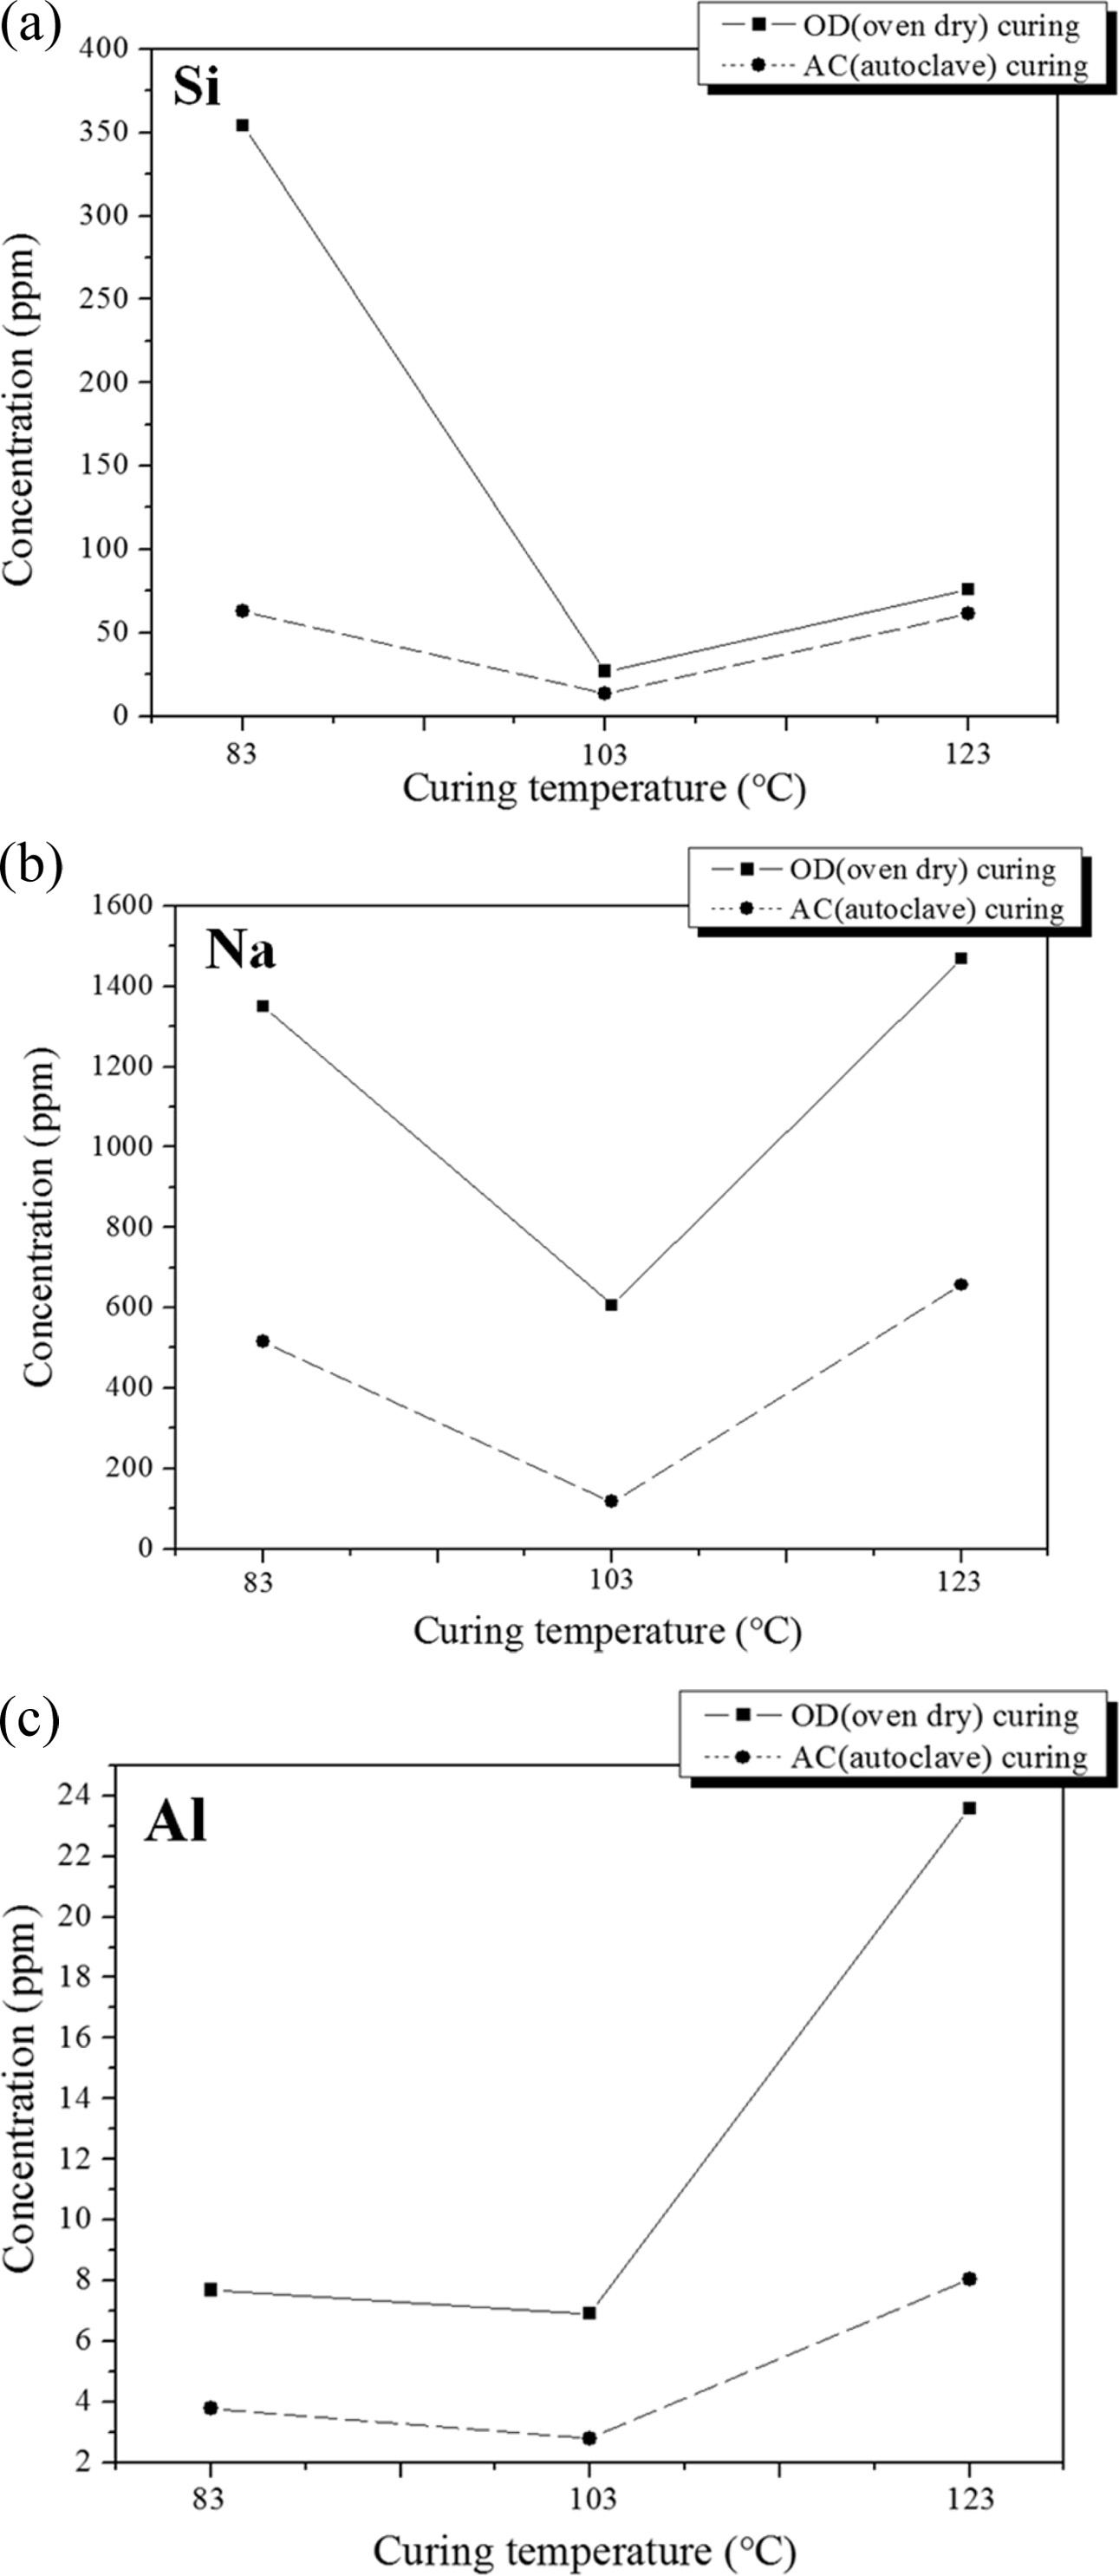
Because the color of the solutions after immersion varied with the curing method, concentrations of three selected ions in the solutions after immersion in distilled water were measured by ICP-AAS (induced coupled plasma- atomic absorption spectroscopy) analysis as shown in Fig. 9. It is observed that the total amount of dissolved ions in the solution after immersion was in the order of Na+, S-2, and Al+3 regardless of the curing temperature and method.
The concentrations of all three ions in the AC specimens after immersion were higher than those in the OC specimens regardless of the curing method in all cases. This provides clear proof for the hypothesis regarding the origin of the higher compressive strength of the AC specimens compared to that of the OD specimens as shown in Fig. 6. The lowest concentrations were found at the curing temperature of 103 oC for all of the specimens, although this is not in good agreement with the trend for the compressive strength as shown in Fig. 6 because the decrease in the compressive strength after immersion may be due to various factors other than the concentration of dissolved ions. However, the amount of dissolved ions, particularly Na+ ions, must be carefully considered when choosing the curing temperature and method, because the concentration of sodium ions may cause the efflorescence phenomenon of the geopolymers during their service in practical use.
As mentioned above, because the degree of geopoly- merization is higher at the higher curing temperatures, the amount of the dissolved ions should be smaller for the specimens obtained using higher curing tempera- ture in an autoclave curing process. However, the lowest dissolution of ions was found for the specimen obtained at 103 oC with autoclave curing. Therefore, future studies should investigated the origin of the lower concentrations of all three ions in the solutions after immersion observed for all of the specimens regardless of the curing method.
|
Fig. 2 A schematic diagram of the autoclave and the position of the specimen mold. |
|
Fig. 3 Comparison of the compressive strength and density of the geopolymer specimens cured in a dry oven and in an autoclave at three different curing temperatures. |
|
Fig. 4 FT-IR of the specimens cured at 123 oC (a) in a dry oven and (b) in an autoclave. |
|
Fig. 5 Optical micrographs of the geopolymer (fractured and outermost) surfaces for different curing temperatures and curing conditions (a) in an oven dry (OD) and (b) in a autoclave (AC). |
|
Fig. 6 Comparison of the compressive strength and density of the OD and AC geopolymer specimens obtained at three different curing temperatures after immersion in water for 40 h. |
|
Fig. 7 pH of the solutions as a function of the immersion time |
|
Fig. 8 Optical micrographs of the cutting surfaces of the specimens after immersion for 2440 min. (a) AC123 and (b) DO123. Little difference was observed between the micrographs of the AC123 specimens before and after immersion |
|
Fig. 9 Concentration of selected ions in the solutions after immersion in distilled water for different curing methods. (a) Concentration of sulfur ions (S-2) in the solutions after immersion, (b) Concentration of sodium ions (Na+ ) in the solutions after immersion, and (c) Concentration of aluminum ions (Al3+) in the solutions after immersion. |
|
Table 2 Relationship between the heating temperature and pressure in the autoclave |
|
Table 3 XRF analysis of the specimens cured in the dry oven and autoclave at 123 oC. (Wt.%) |

Industrially produced IGCC slags and Si sludge classified as general wastes were used as the raw material and the bloating material, respectively, to obtain light- weight geopolymers. When Si sludge reacts with an alkaline activator, a high amount of hydrogen gas is produced generating many pores in the geopolymer matrix and obtaining an ultra-lightweight specimen. However, a too high addition of Si sludge generated large pores and an inhomogeneous distribution of the pores, resulting in adverse effects on the mechanical properties of the lightweight geopolymers. Accordingly, it was attempted to control the microstructure and pore distribution of lightweight geopolymers by changing the curing temperature and the curing method. Com- pressive strengths, pH changes, FT-IR spectra, micro- structure observations, and ICP results before and after immersion were compared for the specimens obtained using different curing temperature and curing method.
In conclusion, although the highest compressive strength before immersion was obtained from the geo- polymer specimen cured at 83 oC in the oven dryer, the highest compressive strength after immersion was obtained from the specimen cured at 123 oC in the autoclave because the degree of geopolymerization was higher in this case than for any other specimens according to the analysis of pH changes, FT-IR spectra, micro- structure observation, and ICP results. Therefore, the best curing conditions for maintaining stable mechanical properties under the wet service environments is curing at high temperature (123 oC) with an autoclave. Moreover, the absolute value of compressive strength of geo- polymers with autoclave treatment after immersion is at least 5 times higher than those of specimens without autoclave treatment and there was no significant decrease in compressive strength after immersion with autoclave treatment [25].
The efflorescence phenomenon of the geopolymer after long-term aging will be studied in the near future.
This work was supported by a Kyonggi University Research Grant 2019
- 1. B. Commission, in “Our Common Future” (Oxford University Press, 1987) p 27.
- 2. P. Purnell, Environ. Sci. Technol. 46[1] (2011) 454-461.
-

- 3. L.K. Turner, and F.G. Collins, Constr. Build. Mater. 43[6] (2013) 125-130.
-
- 4. J. Davidovits, in Proceeding of the 95th Annual Meeting of The American Ceramic Society, November 1993, edited by Moukwa M. (Amer Ceramic Society, 1993) p.1654.
- 5. Y.J. Kim, A. Hanif, M. Usman, M.J. Munir, S.M.S. Kazmi, and S. Kim, J. Clean. Prod. 172[3] (2018) 3056-3065.
-
- 6. S.M. Zabihi, H. Tavakoli, and E. Mohseni, J. Mater. Civ. Eng. 30[8] (2018) 04018183.
-
- 7. G. Habert, J.B Lacaillerie, and N. Roussel, J. Clean. Prod. 19[11] (2011) 1229-1238.
-
- 8. R. Kajaste and M. Hurme, J. Cleaner Prod. 112[5] (2016) 4041-4052.
-
- 9. S.J. Lee, E.M. An and Y.H. Cho, J. Rec. Const. Res. 4[4] (2016) 363-370.
- 10. Y. Wang, X. Liu, W. Zhang, Z. Li, Y. Zhang, Y. Li, and Y. Ren, J. Clean. Pod. 244[3] (2020) 118852.
-
- 11. P. He, M. Wang, S. Fu, D. Jia, S. Yan, J. Yuan, J. Xu, P. Wang, and Y. Zhou, Ceram. Int. 42[13] (2016) 14416-14422.
-
- 12. K. Sun, X. Peng, S. Wang, L. Zeng, P. Ran, and G. Ji, Constr. Build. Mater. 253[24] (2020) 118952.
-
- 13. J. Temuujin, A. van Riessen, and R. Williams, J. Hazard. Mater. 167[1-3] (20019) 82-88.
-
- 14. W.K.W. Lee, and J.S.J. Deventer, Langmuir. 19[21] (2003) 8726-8734.
-
- 15. M.J. Kim, and Y.T. Kim, J. Korean Cryst. Growth Cryst. Technol. 29[6] (2019) 257-263.
-
- 16. J. Davidovits, J. Thermal Analysis 37[8] (1991) 1633-1656.
-
- 17. F.G.M. Aredes, T.M.B. Campos, J.P.B. Machado, K.K. Sakane, G.P. Thim, and D.D. Brunelli, Ceram. Int. 41[6] (2015) 7302-7311.
-
- 18. J.G.S. van Jaarsveld and J.S.J. van Deventer, Ind. Eng. Chem. Res. 38[10] (1999) 3932-3941.
-
- 19. A. Autef, E. Joussein, G. Gasgnier, and S. Rossignol, J. Non-Cryst. Solids 358[21] (2012) 2886-2893.
-
- 20. M. Kim and Y. Kim, Korean Cryst. Growth Cryst. Technol. 29[6] (2019) 257-263.
- 21. P.W. Cleary, Minerals. Eng. 11[11] (1998) 1061-1080.
-
- 22. Sindhunata, J.L. Provis, G.C. Lukey, H. Xu, and J.S.J. Deventer, Ind. Eng. Chem. Res. 47[9] (2008) 2991-2999.
-
- 23. M. Kim and Y. Kim, J Ceram. Proc. Res. 22[1] (2021) 39-47.
- 24. H.L. Youmans, J.Chem. Educ. 49[6] (1972) 429.
-
- 25. Y. Kim and M. Kim, Int'l J Mech. Production Eng. 8[5] (2020) 47-51.
 This Article
-
2021; 22(2): 158-168
Published on Apr 30, 2021
- 10.36410/jcpr.2021.22.2.158
- Received on Jul 16, 2020
- Revised on Oct 7, 2020
- Accepted on Nov 23, 2020
Services
- Abstract
introduction
experimental procedures
results and discussions
conclusions
- Acknowledgements
- References
- Full Text PDF
Shared
Correspondence to
- Yootaek Kim
-
Department of Materials Engineering, Kyonggi University, Suwon 16227, Republic of Korea
Tel : +82-70-4024-9765 Fax: +82-31-249-9774 - E-mail: ytkim@kgu.ac.kr
Clean-Energy Research Institute(CRI), Hanyang University, 222, Wangsimni-ro, Seongdong-gu, Seoul, 04763, Korea
E-mail: jcpr@hanyang.ac.kr