- Collapse rate enhancement of lightweight geopolymer by extra-mixing during the bloating process
Minjeong Kim and Yootaek Kim*
Department of Materials Engineering, Kyonggi University, Suwon 16227, Republic of Korea
This article is an open access article distributed under the terms of the Creative Commons Attribution Non-Commercial License (http://creativecommons.org/licenses/by-nc/4.0) which permits unrestricted non-commercial use, distribution, and reproduction in any medium, provided the original work is properly cited.
Integrated gasification combined cycle (IGCC) slag and Si sludge, classified as general waste, were used as raw materials for making geopolymers. Geopolymers containing Si sludge have lightweight characteristics; however, they can easily collapse during the bloating process because of the formation of explosive hydrogen gas through the reaction between Si and the alkaline activator. Several methods, such as controlling the concentration of the alkaline activator, curing temperature, and mixing time, have been attempted, and the relationship between these parameters and the collapse rate has been investigated. Providing extra heat to the specimen during the bloating process would be an effective way to prevent collapse; however, it would not be economical because an additional cost would be required for extra heating during the bloating process. It was speculated that the most effective and economical way of preventing collapse or enhancing the collapse rate would be to supply extra mixing time during the bloating process. The optimum mixing time must be estimated under each set of geopolymer manufacturing conditions. A homogeneous and small-sized pore distribution could be obtained in the geopolymer matrix by providing extra mixing time during the bloating process
Keywords: Lightweight geopolymers, IGCC slag, Si Sludge, Bloating, Collapse rate
Many studies on substitution materials for cement have been performed since the first study in 1893 by R. Feret [1]. However, efforts have been mainly focused on the partial substitution of cement but not the complete elimination of cement from the process. Geopolymers, which do not involve the use of cement but rather alumino-silicate materials with an alkaline activator, were developed by Davidovits in 1978 [2]. Since environmental problems caused by the increase in carbon dioxide have become an important issue worldwide, alkaline-activated concrete using spent materials, such as fly ash and blast furnace slag, has been developed by researchers in Australia, USA, and Europe, promoted because of the great amount of carbon dioxide produced by the cement industry during the production process [3].
Integrated gasification combined cycle (IGCC) slag, produced from a power plant in Korea, was used as a raw material to make geopolymer as there was a sufficient amount of alumino-silicates in it in the amorphous state. IGCC slag has also been used as a raw material for making ultra-lightweight geopolymers with bloating materials [4]. Si sludge originating from the Si single crystal or the polycrystal production process was used as a bloating material because it produces much hydrogen gas, which could facilitate the formation of a large number of pores in the geopolymer matrix when reacted with an alkaline activator [5]. Because IGCC slag and Si sludge are classified as industrial waste in Korea, using them as raw material for making geopolymer is desirable from the recycling point of view.
As mentioned earlier, lightweight geopolymers could be made using IGCC and Si sludge because a signi- ficant amount of hydrogen gas was produced during the bloating process; however, specimens were broken down during the bloating process by uncontrollable explosive bloating when too much Si sludge was added [6, 7]. Ultra-lightweight specimens could be obtained with an increase in Si addition to the geopolymer slurry. Ultra-lightweight specimens are widely used as inner decorating materials or outdoor building materials to reduce the total weight of the building [8]. Although several trials for enhancement of lightweight geopolymer have been made, the question is how to maintain the structure of ultra-lightweight material stable without collapse during or after the bloating process while maintaining lightweight characteristics [9, 10]. Therefore, the purpose of this study is to find a way to prevent the collapse of ultra-lightweight specimens during bloating by changing curing conditions or controlling the bloating process.
Several trials were attempted in an effort to prevent the collapse of specimens during the bloating process by increasing the curing temperature, performing direct and indirect firing, implementing furnace sintering, and changing the mixing time and methods. Research was focused on two approaches. One was to accelerate the geopolymerization reaction by raising the curing temperature and controlling the water content through heating. The other method was to control the pore size and distribution simultaneously by changing the mixing time. In conclusion, the latter was found to be the more effective way to prevent the collapse phenomenon.
Materials
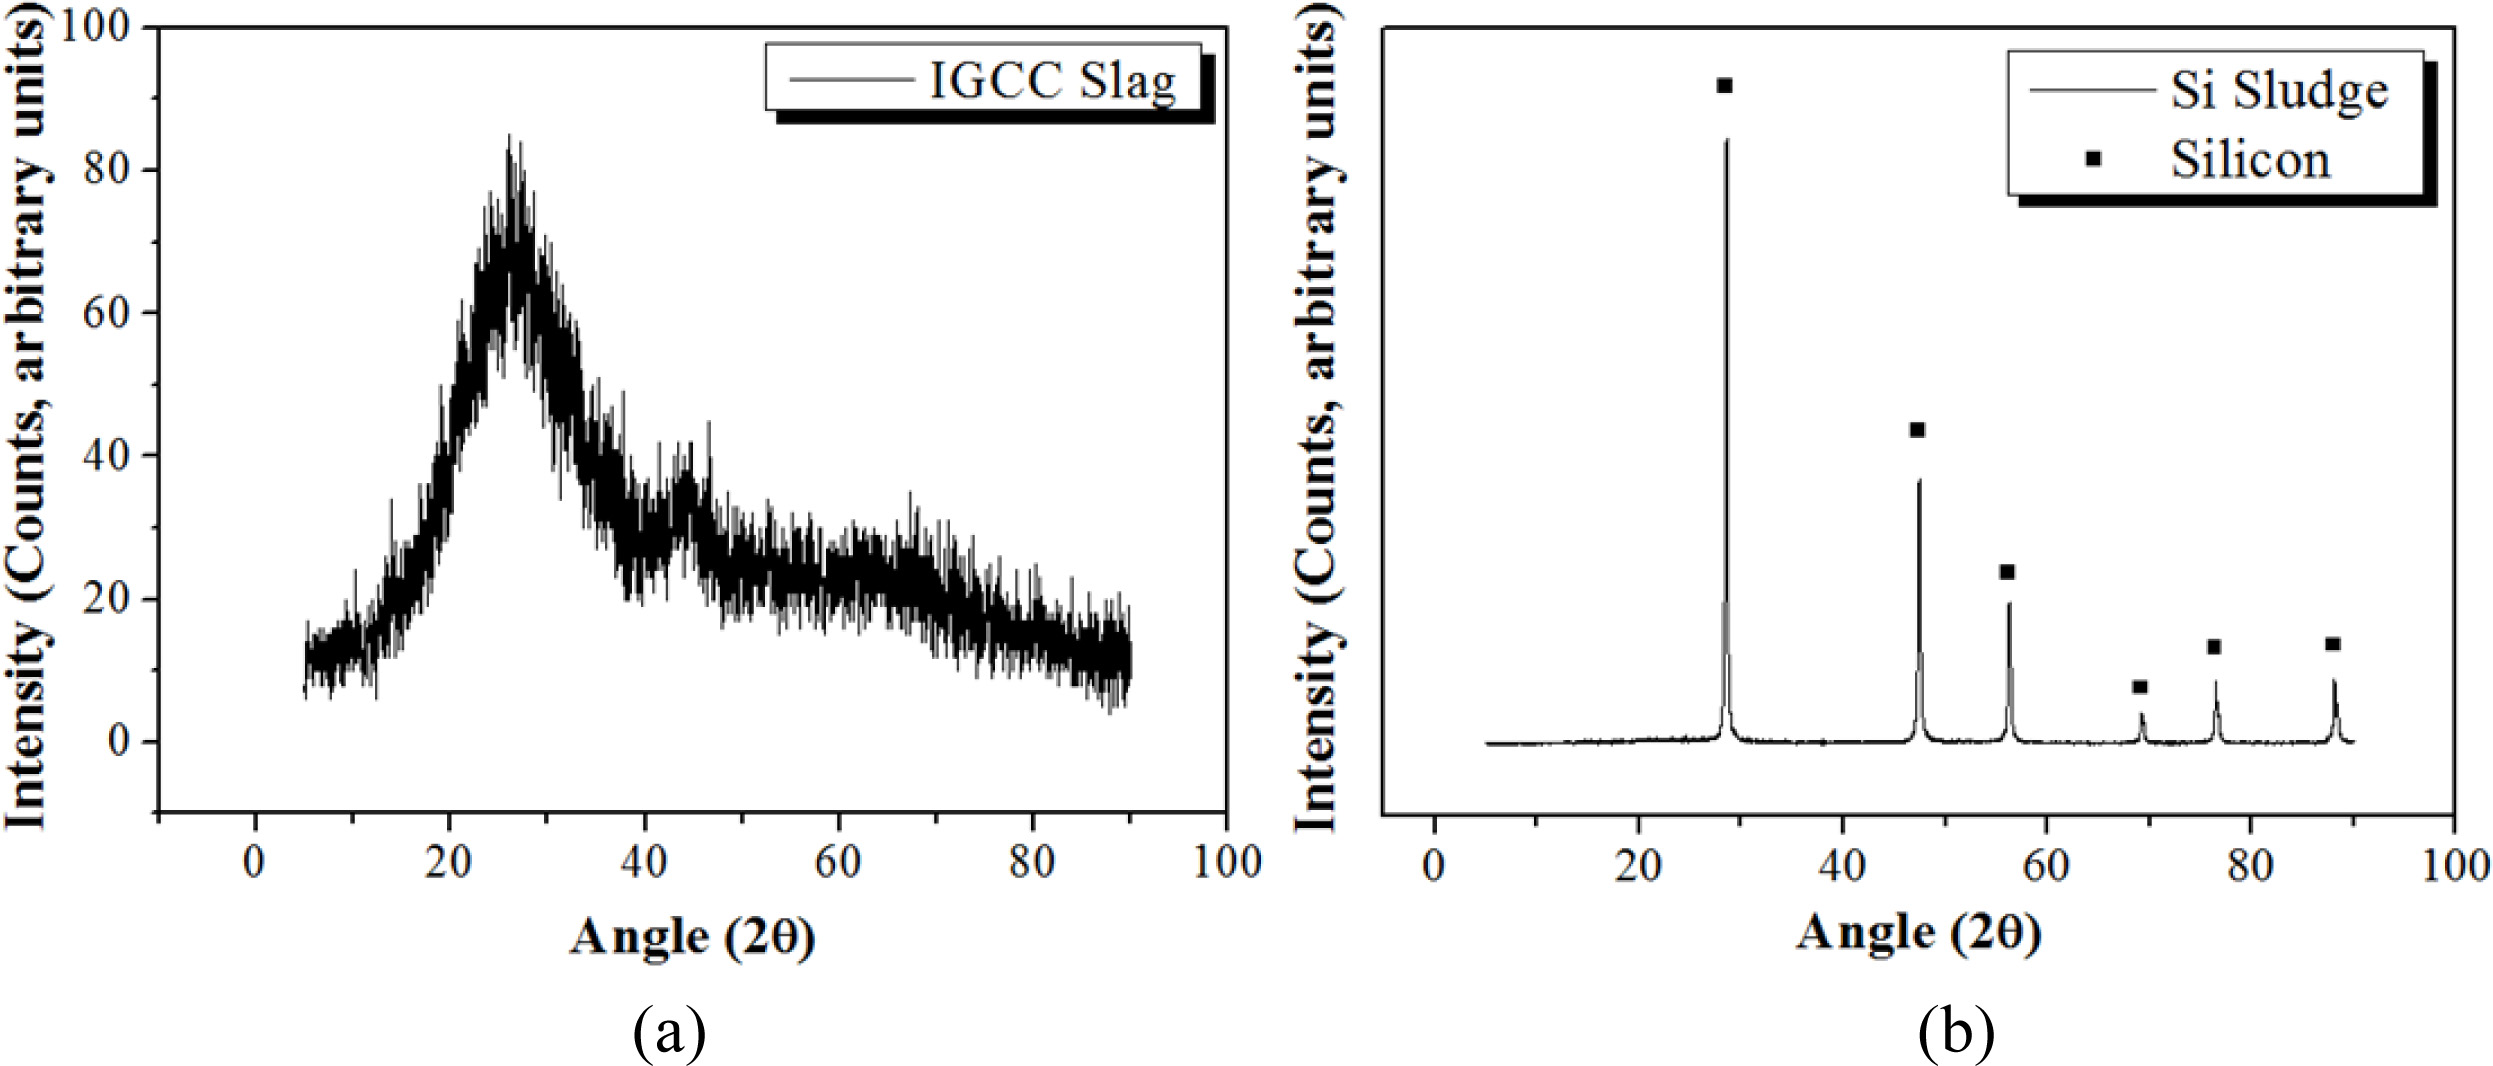
IGCC slag produced from a coal gasification combined power plant in Korea was used as a raw material for making geopolymers. The size of the slag particle was controlled to under 106 µm after milling and sieving. Table 1 shows the result of X-ray fluorescence (XRF) analysis, showing that the major components of IGCC slag were Al2O3, SiO2, and CaO. The phase of IGCC slag was determined to be amorphous from the X-ray diffraction (XRD) pattern, as shown in Fig. 1.
Si sludge produced from the cutting process of a single Si crystal was used as a bloating material for making lightweight geopolymers. Si sludge consists of 97.78% Si, whereas the rest comprises impurities such as Al2O3 and cutting oil [11]. Fig. 1(b) shows the XRD pattern of Si sludge demonstrating a perfect Si poly- crystalline pattern.
A mixed alkaline activator was made with NaOH and sodium silicate solution for this study. The mol concen- tration, W/S ratio, Si sludge addition, curing tempera- ture, and mixing time were the variables for this study [12].
Experimental procedures
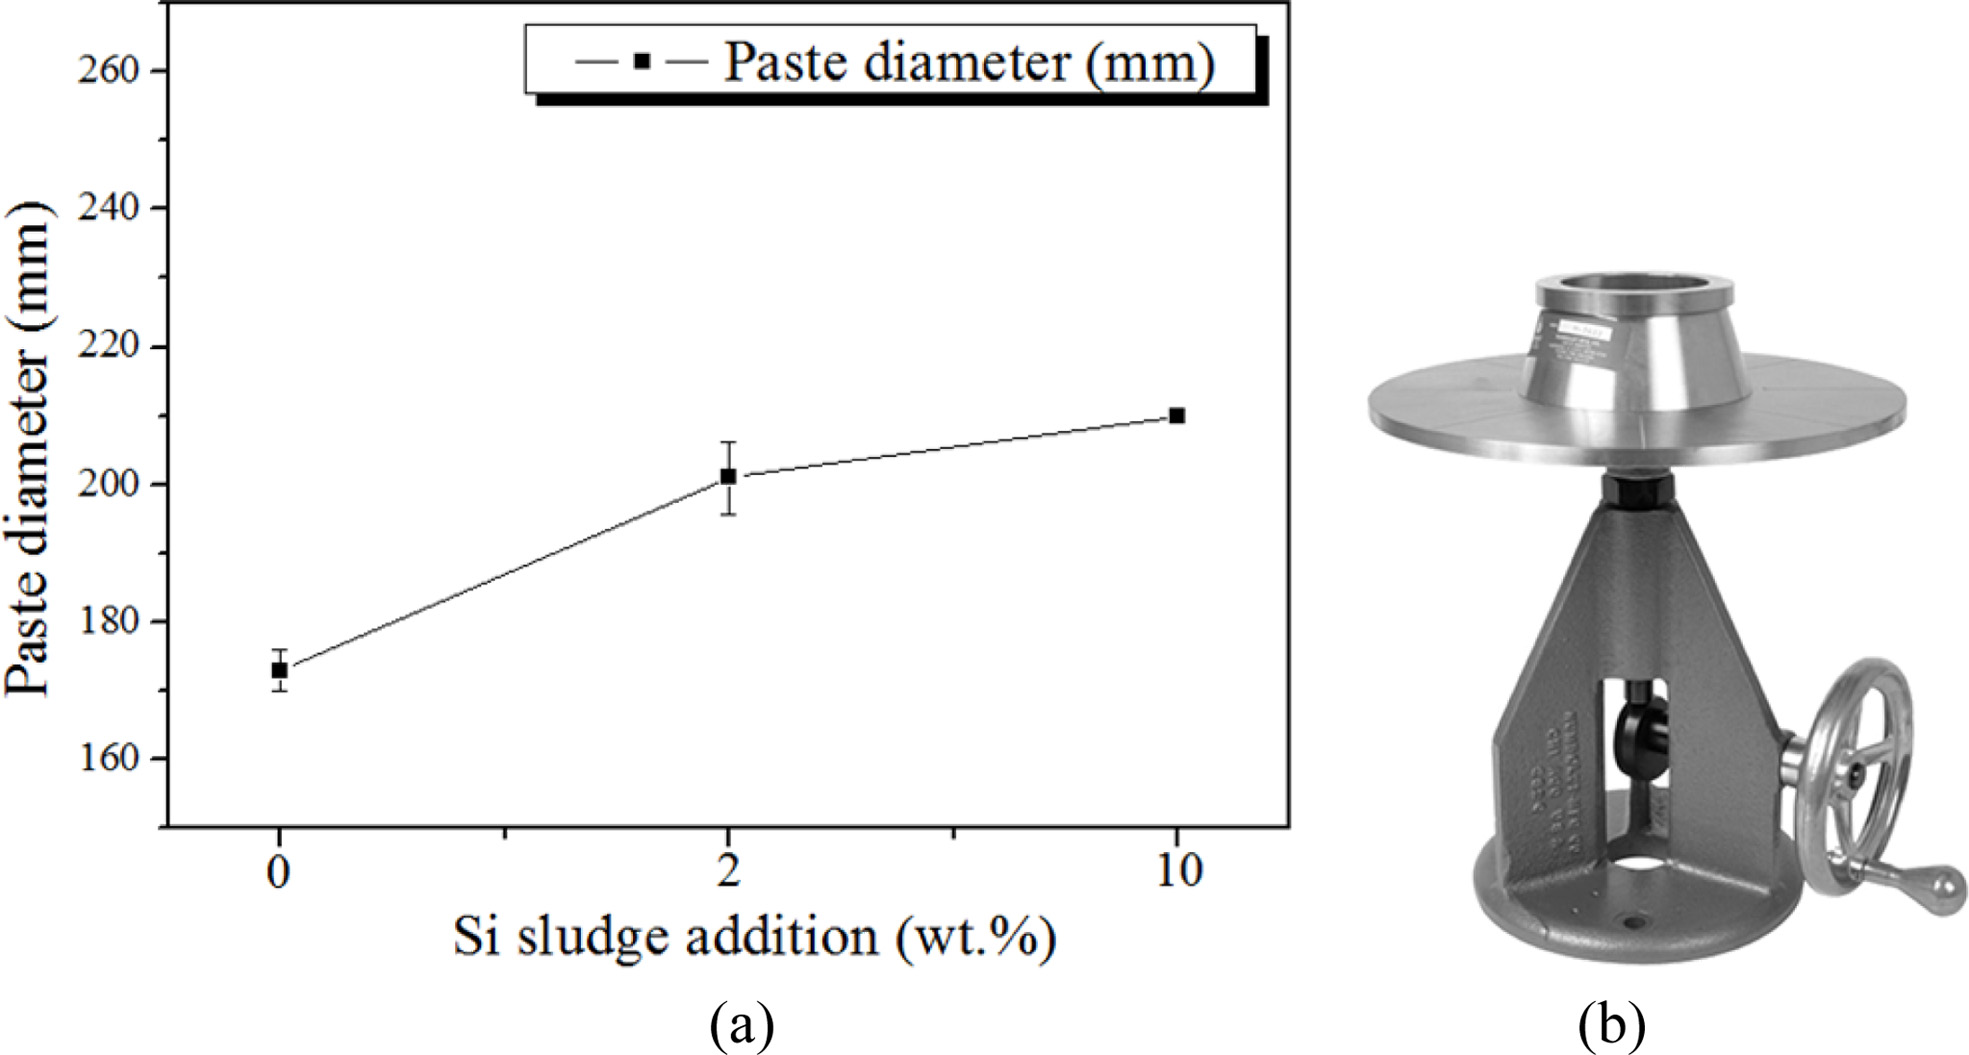
The paste diameter (flow rate of slurry) of the geopolymer slurry was measured by the flow table test (KS F 2140) to investigate the relationship between the paste diameter and the collapse rate [13]. Geopolymers were fabricated by the process shown in Fig. 2. Both IGCC slag and Si sludge were milled by ball and planetary milling until the raw materials could pass through a 106 µm sieve.
As shown in Fig. 2, raw materials were mixed by ball mill for 10 min and then were moved into plastic beaker and mixed again with mixed alkaline activators for 1 min. Extra mixing has been performed on selected specimens to investigate the relationship between extra mixing and the collapse rate and determine the optimum mixing time for developing a homogeneous pore structure in the geopolymers. After mixing the geopolymer, the slurry was poured into the mold of size 50 × 50 × 50 mm3 as shown in Fig. 1. Molded specimens were enveloped with polyethylene sealing bags and then dried in the oven at 70 oC for 24 h. Polyethylene sealing bags were used to keep the moisture level during the initial stage of geopolymerization during the curing process. Extra heat to the specimens in the mold was provided by a torch or furnace up to 300 oC to prevent collapse during the bloating process before curing.
Because specimens with Si sludge were usually bloated and swelled during the bloating and curing process, the top part of the specimens were cut by a diamond saw to make specimens of exact 50 × 50 × 50 mm3 size after the demolding process.
|
Fig. 1 XRD pattern of IGCC slag and Si. (a) IGCC slag and (b) Si sludge. |

|
Fig. 2 Schematic diagram of experimental procedures for making geopolymer specimens. |
XRD analysis of raw materials
The phase of IGCC slag was determined to be amorphous from the X-ray diffraction (XRD) pattern, as shown in Fig. 1(a). Fig. 1(b) shows the XRD pattern of Si sludge demonstrating a perfect Si polycrystalline pattern.
Si sludge produced from the cutting process of a single Si crystal was used as a bloating material for making lightweight geopolymers. Si sludge consists of 97.78% Si, whereas the rest comprises impurities such as Al2O3 and cutting oil [11]. Fig. 1(b) shows the XRD pattern of Si sludge demonstrating a perfect Si poly- crystalline pattern.
Flow of slurry
It was speculated that the flow of the geopolymer slurry might seem to be related to the collapse rate because the flow of the slurry significantly affected the formation of the geopolymer, which means that the bloating phenomenon varied according to the flow rate of the slurry. When the flow is low, the formation process gets easier, but the bloating becomes difficult. Hence, when the flow is high, formation gets difficult, and the collapse rate of the specimen increases because of more bloating. Therefore, the paste diameter (flow rate of slurry) of the geopolymer slurry was measured by the flow table test (KS F 2140).
Fig. 3 shows the relationship between the paste diameter and amount of Si sludge addition. The paste diameter increased with an increase in the amount of Si sludge addition, up to 10 wt.%. Comparing paste diameters of the geopolymer slurries with and without Si sludge, there was an increase of approximately 20% in diameter by the 2 wt.% addition of Si; however, it is difficult to conclude that the collapsing phenomenon of geopolymer during the bloating period was caused simply by an increase in the slurry flow. Therefore, the research focus was shifted to the concentration of the alkaline activator rather than the slurry flow.
Mol concentration
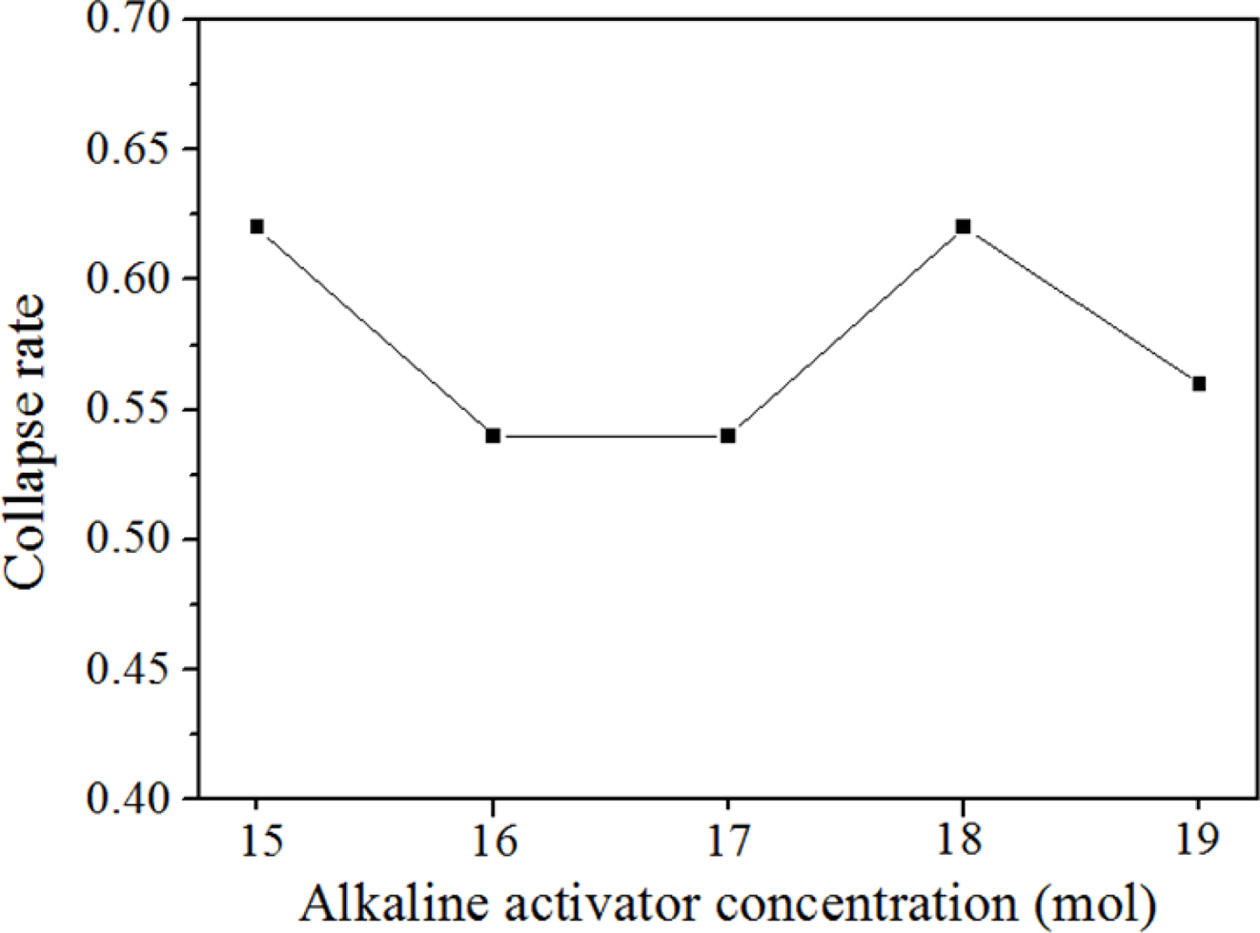
The relationship between the concentration of the alkaline activator and the collapse rate, which is defined as the value calculated by the height of the specimen after bloating over the height of the specimen before bloating, was investigated to establish the mechanism of collapse. According to the theory that the greater concentration of alkaline activator leads to greater compressive strength, concentrations of alkaline activator were varied from 15 to 19 mol, and the collapse rates were measured. The collapse rate was measured using the following eq. (1) [14].

Fig. 4 shows the relationship between the collapse rate and the concentration of the alkaline activator. As shown in Fig. 4, no particular relationship can be found from the figure; however, all the specimens with 2 wt.% Si addition are shown to collapse without exception, regardless of alkaline activator concentration. The collapse rates of the specimens fall between 0.54 and 0.63, which means that all the specimens collapsed by more than 50% from their original height before bloating. It was concluded that the collapse of geopolymers with greater than 2 wt.% Si addition cannot be avoided by controlling the concentration of the alkaline activator.
Temperature
Curing temperature
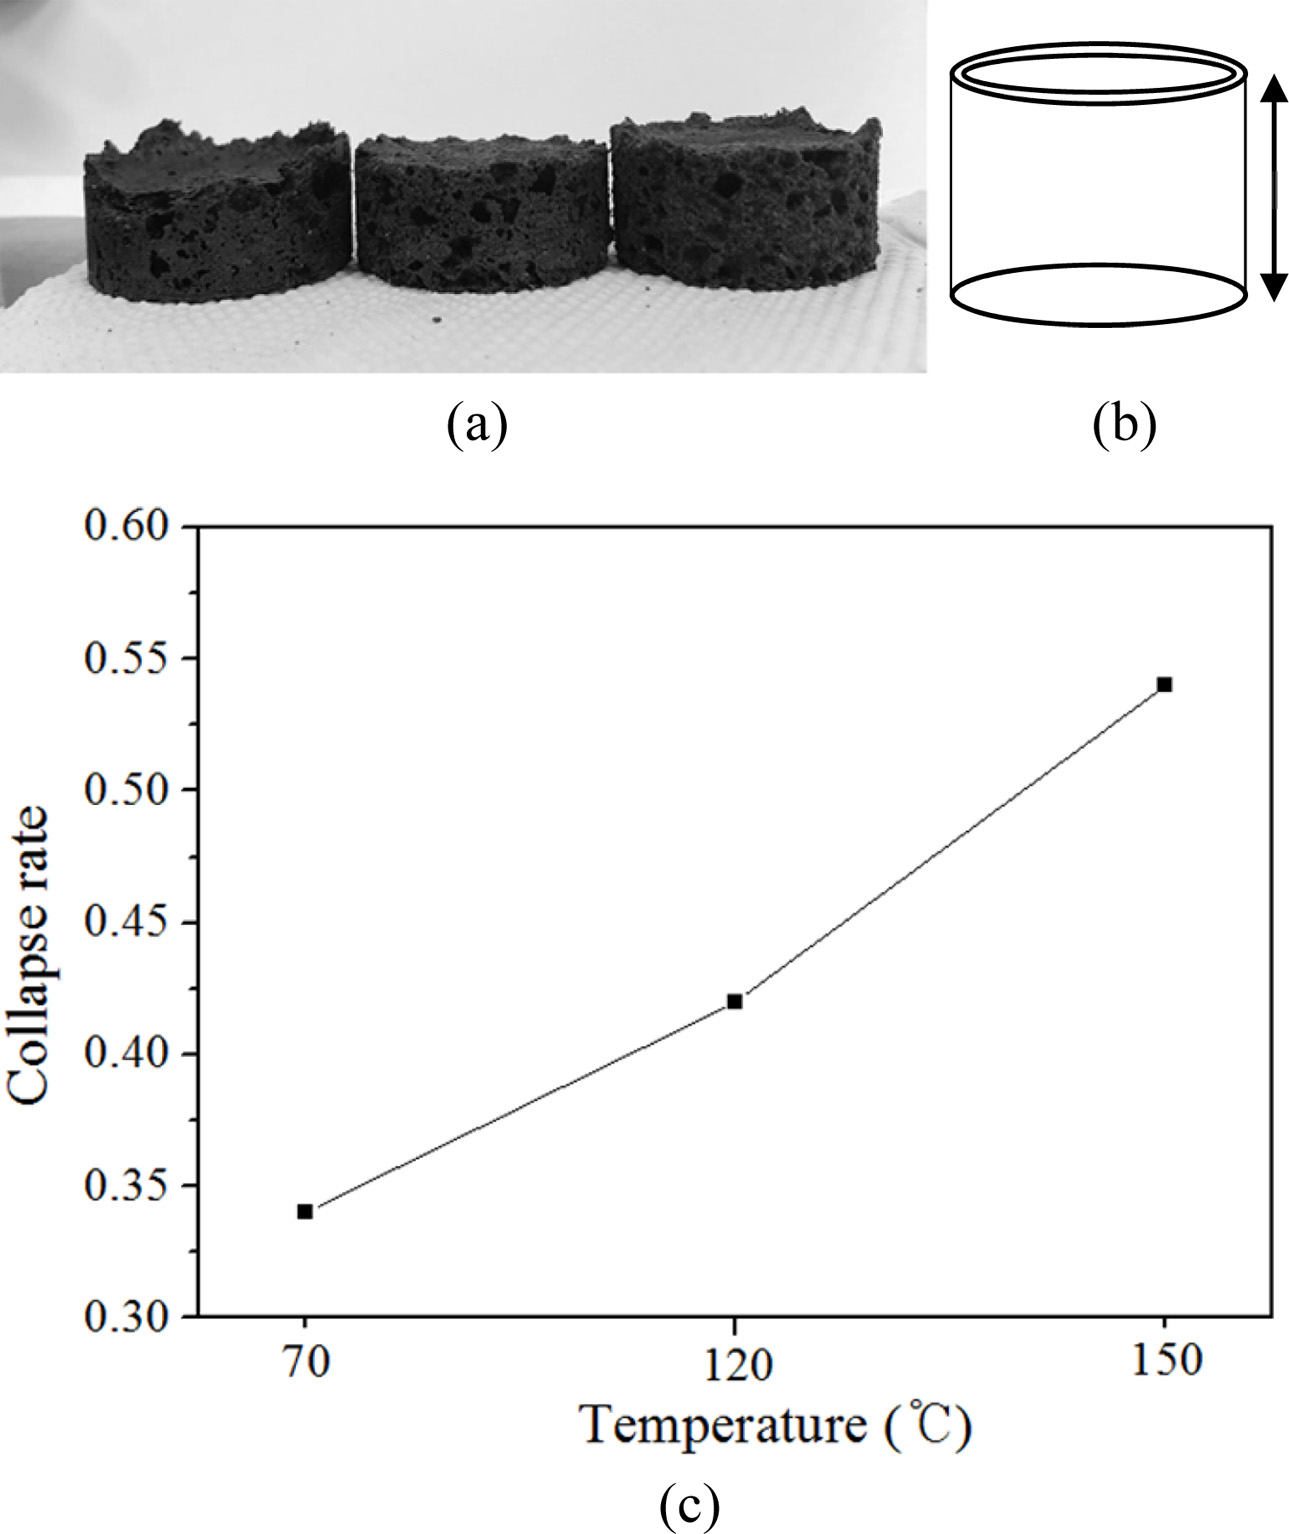
Curing temperature is one of the factors that affects the collapse rate during the bloating process as indicated from previous experimental experiences [15]. Geopoly- mers are usually cured at 70 oC for 24 h. However, because all the specimens collapsed under this condition, curing temperatures were increased to 150 oC to giving them more compressive strength during the curing process. Fig. 5 shows the photographs of the geopolymer specimens after curing at different temperatures and the relationship between the curing temperature and collapse rate. Fig. 5(b) shows a schematic diagram of the mold for the specimens shown in Fig. 5(a). This diagram provides a comparison of the original size of the specimen before collapse and that after collapse. As shown in the figures, all the specimens collapsed; however, the collapse rate decreased with an increase in curing temperature, as expected. It was concluded that a complete prevention of collapse could not be achieved by controlling the curing temperature, as 150 oC is the maximum curing temperature in practice whereby a curing temperature above 150 oC is con- sidered as firing or sintering. Therefore, the focus shifted to firing and sintering to prevent the collapse of geopolymers.
Torch firing
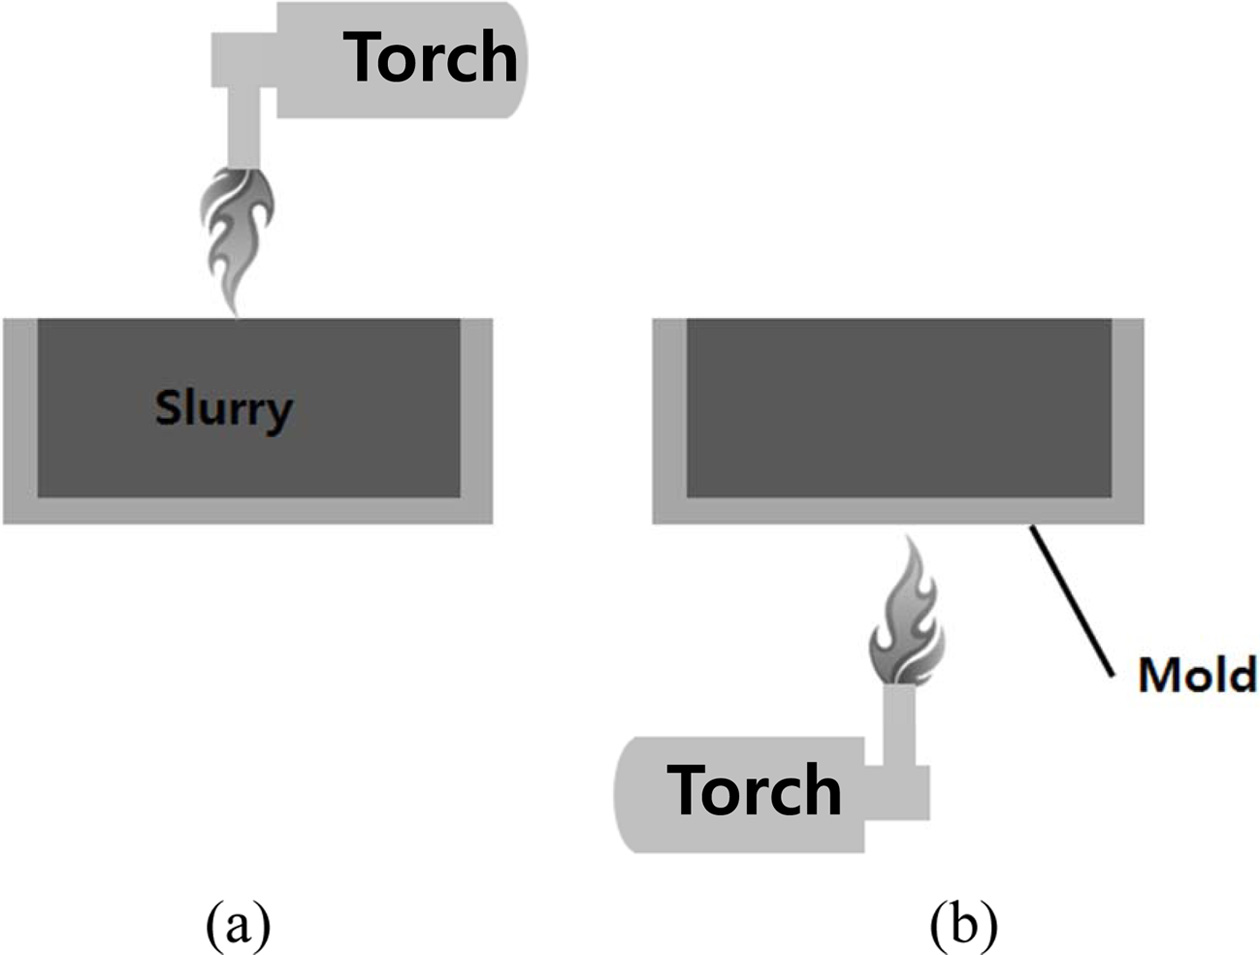
Geopolymer specimens charged into the mold right after the mixing process were exposed to fire through direct and indirect methods, as shown in Fig. 6. The purpose of this experiment was to determine whether geopolymerization could be activated and end earlier by providing extra heat from the outside.
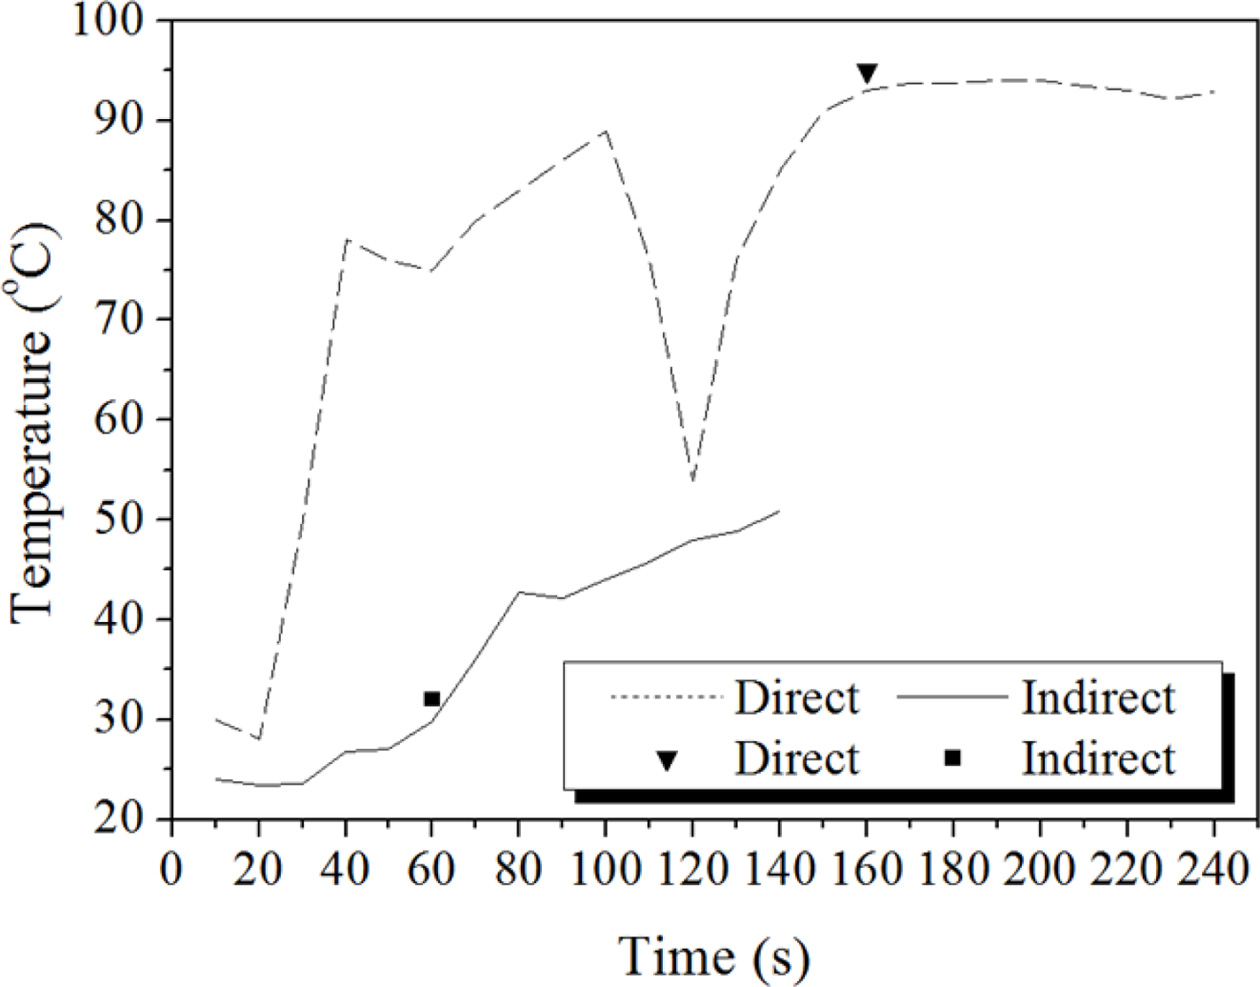
The temperature profiles of the geopolymer specimens are shown in Fig. 7. A thermocouple was embedded into the specimen paste during the firing. The tem- perature of the specimen paste increased rapidly to 80 oC in 30 s and reached 93 oC with the direct firing method. Hence, the temperature of the specimen paste increased slowly to 50 oC in 130 s with the indirect firing method. The inverse triangle mark and square mark on the temperature profile curves indicate the start time for bloating. As shown in Fig. 7, bloating started at 29.8 oC after 60 s of indirect firing and at 93.0 oC after 160 s of direct firing. This means that the starting time of bloating is dependent on the tempera- ture of specimen paste and method of firing. Direct firing may delay the bloating time because water near the surface is evaporated by the direct firing. The starting time of the bloating is thought to be delayed with the higher paste temperature.
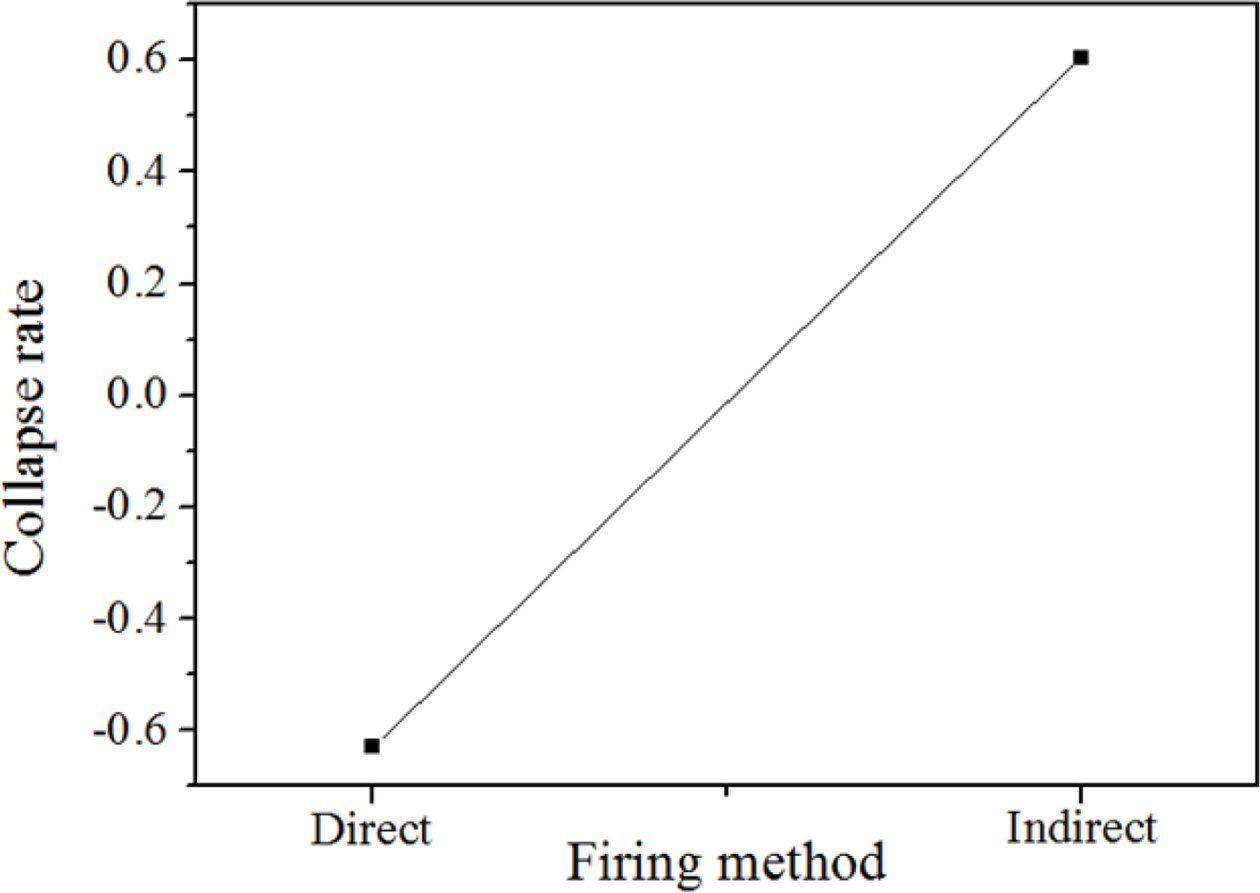
As shown in Fig. 8, the collapse rate was remarkably changed by the torch heating regardless of firing method. The specimens expanded by 60% instead of collapsing in the case of direct torch heating; meanwhile, the specimens collapsed by 60% in the case of indirect torch heating. In any case, a volume change could not be avoided in either method.
Furnace firing
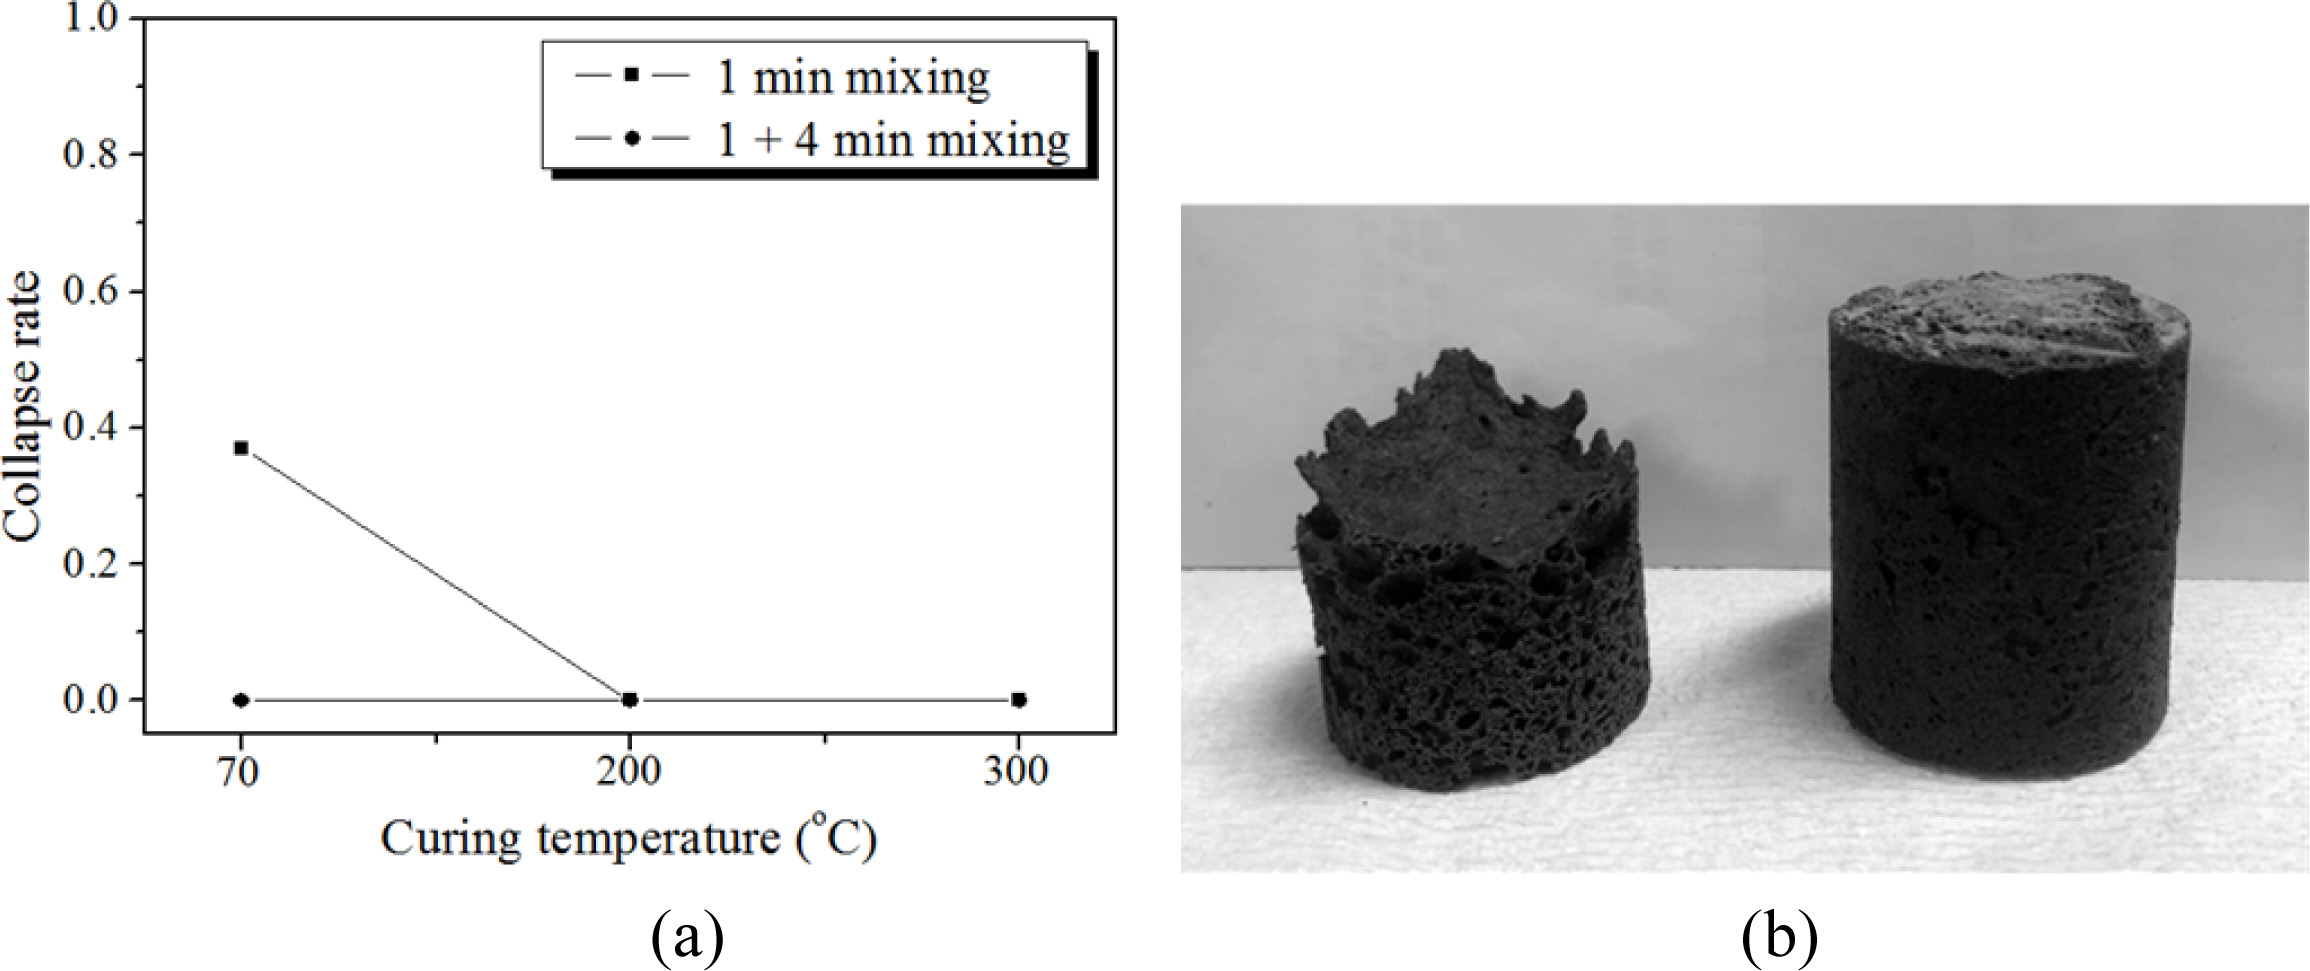
Based on the preliminary results as shown in section 3.3.2, specimens were heated to more than 300 oC in the furnace to confirm the effect of heating during the bloating and reduce the collapse rate. For specimen heating, the specimens in the mold were directly placed into the furnace, which was already heated up to the target temperature; then, the specimens were kept in the furnace for 1 h. Fig. 9 shows the relationship between the collapse rate and the curing temperature under different mixing time conditions before molding.
The collapse rate reached near zero by heating above 200 oC in a furnace, even for the 1 min mixing case, as shown in Fig. 9. Conclusively, providing extra heat to the specimen in the mold during the bloating process helped to prevent the collapse of the specimen; however, a more economical way of preventing collapse may be to mix the slurry more before molding at the normal curing temperature (70 oC) of geopolymers because there is no extra heat supply involved.
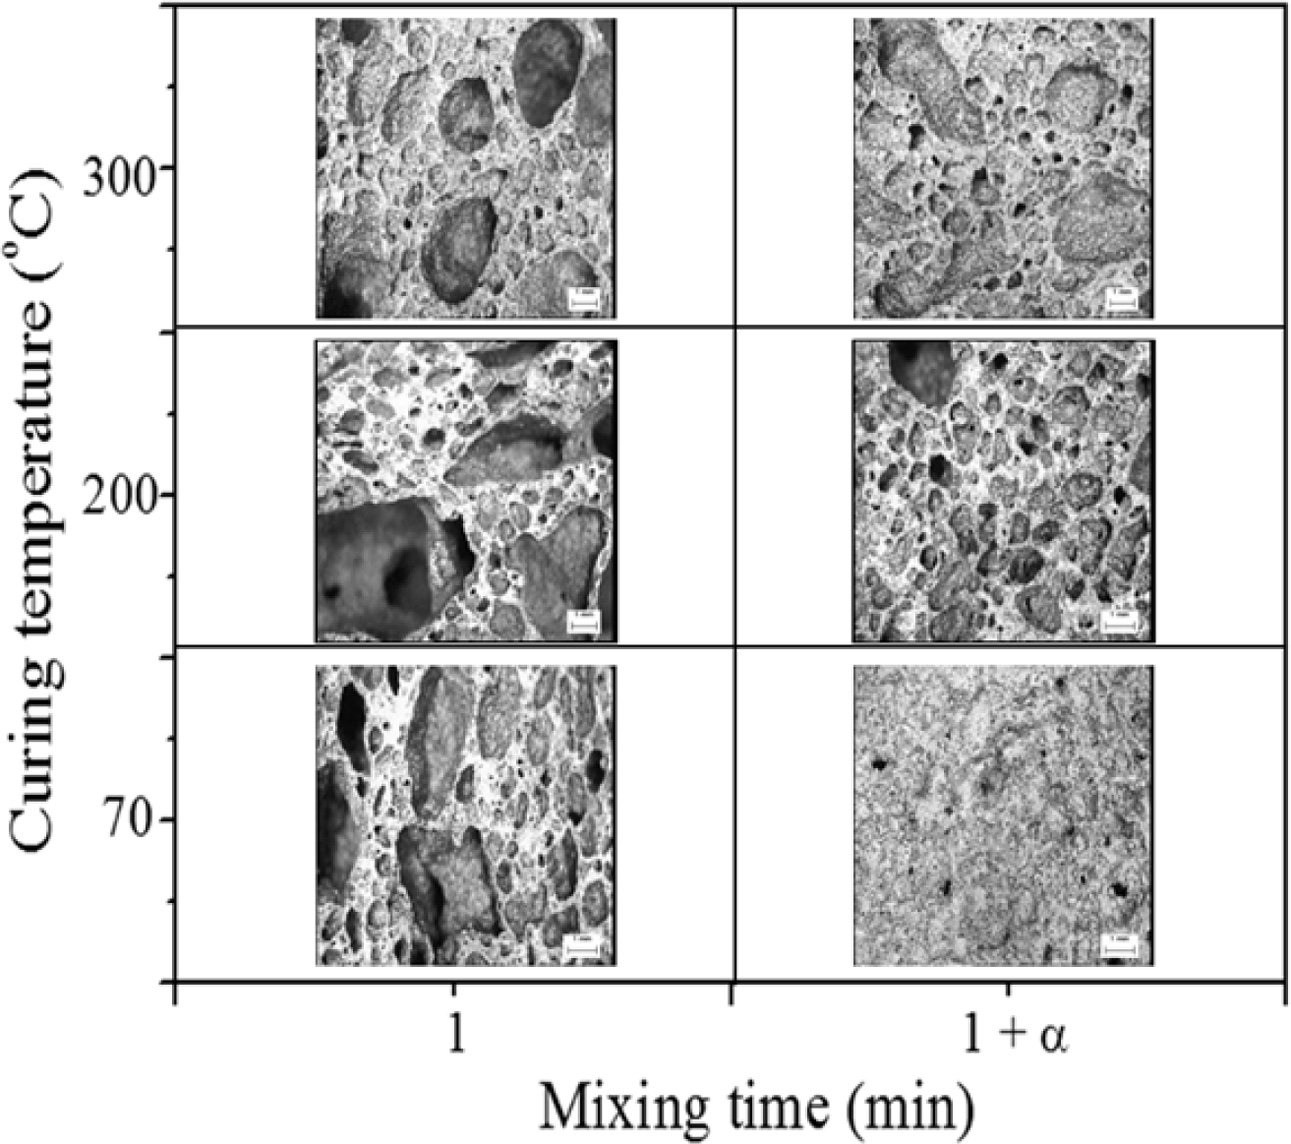
Fig. 10 shows cross-sectional optical micrographs of geopolymers at three different curing temperatures as well as two different mixing times before molding. As shown in Fig. 10, the pore size and distribution of the specimen with 1 min mixing were heterogeneous and random, respectively, at all curing temperatures. The average pore size of the specimens with 1 min mixing were much larger than those with 5 min mixing at all curing temperatures. In particular, the pore size of the specimen cured at 70 oC with 5 min mixing was remarkably reduced; this substantial reduction in pore size by extra mixing would be the main reason for the near-zero collapse rate. Although it is difficult to conclude from the micrographs in Fig. 10 as to why the collapse could be effectively prevented at a higher curing temperature, it is speculated that the collapse could possibly reach near zero both by evaporation of water and acceleration of the geopolymerization reaction under high-temperature curing conditions.
Mixing time
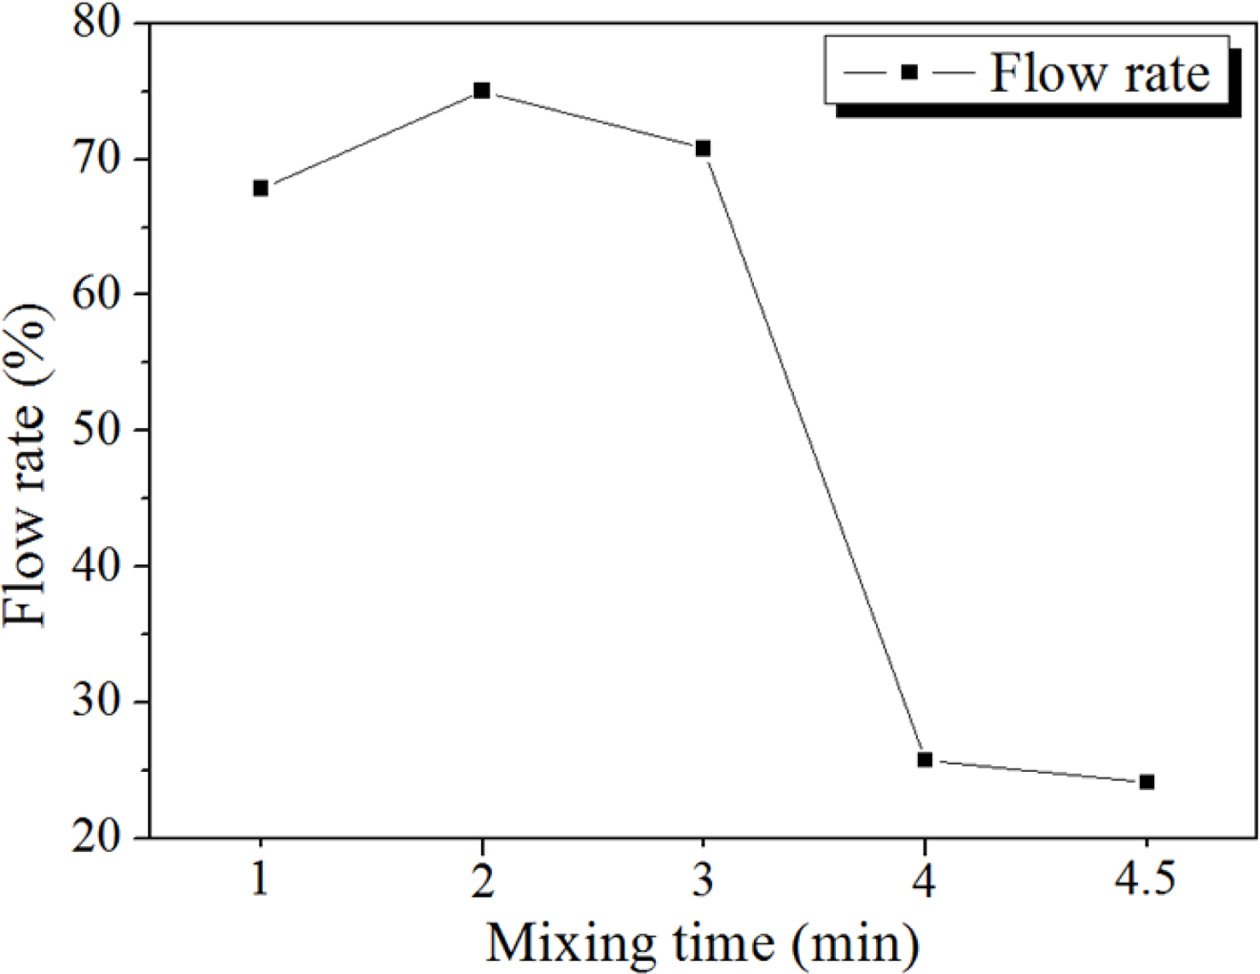
Fig. 11 shows the relationship between the flow rate of slurry and mixing time. The flow rate was calculated by KS F 2140 [13, 16]. The flow rate of the geopolymer slurry, which was manufactured under the conditions of 15 M mixed alkaline activator, 2 wt.% Si, and W/S = 0.2, rapidly decreased after 3 min mixing; then, the flow rate was maintained at approximately a 25% level for 4 min 30 s. The mixing became difficult at flow rates lower than 25%; however, at that level, mixing was still possible. Therefore, it was necessary to determine the maximum or optimum mixing time for each manu- facturing condition.
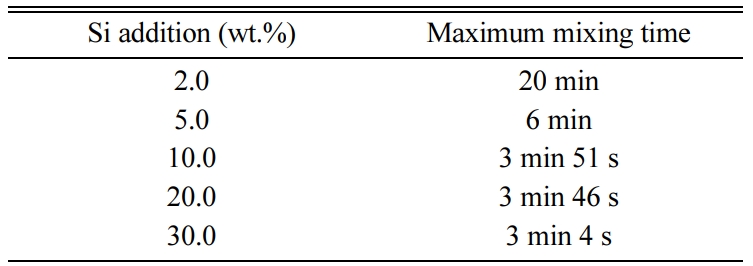
With the Si content varied while keeping the other conditions fixed as 15 M mixed alkaline activator and W/S = 0.2, the maximum mixing time for the geopolymer slurry was measured. Here, the maximum mixing time means that mixing was not possible after the given (measured) time, as shown in Table 2 for each condition, because the slurry solidified and began to breakdown with the extra mixing.
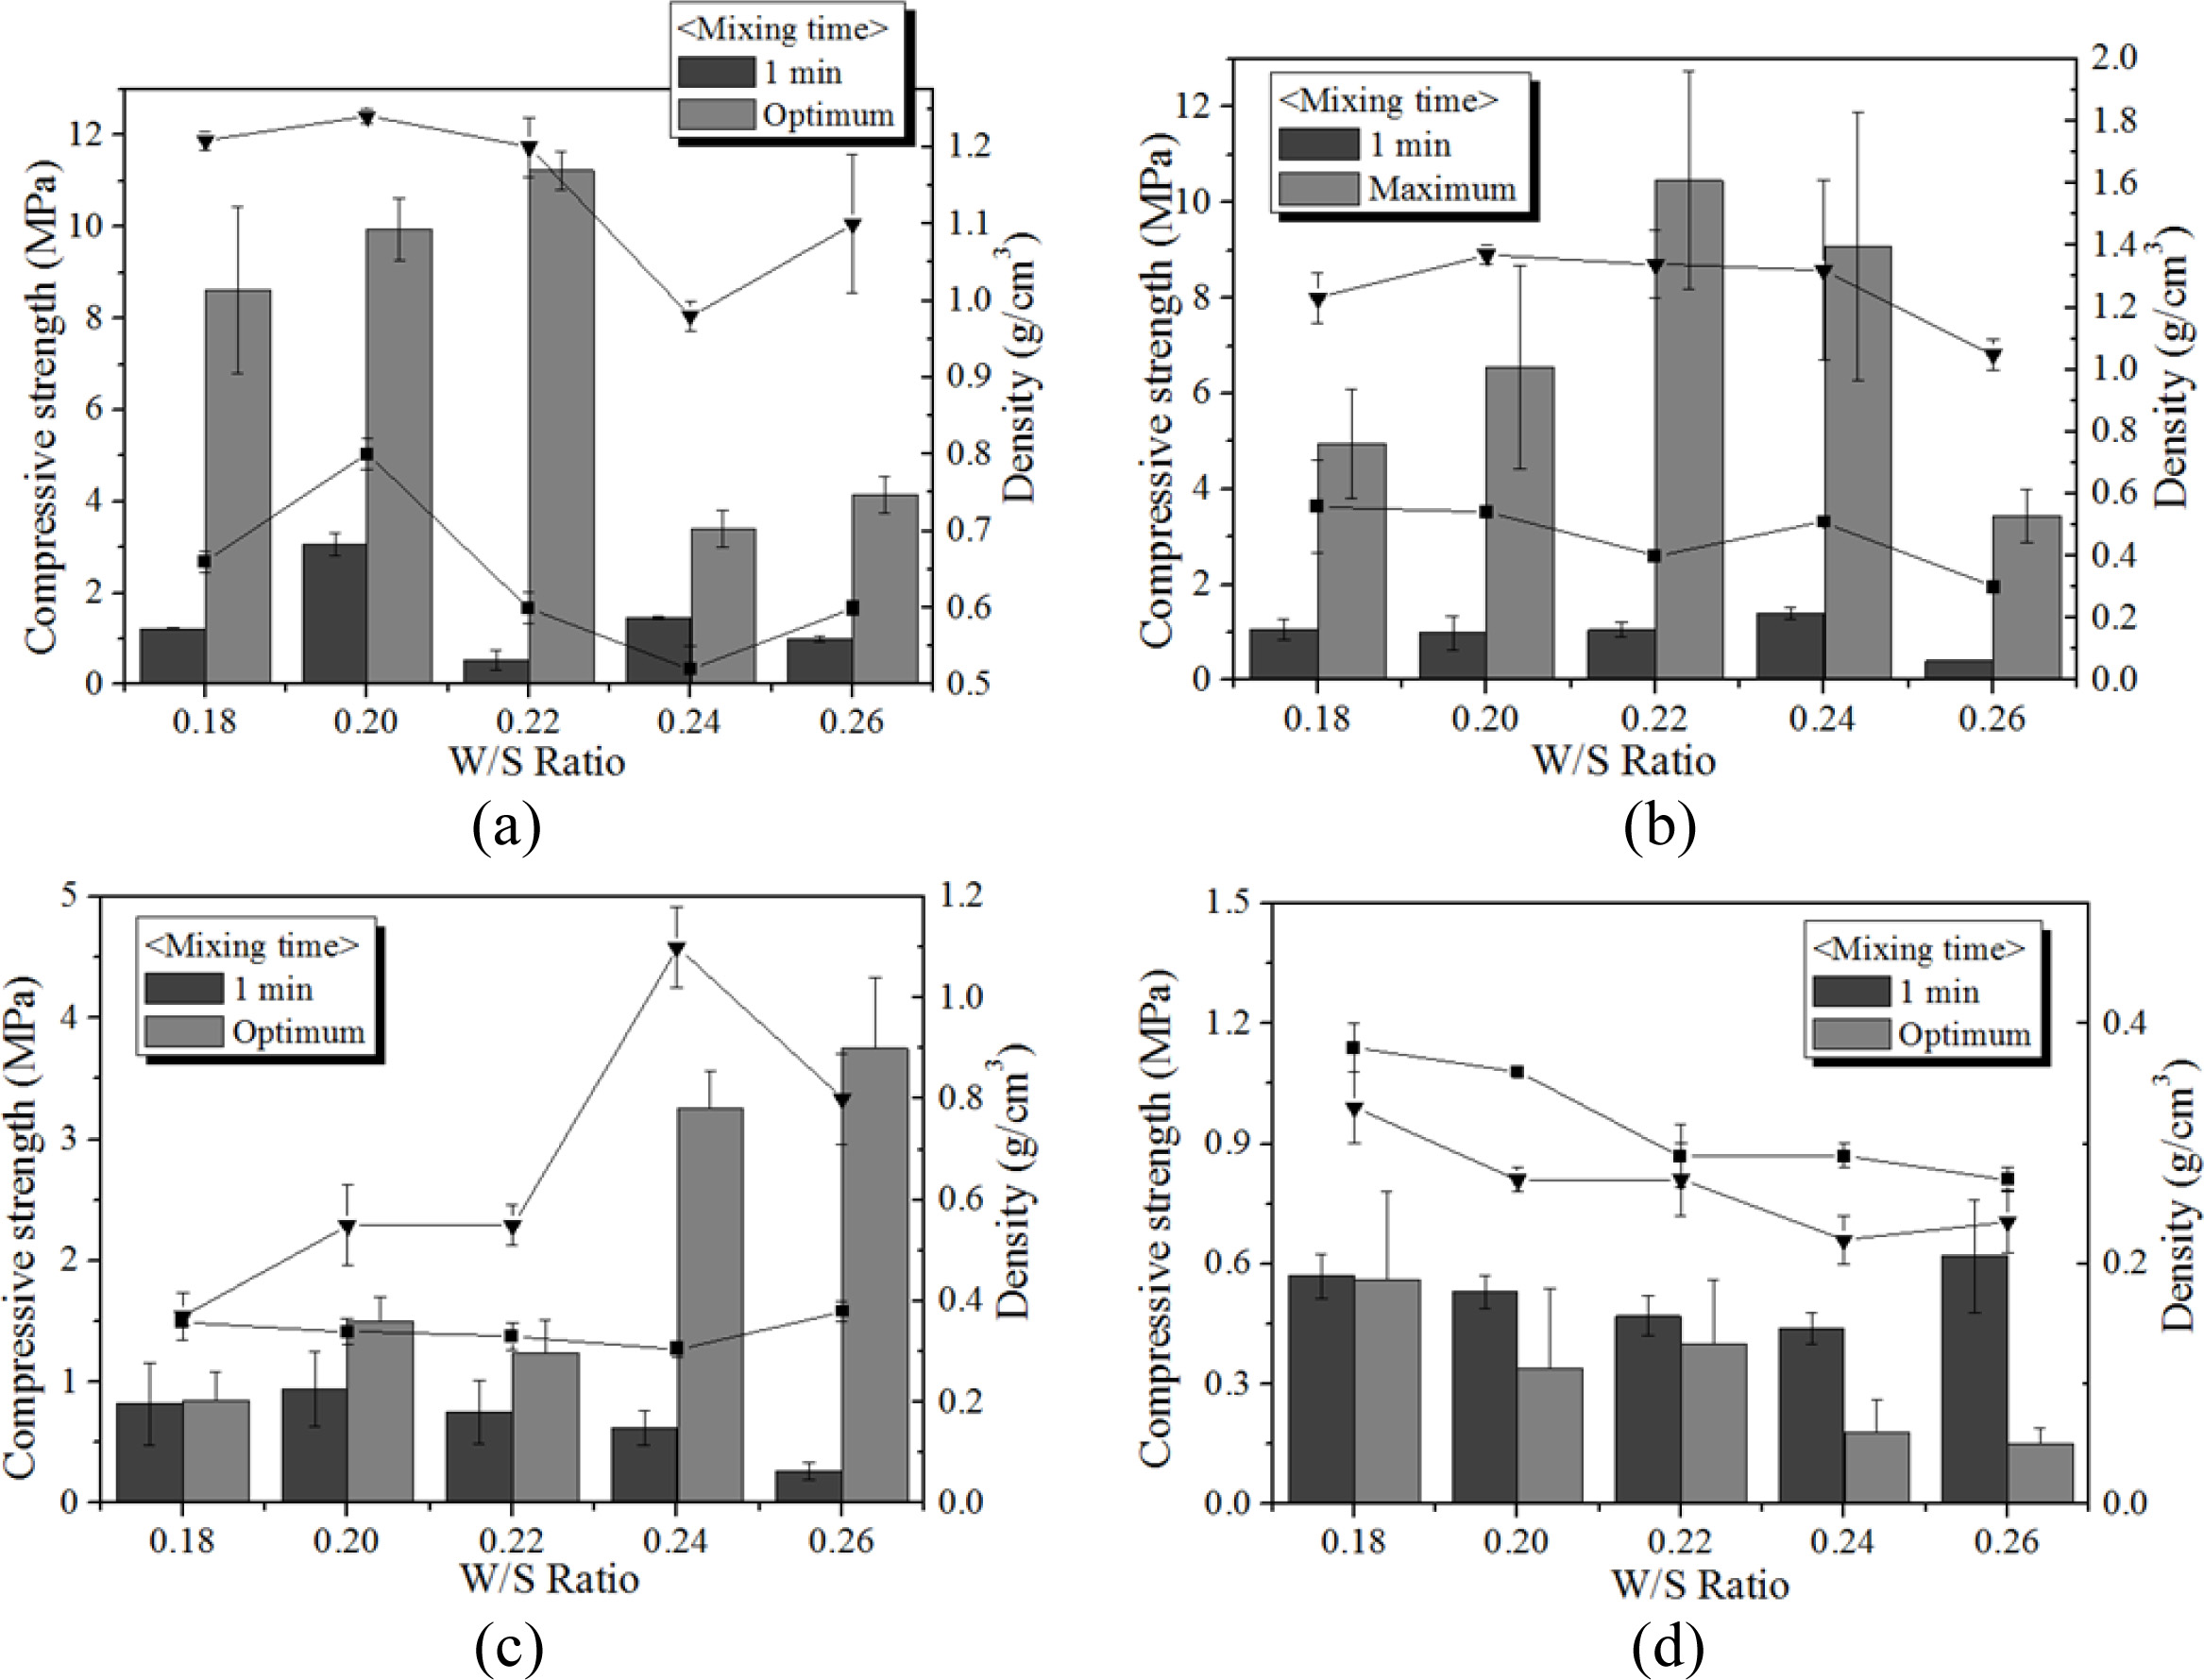
Fig. 12 shows the variation of compressive strength and density with respect to the Si content, W/S ratio, and mixing time. As shown in the figure, both com- pressive strength and density of the specimens with optimum mixing time increased to 5.0 wt.% of Si addition, regardless of W/S ratio and Si content. For a W/S ratio = 0.22 and Si addition of 0.5 wt.%, the compressive strength of the specimen mixed with the optimum mixing time was enhanced by a factor of more than 10 compared with the specimen mixed for only 1 min. It was speculated that the compressive strength and density increased with the extra mixing time because the pore distribution and size in the geopolymer matrix became more homogeneous by optimum mixing. However, neither the compressive strength nor the density increased when the addition of Si exceeded 5.0 wt.%, as too much bloating occurred, and the pore size and distribution in the geopolymer matrix could not be controlled by the extra mixing. When 10.0 wt.% Si was added, a furious bloating phenomenon was observed during the mixing, and the extra heat caused by exothermic reaction with Si addition accelerated the geopolymerization reaction, such that the slurry of geopolymer became a gel and started to solidify during the mixing process. Because the vertical axes of the graphs are not the same scale, the graphs were modified as Fig. 13.
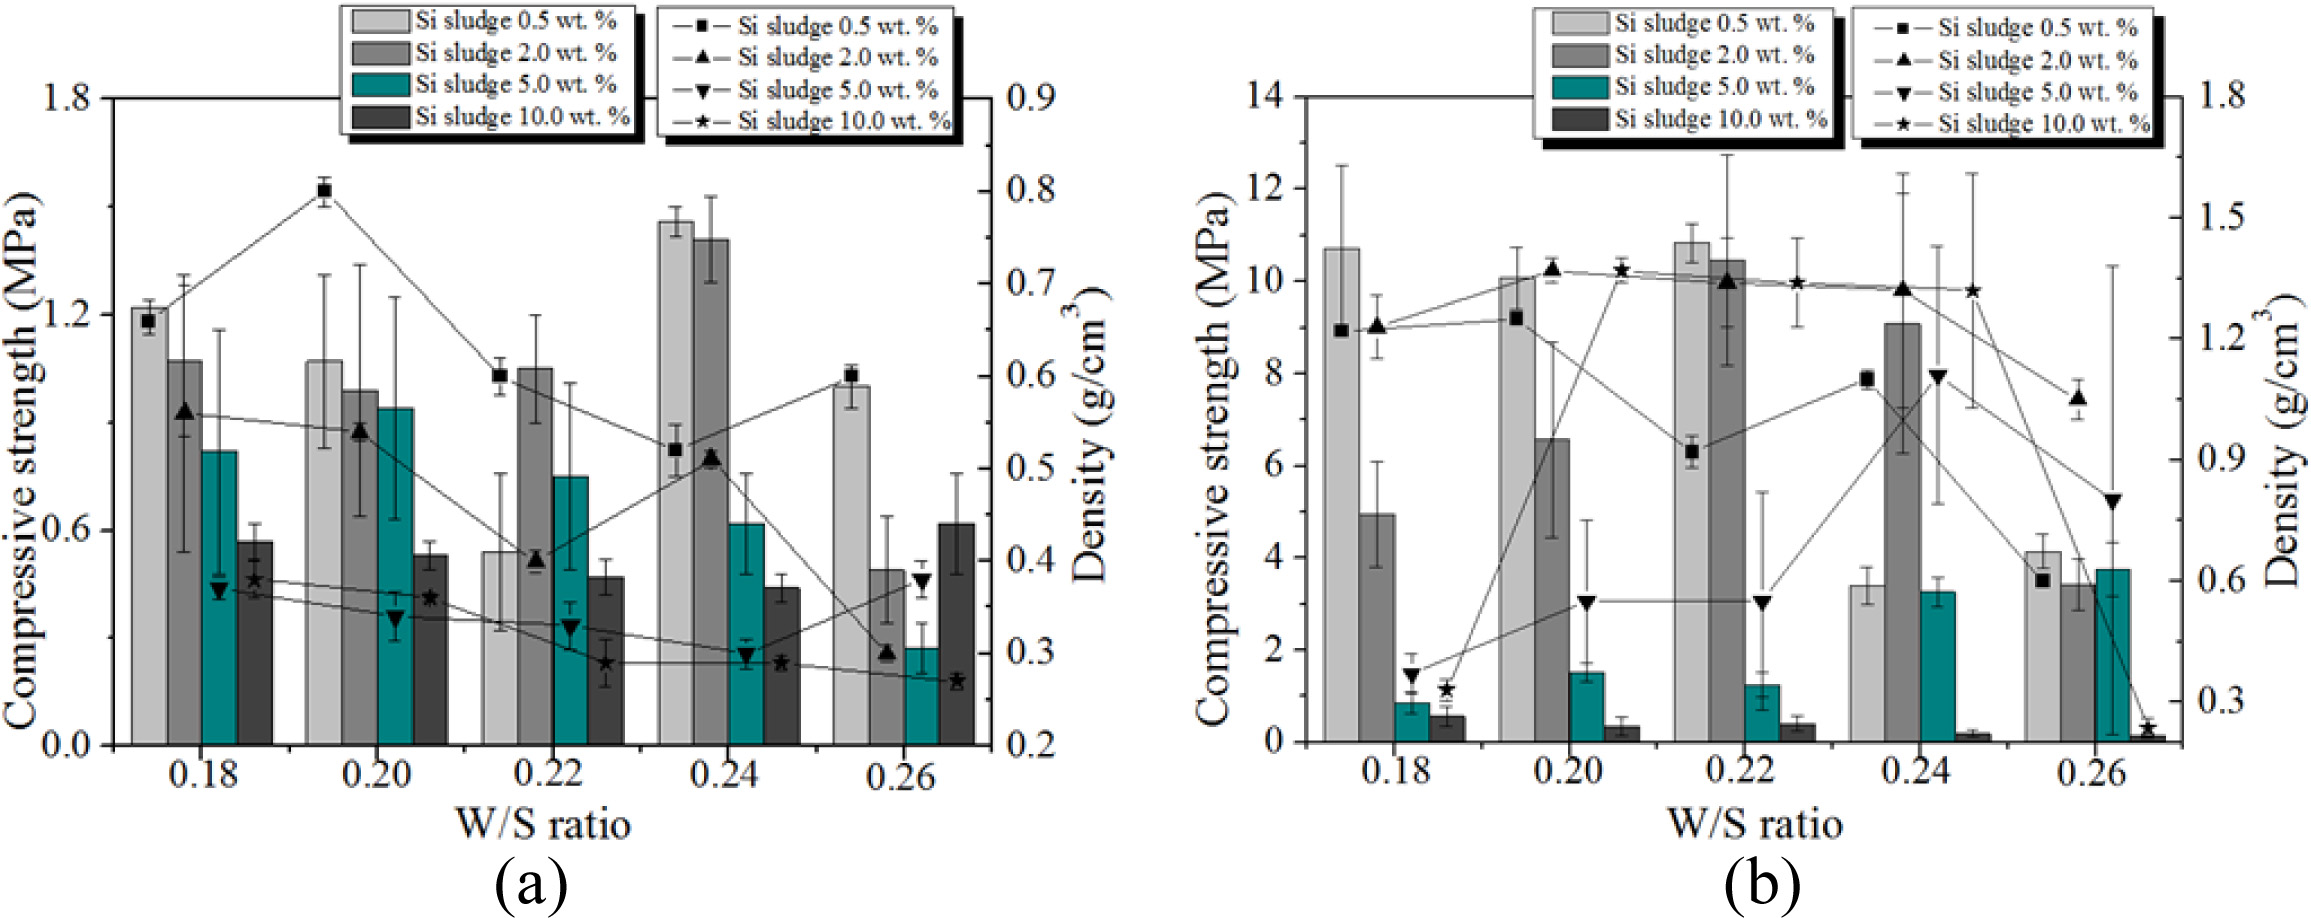
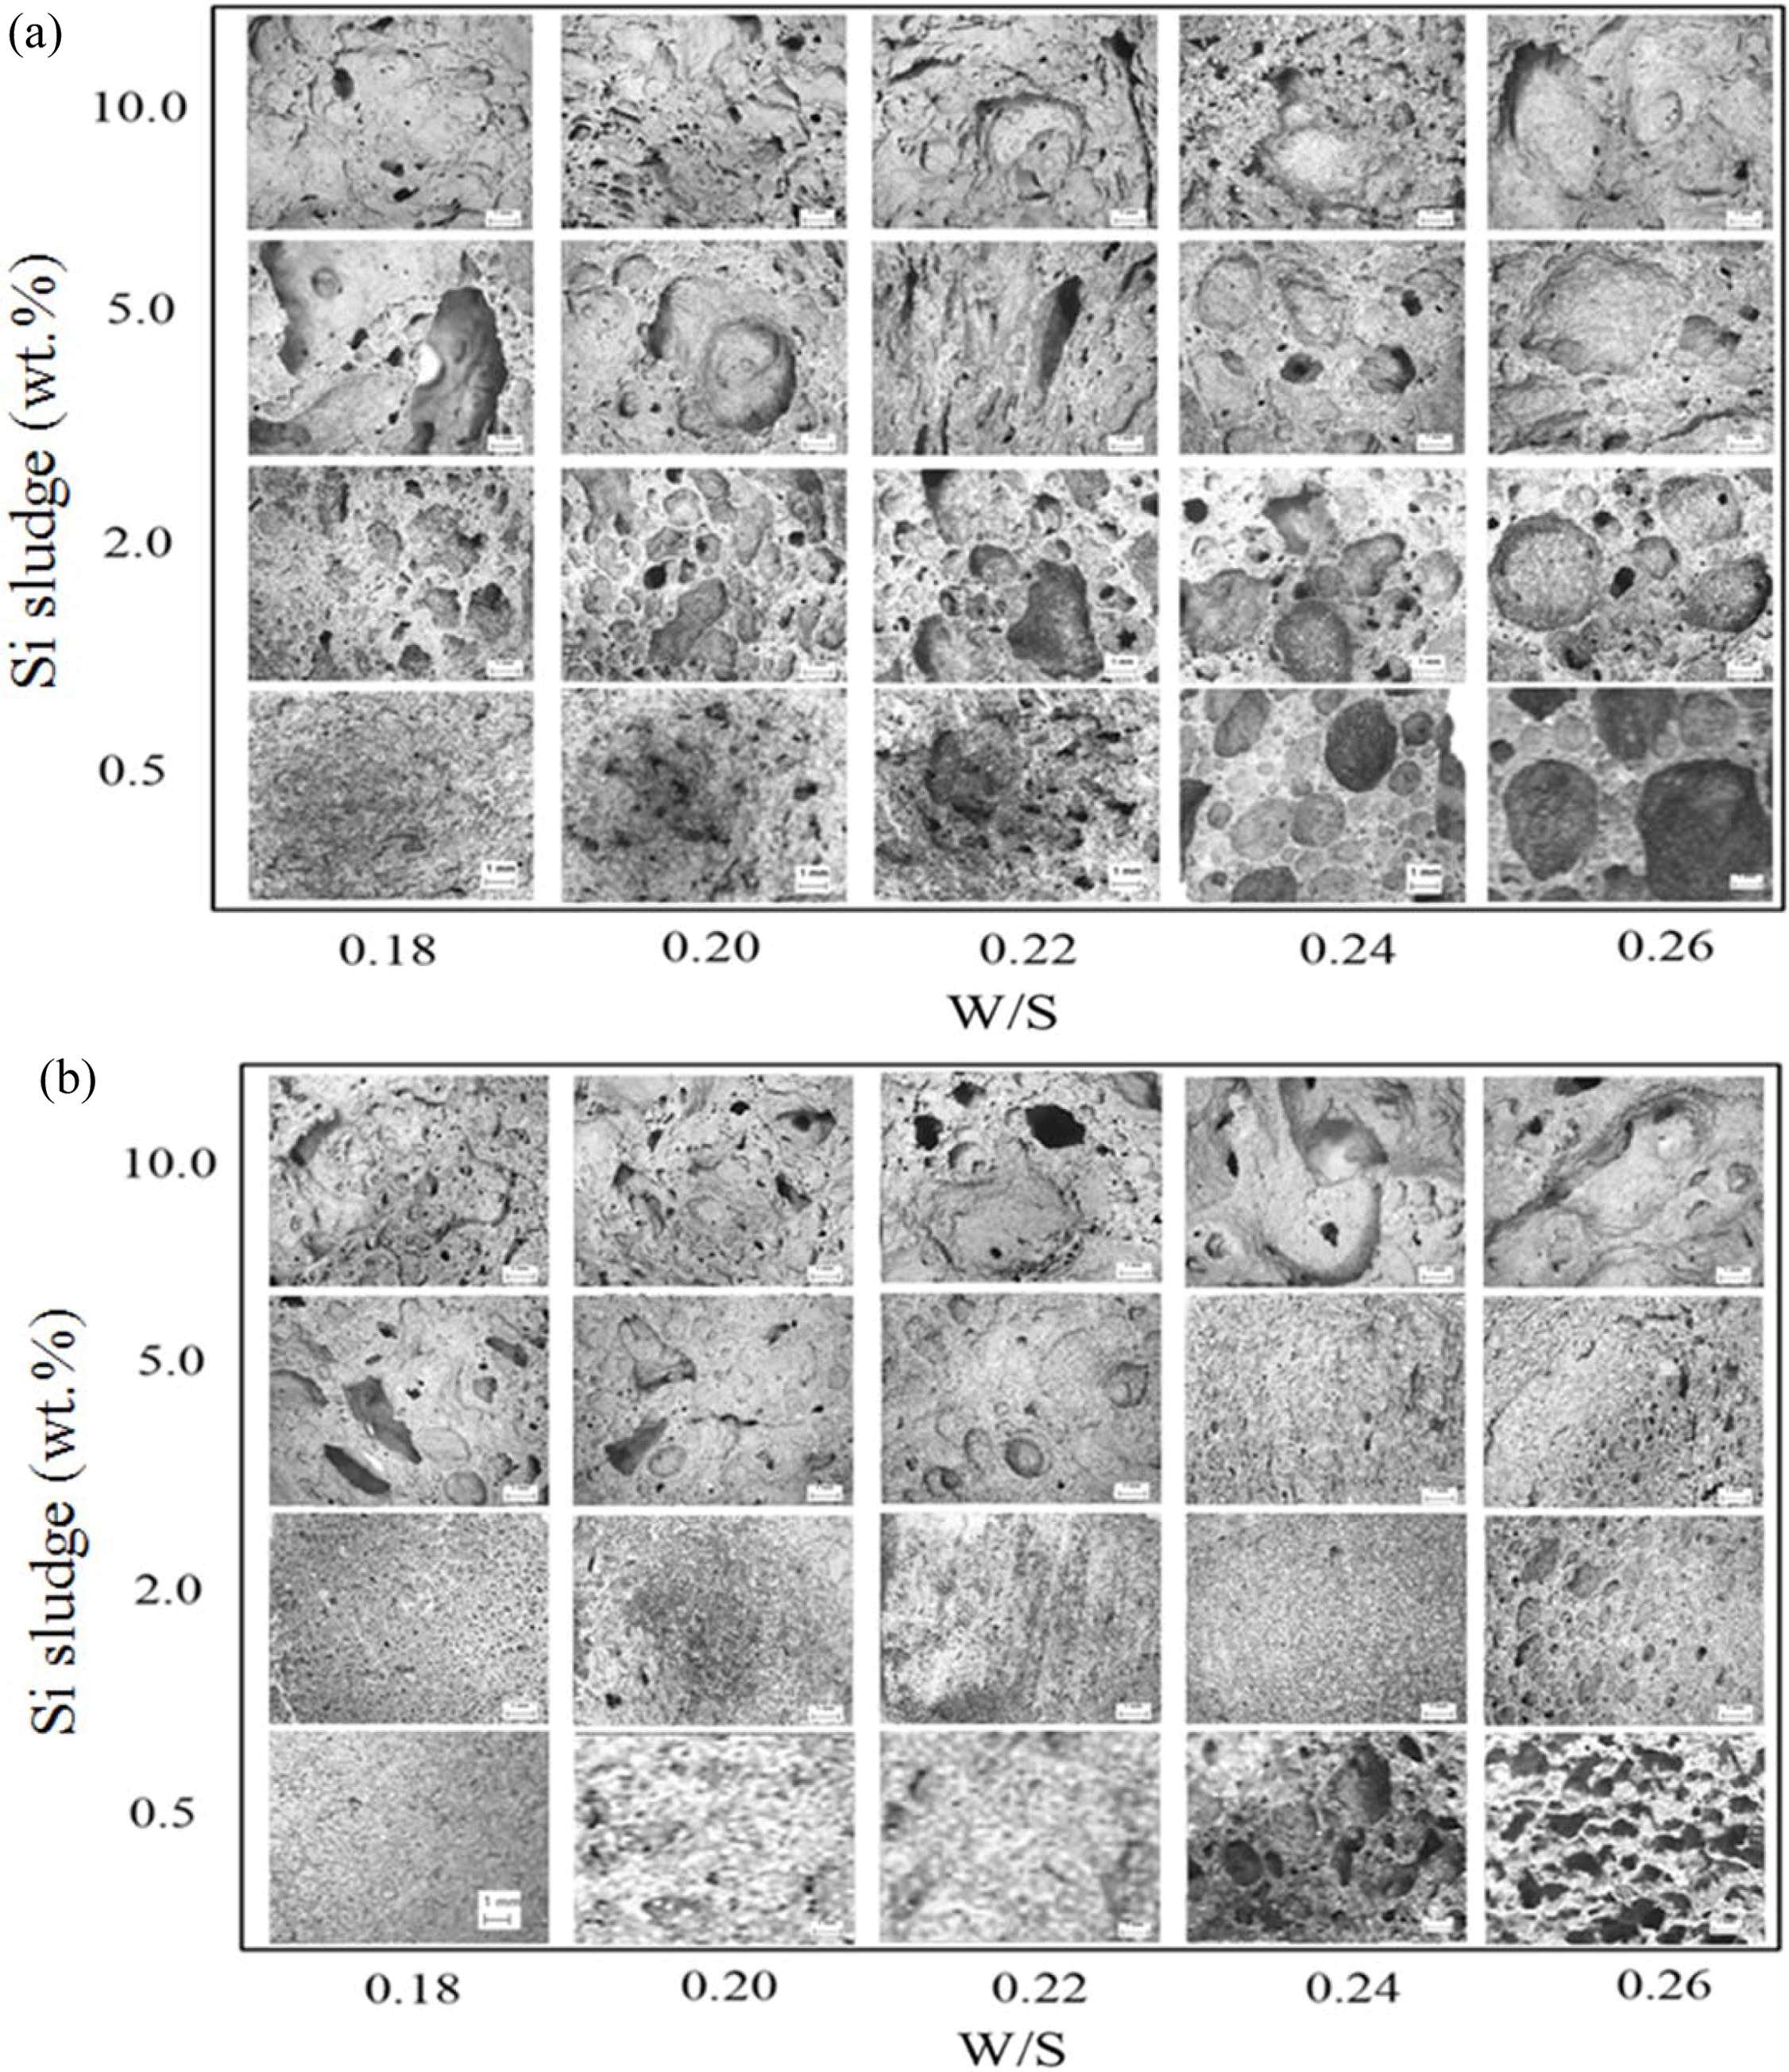
Fig. 13 shows that both the compressive strength and density decreased with an increase in Si addition in general with a few exceptions. Allowing the extra mixing time for optimum mixing significantly enhanced the compressive strength in general, with the compressive strength reaching greater than 10 MPa, and kept the densities lower than 1.4 when less than 2.0 wt.% of Si was added. The pore size and distribution in the geopolymers were observed by optical microscope to explain the above graphs. Fig. 14 shows the optical micrographs of the geopolymers obtained by Camscope.
As shown in Fig. 14, random size and pore distri- butions were observed throughout all the specimens. Large pores were often observed with an increase in both addition and W/S ratio. In contrast, the pore size became small compared with those in the specimen with 1 min mixing, and the pore distributions also became homogeneous, with the exception of the 10.0 wt.% Si addition case.
A substantial increase in the compressive strength in the cases of Si 0.5 wt.% and 2.0 wt.% with W/S ratios 0.22 and 0.24 could be explained by the micrographs in Fig. 14(b), because the pore sizes are small and few, and distributions are homogeneous compared with those in Fig. 14(a). No breakdown phenomenon was found on any of the specimens made under optimum mixing conditions during the bloating process.
|
Fig. 3 Flow test of geopolymer slurry. (a) Paste diameter of the geopolymer slurry according to the addition of Si sludge and (b) instrument for the flow test. |
|
Fig. 4 Geopolymer collapse rate of geopolymers with 2 wt.% Si addition according to the concentration of the alkaline activator. |
|
Fig. 5 Photographs of the geopolymer specimens after curing at
different temperatures and the relationship between curing
temperature and collapse rate. (a) Photographs of the geopolymers
after curing at three curing temperatures (70, 120, and 150 oC). (b)
Schematic diagram of mold for the specimens shown in the left
figure. This diagram is given for a comparison of the original size
of the specimen before collapse and that after collapse as the
specimens shown in left. (c) Collapse rate vs. curing temperatures. |
|
Fig. 6 Methods of firing on the geopolymer specimens charged into the mold right after the mixing process. (a) Direct firing on the surface of geopolymer and (b) indirect firing on the bottom wall of the mold. |
|
Fig. 7 Temperature profiles of the specimens fired with direct firing (upper line) and indirect firing (lower line). A thermocouple was embedded into the specimen paste during the firing. |
|
Fig. 8 . Collapse rate of the specimens heated by torch by direct and indirect methods. The specimens expanded by 60% instead of collapsing in the case of direct torch heating, whereas, they collapsed by 60% in the case of indirect torch heating. The conditions of the specimens were as follows: 15 M mixed alkaline activator, 2.0 wt.% Si, and W/S = 2.0. |
|
Fig. 9 Collapse rate vs. curing temperature under different mixing times. (a) Relationship of collapse rate according to the curing temperature and mixing time. The conditions of the specimens were as follows: 15 M mixed alkaline activator, 2.0 wt.% Si, and W/S = 2.0. Specimens were placed directly into the furnace, which was preheated at each target temperature and then kept for an hour in the furnace. (b) Photographs of demolded specimens after 70 oC curing for 24 h with 1 min mixing (left) and 5 min mixing (right) before molding. |
|
Fig. 10 Cross-sectional optical micrographs of geopolymers at different curing temperatures with different mixing times. |
|
Fig. 11 Flow rate of slurry depending on mixing time. Specimen conditions are as follows: 15 M mixed alkaline activator, 2 wt.% Si, W/S ratio = 0.2. |
|
Fig. 12 Compressive strength and density of geopolymers according to the W/S ratio from 0.18 to 0.26 and mixing time (1 min and maximum mixing). The manufacturing conditions are as follows: 15 M mixed alkaline activator, 70 oC oven-curing for 24 h and air-curing at room temperature for 7 d. (a) Si 0.5 wt.%, (b) Si 2.0 wt.%, (c) Si 5.0 wt.%, and (d) Si 10.0 wt.%. |
|
Fig. 13 Compressive strength and density variation with respect to the W/S ratio and Si addition. (a) 1 min mixing and (b) optimum mixing. |
|
Fig. 14 Optical micrographs of geopolymer matrix according to Si addition and W/S ratio. (a) 1 min mixing and (b) optimum mixing. |
|
Table 2 The maximum mixing time according to the Si addition while fixing other conditions as 15 M mixed alkaline activator and W/S = 0.2. |
Many efforts have been attempted to prevent the breakdown of geopolymers during the bloating process. The heating method was a little effective but not sufficient and has a limitation. The breakdown phenomenon completely disappeared with extra mixing; moreover, the compressive strength was substantially increased by maintaining the density as low as 1.4 or less. Therefore, optimum mixing is the best way to prevent the breakdown phenomenon during the bloating of geopolymers.
This work was supported by a Kyonggi University Research Grant 2019
- 1. Tayor and F. Winslow, in “A treatiese on concrete, plain and reinforced; materials, construction, and design of concrete and reinforced concrete” (Nabu Press, 2013) p.1.
- 2. J. Davidovits, in “Geopolymer chemistry and applications” (Geopolymer Institute, 2008) p. 1.
- 3. K.T. Koh, G.S. Ryu, and J.H. Lee, Kor. Rec. Cons. Res. Inst. 6[4] (2012) 119-126.
- 4. Y. Kim and T. Chae, J. Ceram. Proc. Res. 19[5] (2018) 378-382.
- 5. Y.Y. Kim, H. Song, J.K. Lee, and Y.S. Chu, J. Arch. Inst. Kor. Stru. Const. 13[8] 107-111.
- 6. Y.K. Cho, G.D. Moon, J.M. La, and S.H. Jung, J. Kor. Conc. Inst. 26[4] (2014) 449-456.
-

- 7. Y. Kim, S. Kim, and C. Jang, J. Ceram. Proc. Res. 17[11] (2016) 1202-1207.
- 8. H.D. Jang, D.S. Kil, H.K. Chang, Y.J. Cho, and B.G. Cho, J. Kor. Inst. Res. Rec. 21[4] 60-68.
-

- 9. Y. Kim, and M. Kim, J. Ceram. Proc. Res. 20[5] (2019) 522-529.
- 10. Y. Kim, S. Kim, and T. Chae, J. Ceram. Proc. Res. 18[3] (2017) 214-219.
- 11. S.J. Lee, E.M. An, and Y.H. Cho, J. Rec. Const. Res. 4[4] (2016) 363-370.
- 12. X. Xue, Y.L. Liu, J.G. Dai, C.S. Poon, W.D. Zhang, and P. Zhang, Cem. Con. Comp. 94 (2018) 43-52.
-

- 13. Korean Standards, No. KS F 2140.
- 14. J. Cao and D.D.L. Chung, Cem. Con. Res. 31[11] (2001) 1633-1637.
-

- 15. C.K.Y. Leung and V.C. Li, J. Mech. Phys. Solids. 40[6] (1992) 1333-1362.
-

- 16. S. Zhandarov and E. Mäder, Comp. Sci. Tech. 65[1] (2005) 149-160.
-

 This Article
-
2021; 22(1): 39-47
Published on Feb 28, 2021
- 10.36410/jcpr.2021.22.1.39
- Received on May 27, 2020
- Revised on Aug 7, 2020
- Accepted on Aug 23, 2020
 Services
- Abstract
introduction
experimental procedures
results
conclusions
- Acknowledgements
- References
- Full Text PDF
Shared
 Correspondence to
- Yootaek Kim
-
Department of Materials Engineering, Kyonggi University, Suwon 16227, Republic of Korea
Tel : +82-70-4024-9765 Fax: +82-31-249-9774 - E-mail: ytkim@kgu.ac.kr


 Copyright 2019 International Orgranization for Ceramic Processing. All rights reserved.