- Preparation and luminescent properties of Tb3+/Sm3+ co-doped phosphate glasses for display device applications
Qian Zhanga,b, Lei Hanb, Weizhen Liub, Weixiong Youb, Anxian Lua,* and Zhiwei Luoa
aSchool of Materials Science and Engineering, Central South University, Changsha 410083, China
bFaculty of Materials Metallurgy and Chemistry, Jiangxi University of Science and Technology, Ganzhou 341000, ChinaThis article is an open access article distributed under the terms of the Creative Commons Attribution Non-Commercial License (http://creativecommons.org/licenses/by-nc/4.0) which permits unrestricted non-commercial use, distribution, and reproduction in any medium, provided the original work is properly cited.
Development of orange light emitting materials cannot be ignored. In this paper, a novel Tb3+/Sm3+ co-doped P2O5-SrO-BaO-ZnO-glasses have been prepared. The prepared glasses consisted predominantly of Q2 units, and a small amount of Q0 and Q1 units. For absorption spectra of glasses, eight obvious absorption bands were found. Under the excitation of 402 nm and 374 nm xenon lamp, the emission spectra and fluorescence lifetimes of glasses showed big difference. Under the excitation of 374 nm xenon lamp, there was significant energy transfer process between Sm3+ and Tb3+ ions in glasses. The fluorescence decay curves conformed to a double-exponential decay function, the average fluorescence lifetimes of glasses G02 ~ G10 were 2.38 ms, 2.67 ms, 1.96 ms, 1.81 ms, and 1.61 ms with the increasing of Sm2O3 content, and the glasses emitted a distinct orange light. The distinctive properties indicate that this system glass has potential applications in display devices
Keywords: Phosphate glasses, Tb3+/Sm3+ co-doped, Orange light, Luminescence
Rare-earth (RE) luminescent materials are one of the core materials of current lighting, display and information detection devices, and are also indispensable materials for the development of new generation lighting and display technologies in the future [1]. Due to its excellent luminescence properties, RE ions-doped luminescent materials have a wide range of potential applications in white LEDs, display devices, solar cells, lasers and optical temperature sensors [2-5], and have attracted widespread attention from researchers around the world. Compared with other luminescent materials, luminescent glass has many excellent properties, such as transparency, uniformity, low cost, easy processing, as well as it is also an excellent RE ion matrix material [6]. Therefore, the research on RE doped luminescent glass has important scientific significance and application value.
In the past few decades, many RE doped luminescent materials have been studied, such as Eu3+ [7], Er3+ [8], Sm3+ [9], Tb3+ [10], Dy3+ [11] doped glasses, etc. Among various RE ions doped matrix materials, Tb3+/Sm3+ co-doped glass can be used as a good activator due to its unique spectral characteristics, rich emission intensity, and energy transfer from Tb3+ to Sm3+. At present, research on RE ions doped luminescent glass materials has mainly focused on oxyfluoride, sulfide, silicate, and aluminum borosilicate matrix systems. However, the research on RE ions doped phosphate luminescent glass is still scarce. It is well known that the luminescence characteristics of RE ions in glass depend on the chemical compositions, structure and properties of the host glass. Among them, phosphate glass is considered to be a good matrix material doped with RE ions, because of its good optical properties, moderate phonon energy, lower melting temperature, low refractive index, dispersion, as well as high doping concentrations, etc. Unfortunately, the stability of pure phosphate glasses is poor, which limits their practical application. Therefore, it is an effective method to add some other oxides to pure phosphate glass for improving the structural stability of glass. It has been reported that adding ZnO to pure phosphate glass can improve the stability of the glass [12, 13]. Zn2+ ions act as a network former in phosphate glass, so it can form either [ZnO4] tetrahedron or P-O-Zn through ionic cross-linking, thereby integrating the glass network and improving its chemical stability. In addition, adding SrO to phosphate glass can form a metaphosphate structure, which is beneficial to improve the structural stability of glass [14]. In view of this, this work will consider the incorporation of ZnO, SrO, and BaO into pure phosphate glass to improve the thermal stability and increase the application range of glass.
In this paper, Tb3+/Sm3+ co-doped P2O5-ZnO-SrO-BaO luminescent glasses were prepared. The influence of chemical composition and structure on the luminescence properties of the glass (emission intensity, fluorescence lifetimes, chromaticity coordinates and correlate color temperature, etc.) was studied, and the transition and luminescence mechanisms of the excitation energy levels of RE doped glasses were explored.
Materials preparation
The strontium carbonate (SrCO3 ≥ 99.0%), barium carbonate (BaCO3 ≥ 99.0%), zinc oxide (ZnO ≥ 99.0%), and diammonium phosphate ((NH4)2HPO4 ≥ 99.0%) were purchased from Xilong Chemical Co. Ltd., China. The antimony trioxide (Sb2O3) was purchased from Sinopharm Chemical Reagent Co. Ltd., China. The tetraterbium heptaoxide (Tb4O7 ≥ 99.99%) and samarium oxide (Sm2O3≥ 99.99%) were purchased from Ganzhou Jinyi New materials Co. Ltd., China. All chemicals were used without further purification.
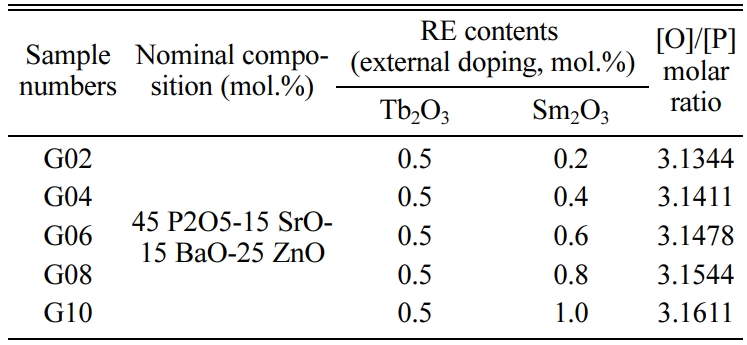
The Tb3+/Sm3+ co-doped phosphate glasses were prepared by the melt-quenching method, and the molar compositions of glasses with different Tb3+/Sm3+ are given in Table 1. The raw materials were thoroughly mixed and then filled in the platinum crucible. Sub- sequently, the platinum crucible containing the mixture was heated at 1,300 ºC for 2 h in a furnace. Then, the melts were poured onto a preheated stainless-steel plate and later annealed at 400 ºC for 10 h in another furnace to release internal stress.
Characterization
Amorphous nature of glasses was identified by X-ray diffraction(XRD, MiniFlex 600, Rigaku, Japan) using Cu Kα radiation at a scanning velocity of 10o/min between diffraction angles (2θ) from 10 to 80o for all powder samples. The IR spectra of glasses were measured by using Fourier transform infrared spectrophotometer (FTIR, Nicolet 6700, USA) at room temperature with the wavenumber range of 400-4,000 cm-1. The absorp- tion spectra of glasses were measured with the UV spectrophotometer (SP-756P, Shanghai). The densities of glasses were tested by the Archimedes method using distilled water as the medium. The emission spectra and fluorescence decay curves of glasses were measured by spectrofluorometer (FLS 1000, Edingburgh Instruments, UK) pumped by 450 W xenon lamp at room temperature. The chromaticity coordinates (x, y) of glasses were calculated based on emission spectra by using software CIE1931.
Glass characterization
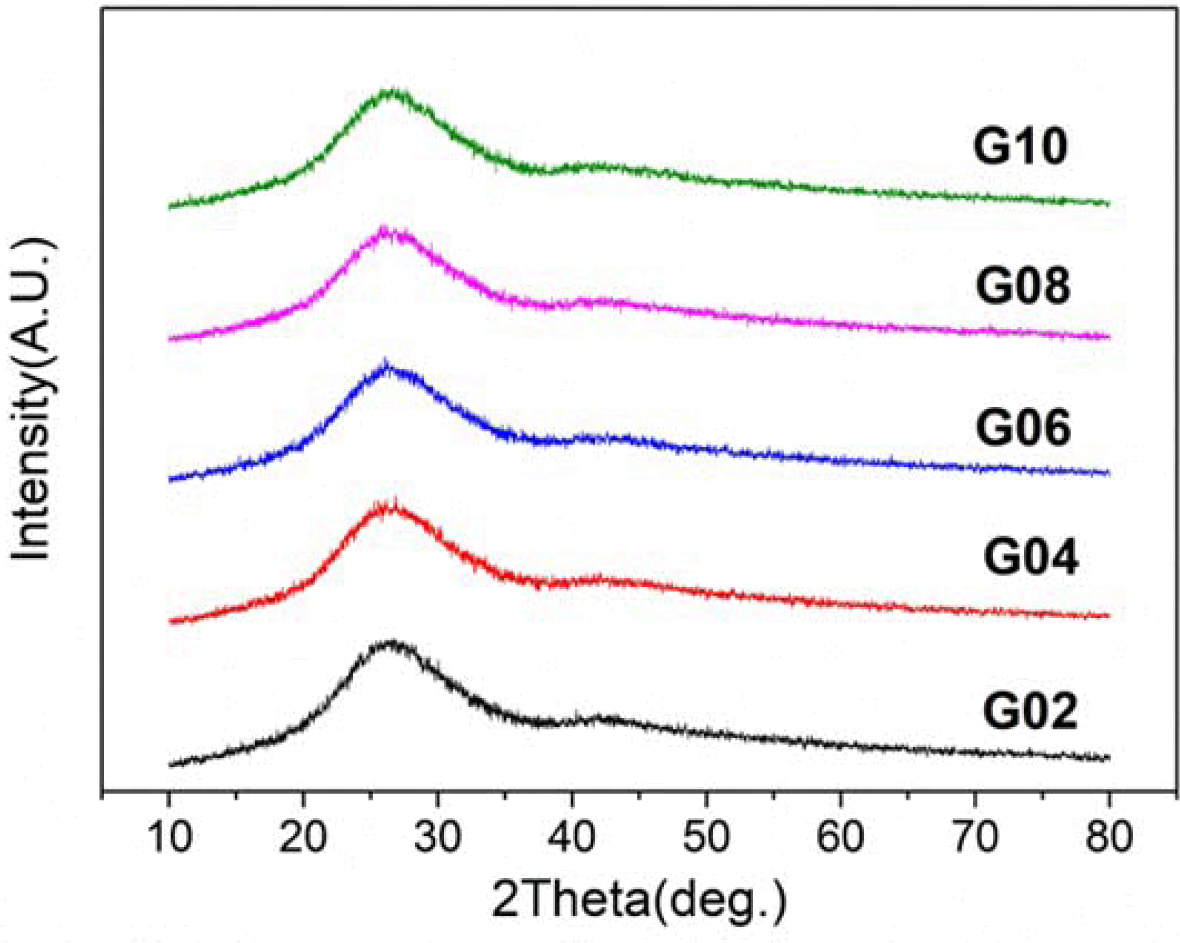
Fig. 1 shows the typical XRD patterns of the Tb3+/Sm3+ co-doped phosphate glasses G02 ~ G10. There was no characteristic peak that corresponded to any crystalline phase, implying that the obtained samples are all amorphous state.
FTIR spectra analysis
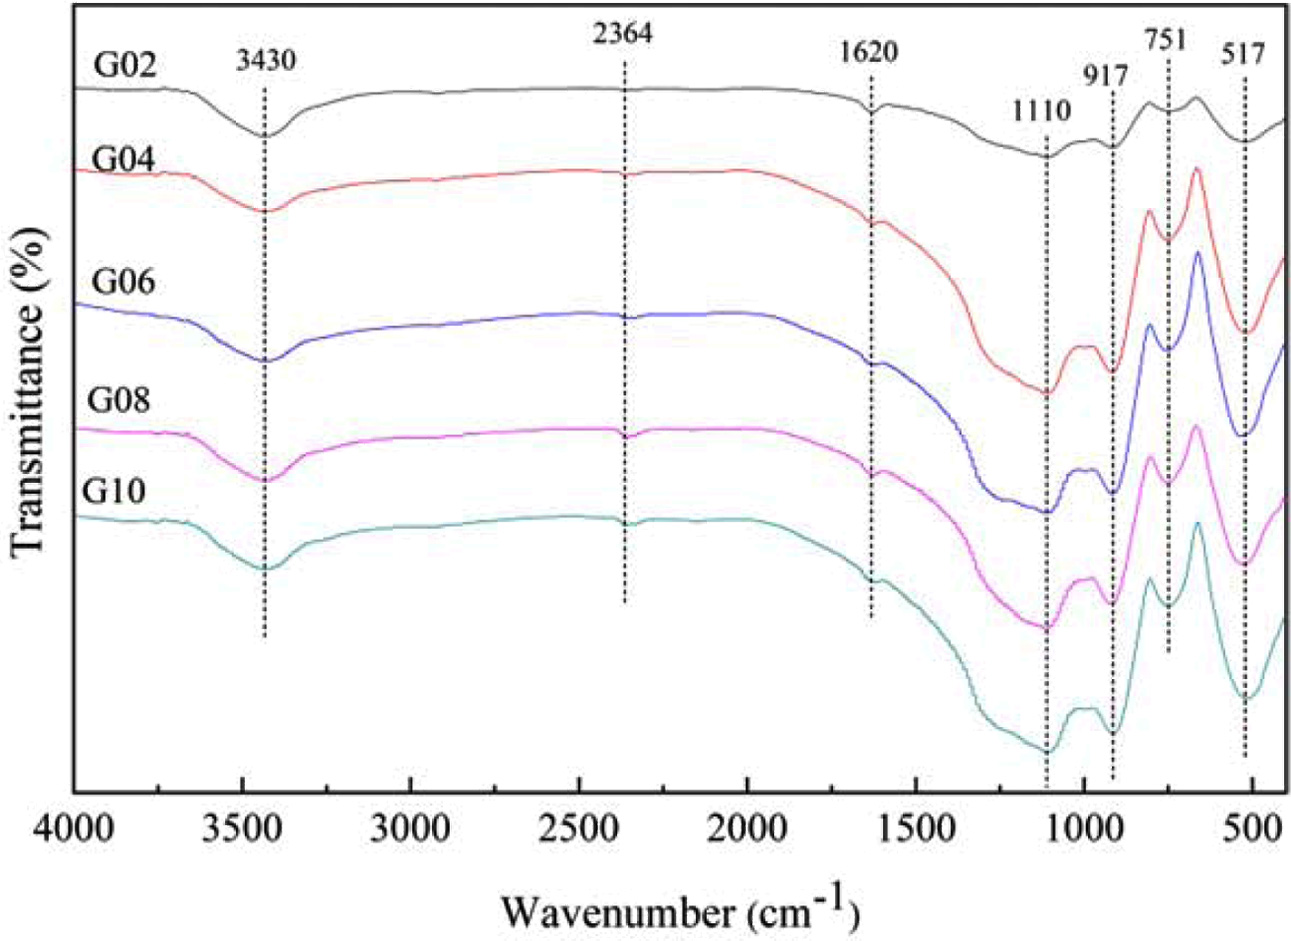
The IR spectra of glasses were investigated for identifying the variation of chemical bonds. As shown in Fig. 2, seven characteristic absorption bands around 517 cm-1, 751 cm-1, 917 cm-1, 1,110 cm-1, 1,620 cm-1, 2,364 cm-1 and 3,425 cm-1 were found in IR spectra of glasses G02 ~ G10 in the wavenumber range of 400-4,000 cm-1.
As shown in Fig. 2, the characteristic bands around 517 cm-1 were attributed to the bending vibration of O=P–O bands in Q0 units [15]. The absorption bands at ~ 751 cm-1 were ascribed to the symmetric stretching vibration of P–O–P bonds in Q2 units [14]. The bands located at ~ 917 cm-1 may be caused by the asymmetric stretching vibration of P–O–P bonds in Q2 units [16], while the absorption bands near 1110 cm-1 may be caused by the asymmetric stretching modes of (PO3)2- groups associated with Q1 phosphate units [17]. The absorption bands near 1,620 cm-1 were ascribed to the bending vibrations of O–H bonds or stretching vibrations of P–O–H groups [18], as well as the characteristic bands around 2,364 cm-1 and 3,430 cm-1 may be assigned to the stretching vibration of O–H groups [19] and the symmetric stretching of the O–H bonds [20], respectively. This may be caused by the incorporation of water molecules during the sample preparation. Besides, the detailed vibration types of different wavenumbers in IR spectra are listed in Table 2.
Considering the measurement errors, the wavenumber of the absorption bands in IR spectra did not have significant changes although the Sm2O3 content increased. However, the intensity of absorption peak at ~ 517, 751, 917 cm-1 increased with the increasing of Sm2O3 content, which indicates that the contents of Q0 and Q2 units increased to some extent.
In order to identify the distribution of phosphate groups in the phosphate glass, the O/P molar ratio have been used by many investigator [12]. In this paper, the O/P ratio increased from 3.1344 to 3.1611, which is in the range of 3.0 ~ 3.5. According to the Ref. [12], for 2.5 ≤ O/P < 3, O/P = 3.0, 3 < O/P < 3.5, O/P = 3.5 and 3.5 < O/P < 4.0, glass structure is mainly composed of ultraphosphate groups (Q3), metaphosphate groups (Q2), polyphosphate units (Q2, Q1), pyrophosphate groups (Q1) and orthophosphate units (Q0), respectively. Consequently, this phosphate glass theoretically consists predominantly of polyphosphate units. However, it can be seen from Fig. 2 that the orthophosphate units (Q0) were presented in the glass network, which is mainly due to the disproportionation reaction between the groups [21]:

In view of this, it can be concluded that this glass consists predominantly of Q2 units, along with minor Q1 and Q0 units. With the increasing of Sm2O3 content, the content of Q1 structural units increases, while the Q2 structural units decreases. Besides, the bond length and bond angle of P-O-P in glass structure also change.
3.3 Physical properties
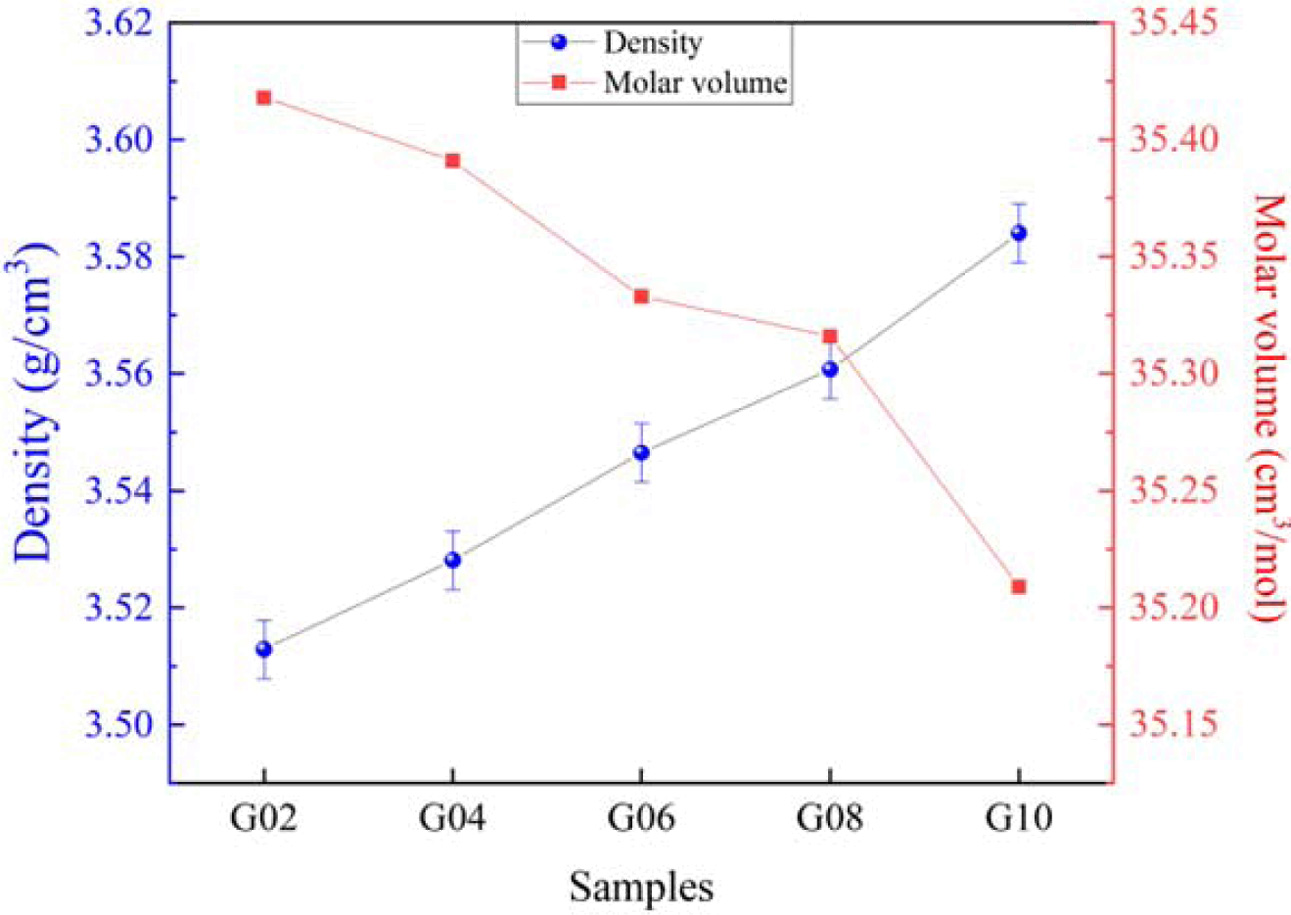
The interdependence in density (ρ) and molar volume (Vm) with Sm2O3 content is shown in Fig. 3. For the densities of glasses G02 ~ G10, they were 3.513 g/cm3, 3.528 g/cm3, 3.547 g/cm3, 3.561 g/cm3 and 3.584 g/cm3, respectively. It can be seen that density monotonically increased with the increasing of Sm2O3 content, which may be due to the molecular mass of Sm2O3 is greater. In addition, a monotonic decrease in the molar volume can be seen, which is most likely due to the constriction of glass structure. A similar phenomenon can be found in other references [22, 23].
3.4 Absorption spectra
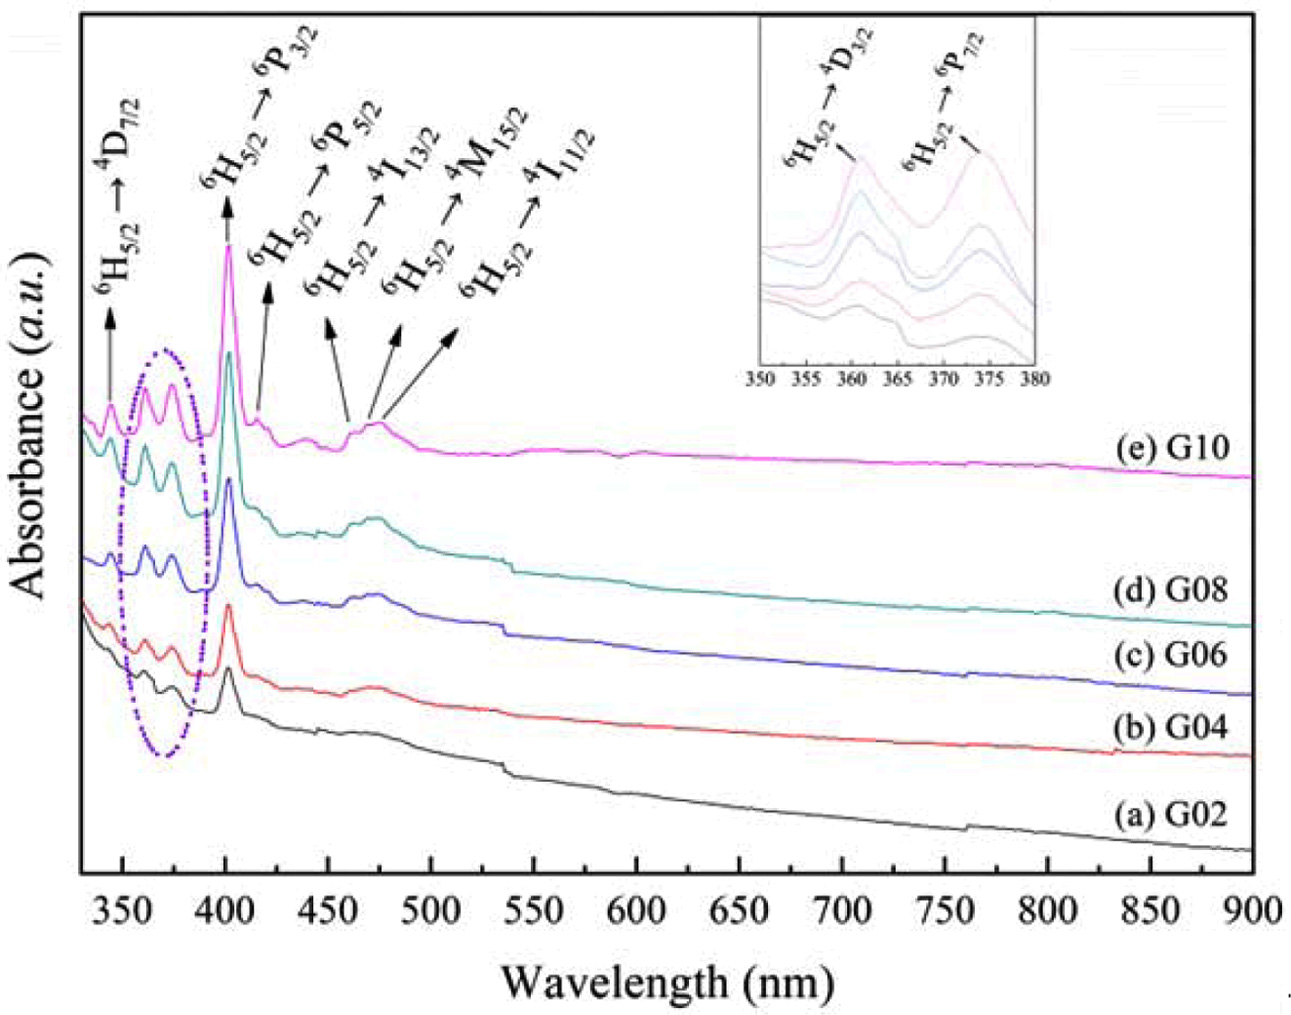
The research on optical absorption is helpful to understand the optical induced transition of glass materials. In this paper, the absorption spectra of glasses G02 ~ G10 have been investigated. Fig. 4 depicts the absorption spectra of glasses in the wavelength of 330 nm to 900 nm. As shown in Fig. 4, it can be found that there were eight obvious absorption bands in the wavelength of 300-500 nm for each glass. Based on the Refs.[24, 25], these eight obvious absorption bands, around 344 nm, 361 nm, 374 nm, 402 nm, 415 nm, 462 nm, 470 nm, and 475 nm, can be assigned to the electron transition from ground level to excited levels: 6F5/2 → 4D7/2, 6H5/2 → 4D3/2, 6H5/2 → 6P7/2, 6H5/2 → 5P3/2, 6H5/2 → 6P5/2, 6H5/2 → 4I13/2, 6H5/2 → 4M15/2, and 6H5/2 → 4I11/2, respectively. As a whole the intensity of absorption bands gradually ascended with the Sm3+ content increasing, and the absorption bands located at 374 nm and 402 nm have strong intensity. In view of this, this system glass with different Sm2O3 contents can be excited effectively by the 394 nm and 402 nm light.
3.5 Emission spectra
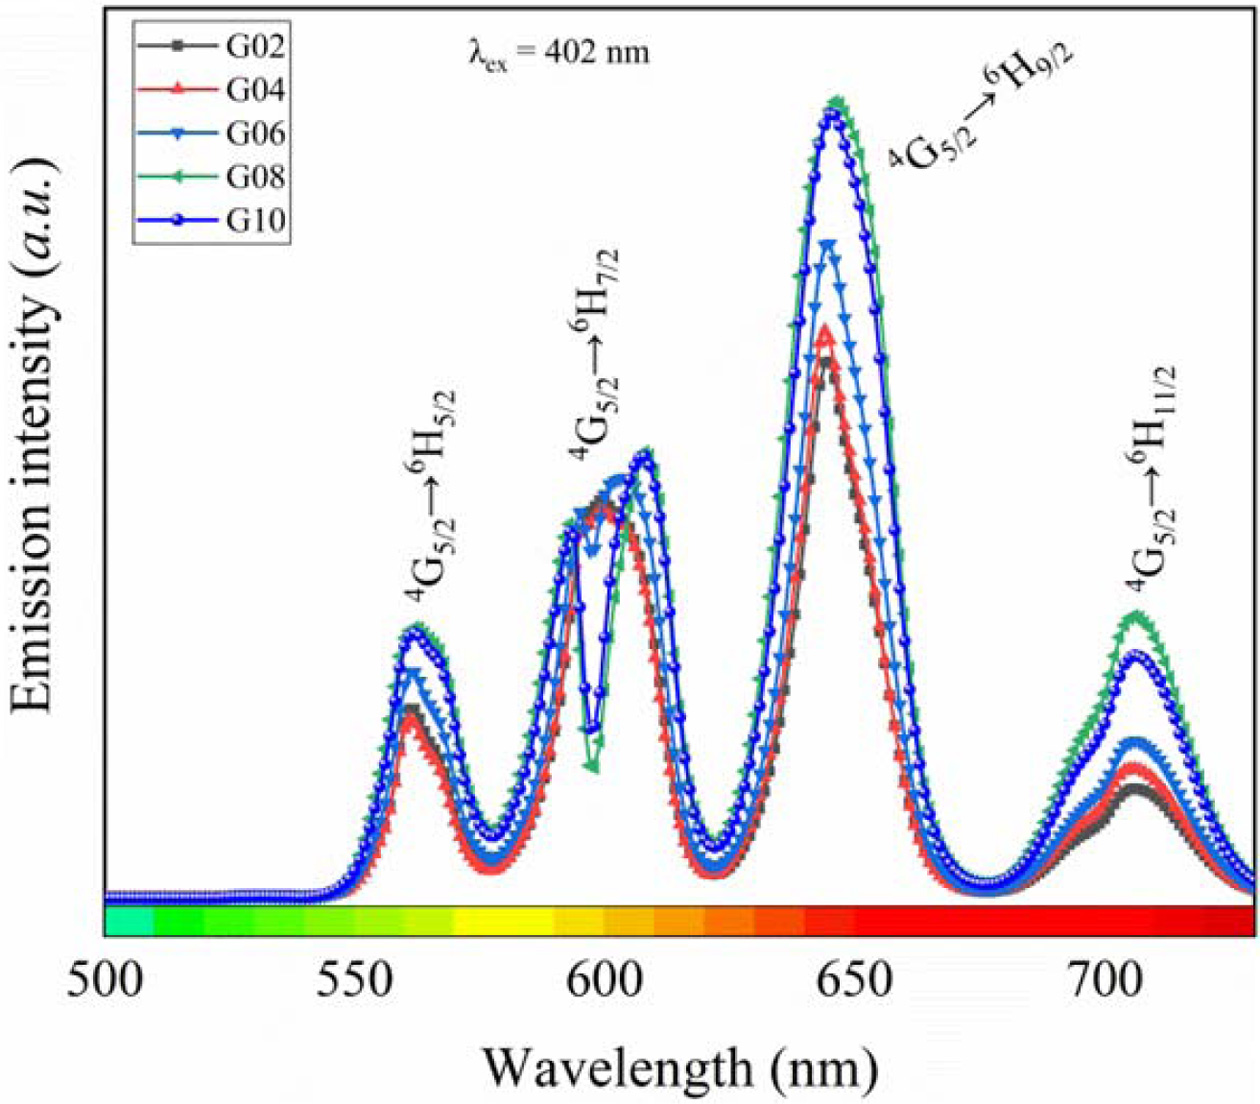
Based on the results of absorption spectra, the Tb3+/Sm3+ co-doped phosphate glasses were excited by 402 nm and 374 nm xenon lamp, and the emission spectrum for each glass are presented in Fig. 5 and Fig. 6. As shown in Fig. 5, the emission spectra excited by 402 nm xenon lamp showed four obvious peaks, which is ascribed to the transitions of Sm3+ [26, 27]: 4G5/2 → 6H5/2 (561 nm), 4G5/2 → 6H7/2 (599 nm), 4G5/2 → 6H9/2 (645 nm), and 4G5/2 → 6H11/2 (706 nm), respectively. Among these emission peaks, the emission peak belonging to the 4G5/2 → 6H9/2 transition was strongest than others. On the other hands, the intensity of emission peak gradually increased with the increasing of Sm2O3 content, and the peaks intensity reached the maximum as the content of Sm2O3 was 0.8 mol.%, and then the peaks intensity decreased, which may be caused by the cross-relaxation of Sm3+. In addition, the emission peak attributed to the 4G5/2 → 6H7/2 transition appeared Stark splitting, the emission peaks split into two sharp peaks, which may be due to the changes of environment around Sm3+ ions in glasses. However, there were no the emission peaks of Sm3+, which indicates that Tb3+ and Sm3+ cannot be effectively excited simultaneously by 402 nm light, and there was no energy transfer between Tb3+ and Sm3+.
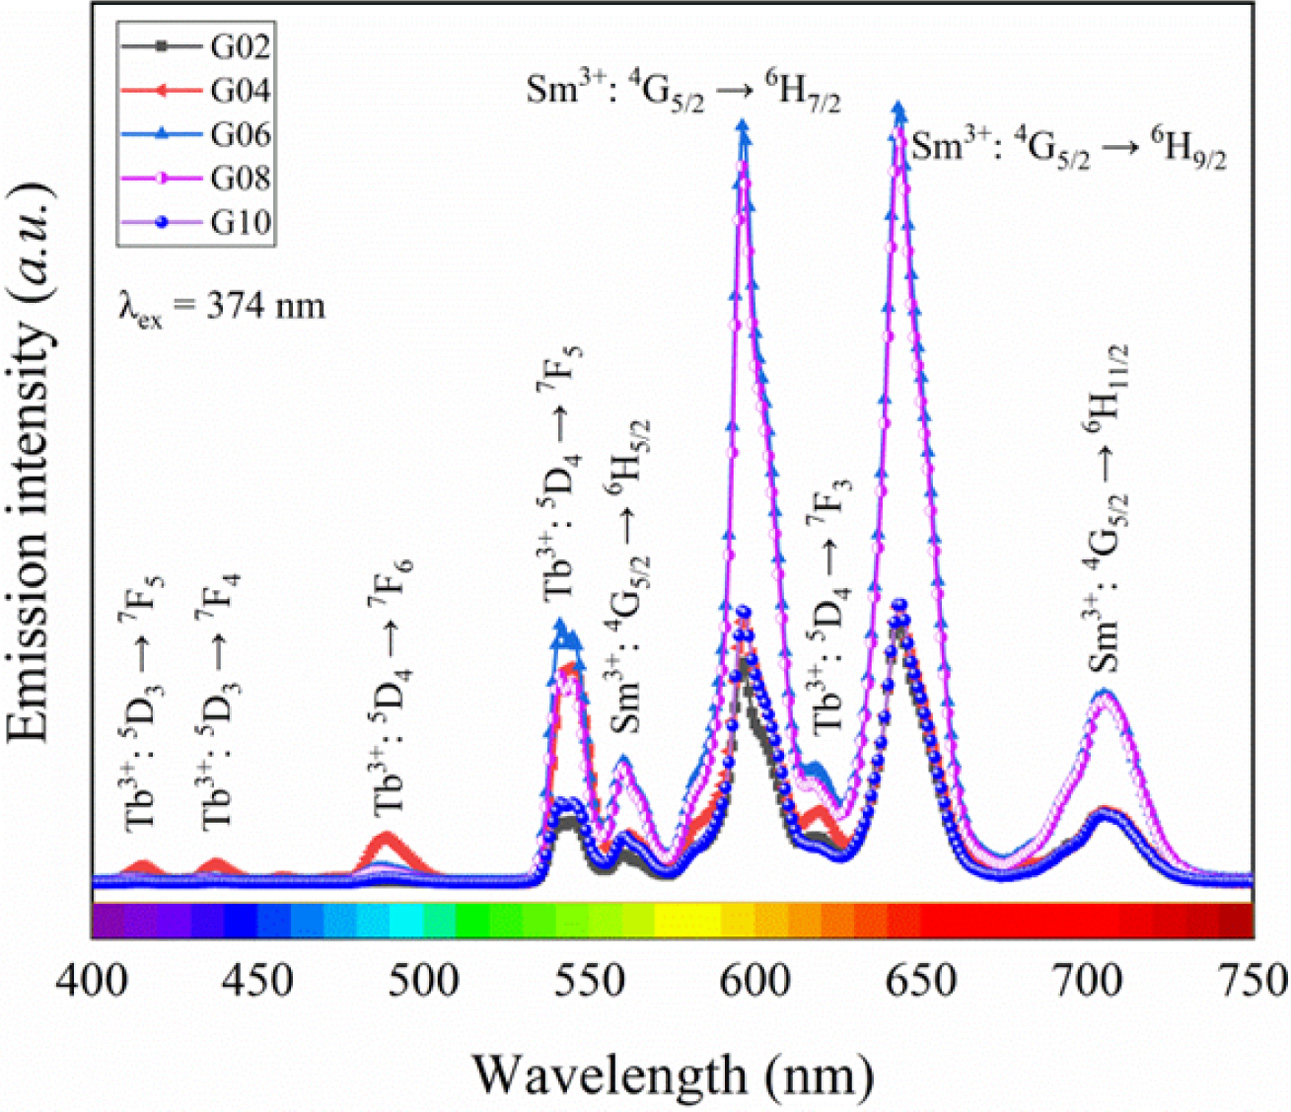
In view of this, the Tb3+/Sm3+ co-doped phosphate glasses were excited by 374 nm xenon lamp, and the emission spectra of glass are depicted in Fig. 6. As shown in Fig. 6, the emission spectra showed nine obvious peaks. Based on the Refs. [28, 29], they are attributed to the transitions of Tb3+and Sm3+: 5D3 → 7F5 (415 nm), 5D3 → 7F4 (436 nm), 5D4 → 7F6 (488 nm), 5D4 → 7F5 (541 nm), 4G5/2 → 6H5/2 (561 nm), 4G5/2 → 6H7/2 (597 nm), 5D4 → 7F3 (618 nm), 4G5/2 → 6H9/2 (643 nm), and 4G5/2 → 6H11/2 (704 nm), respectively. Among these emission peaks, the emission peak assigned to the 4G5/2 → 6H9/2 transition was strongest than others, which is very different from the data reported in other literatures [26, 28]. Interestingly, the intensity of 5D4 → 7F5 transition was much greater than that of the 4G5/2 → 6H9/2 transition in other literatures, However, the opposite is true in this work. The intensity of emission peaks increased firstly and then decreased with increased in Sm2O3 content, and the peaks intensity reached maximum as the Sm2O3 content was 0.6 mol.%. Compared with the emission spectra excited by 402 nm xenon lamp, the emission spectra were quite different. On the one hand, there were obvious emission peaks of Tb3+ in emission spectra, and these emission peaks are different from those of glass singly doped Tb3+ [30], which is due to the energy transfer of Tb3+ and Sm3+ in this glass system, suggesting that Tb3+ ions can have a sensitizing effect on the Sm3+ emission through a Tb3+ → Sm3+ energy transfer process [31]. On the other hand, the emission peaks attributed to the 4G5/2 → 6H7/2 transition did not appear Stark splitting, which may be related to the interaction effect between Tb3+ and Sm3+, and the special structure of glass materials.
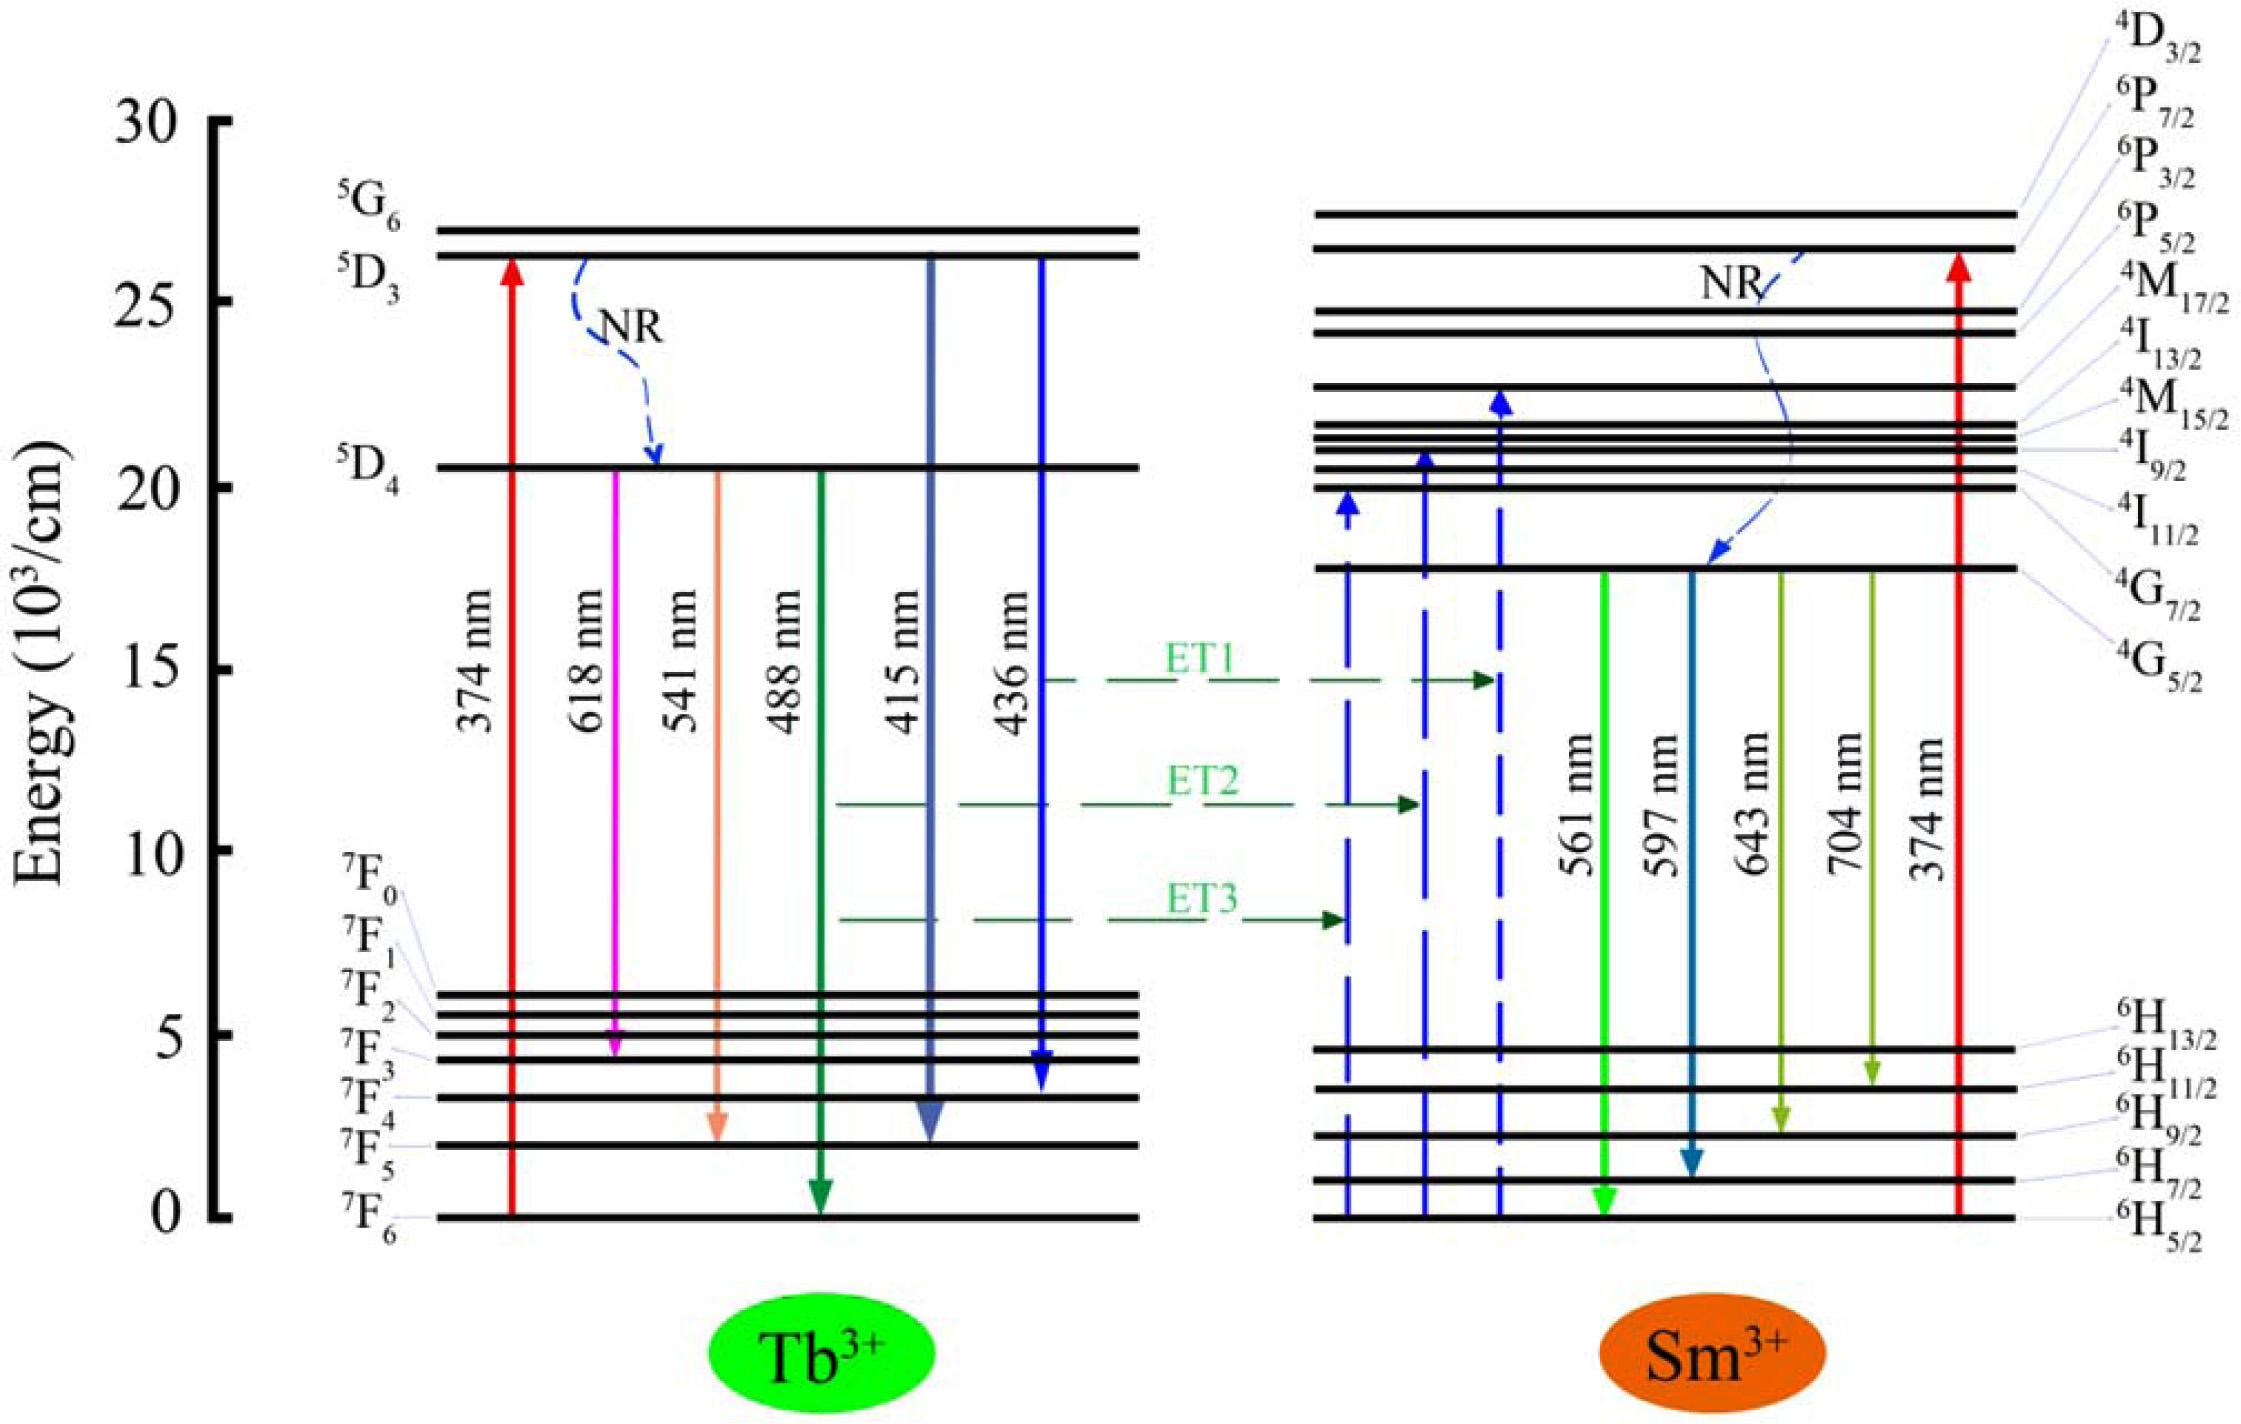
Fig. 7 portrays the energy level scheme of the emission with 374 nm excitation wavelength for the ET process from Tb3+ to Sm3+ ions. Two non-radiative transitions of 5D3 → 5D4 (Tb3+ ions) and 6P7/2→4G7/2 (Sm3+ ions) were presented within the energy level scheme. Under the excitation of 394 nm light, the electrons of Tb3+ and Sm3+ ions are excited from the ground state (7F6 and 6H5/2) to excited level (5D3 and 6P7/2), respectively. Part of the electrons of Tb3+ ions in the 5D3 directly get to 7F4 and 7F5 by radiative relaxation, and the other electrons relax up to the 5D3 through non-radiative relaxation. Finally, the electrons of 5D4 level get to the 7F3, 7F5, and 7F6 levels, corres- ponding to 618 nm, 541 nm, 448 nm, by radiative relaxation. On the other hand, the 561 nm, 597 nm, 643 nm, and 704 nm emissions occur, respectively, via the 4G5/2 → 6H5/2, 4G5/2 → 6H7/2, 4G5/2 → 6H9/2, and 4G5/2 → 6H11/2 transitions of Sm3+ ions. In addition, upon excitation at 374 nm, the energy transfer processes between Tb3+ to Sm3+ ions can be described by the following pathways (as shown in Fig. 7) [26]:

Fluorescence lifetime
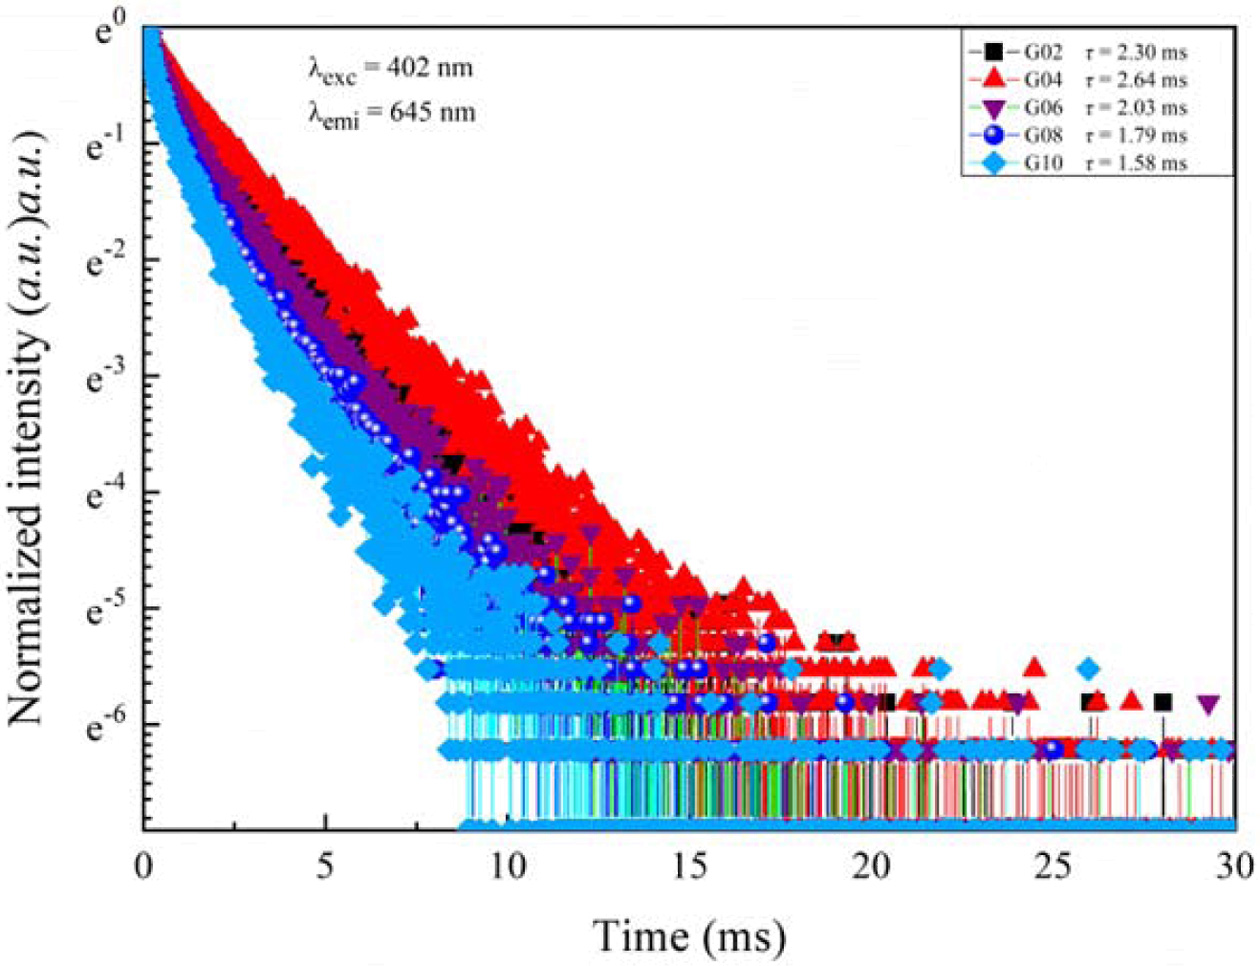
In order to study the nature of the energy transfer process, the fluorescence decay lifetimes all glasses were analyzed. Fig. 8 shows the fluorescence decay lifetimes all glasses excited by 402 nm and monitored at 645 nm (Sm3+: 4G5/2 → 6H9/2). The all fluorescence decay curves can be described in the framework of tri-exponential approximation. Based on the Ref. [32], the average fluorescence decay lifetimes of all glasses can be calculated by following equation:

where τ1, τ2 and τ3 are components of lifetimes; B1, B2 and B3 are three constants of fitting.
According to Eq. (2), the average fluorescence lifetimes of phosphate glasses co-doped Tb3+/Sm3+ were 2.30 ms, 2.64 ms, 2.03 ms, 1.79 ms, and 1.58 ms, respectively. It can be found that the average fluorescence lifetimes for all glasses first increased and then decreased with increase in Sm2O3 content, which may be caused by multi-phonon relaxation process and cross-relaxation energy transfer mechanism between two neighboring Sm3+ ions.
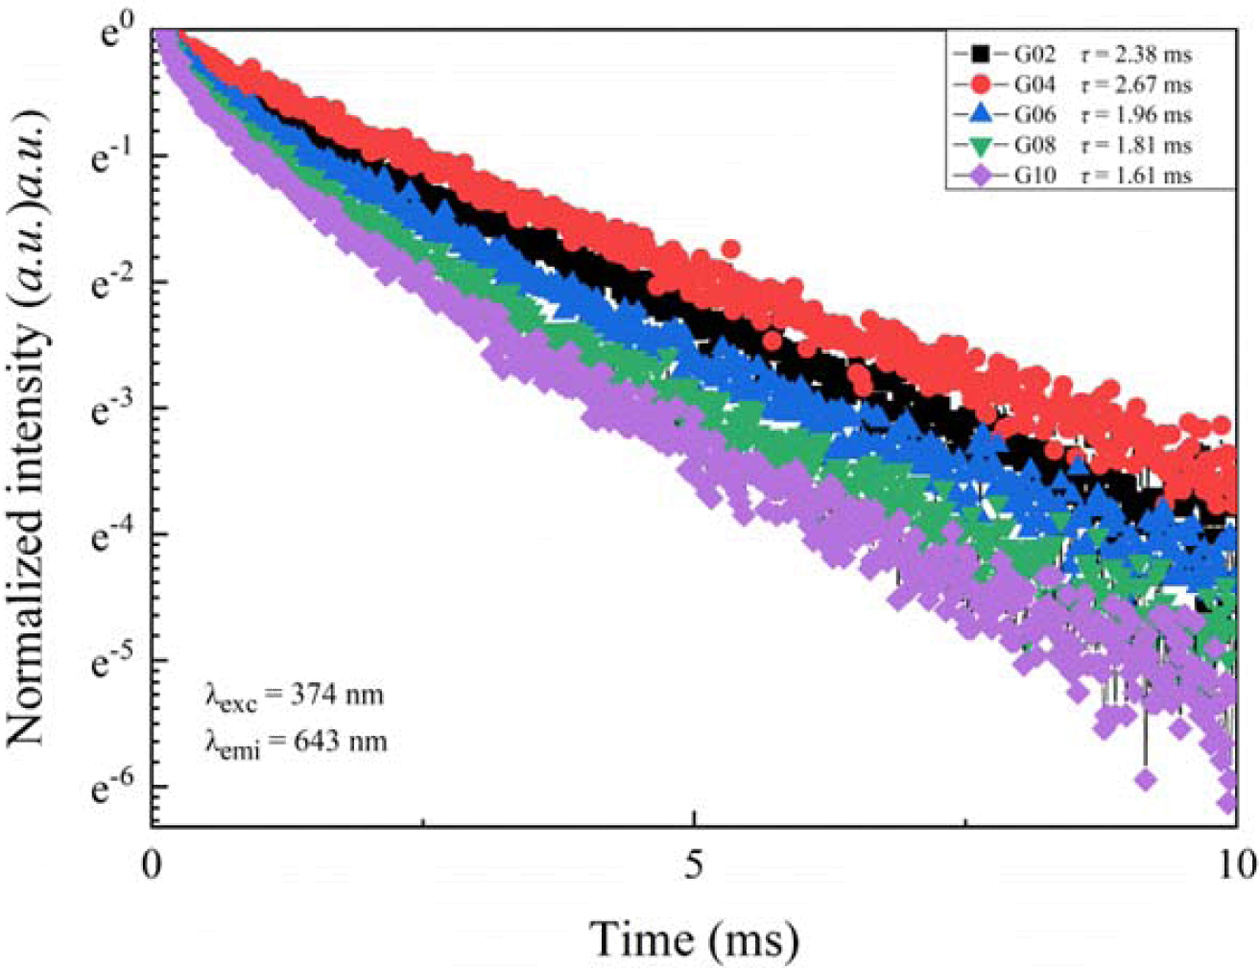
The fluorescence decay curves for all glasses excited by 374 nm and monitored at 643 nm are presented in Fig. 9. Here, all decay curves exhibited a tendency of increasing first and then decreasing with the increasing of Sm2O3 content. Different from the fluorescence decay curves excited by 402 nm xenon lamp, these curves all conformed to a double-exponential decay function. This is a common phenomenon in glass matrix. To calculate the average fluorescence lifetimes under 4G5/2 → 6H9/2 transition, the Eq. (2) can be used.
Based on Eq. (2), the calculated average fluorescence lifetimes of glasses were 2.38 ms, 2.67 ms, 1.96 ms, 1.81 ms, and 1.61 ms, respectively. It is observed that the average fluorescence lifetimes increased firstly and then decreased with increase in Sm2O3 content. Compared with the fluorescence lifetimes obtained under 402 nm light excitation, they had the same variation tendency, but the maximum of fluorescence lifetime was slightly greater than that obtained under 402 nm light excitation, which indicates that energy transition occurs between Tb3+ and Sm3+ ions in glasses.
CIE chromaticity coordinates and correlated color temperature
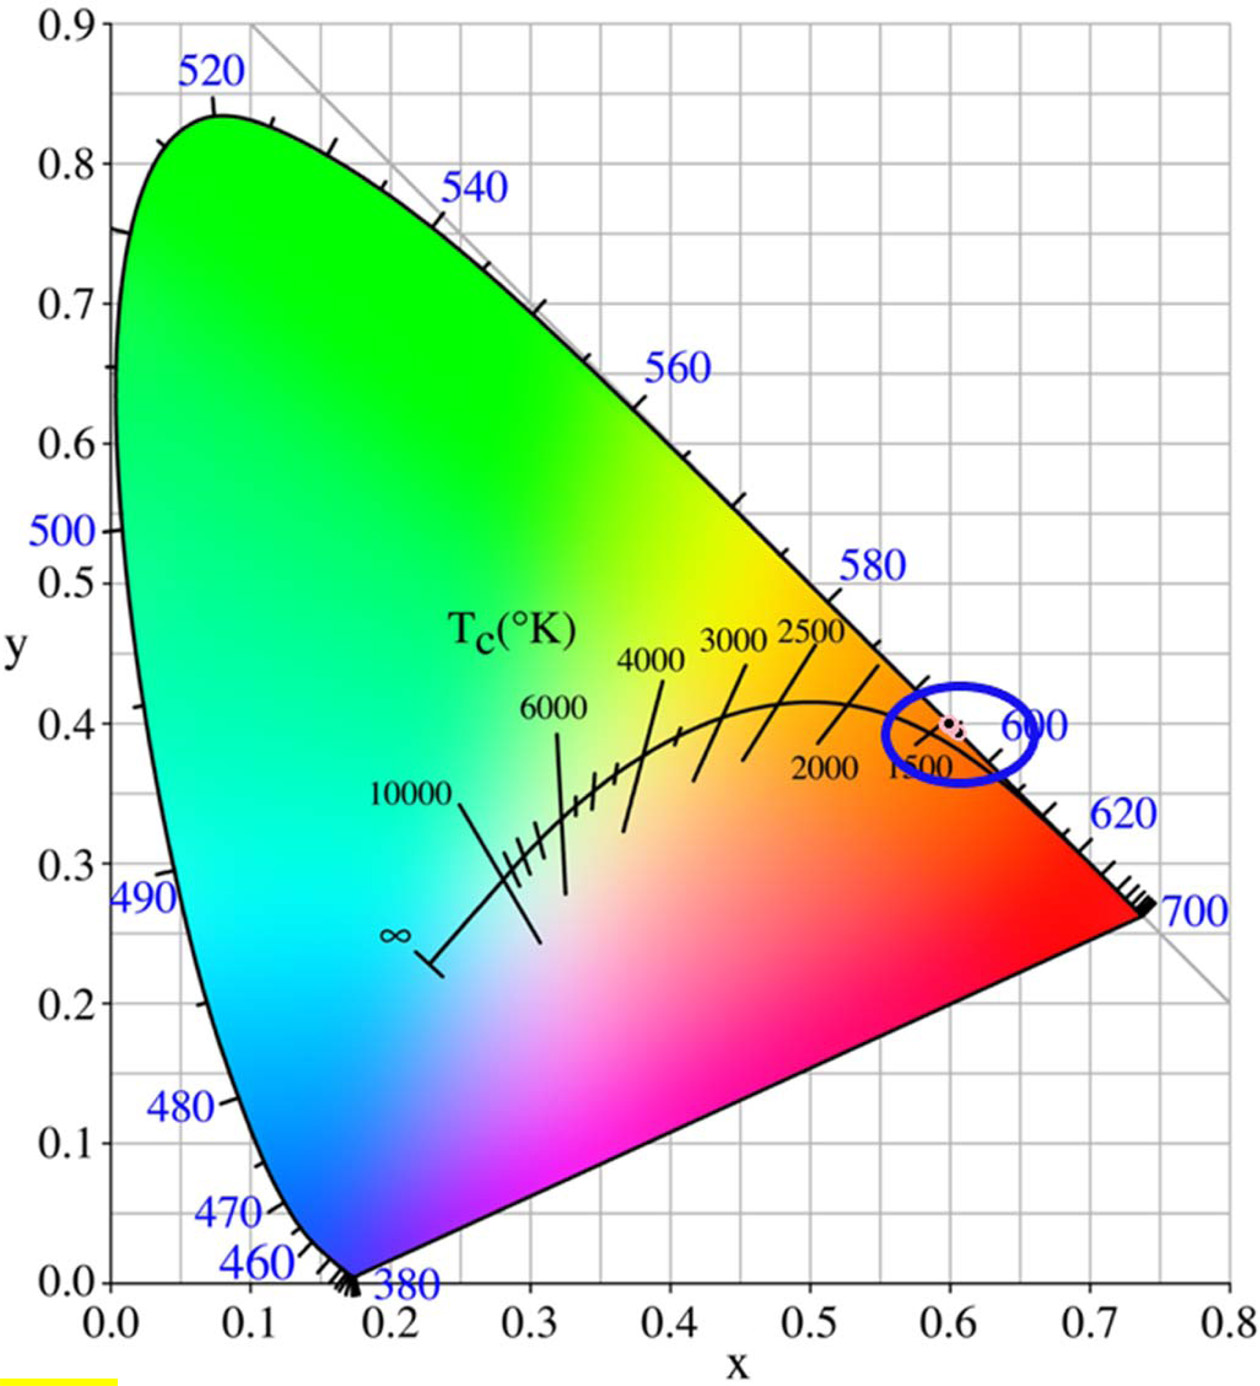
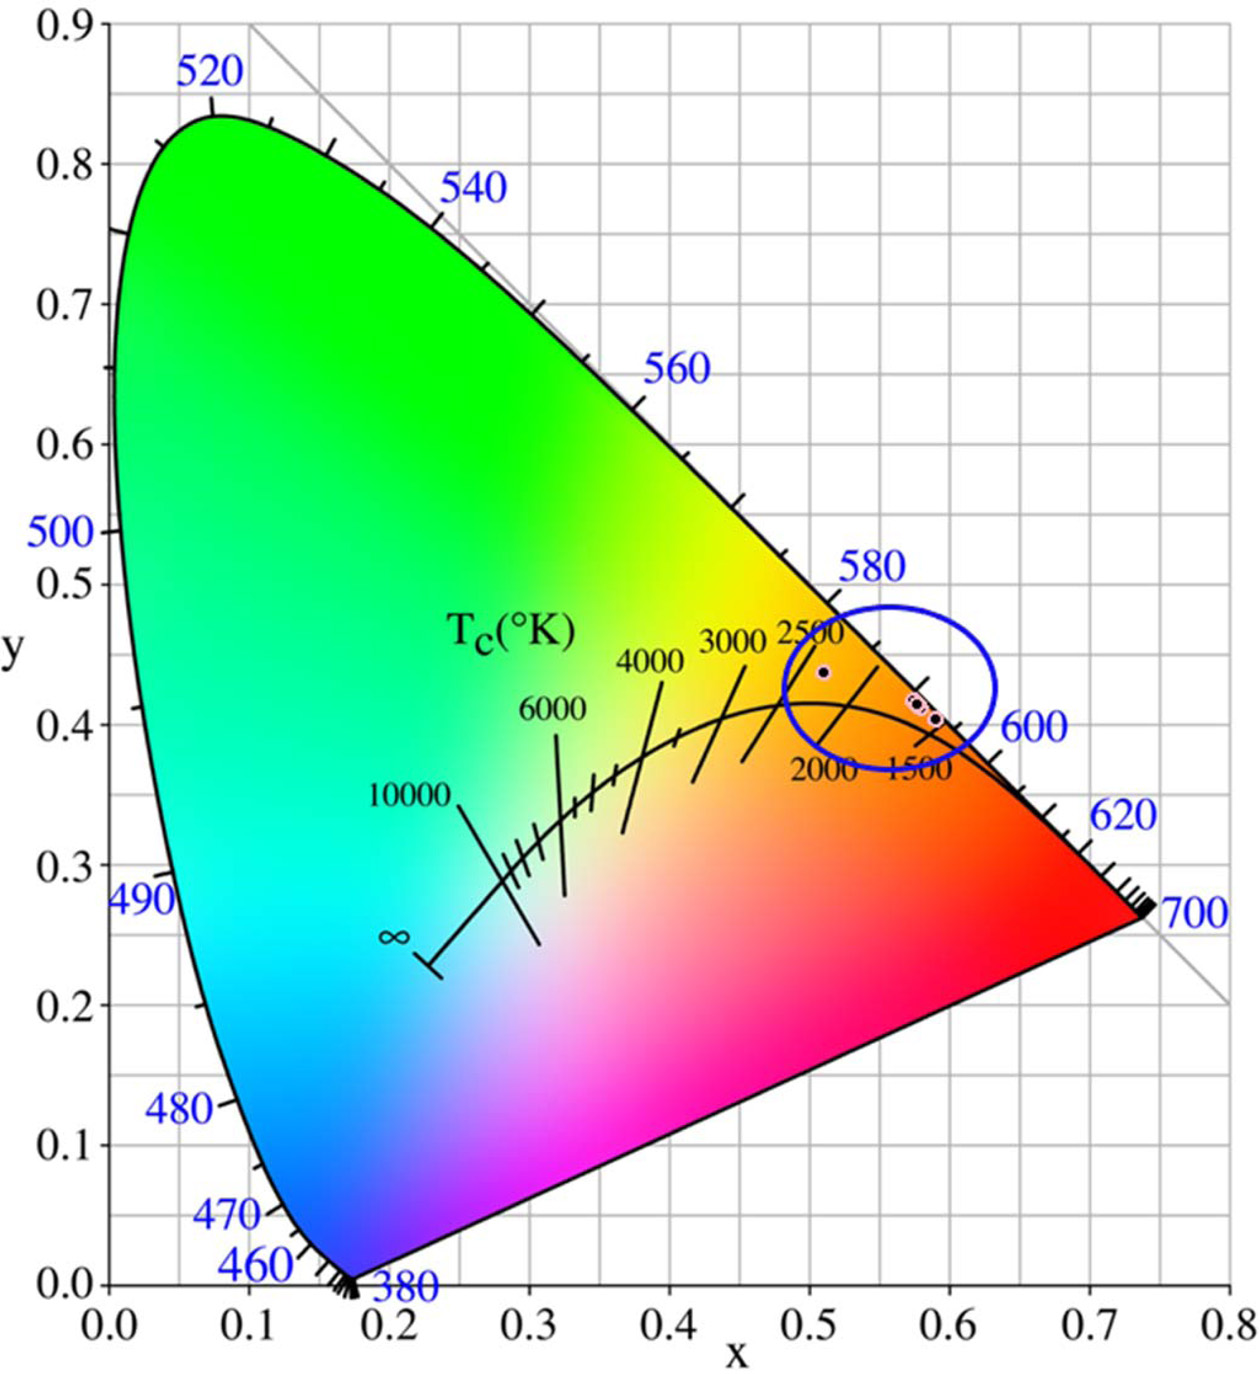
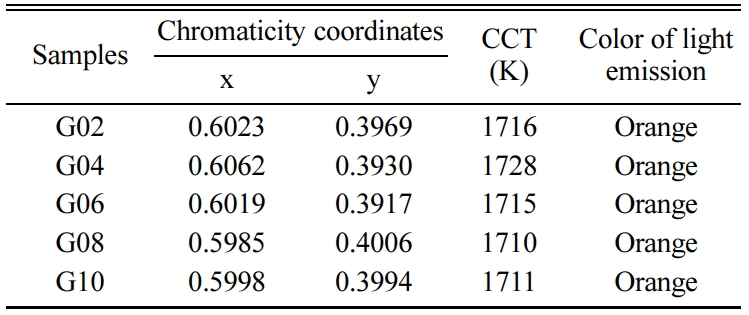
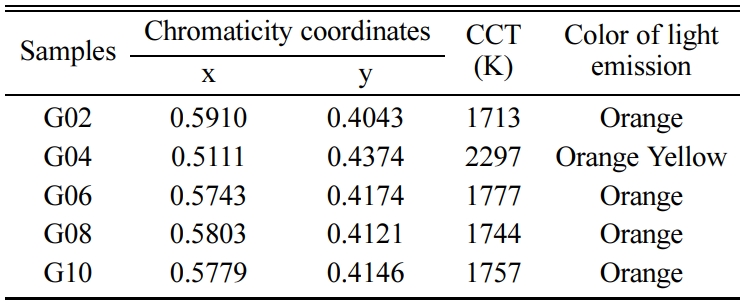
Generally, the visible luminescence characteristics of glasses are estimated by means of chromaticity coordinates, which can help human to identify the original dichromatic composition of color. The chromaticity coordinates of glasses excited by 402 nm xenon lamp were calculated via CIE 1931 chromaticity diagram (as shown in Fig. 10). The chromaticity coordinates (x, y) of all glass were in the range of 0.5985 ~ 0.6062 and 0.3917 ~ 0.4006. From the Fig. 10 and Table 3, it can be observed that all glasses emit orange color. The correlated color temperature (CCT) is a specification of the color appearance of light emitted by a lamp, Table 3 lists the CCTs of all Tb3+/Sm3+ co-doped glasses. As shown in Table 3, the CCTs of all glasses were in the range of 1,711 ~ 1,728 K. Fig. 11 shows the chromaticity coordinates of glasses excited by 374 nm xenon lamp, and the CCTs of all glass are listed in Table 4. From the Fig. 11 and Table 4, the chromaticity coordinates (x, y) of glasses were in the range of 0.5111 ~ 0.5910 and 0.4043 ~ 0.4374, the all glasses emitted orange color except for glass G04, and the CCTs of all glasses were in the range of 1,713 ~ 2,297. Comparing the data obtained at different excitation wavelengths, there was a big difference, which is mainly due to the interaction between Sm3+ and Tb3+ ions.
|
Fig. 1 X-ray diffraction patterns of Tb3+/Sm3+ co-doped phosphate glasses. |
|
Fig. 2 FTIR spectra of Tb3+/Sm3+ co-doped phosphate glasses. |
|
Fig. 3 Variation in density and molar volume Tb3+/Sm3+ co-doped phosphate glasses. |
|
Fig. 4 Absorption spectra of Tb3+/Sm3+ co-doped phosphate glasses. |
|
Fig. 5 Emission spectra of Tb3+/Sm3+ co-doped phosphate glasses excited by 402 nm xenon lamp. |
|
Fig. 6 Emission spectra of Tb3+/Sm3+ co-doped phosphate glasses excited by 374 nm xenon lamp. |
|
Fig. 7 Energy level diagram and energy transfer sketch map of Tb3+/Sm3+ ions in glasses excited by 374 nm xenon lamp. |
|
Fig. 8 Fluorescence decay curves of Tb3+/Sm3+ co-doped phosphate glasses excited by 402 nm xenon lamp. |
|
Fig. 9 Fluorescence decay curves of Tb3+/Sm3+ co-doped phosphate glasses excited by 374 nm xenon lamp. |
|
Fig. 10 Chromaticity CIE diagram of Tb3+/Sm3+ co-doped phosphate glasses excited by 402 nm xenon lamp. |
|
Fig. 11 Chromaticity CIE diagram of Tb3+/Sm3+ co-doped phosphate glasses excited by 374 nm xenon lamp |
|
Table 2 Detailed vibration types of different absorption bands. |
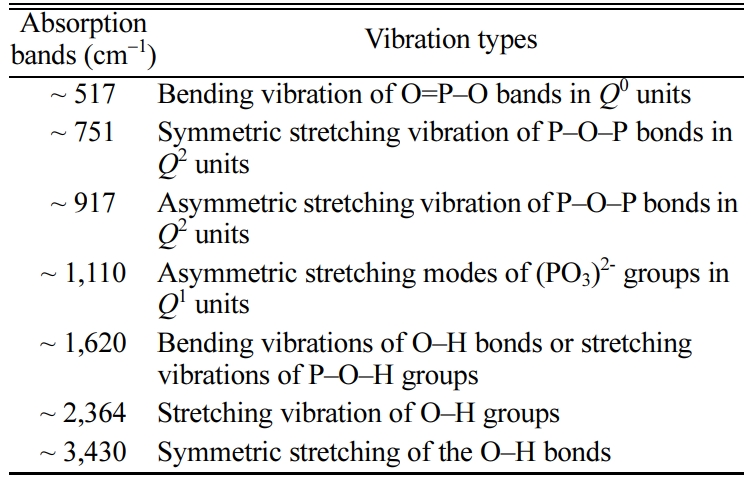
[Qn is the conventional notation for phosphate groups in glass, where n (n = 0-3) is the number of bridging oxygen per PO4 tetrahedron] |
|
Table 3 Chromaticity coordinates and correlate color temperatures of Tb3+/Sm3+ co-doped glasses excited by 402 nm xenon lamp. |
|
Table 4 Chromaticity coordinates and correlate color temperatures of Tb3+/Sm3+ co-doped glasses excited by 374 nm xenon lamp. |
In summary, we have prepared a novel Tb3+T/TSm3+ co-doped phosphate glasses with the composition of P2O5-SrO-BaO-ZnO doped with 0.5Tb-xEu2O3 (x = 0.2, 0.4, 0.6, 0.8, and 1.0 mol.%). The results suggested that glasses mainly consisted of metaphosphate groups as well as minor of pyrophosphate and orthophosphate groups, the densities of glasses monotonically increased with the increased Sm2O3 content, while the molar volume was the opposite. From the absorption spectra, eight obvious absorption bands were found, which can be assigned to the electron transition from ground level to excited levels. the emission spectra of all glasses excited by 402 nm xenon lamp showed four obvious peaks, and there was no energy transfer between Tb3+ and Sm3+. However, the emission spectra of all glasses excited by 374 nm xenon lamp showed nine obvious peaks, and they were attributed to the transitions of Tb3+ and Sm3+. Compared with the fluorescence lifetimes obtained under 402 nm light excitation, they had the same variation tendency, but the maximum of fluorescence lifetime was slightly greater. In addition, all glasses emitted orange color based on the CIE chromaticity diagram. Given all that, this systematic study would provide a guidance for preparing orange light emitting glass, and we believe this system glass will have a potential application in display devices.
This work has been supported by the Project of Technology Promotion and Industrialization for Key Basic Materials in China (No. 2017YFB0310200), the Scientific Research Foundation of Jiangxi University of Science and Technology (205200100425), the National Natural Science Foundation of China (No. 51672310, No. 51272288) and the Scientific Research Foundation for Universities from the Education Bureau of Jiangxi Province (GJJ190475).
The authors declare no conflict of interest.
- 1. E.F. Schubert, and J.K. Kim, Science 308[5726] (2005) 1274-1278.
-

- 2. S.F. Liu, H. Ming, J. Cui, S.B. Liu, W.X. You, X.Y. Ye, Y.M. Yang, H.P. Nie, and R.X. Wang, J. Phys. Chem. C 122[28] (2018) 16289-16303.
-

- 3. M.Y. Ding, J.J. Hou, Y.J. Yuan, W.F. Bai, C.H. Lu, J.H. Xi, Z.G. Ji, and D.Q. Chen, Nanotechnol. 29 (2018) 345704.
-

- 4. H. Ming, S.F. Liu, L.L. Liu, J.Q. Peng, J.X. Fu, F. Du, and X.Y. Ye, Acs Appl. Mater. Inter. 10[23] (2018) 19783-19795.
-

- 5. J. Zhang, X.T. Tao, C.M. Dong, Z.T. Jia, H.H. Yu, Y.Z. Zhang, Y.C. Zhi, and M.H. Jiang, Laser Phys. Lett. 6[5] (2009) 355-358.
-

- 6. G.H. Chen, L.Q. Yao, H.J. Zhong, and S.C. Cui, J. Lumin. 178 (2016) 6-12.
-

- 7. J.T. Zhao, L.H. Huang, T.Y. Liang, S.L. Zhao, and S.Q. Xu, J. Lumin. 205 (2019) 342-345.
-

- 8. B. Afef, M.M. Alqahtani, H.H. Hegazy, E. Yousef, K. Damak, and R. Maâlej, J. Lumin. 194 (2018) 706-712.
-

- 9. L. Yuliantini, M. Djamal, R. Hidayat, K. Boonin, P. Yasaka, E. Kaewnuam, and V. Venkatramu, J. Kaewkhao, J. Lumin. 213 (2019) 19-28.
-

- 10. N. Wantana, E. Kaewnuam, Y. Ruangtaweep, D. Valiev, S. Stepanov, K. Yamanoi, H. J. Kim, and J. Kaewkhao, Phys. Chem. 164 (2019) 108350.
-

- 11. M. Kuwik, A. Górny, J. Pisarska, and W.A. Pisarski, Mater. Lett. 254 (2019) 62-64.
-

- 12. R.O. Omrani, S. Krimi, J.J. Videau, I. Khattech, A. El Jazouli, and M. Jemal, J. Non-Cryst. Solids 390 (2014) 5-12.
-

- 13. R.J. Yang, H.L. Liu, Y.H. Wang, W.L. Jiang, X.P. Hao, J. Zhan, and S.Q. Liu, J. Alloy Compd. 513 (2012) 97-100.
-

- 14. H.J. Zhong, G.H. Chen, L.Q. Yao, J.X. Wang, Y. Yang, and R. Zhang, J. Non-Cryst. Solids 427 (2015) 10-15.
-

- 15. N. Kerkouri, M. Haddad, M. Et-tabirou, A. Chahine, and L. Laânab, Physica B 406[17] (2011) 3142-3148.
-

- 16. K. Meyer, J. Non-Cryst. Solids 209[3] (1997) 227-239.
-

- 17. Y.M. Moustafa, and K. El-Egili, J. Non-Cryst. Solids 240[1-3] (1998) 144-153.
-

- 18. L. Han, J.L. Liu, C.W. Lin, H. Gui, J. Song, Q. Zhang, C. Li, Z.W. Luo, T.Y. Liu, and A.X. Lu, Ceram. Int. 45[2] (2019) 2036-2043.
-

- 19. B. Colovic, V. Jokanovic, and N. Jovic, Sci. Sinter. 45[3] (2013) 341-350.
-

- 20. L. Han, C. Li, C.W. Lin, J.L. Liu, J.Q. Wu, H. Gui, Q. Zhang, Z.W. Luo, T.Y. Liu, and A.X. Lu, J. Am. Ceram. Soc. 102[7] (2019) 4213-4225.
-

- 21. R.K. Brow, J. Non-Cryst. Solids 263 (2000) 1-28.
-

- 22. E. Ebrahimi and M. Rezvani, Spectrochim. Acta A 190 (2018) 534-538.
-

- 23. C.W. Lin, J.L. Liu, L. Han, H. Gui, J. Song, C. Li, T.Y. Liu, and A.X. Lu, J. Non-Cryst. Solids 500 (2018) 235-242.
-

- 24. H. Algarni, M. Reben, S. Almoeed, R. Maâlej, and E.S. Yousef, Optik 160 (2018) 340-347.
-

- 25. Y. Chen, G.H. Chen, X.Y. Liu, C.L. Yuan, and C.R. Zhou, Opt. Mater. 73 (2017) 535-540.
-

- 26. M.E. Alvarez-Ramos, J. Alvarado-Rivera, M.E. Zayas, U. Caldiño, and J. Hernández-Paredes, Opt. Mater. 75 (2018) 88-93.
-

- 27. X.Q. Zhou, G.F. Ju, T.S. Dai, Y. Li, H.Y. Wu, Y.H. Jin, and Y.H. Hu, J. Lumin. 218 (2020) 116820.
-

- 28. J. Pisarska, A. Kos, M. Sołtys, A. Górny, E. Pietrasik, and W.A. Pisarski, J. Lumin. 195 (2018) 87-95.
-

- 29. M.B. Xie, G.X. Zhu, L.H. Zeng, F.F. Xie, C.Y. Liang, and X.P. Zhou, Int. J. Appl. Ceram. Tec. 12[4] (2015) 750-754.
-

- 30. A.F.A. Mohammed, G. Lakshminarayana, S.O. Baki, K.A. Bashar, I.V. Kityk, and M.A. Mahdi, Opt. Mater. 86 (2018) 387-393.
-

- 31. L.Q. Yao, G.H. Chen, T. Yang, Y. Luo, and Y. Yang, J. Alloy Compd. 692 (2017) 346-350.
-

- 32. N. Deopa, S. Kaur, A. Prasad, B. Joshi, and A.S. Rao, Opt. Laser Technol. 108 (2018) 434-440.
-

 This Article
-
2021; 22(1): 8-15
Published on Feb 28, 2021
- 10.36410/jcpr.2021.22.1.8
- Received on Jan 21, 2020
- Revised on Apr 30, 2020
- Accepted on Jun 10, 2020
 Services
- Abstract
introduction
experimental procedures
results and discussion
conclusions
- Acknowledgements
- Conflict of Interest
- References
- Full Text PDF
Shared
 Correspondence to
- Anxian Lu
-
School of Materials Science and Engineering, Central South University, Changsha 410083, China
Tel : +86 0731 88877057 Fax: +86 0731 88877057 - E-mail: axlu@mail.csu.edu.cn


 Copyright 2019 International Orgranization for Ceramic Processing. All rights reserved.