


- Ce3+ and Eu2+ doped Sialon dual phosphor ceramic plates for white light emitting diodes
Bhupendra Joshi* and Gobinda Gyawali*
Department of Fusion Science and Technology, Sun Moon University, Chungnam 31460, Republic of Korea
Recent studies on transparent
polycrystalline phosphor ceramic plates (PCPs) show its potential application
in high brightness laser lighting. Herein, we explore the luminescence
properties of Ce3+ cation in transparent Sialon phosphor ceramic
plate. The green luminescence was observed in Ce3+ doped Sialon PCP
as excited by the 390 nm wavelength. Also, the redshift of emissions was
observed when the excitation wavelength was modulated from UV to blue light.
The matrix phases and lattice parameters of Sialon PCPs were analyzed by XRD.
The co-doping of Y3+ cations resulted a composite α/β-Sialon phase
while doping with Gd3+ produced a higher α-Sialon phase. Higher
transparency was observed with Gd3+ co-doped sample with
greenish-yellow luminescence under blue light excitation. The optical
properties of Gd-α-Sialon: Eu2+ was also investigated. Moreover, a
broadband white light was obtained after placing Gd-α-Sialon: Eu2+
on the top of the Gd3+/Ce3+ doped Sialon as a dual plate
under blue LED excitation.
Keywords: Sialon, Transparency, Phosphor ceramic plate, Luminescence
The improvement in the stability of conventional
phosphor-converted white light-emitting diode (pc-wLED) can be achieved by
introducing stable phosphor with high thermal conductivity [1]. The plate type
phosphors such as phosphors in glasses (PiGs) and glass-ceramics were studied
as remote phosphors. However, the poor thermal and mechanical properties, as
well as poor homogeneity of phosphor in the glass matrix, made
it less suitable for high brightness lighting [2, 3].
Moreover, the low refractive index of glass causes poor light extraction [4].
Also, single-crystal phosphor plates were reported, but they are difficult to be commercialized in
terms of cost-effectiveness. Therefore, polycrystalline transparent phosphor ceramic
plates (PCPs) having similar physical properties to the single crystals are
studied as future phosphors for high luminance and longevity solid-state
lighting (SSL) [4].
Polycrystalline ceramics, such as garnet systems, have
been studied as a PCP for wLED. However, the thermal conductivity of these
oxide ceramics is low to be applied in high power light-emitting diode (LED) or
laser diode (LD) for lightings [5]. The silicon aluminum
oxynitride (Sialon) which is a solid solution of Si3N4
ceramics and exhibits excellent mechanical and thermal properties as well as
chemical stability [6]. In general, the two common phases of
Sialon ceramics were studied as phosphors, i.e., α-Sialon phase
and β-Sialon phase, which are isostructure to α-Si3N4
phase and β-Si3N4, respectively [7]. The partial
substitution of Si and N with Al and O, respectively in β-Si3N4,
gives β-Sialon structure having a hexagonal crystal structure with a space
group of P63. To compensate the charge within the α-Si3N4
structure, the metal cations are introduced in interstitial sites to form a
stable α-Sialon phase after partial
substitution of Si and N with Al and O, respectively having a formula of Mxν+Si12-m-nAlm+nOnN16-n,
where x=m/ν and M is one of the metal cations (Li+, Mg++,
Ca++ and most of the lanthanide ions (Ln3+)) [8]. The α-Sialon
has a trigonal crystal structure with a space group of P31c. The powder form of
Europium doped Calcium alpha Silicon Aluminum Oxynitride (Ca-α-Sialon: Eu2+)
phosphor was reported a decade ago, and later on, more studies were carried out
on Sialon phosphors matching the properties required for warm white light [9].
As mentioned above, the powder phosphors either in resin or glass have issues
with homogeneous distribution within the matrix. Recently, the transparent/translucent polycrystalline Sialon
ceramics were studied as phosphor materials for down-conversion and upconversion PCPs [10-13]. The
transparent/translucent Sialon PCPs can be applied in high power lighting and
lighting in extreme conditions due to their outstanding physical and thermal properties.
In this article, Ce3+ was studied as an
alternative to Eu2+ in the Sialon PCPs. The Ce3+
has fast luminescence decays than Eu2+, which
makes Ce3+ a more suitable activator than Eu2+ for high
brightness solid-state lighting [14]. Also, Ce3+ has a broadband
emission similar to Eu2+ due to the 4f05d1→4f1
transition. The cerium element is more abundant in nature than the europium and
lowers the production cost of phosphor with cerium in Sialon ceramics. Herein,
we tried to investigate the luminescence properties of Ce3+ cation
in transparent/translucent Sialon PCP. In previous reports, α-Sialon: Ce3+
shows blue to cyan emission with near UV excitation, which is not suitable to
be used in blue LED chips. In contrast to previous reports [14-16], we observe
intense greenish-yellow emission with Gd3+ co-doping along with Ce3+
under blue light excitation in Sialon PCP, which is discussed in this study.
The two different compositions were made based on the
formula, Mxν+Si12-m-nAlm+nOnN16-n,
where x=m/ν and M is one of the metal cations. The samples SC (Y3+
co-doped with Ce3+) and SGC (Gd3+ co-doped with
Ce3+) were fabricated with compositions of Y0.24Ce0.05Si10.65Al1.35O0.45N15.55
(m = 2n = 0.9) and Gd0.29Ce0.08Si9.8Al2.2O1.1N14.9
(m = n = 1.1), respectively.
For comparison, we prepared Gd3+ stabilized α-Sialon: Eu2+
(SE) with composition of Gd0.28Eu0.09Si9.8Al2.2O1.1N14.9 (m = n = 1.1).
The powders used were α-Si3N4 (SN-E10, UBE Co.,
Japan), Al2O3 (High purity chemicals Co. Ltd., Japan),
AlN (Grade F, Tokuyama Corp., Japan), CeO2 (High Purity Chemicals
Co. Ltd., Japan), Gd2O3 (High Purity Chemicals Co. Ltd.,
Japan), Y2O3 (High Purity Chemicals Co. Ltd., Japan) and
Eu2O3 (High Purity Chemicals Co. Ltd., Japan). For the
homogeneous mixing of powders, the powders were mixed in absolute ethanol in a
polyethylene bottle with high purity silicon nitride balls, and wet ball milled
for 24 h. Then, the mixed wet powder was dried in a rotary evaporator and then
kept in an oven at 80 oC for 12 h. The dried powder was then dry
ball milled with high purity silicon nitride balls for 12 h. After dry ball
milling, the mixed powder was sieved through 150 µm aperture sieve.
For hot press sintering, 15 g of mixed powder was packed
into the graphite mold with an inner diameter of 50 mm. The inner parts of the
graphite mold, disc, and graphite papers were coated with boron nitride to
inhibit the carbon diffusion from the graphite into samples. The samples were
hot press sintered at 1,850 oC with 30 MPa of uniaxial pressure in
the N2 environment, and holding time was 1 h. The samples were
ground to 0.1 mm thickness, and both sides were mirror polished to measure the
transmittance and luminescence properties. The phases were analyzed by XRD. The
relative amount of α-Sialon phase and β-Sialon phase in sintered ceramics was
investigated based on the following equation [17];
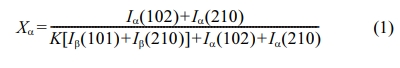
where, Xα
is the weight fraction of the α-Sialon phase, K is the constant referred
to the relative intensity ratio and dependent on the chosen reflection (K=0.647).
The microstructure of the fracture surfaces was studied by
the scanning electron microscope (SEM, SNE-3000,
SEC, Co. Ltd., Korea). The light transmittance and luminescence were
measured by UV/Vis/NIR Jasco 570
spectroscopy and Andor spectrophotometer, respectively. A commercial 455 nm
blue LED chip (Model: T56-3BLZ-05, IST, Korea) was coupled with Sialon PCPs to
obtain spectral power distribution curves (Ocean Optics USB2000
spectrophotometer).
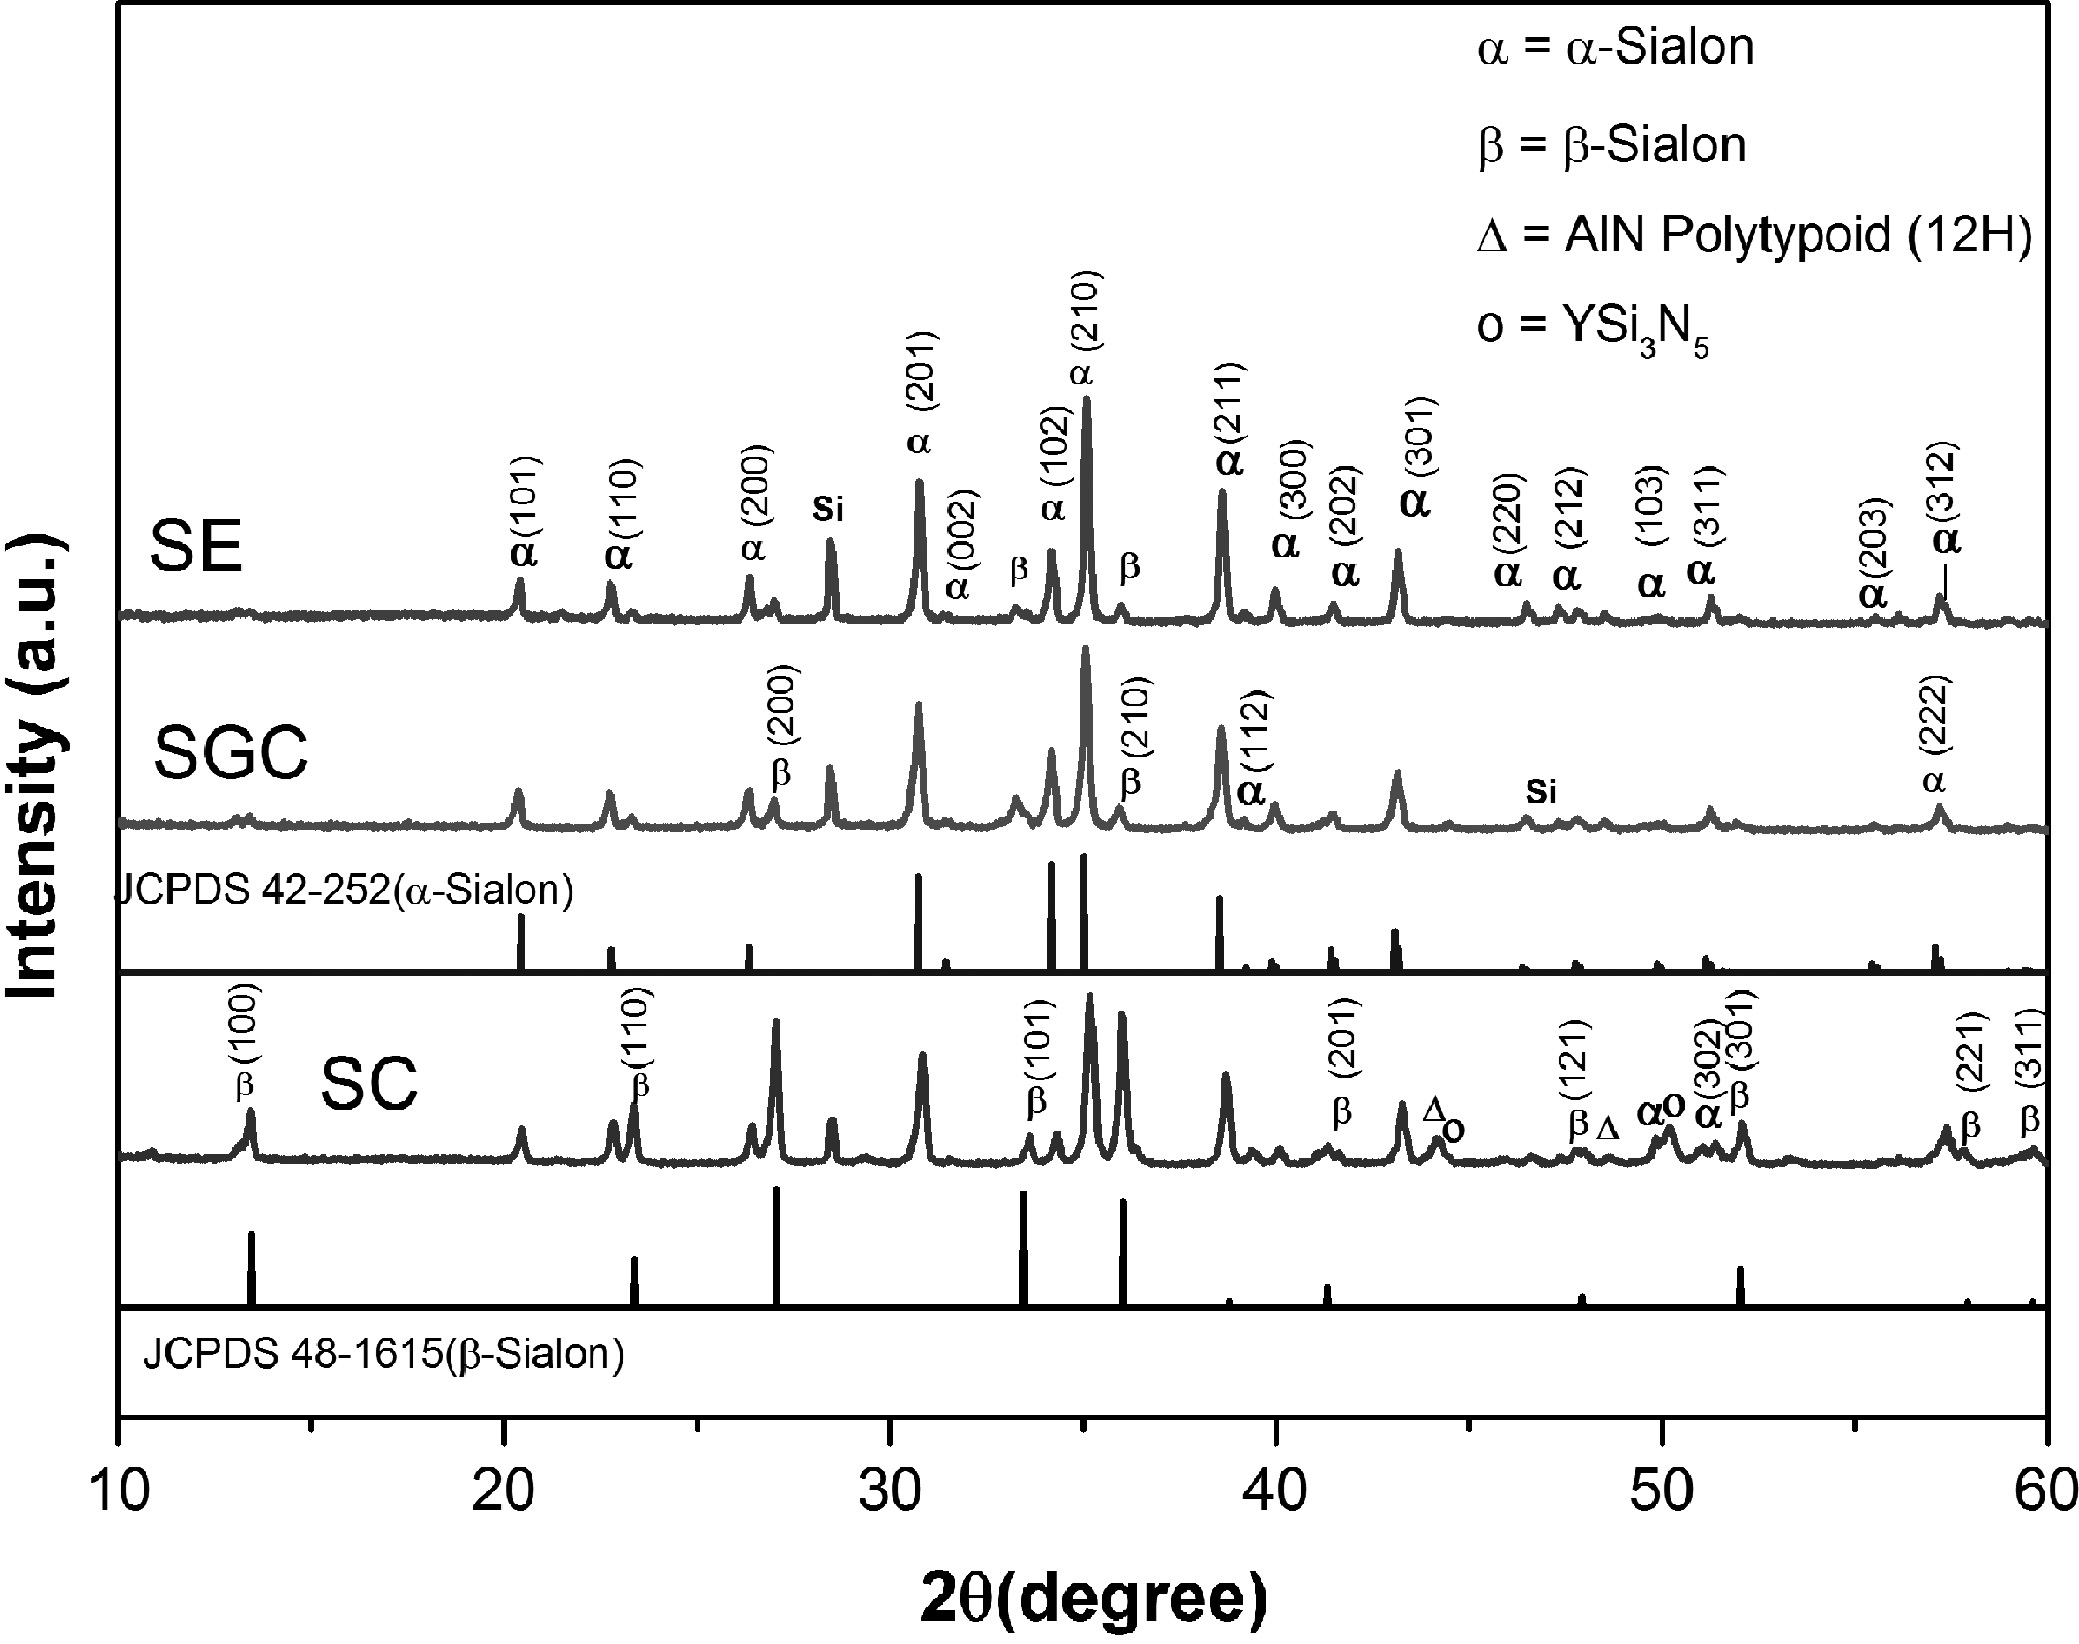
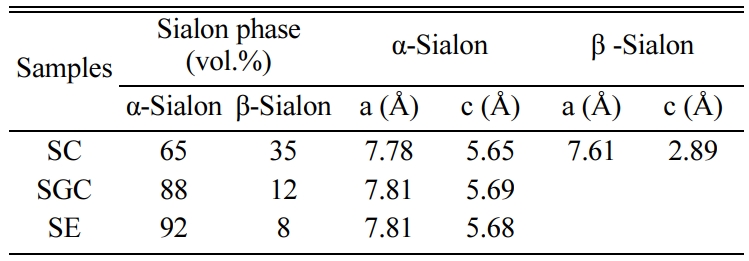
The XRD patterns in Fig. 1 show that the sample SC
is a composite of α and β phases in almost similar ratio, whereas the sample
SGC has a dominant α-Sialon phase. In addition, the AlN polytypoid
(JCPDS-42-161) and unidentified peak around 50o (2θdegree) were also observed in the XRD pattern of SC. The AlN polytypoid
(12H) is commonly found in the sintered Sialon ceramics [18]. Also, in samples
SGC and SE, a very small peak of the 12H phase was observed. The observed unidentified peak in SC may be of intermediate nitride/oxynitride phase [19, 20]. The two samples were prepared with different stabilizing cations,
i.e., Y3+ and Gd3+ for samples SC and SGC, respectively.
The Si was used as an internal standard to investigate the lattice parameters.
The lattice parameters of SGC were increased as compared to SC (Table 1). The
increase in cell parameters of SGC can be related to the insertion of Gd3+
cation, which has a larger cationic size as compared to Y3+.
Similarly, the sample SE also shows a dominant α-Sialon phase with an increase
in cell parameters. The weight fraction of α and β phases were obtained from the equation (1) [17] and shown in Table 1. This
expression is usually applied in silicon nitride based ceramics where more than
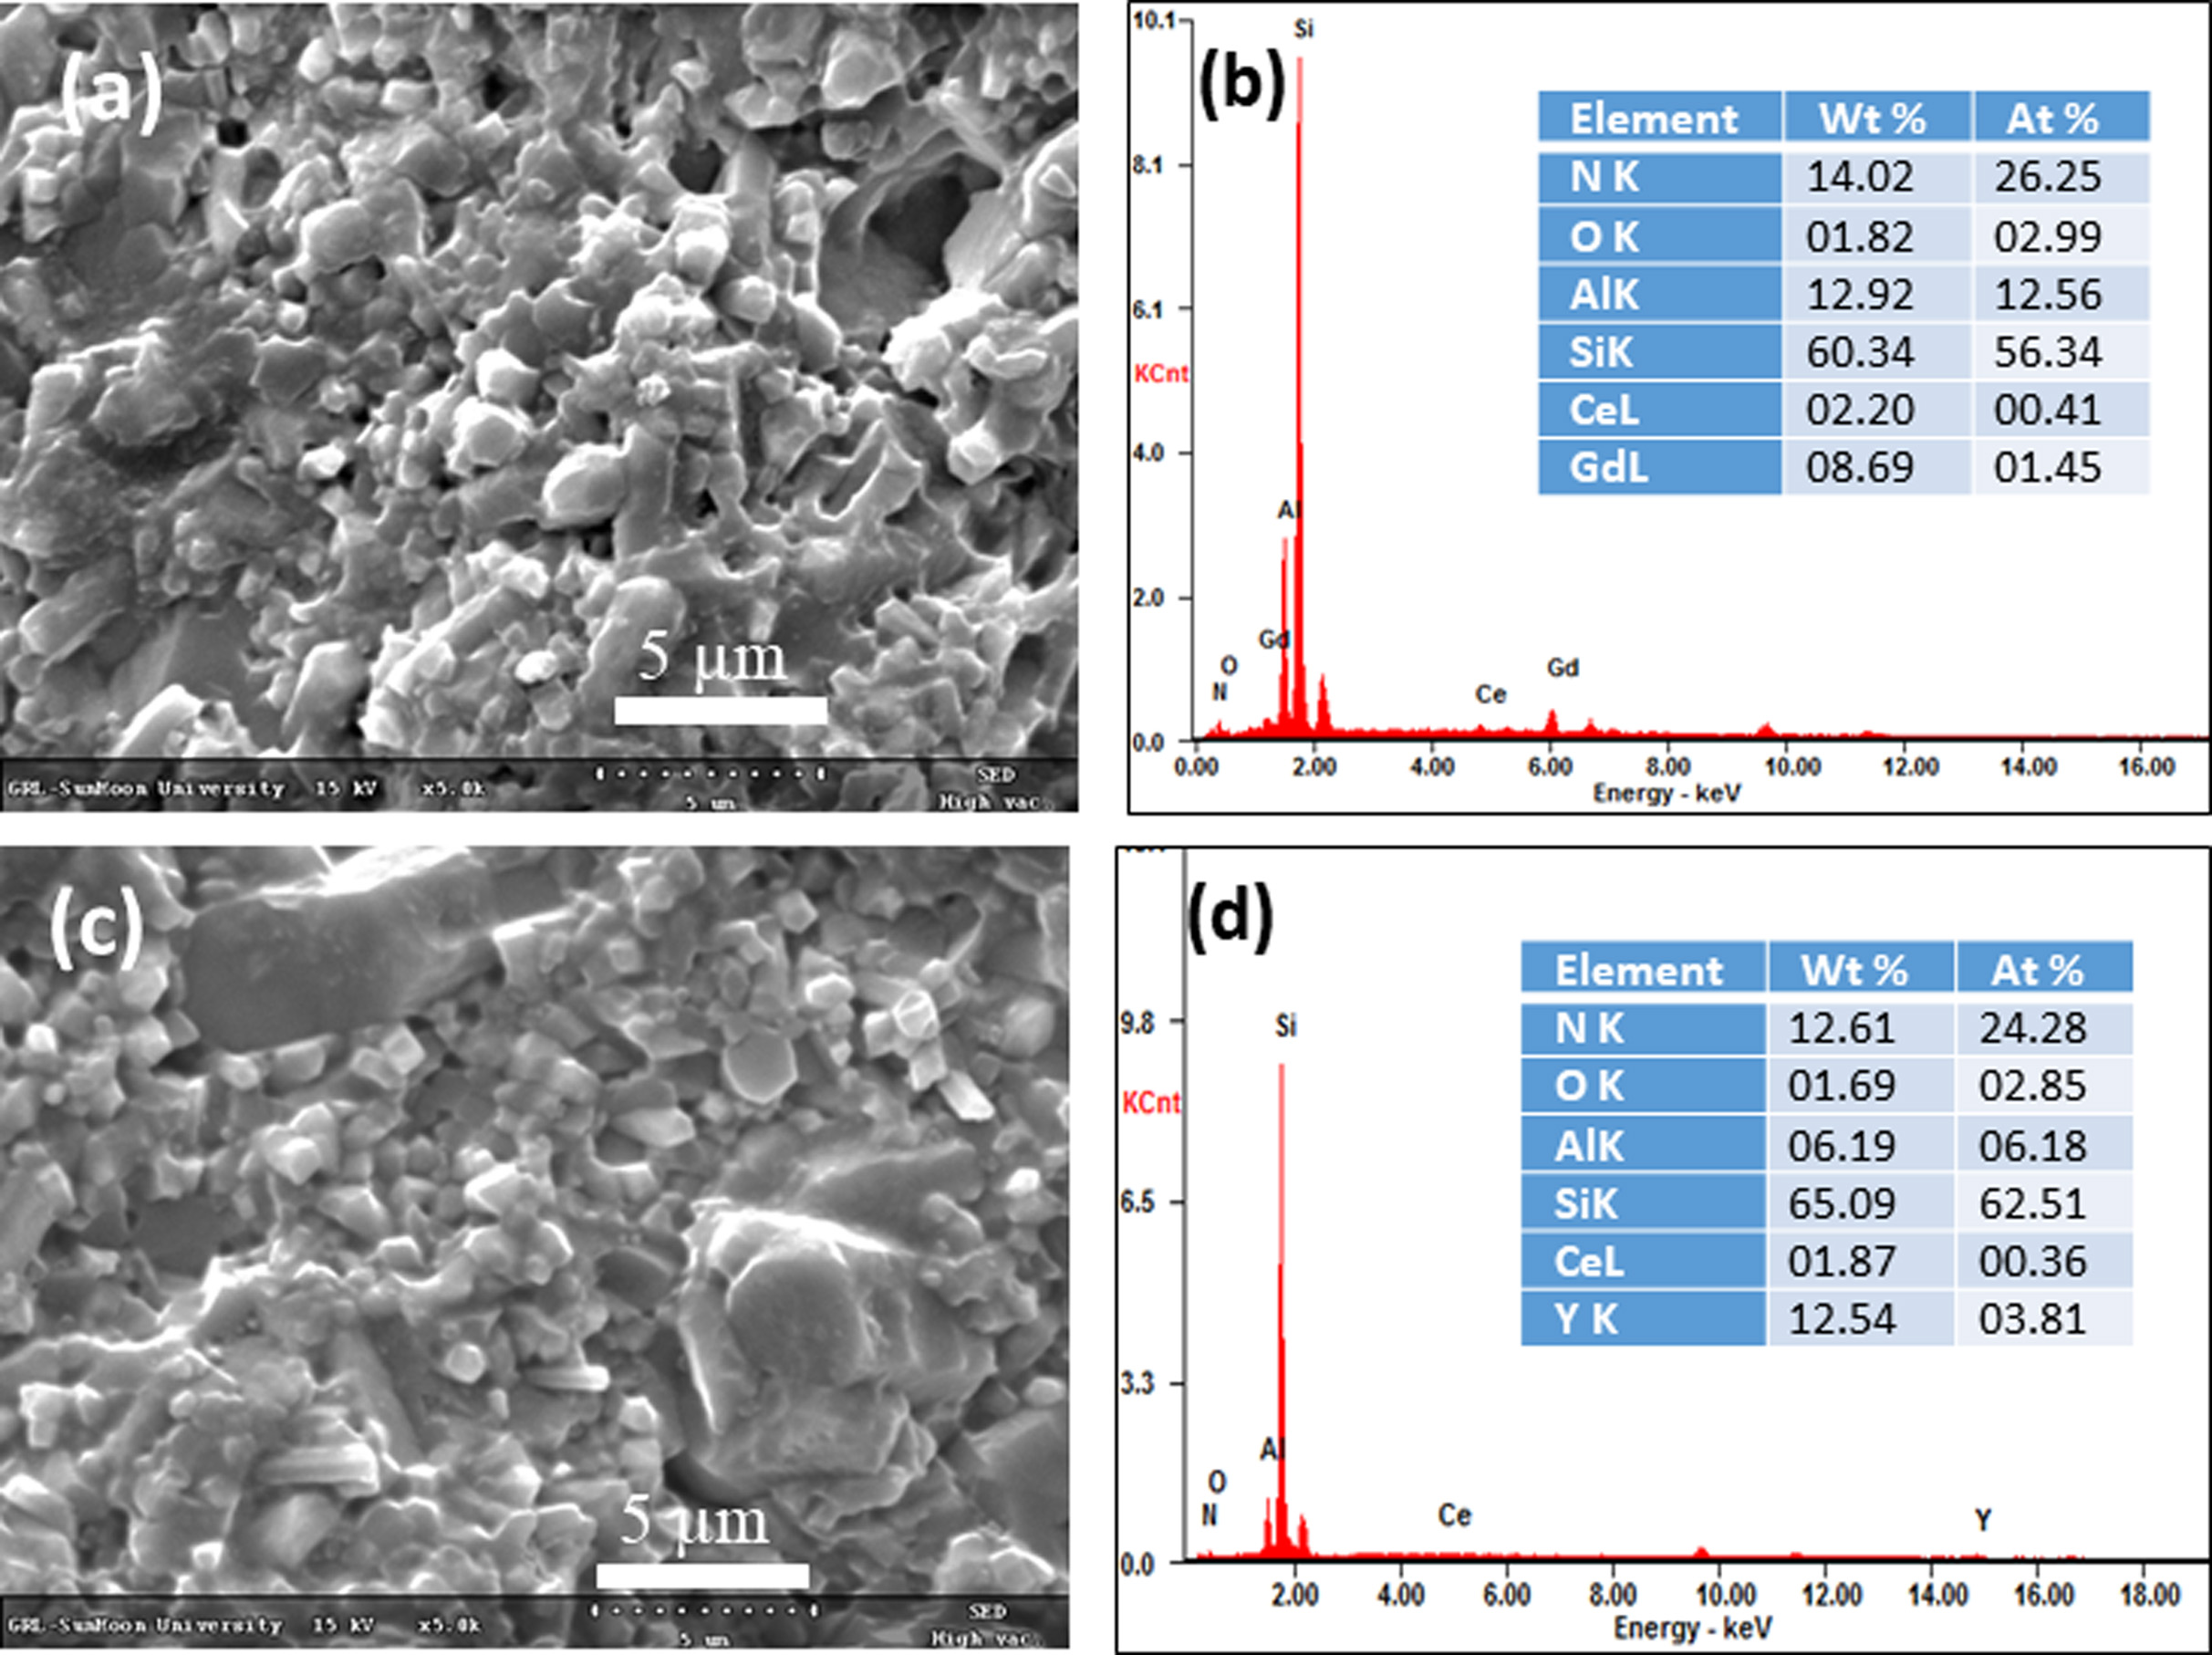
two phases exist in sintered ceramics [17, 21, 22]. The grain morphologies of
the fracture surface are shown in Fig. 2. The α-Sialon grains are considered to
have small polyhedral grains, whereas β-Sialon
grains are elongated and large. The large β-Sialon grains were observed
in SC (Fig. 2(c)), which is also supported by the XRD, where the β-Sialon phase
was observed. For SGC (Fig. 2a), the small grains were observed as compared to
SC. The EDS analysis (Fig. 2(b and d)) shows that the sample consists of the
desired composition, and wt% of different elements are tabulated in the inset
table in Fig. 2(b), and Fig. 2(d) for sample SGC and SC,
respectively. The low amount of additives was
used in SC to make the higher nitrogen containing system as compared to SGC.
When the composition is m = 2n, the additive alumina is excluded [6]. The system m = n = 1.1 is known to have better
optical properties, where a higher amount of additives with alumina can be
added with more stabilizer cations [11]. However, the system uses a higher amount
of oxides and contains more oxygen in the grains. Also, an increase in liquid
phase in SGC allows more rare earth cations to diffuse into the grains, and a
higher α-Sialon phase was obtained. As seen in Table 1, the sample SE had a
higher α-Sialon phase than SGC. The increase in α-phase in SE can be
corroborated to the lower viscosity of Eu2O3 than other
rare earth oxides at higher temperatures which forms more liquid phase and
promotes the diffusion of rare earth cations in Sialon lattice to form α-Sialon
phase [10].
The secondary phase inclusion in the ceramics degrades
the transparency due to the mismatch of refractive indices between the grains
and secondary phase. The polycrystalline ceramics are not free from defects
such as grain boundaries, pores, dislocations, secondary phase,
etc. Therefore, the optical properties degrade with increasing
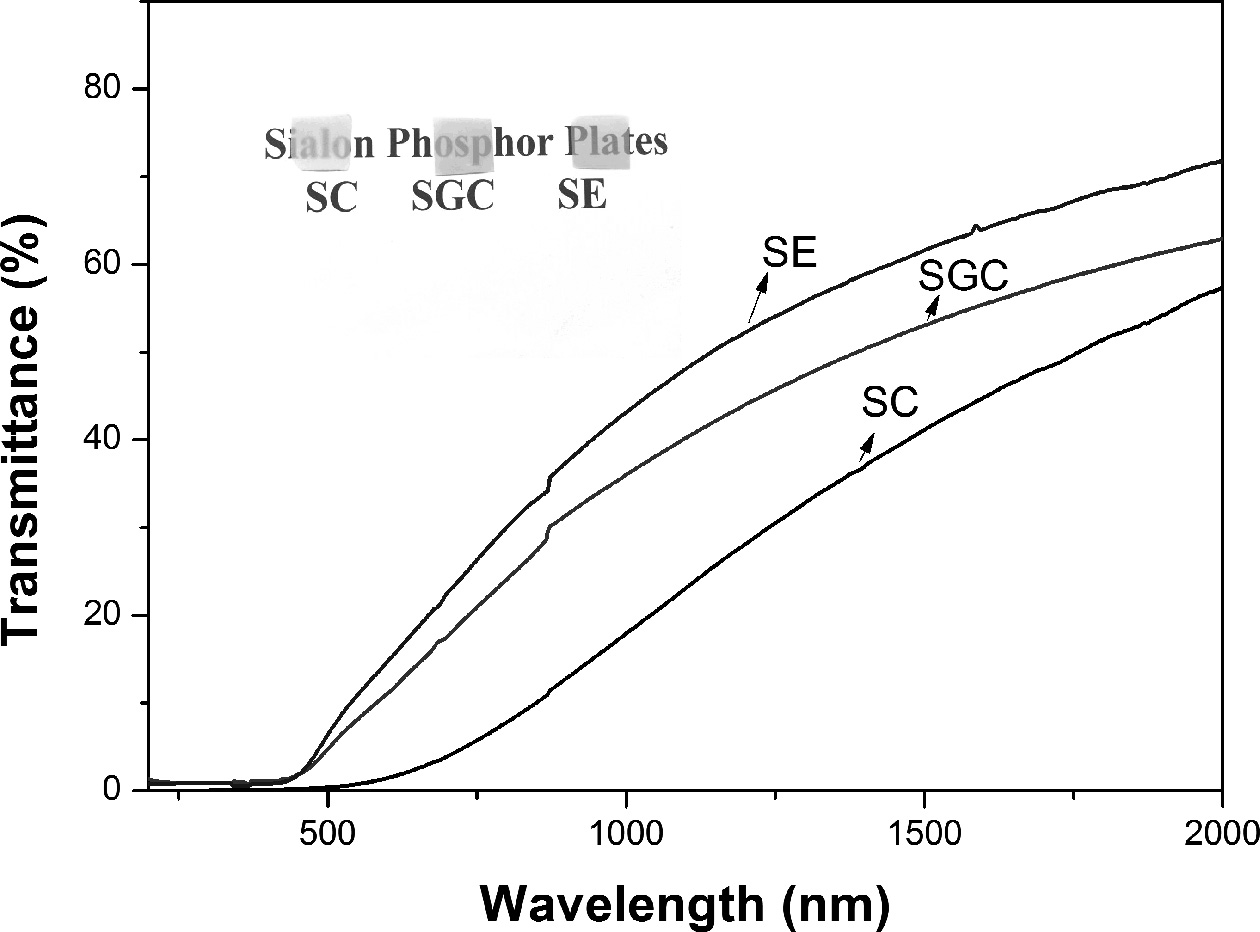
the thickness of the polycrystalline ceramics. In Fig. 3, the transmittance
spectra are shown for different samples. The SGC had higher transparency than
the SC sample. The higher α-Sialon phase was observed for
SGC (Table 1), and this phase is considered to have a
higher optical bandgap than β-Sialon give rise to higher transparency [23]. The
composite phase in SC degrades the transparency of the material. Moreover,
higher transparency was observed for the sample SE, which consisted of the
highest α-Sialon phase as compared to other samples. The Sialon
ceramics are fabricated by the addition of sintering additives,
and therefore, it is difficult to eliminate the secondary phases
that cause poor transparency in visible wavelength of
light. Also, the colors of the SC, SGC, and SE samples correspond
to grey, yellowish-green, and yellowish-orange, respectively, as shown in the
inset in Fig. 3.
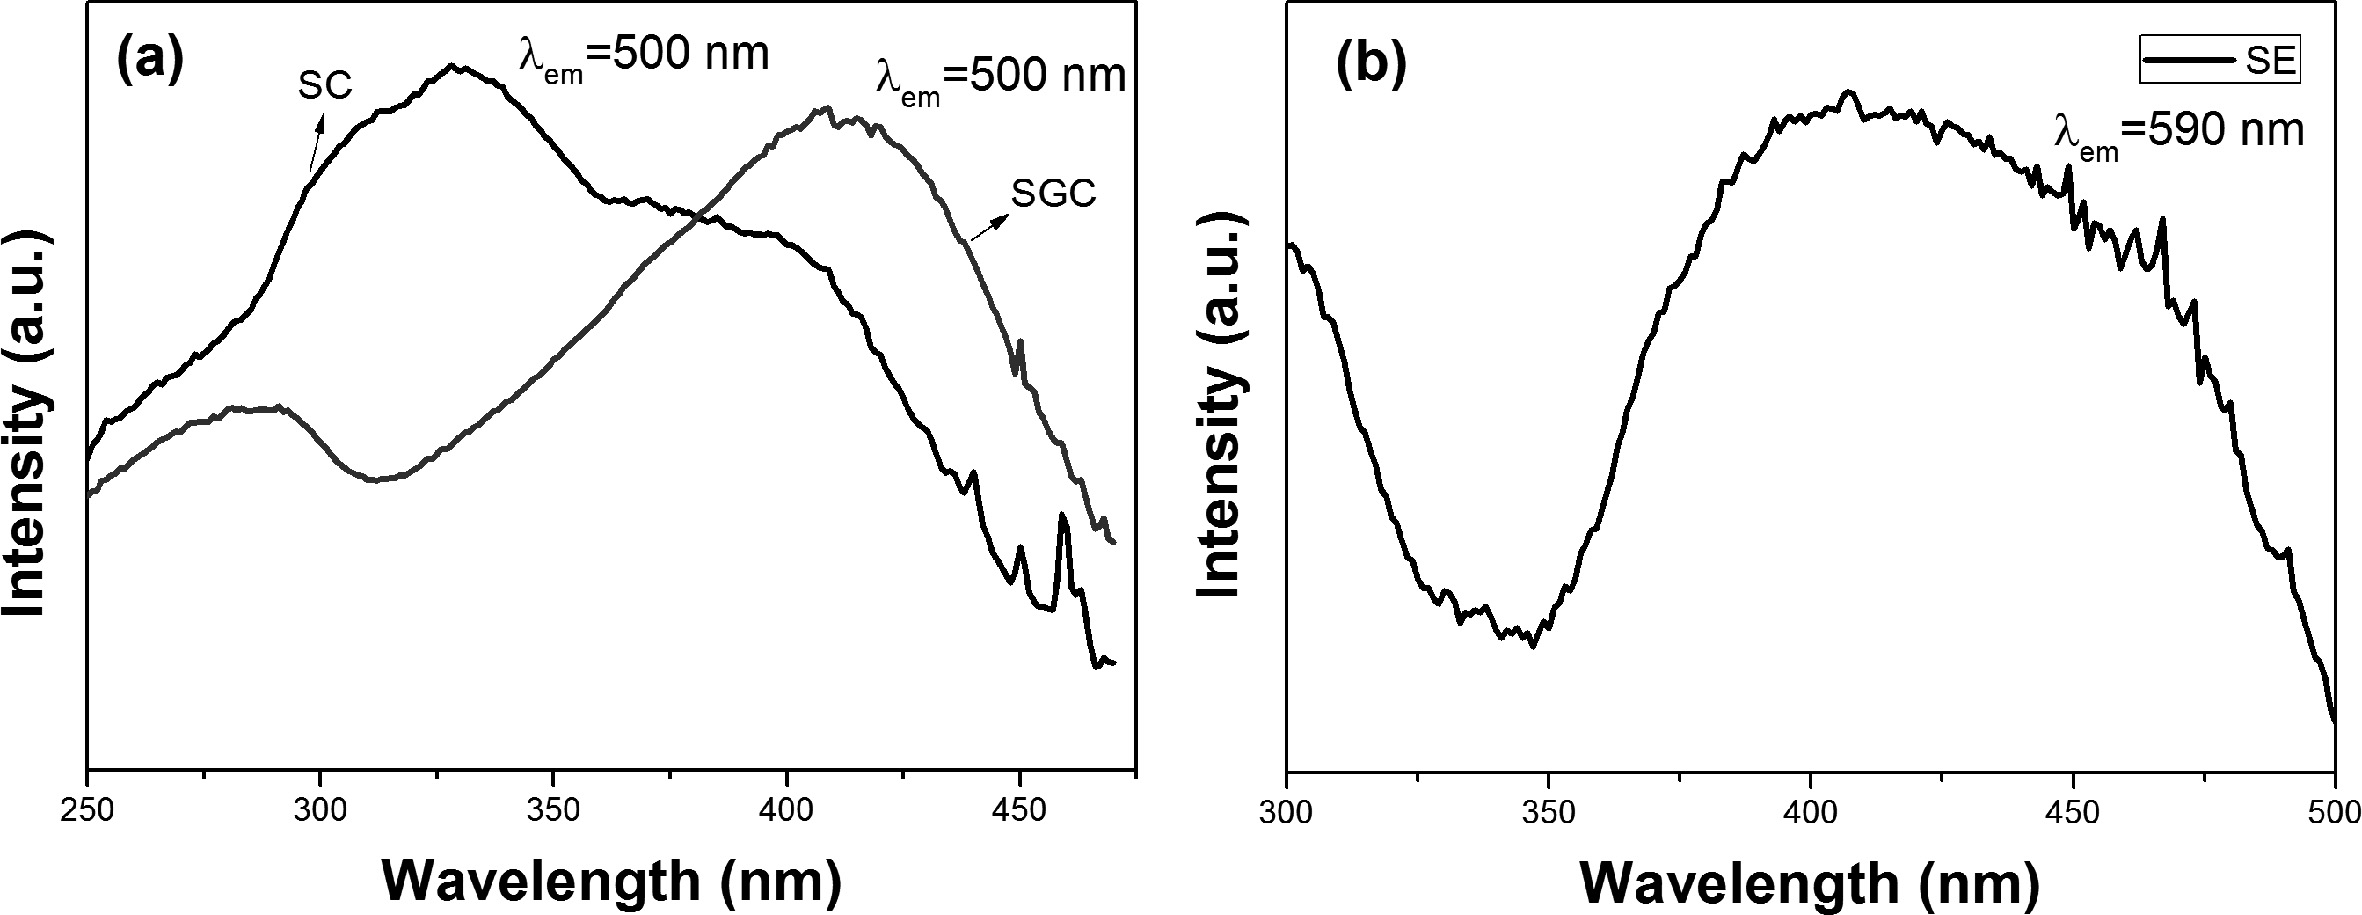
Fig. 4(a) shows the excitation spectra of SC and SGC. The sample SC has the highest
excitation peak at 330 nm and covered the broad range from UV to violet region.
Whereas the sample SGC shows different excitation spectra than SC, and the peak
was redshifted to a bluish region. The main excitation peak was observed around
400 nm and extended to the blue spectrum. The excitation spectrum of SE is
shown in Fig. 4(b). The excitation spectrum is broader than SC and SGC
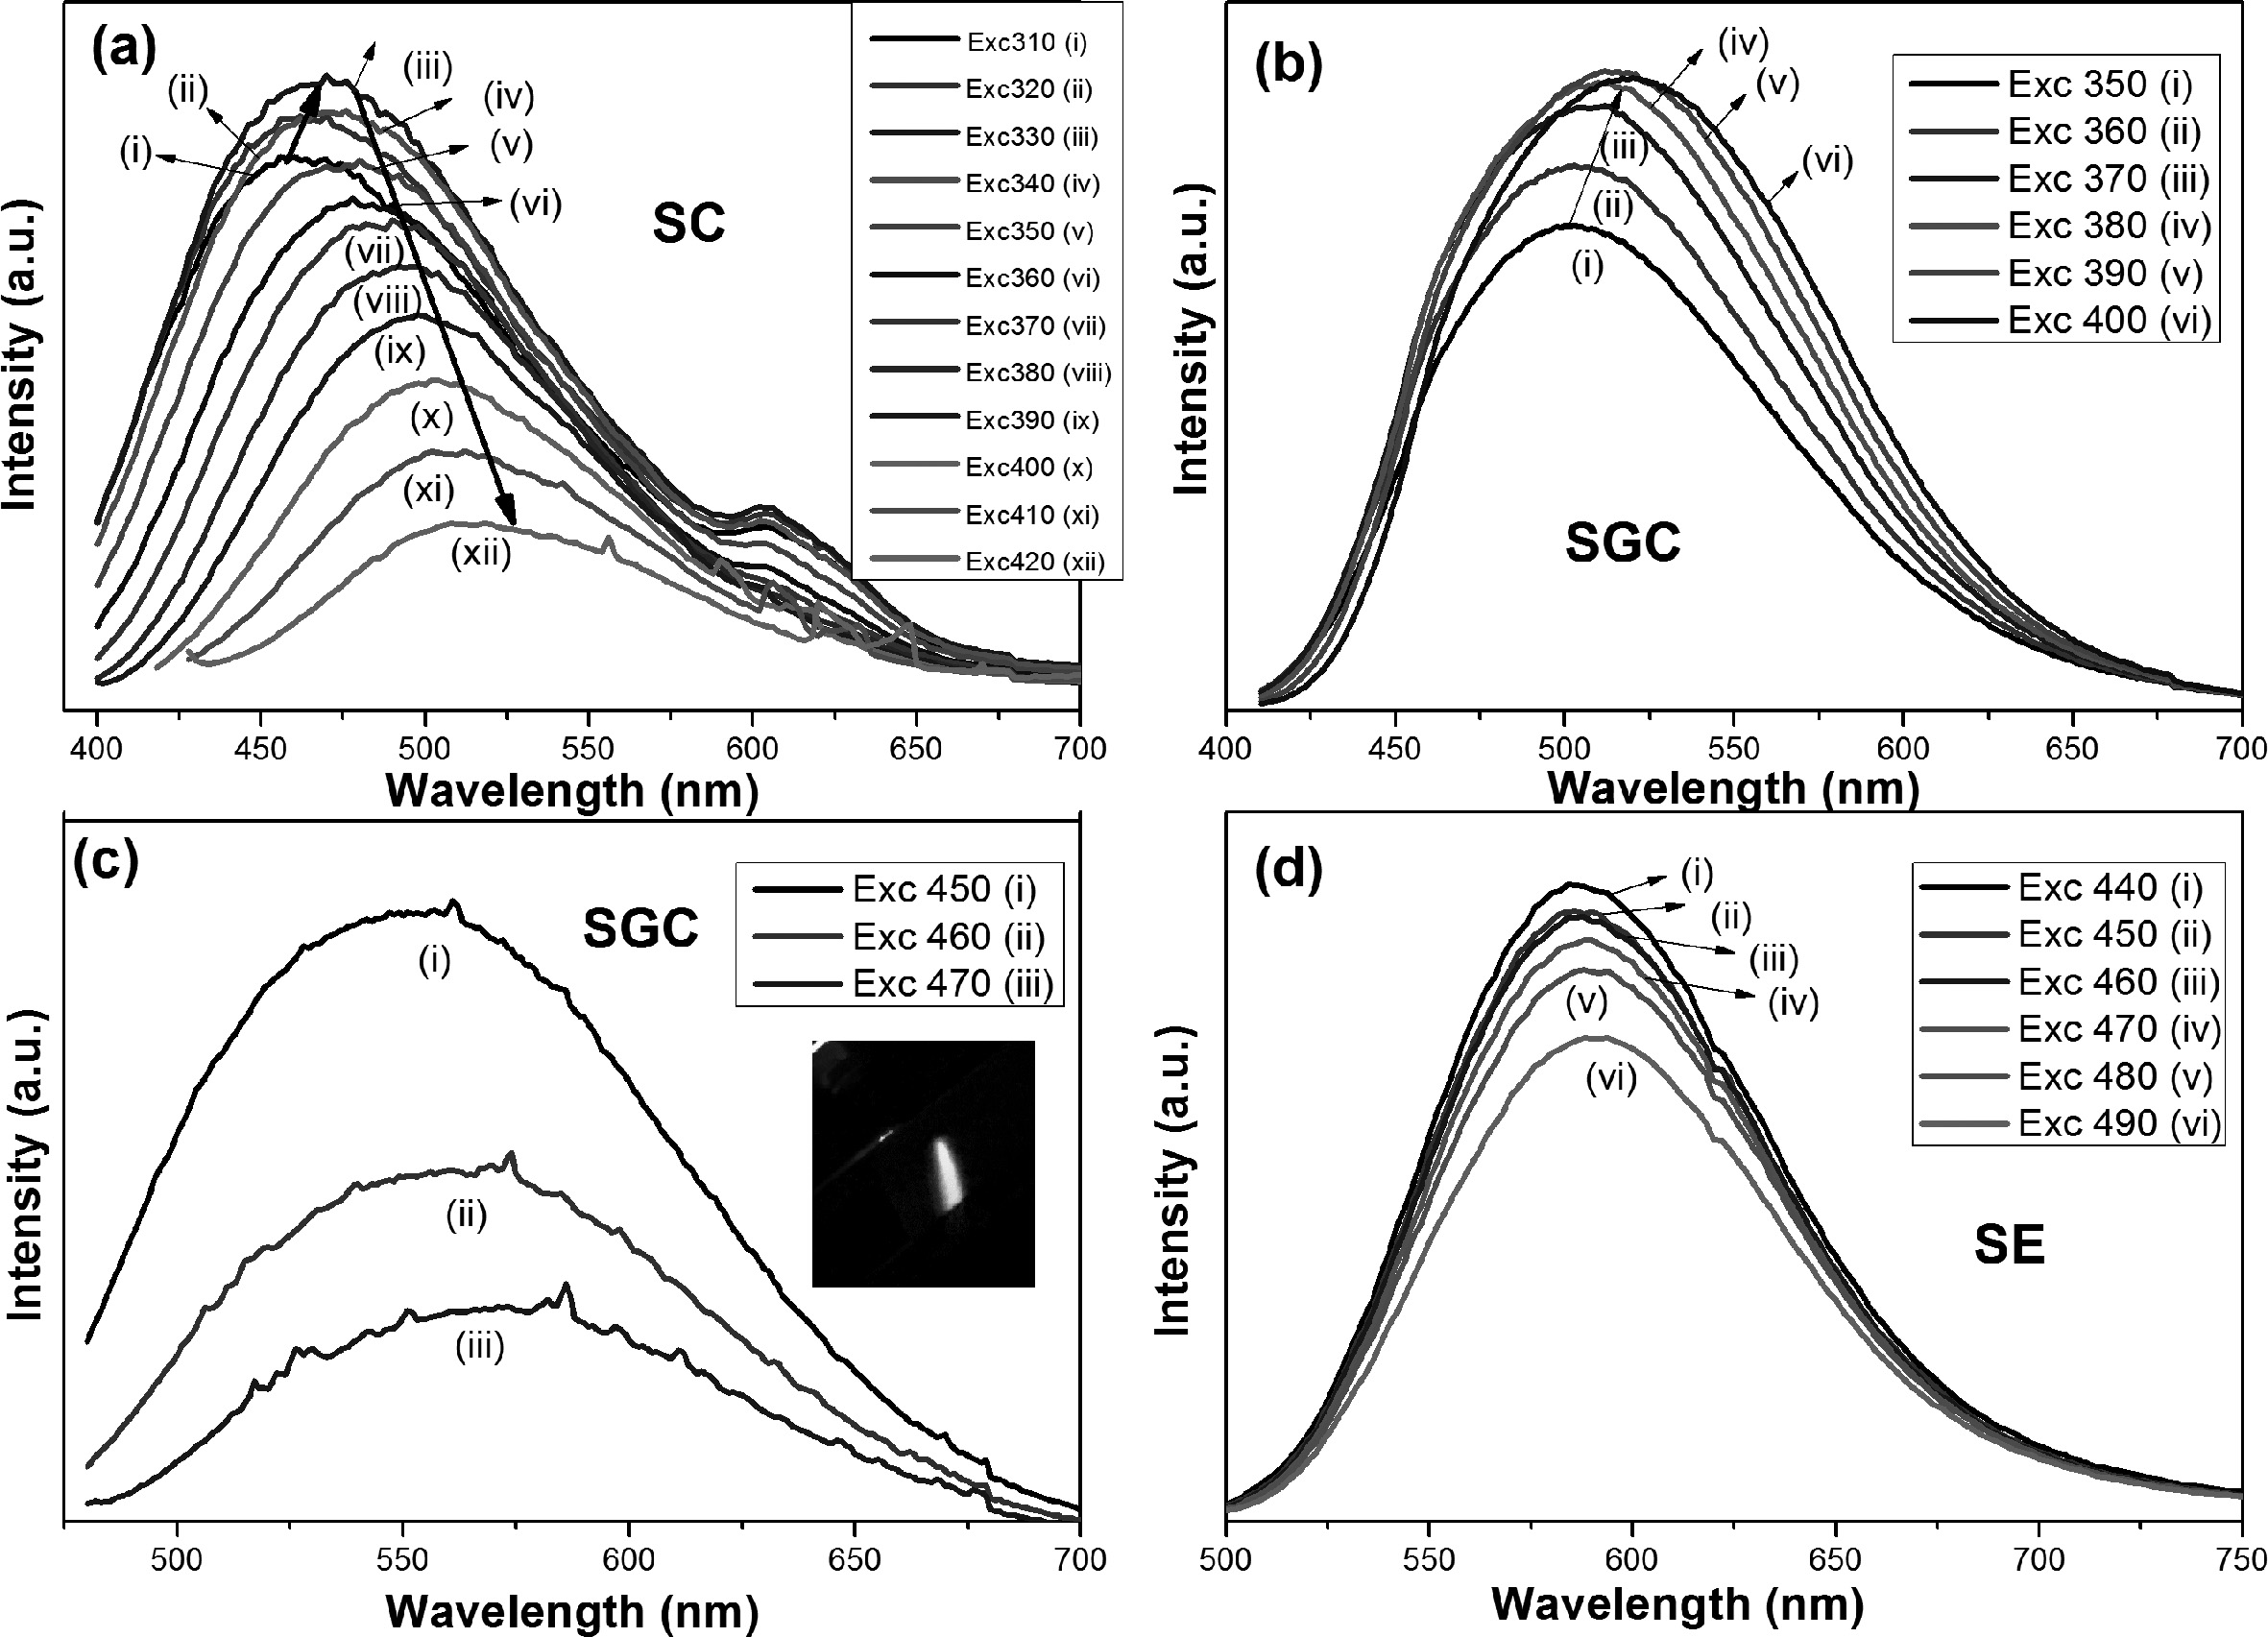
samples, which covers more in the blue region. Fig. 5(a) shows the luminescence spectra of
sample SC from blue to green emissions. Different
excitation wavelengths from 310-420 nm were
used. The emissions were redshifted
with increasing the excitation wavelength. The excited
samples had broadband emission from 420 to 600 nm wavelengths with bluish-green
emission. The highest emission was achieved when excited by 330 nm wavelength
(Fig. 5(a)), which is congruent with the excitation spectrum of SC (Fig. 4(a)). The quenching of the emission
occurred when excited beyond 330 nm. Around 600 nm, small emissions were
observed with lower wavelength excitation, which may be due to the impurity
phase that exists in SC. The emission might be from the yttrium silicon
nitride/oxynitride phase with cerium ion. There are reports on luminescence
from Y6+x/3Si11-yAlyN20+x-yO1-x+y:
Ce3+ and Ce3+-doped Y3Si5N9O
having orange emission [19, 20].
The redshift of emissions was also observed for SGC as
increasing the excitation wavelengths (Fig. 5(b)). Greenish-yellow luminescence
was observed in SGC. The highest emission was observed when excited with 390
nm wavelength and is congruent with the excitation spectrum of
SGC (Fig. 4(a)). Comparing the emissions of SC and SGC excited at 390 nm, the
emission wavelength was redshifted with a difference of 20 nm. Moreover, the
SGC was further excited with blue light (450-470 nm), and the emissions were
observed at 555 nm (Fig. 5(c)), whereas the SC was not excited with these
wavelengths. The sample SE has shown emission in the orange region, and the
redshift was not observed on increasing the excitation wavelength (Fig. 5(d)). The broad emission of
the sample SE suggests that the emission was due to the 4f-5d transition. The precursor, Eu2O3, used had
(III) oxidation state, which was
reduced to (II) oxidation state during the fabrication of Sialon phosphor [10]. The sharp emissions of
f-f transition for Eu3+ were not observed in the emission spectra
(Fig. 5(d)) also confirmed the reduction of Eu3+ to Eu2+.
The broad excitation band corresponds to 4f7→4f65d
transition of Eu2+ (Fig. 4(b)). The broad emission centered at 590
nm as excited by blue wavelengths
(440-490) was due to the allowed 4f65d→4f7
transition of Eu2+ [11].
The addition of Gd3+ ion in YAG: Ce reported by
Chen et al. [24] also exhibited a redshift in emission. There are also reports
on Ce3+ doped Sialon phosphor powders with different emissions, but
the redshifting of emissions with increasing the excitation wavelength was not
reported. The co-doping of different stabilizing cations such as Y3+
and Ca2+ along with Ce3+ gives emissions in blue and
green regions, respectively, as reported by Krevel et al. [16]. As observed
from the inset in Fig. 3, the color of the SGC is yellowish-green, which is originated
from the absorption by Gd3+ and Ce3+ in the blue region.
Also, the SGC had higher α-phase than SC, and thus higher Ce3+
should be incorporated along with Gd3+ in the α-Sialon matrix.
The ground state electronic configuration of Ce3+
was taken into account to explain the redshift of emissions while
increasing the excitation wavelength. The electronic
configuration 4 f 1 has two 2F7/2 and
2F5/2 manifolds separated by ~2,000 cm-1
showing two emissions within the broad
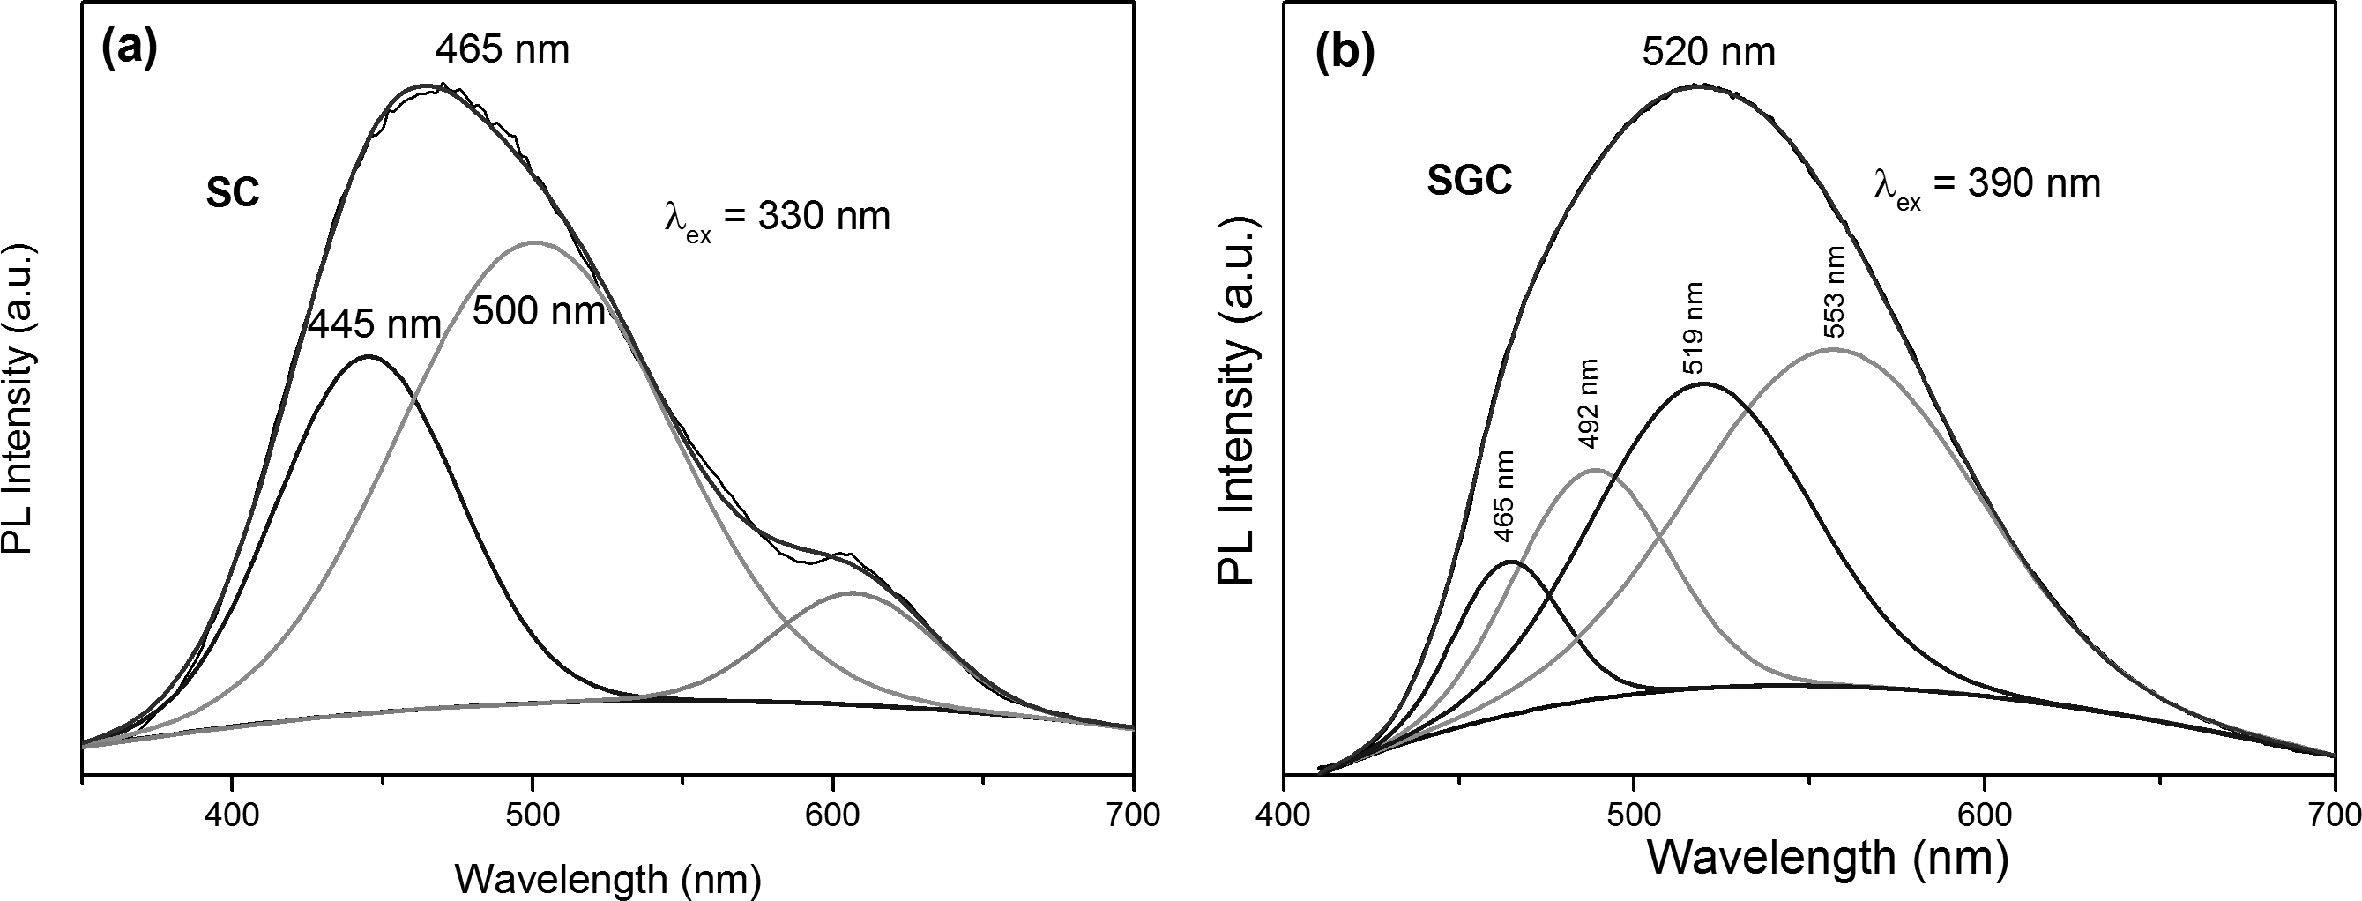
emission band [14]. The Gaussian deconvolution of
sample SC (Fig. 6(a)) excited at the lower wavelength (330 nm)
shows two main emissions at 445 nm and 500 nm, which
have an energy difference of 2,000 cm-1.
The other deconvoluted peak at 603 may be from the impurity phase in SC.
Similarly, the SGC emission excited at 390 nm was deconvoluted (Fig. 6(b)) and
four emissions at 465 nm, 492 nm, 519 nm, and 553 nm were observed. In the SGC
sample, the amount of Ce3+ was higher than the SC sample. Therefore,
interstitial doping of Ce3+ in the α-Sialon phase is also higher.
The Ce atom is bonded to nitrogen atoms and oxygen atoms. The number of
nitrogen and oxygen bonded to Ce atom in α-Sialon changes the crystal field
splitting strength. The four fitted peaks were also reported by Wang et al.
[25]. The energy difference of 465 nm and 519 nm, as well as 492 nm and 553 nm,
were around 2000 cm-1.
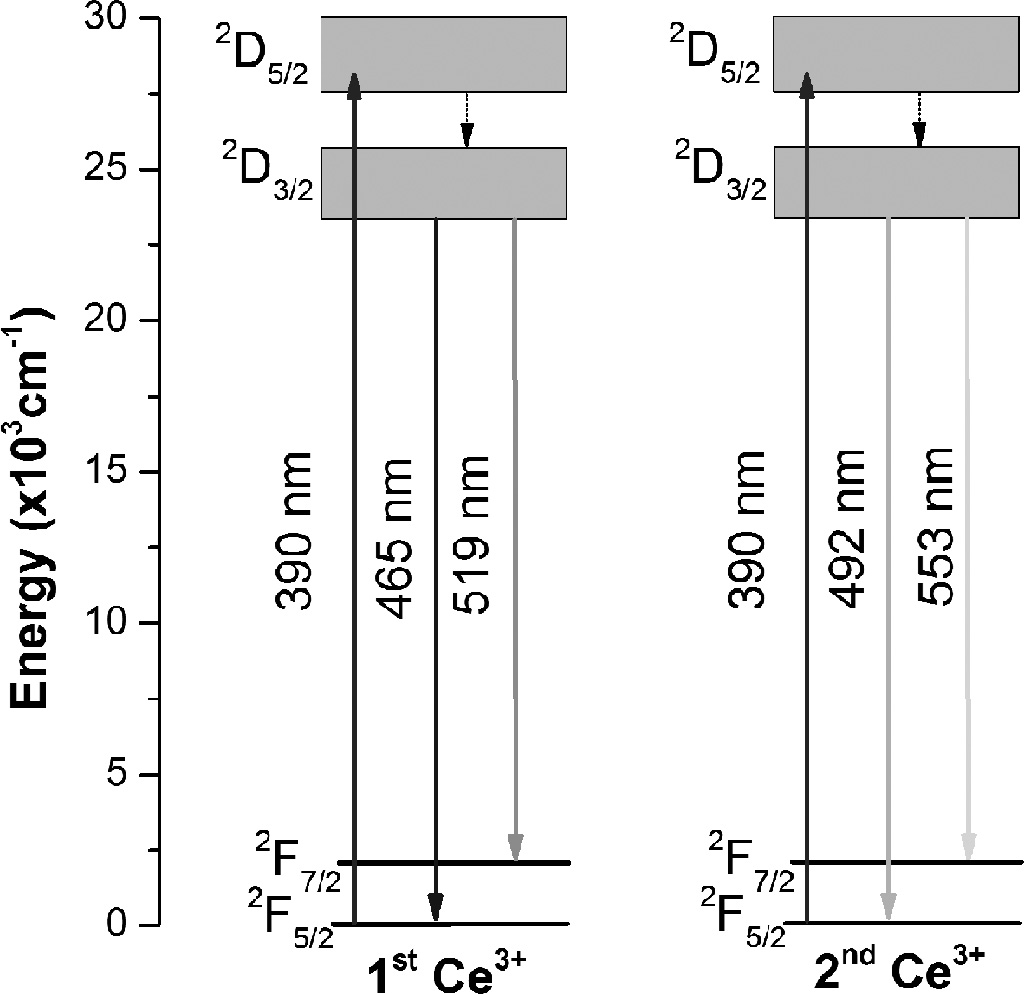
Both samples had an energy difference of approximately ~2,000 cm-1,
which matches the energy difference of 2F7/2
and 2F5/2 states of Ce3+. Thus the shift in
emission can be attributed to the 2F7/2 and 2F5/2
ground states. The energy level diagram of Ce3+
in SGC is shown in Fig. 7. In blue light excitations, the
yellowish-green emission becomes more prominent, as seen in
Fig. 5(c). Therefore, the 4f ground state of Ce3+ is split into two 2F7/2
and 2F5/2 states, and bluish-green emission arose from
the 2D3/2→2F5/2 transition, whereas
the yellowish-green emission was originated from 2D3/2→2F7/2
transition.
The excitation with higher energy UV light had 2F5/2 →2D5/2
transition, whereas the low energy blue light with 2F5/2→2D3/2
transition. The prominent bluish-green emission with UV excitation was observed
from the radiative 2D3/2→2F5/2
transition. Similarly, the yellowish-green emission was seen with blue light irradiation due to the 2D3/2→2F7/2
transition. The redshift of emission in sample SGC as compared to SC can be
corroborated to the large cationic size of Gd3+ ion as compared to Y3+.
The large cationic size of Gd3+ ion shortened the Ce-N/O distance
and increased the crystal field splitting [26].
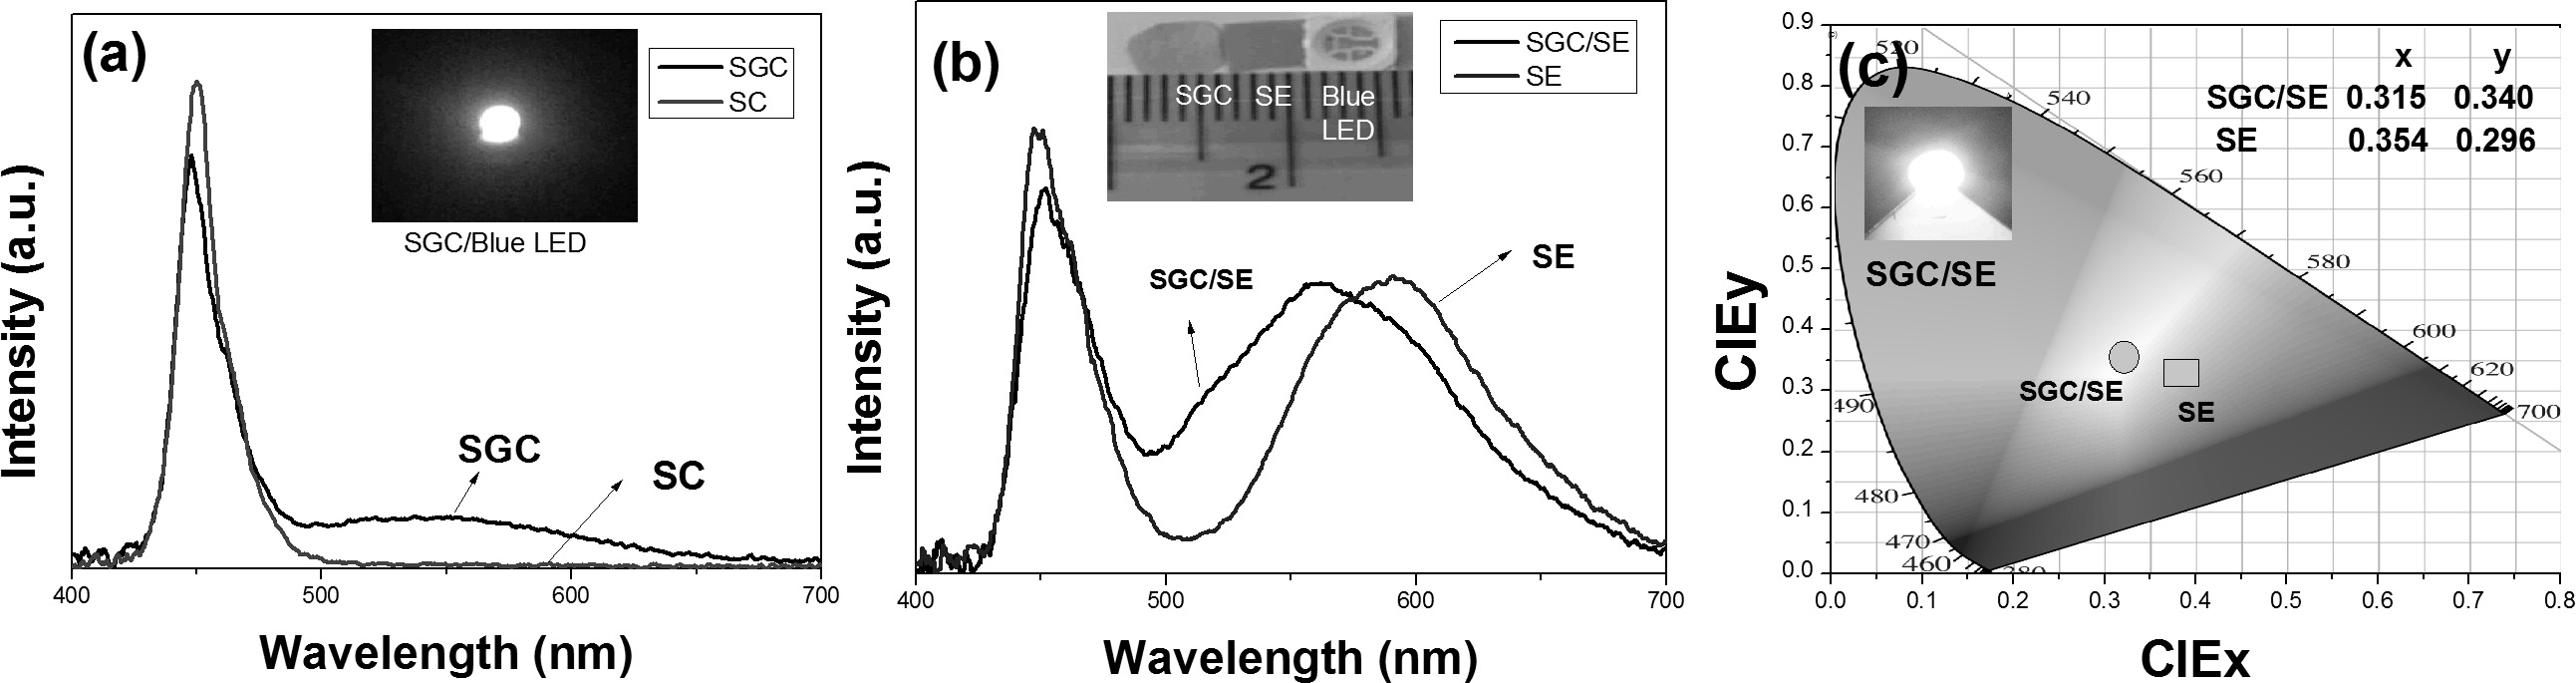
The PCPs were placed on the blue LED with 455 nm
wavelength. The spectral distribution curves are shown in Fig. 8(a). The sample
SGC shows greenish-yellow emission while there is no emission with sample SC.
Greenish-yellow emission of SGC can be combined with orange emission that can
cover a wide visible spectrum to get white light. To obtain a wide emission,
the SGC PCP was combined with transparent SE PCP. A wide spectrum from blue to
red centered at 560 nm (yellow) was obtained for dual plates with sample
SGC/SE, as observed in Fig. 8(b). The luminous efficacies of SGC/SE and SE had
50 lm/W and 46 lm/W, respectively. As seen from the CIE co-ordinates in Fig.
8(c), the dual plates (SGC/SE) is near to the white region. The
color co-ordinate temperatures were measured as 4,189 K
and 6,292 K for SE plate and SE/SGC dual plate, respectively.
|
Fig. 1 XRD patterns of different samples with standard samples for comparison. |
|
Fig. 2 SEM images of fracture surfaces of samples showing the grain morphology; (a) SGC and (c) SC. EDS analysis of fracture surfaces;
(b) SGC and (d) SC. |
|
Fig. 3 Transmittance spectra of polished Sialon ceramics, and
inset is the optical image of 0.1 mm thickness samples. |
|
Fig. 4 (a) Excitation spectra of samples SC and SGC. (b) Excitation spectrum of SE. |
|
Fig. 5 (a) Emission spectra with different excitation wavelengths from 310-420 nm for sample SC, (b) emission spectra of SGC with
different excitation wavelengths (350-400 nm), (c) emission spectra of SGC excited from 450-470 nm and inset image showing greenishyellow emission excited by blue light, and (d) the emission spectra of SE excited from 440 -490 nm. |
|
Fig. 6 Deconvoluted emission spectra of samples excited by 390 nm wavelength; (a) SC and (b) SGC. |
|
Fig. 7 Schematic energy levels diagram of Ce3+ in SGC. |
|
Fig. 8 (a) Spectral distribution curves for samples SC and SGC as excited by blue LED (455 nm), (b) Blue LED excited luminescence from
dual plates, and (c) CIE chromaticity diagram showing the color co-ordinates for dual plates with CIE co-ordinate values. |
In conclusion, the greenish-yellow emitting transparent
Sialon phosphor ceramic plates were fabricated by the hot press sintering
method. The α/β-composite Sialon and α-Sialon PCPs with Ce3+ doping
show green emission, and the latter sample shows greenish-yellow emission with
blue excitation. The sample having Gd3+ ion as a stabilizer had
higher transparency, and emission shifted to the yellow region as compared to
the Y3+ stabilized sample. The blue light excited broad emission
with greenish-yellow emission was achieved with Gd3+ co-doping with
Ce3+ ion. Also, the optical properties of Eu3+ doped
Sialon were investigated. Moreover, the dual plates show a wider spectrum near
to the white region of the CIE chromaticity diagram.
- 1. S. Pimputkar, J.S. Speck, S.P. DenBaars, and S. Nakamura, Nat. Photonics 3 (2009) 180-182.
-

- 2. H. Segawa, S. Ogata, N. Hirosaki, S. Inoue, T. Shimizu, M. Tansho, S. Ohki, and K. Deguchi, Opt. Mater. 33 (2010) 170-175.
-
- 3. X. Zhang, J. Yu, J. Wang, B. Lei, Y. Liu, Y. Cho, R.J. Xie, H. W. Zhang, Y. Li, Z. Tian, Y. Li, and Q. Su, ACS Photonics 4 (2017) 986-995.
-
- 4. S. Li, L. Wang, N. Hirosaki, and R.J. Xie, Laser Photonics Rev. 12 (2018) 1800173.
-
- 5. S. Li, Q. Zhu, D. Tang, X. Liu, G. Ouyang, L. Cao, N. Hirosaki, T. Nishimura, Z. Huang, and R.J. Xie, J. Mater. Chem. C 4 (2016) 8648-8654.
-
- 6. B. Joshi, G. Gyawali, H. Wang, T. Sekino, and S. W. Lee, J. Alloy. Compd. 557 (2013) 112-119.
-
- 7. Y.J. Park, J.M. Kim, and J.W. Lee, J. Ceram. Process. Res. 16 (2015) 578-583.
- 8. B. Joshi, G. Gyawali, and S.W. Lee, Lett. Mater. 10 (2020) 158-163.
-
- 9. H.L. Li, N. Hirosaki, R.J. Xie, T. Suehiro, and M. Mitomo, Sci. Technol. Adv. Mater. 8 (2007) 601-606.
-
- 10. B. Joshi, Y.K. Kshetri, G. Gyawali, and S.W. Lee, J. Alloy. Compd. 631 (2015) 38-45.
-
- 11. B. Joshi, J. S. Hoon, Y.K. Kshetri, G. Gyawali, and S.W. Lee, Ceram. Inter. 44 (2018) 23116-23124.
-
- 12. B. Joshi, and S.W. Lee, J. Rare Earths 33 (2015) 1142-1147.
-
- 13. B. Joshi, Y.K. Kshetri, G. Gyawali, and S.W. Lee, J. Ceram. Process. Res. 17 (2016) 197-201.
- 14. H.L. Li, G.H. Zhou, R.J. Xie, N. Hirosaki, X.J. Wang, and Z. Sun, J. Solid. State Chem. 184 (2011) 1036-1042.
-
- 15. L. Gan, F.F. Xu, X.H. Zeng, Z.S. Li, Z.Y. Mao, P. Lu, Y.C. Zhu, X.J. Liu, and L.L. Zhang, Nanoscale 7 (2015) 11393-11400.
-
- 16. J.W.H. van Krevel, J.W.T. van Rutten, H. Mandal, H.T. Hintzen, and R. Metselaar, J. Solid. State Chem. 165 (2002) 19-24.
-
- 17. D.J. Devlin, and K.E. Amin, Powder Diffr. 5 (1990), 121-124.
-
- 18. W. He, Q. Liu, and H. Zhong, Mater. Sci. Eng., A 528 (2011) 8359-8364.
-
- 19. W. B. Park, S. P. Singh, M. Pyo, and K.S. Sohn, J. Mater. Chem. 21 (2011) 5780-5785.
-
- 20. Q.Q. Zhu, L. Wang, N. Hirosaki, L.Y. Hao, X. Xu, and R.J. Xie, Chem. Mater. 28 (2016) 4829-4839.
-
- 21. C.P. Gazzara, and D.R. Messier, Amer. Ceram. Soc. Bull. 56 (1977) 777-780.
- 22. Z. Mencik, M. Short, and C. Peters, Adv. X-Ray Anal. 23 (1979) 375-379.
-
- 23. B. Joshi, B. Li, Y.K. Kshetri, H. Wang, and S.W. Lee, Ceram. Int. 40 (2014) 13041-13047.
-
- 24. J. Chen, Z. Deng, Z. Liu, Y. Lin, D. Chen, B. Fei, C. Wang, F. Wang, Q. Hu, and Y. Cao, Opt. Express 23 (2015) A292-A298.
-
- 25. Q. Wang, Z. Ci, G. Zhu, M. Que, S. Xin, Y. Wen, and Y. Wang, ECS J. Solid State Sci. Technol. 1 (2012) R92-R97.
-
- 26. Y. Du, C.Y. Shao, Y.J. Dong, Q.H. Yang, and W. Hua, Chinese Phys. B 24 (2015) 117801.
-
 This Article
-
2020; 21(6): 705-711
Published on Dec 31, 2020
- 10.36410/jcpr.2020.21.6.705
- Received on Jul 23, 2020
- Revised on Sep 7, 2020
- Accepted on Oct 2, 2020
Services
Shared
Correspondence to
- Bhupendra Joshi and Gobinda Gyawali
-
Department of Fusion Science and Technology, Sun Moon University, Chungnam 31460, Republic of Korea
Tel : +82-41-530-2882 Fax: +82-41-530-2840 - E-mail: joshibhupen@sunmoon.ac.kr , ggobinda@sunmoon.ac.kr
Clean-Energy Research Institute(CRI), Hanyang University, 222, Wangsimni-ro, Seongdong-gu, Seoul, 04763, Korea
E-mail: jcpr@hanyang.ac.kr