


- Tetrasodium iminodisuccinate assisted hydrothermal synthesis and upconversion luminescence of NaYF4: Yb3+, Er3+ hexagonal nanoplates
Haiyan Lin#, Zikun Wang#, Yujiang Wang and Junwei Zhao*
Materials Science and Engineering School & Henan Key Laboratory of Special Protective Materials, Luoyang Institute of Science and Technology, Luoyang, 471023, P. R. China
Yb3+/Er3+
co-doped NaYF4 (NaYF4: Yb3+, Er3+)
hexagonal nanoplates were synthesized by a tetrasodium iminodisuccinate assisted
hydrothermal synthesis method for the first time. The crystal structure and
morphology was investigated by the X-ray diffraction and scanning electron
microscope analysis. The upconversion luminescent property of the synthesized
NaYF4: Yb3+, Er3+ hexagonal nanoplates was
discussed as a function of Yb3+ and Er3+ concentration.
Under 980 nm excitation, NaYF4: Yb3+, Er3+
hexagonal nanoplates exhibited strong red emissions near 660 nm and green
upconversion emissions at 530 and 550 nm corresponding to the intra 4f
transitions of Er3+ (4F9/2, 2H11/2,
4S3/2) → Er3+ (4I15/2).
The Yb3+ 5 mol% and Er3+ 0.5 mol% co-doped NaYF4
sample exhibited strongly shiny upconversion emission, which was considered to
be the optimum doping concentration. A possible upconversion mechanism for NaYF4:
Yb3+, Er3+ depending was discussed in detail.
Keywords: hydrothermal, NaYF4, upconversion, IDS
In the past decades, upconversion luminescent (UCL)
nanomaterials doped with rare earth ions have become one of the research
focuses in the field of materials and luminescence [1-12]. UCL
nanomaterials have potential promising applications in many
fields, such as optical communication, luminescence display, high density
storage, infrared detection and biomedical imaging [13-15]. Up to now, rare
earth ions have been doped in many matrix materials and UCL has been
successfully realized [16]. The transition of electrons in the 4f shell of rare
earth ions induces narrow band luminescence, which are very sensitive to the
composition and crystal structure of the matrix materials [1, 10, 16]. Er3+
has been considered to be an ideal doping ion to realize infrared to visible
UCL owing to its good matching energy level and long excited state lifetime
[17]. Compared with Er3+, Yb3+ has a
larger optical absorption cross section in the infrared
wavelength, which can effectively transfer the absorbed light energy to Er3+
[18, 19]. Therefore, as a sensitizer, Yb3+ can effectively increase
the emission efficiency of the luminescence center [20-24]. Rare earth ions are
easy to cause multiphonon relaxation due to their abundant energy levels and
small energy gap between energy levels [25]. Therefore, materials with
relatively low phonon energy being used as the matrix can effectively reduce
the luminescence loss caused by the non-radiative process [9]. This is
particularly important for the upconversion process, which is related to the fluorescence quenching
because of high energy vibration. The phonon energy of fluoride is much lower
than that of oxide. The multiphonon relaxation of rare earth ions can be
reduced by using fluoride as matrix material [9]. Among them, the rare earth
ion UCL materials based on NaYF4 are found to be of high efficiency
in recent years [1, 25, 26].
In the past years, there have been many reports on
upconversion materials based on NaYF4 [9]. In order to effectively
control the nucleation and growth process of nanocrystals by wet chemical
method, it is often necessary to introduce organic reagents as ligands or
chelators in the synthesis process [27, 28]. In this paper, NaYF4:
Yb3+, Er3+ hexagonal nanoplates with UCL
were prepared by coprecipitation and hydrothermal method using
tetrasodium iminodisuccinate (IDS Na4) as chelating
agent and NaF as precipitant. The influence of Yb3+
and Er3+ concentration on the upconversion luminescence
of NaYF4: Yb3+, Er3+ hexagonal nanoplates was
studied in detail. A possible upconversion mechanism for NaYF4:
Yb3+, Er3+ hexagonal nanoplates was proposed. The results
provide new insights for the research of other upconversion luminescent
materials.
Firstly, the rare earth nitrate mixed aqueous solution
(molar ratio, Y: Yb: Er = 89 : 10 : 1, 10 mL, 0.1 mol/L) was added into an IDS
Na4 aqueous solution (10 mL, 0.1 mol/L) under magnetic stirring, and
the reaction lasted for half an hour to obtain the chelate complex of rare
earth ions and IDS Na4. Then the NaF aqueous solution (20 mL, 0.4
mol/L) was injected into the above reaction system, and the reaction lasted for
one hour to obtain the precursor solution. After that, the reactant solution
was transferred to a hydrothermal reactor, and the hydrothermal reaction was
performed at 180 oC for 15 h. The obtained samples
were centrifuged at 3,500 rpm for 15 min, and the precipitates were
retained. Finally, the samples were dried in an oven at 60 ºC
for 24 h to obtain the final products. The synthesis process of
other doping concentrations is similar.
The crystal structure was characterized by X-ray
diffraction (XRD, Y-4Q, CuKα, λ = 1.5418 Å). The morphology and
particle size of the products were observed by scanning electron microscope
(SEM, FEI Quanta 250 FEG). UCL spectra were measured in the range of 500-800 nm
using a photoluminescence spectrophotometer
(PerkinElmer, LS55) with a semiconductor laser diode
(980 nm, 3W) as an external excitation source.
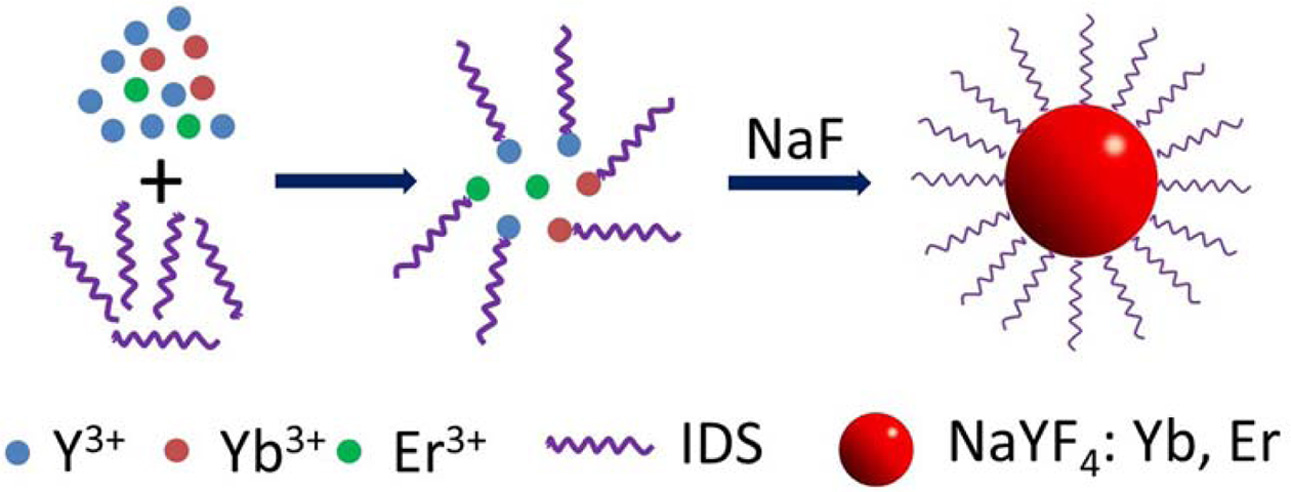
The synthesis process of NaYF4:Yb, Er phosphors
is illustrated in Fig. 1. In our case, the chelate complex of rare earth ions
and IDS Na4 (Ln-IDS) was formed at the beginning. After the addition
of NaF aqueous solution, the F− anion must compete with the
chelating agent to transform the Ln-IDS complex into the NaYF4
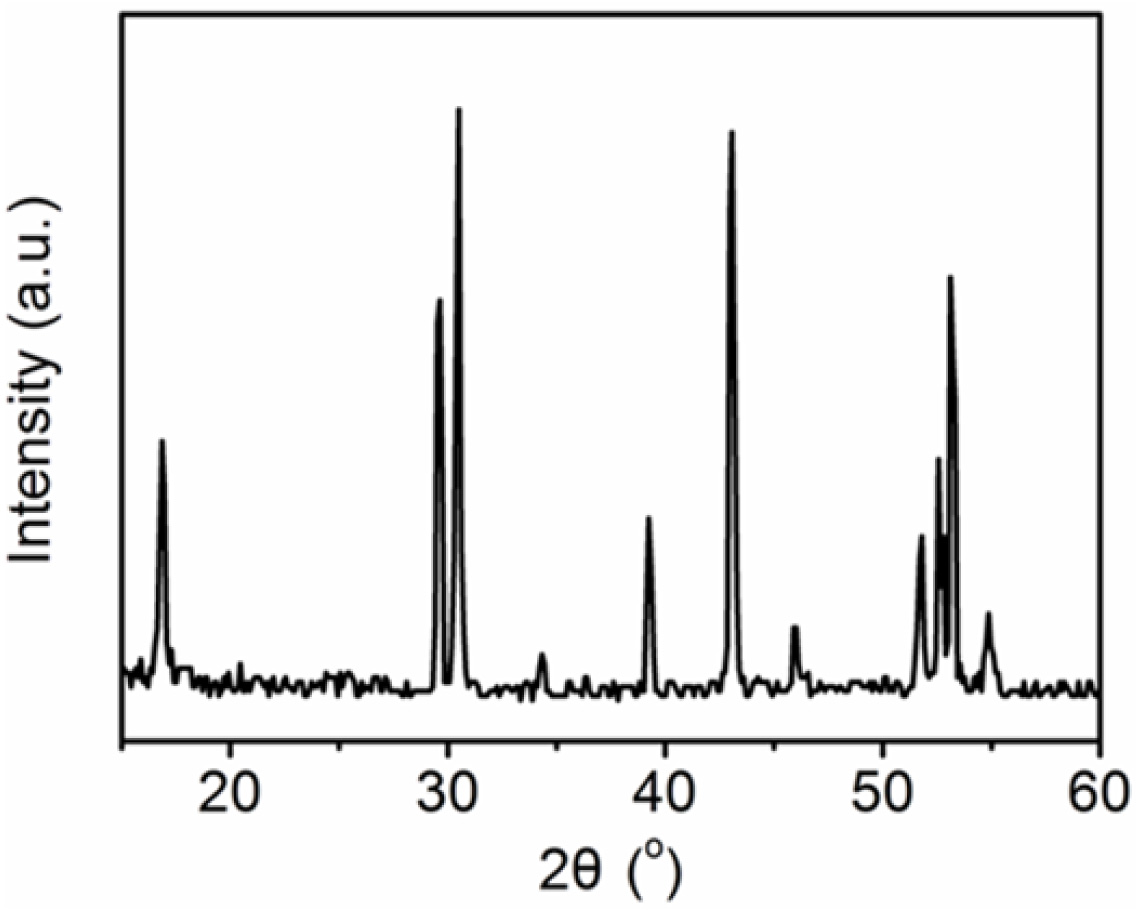
lattice. Fig. 2 shows the representative XRD pattern of NaYF4: Yb3+,
Er3+ phosphors. As shown in Fig. 2, the XRD peaks were in accordance
with that of hexagonal β-NaYF4 (JCPDF card 28-1192) [17, 28]. There
are no diffraction peaks corresponding to impurities of α-NaYF4 (JCPDS card
77-2042), indicating the high purity of the as-obtained products. The XRD
pattern of the sample shows clear and sharp peaks, which indicate the high crystallinity
of the obtained product.
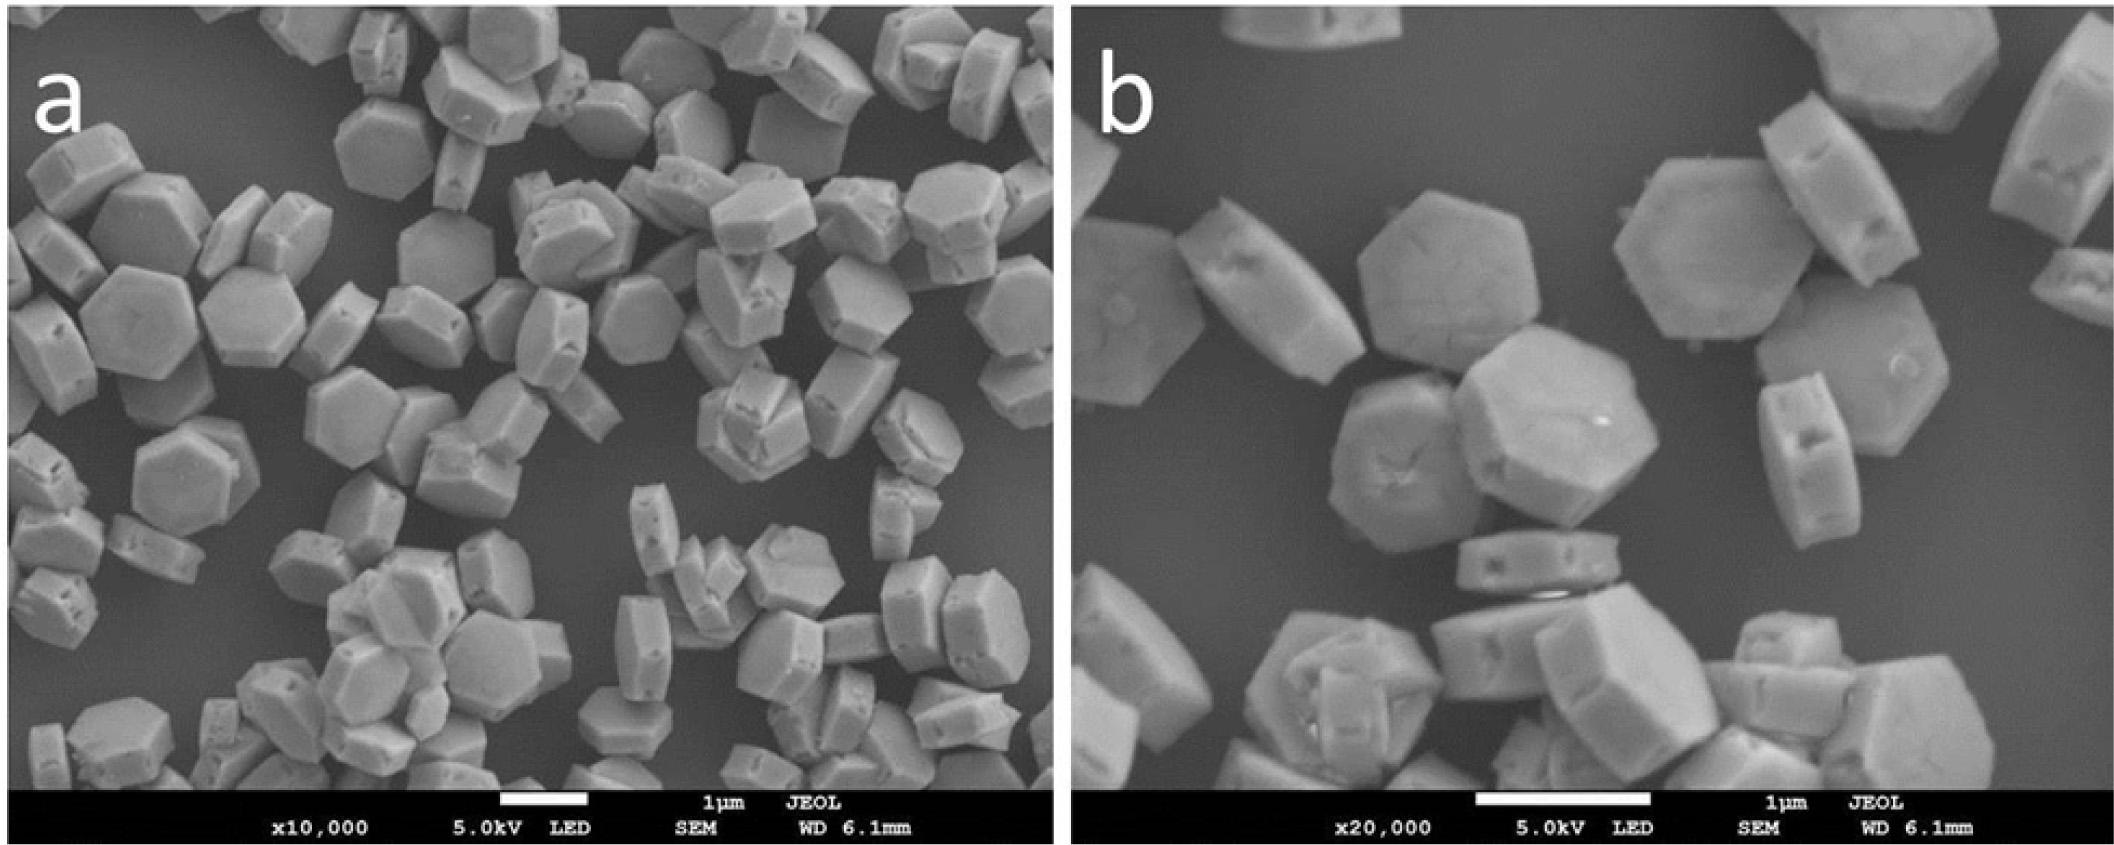
Fig. 3 shows the representative SEM images of NaYF4:
Yb3+, Er3+ phosphors with different magnifications. It is observed that the obtained
NaYF4: Yb3+, Er3+ phosphors are
uniform and monodisperse hexagonal nanoplates. The size is about
500 nm × 220 nm (side length × thickness). In our previous work, we prepared
similar NaYF4: Yb3+, Er3+ hexagonal nanoplates
with trisodium citrate as chelating agent [28]. It is one of the basic
deposition processes that chelating agent (e.g. ethylene diamine tetraacetic
acid disodium salt and trisodium citrate) controls the nucleation and growth of
inorganic structures [27, 28]. In our present case, we used IDS Na4
as chelating agent and obtained similar results. IDS Na4 is a
biodegradable chelating agent, and its chelating capacity can comparable with
that of ethylene diamine tetraacetic acid. Chelating agents coordinate with
metal ions in the synthesis process through amine, carboxyl group, hydroxyl and
other functional groups, and passivate the surface of nano particles after synthesis, which are
effective ligands of the synthesis of inorganic nanomaterials [27, 28]. In this
study, IDS Na4 and rare earth nitrate were incubated under
environmental conditions to form the coordination between Ln3+ and
IDS Na4 and promote heterogeneous nucleation. Then, the freshly
prepared NaF solution was injected into the mixed solution with vigorous
stirring. The mixture underwent hydrothermal crystallization,
and finally NaYF4: Yb3+, Er3+ hexagonal
nanoplates were obtained. In addition, IDS Na4 molecules were coated
on NaYF4: Yb3+, Er3+ to make the products
water-soluble and biocompatible.
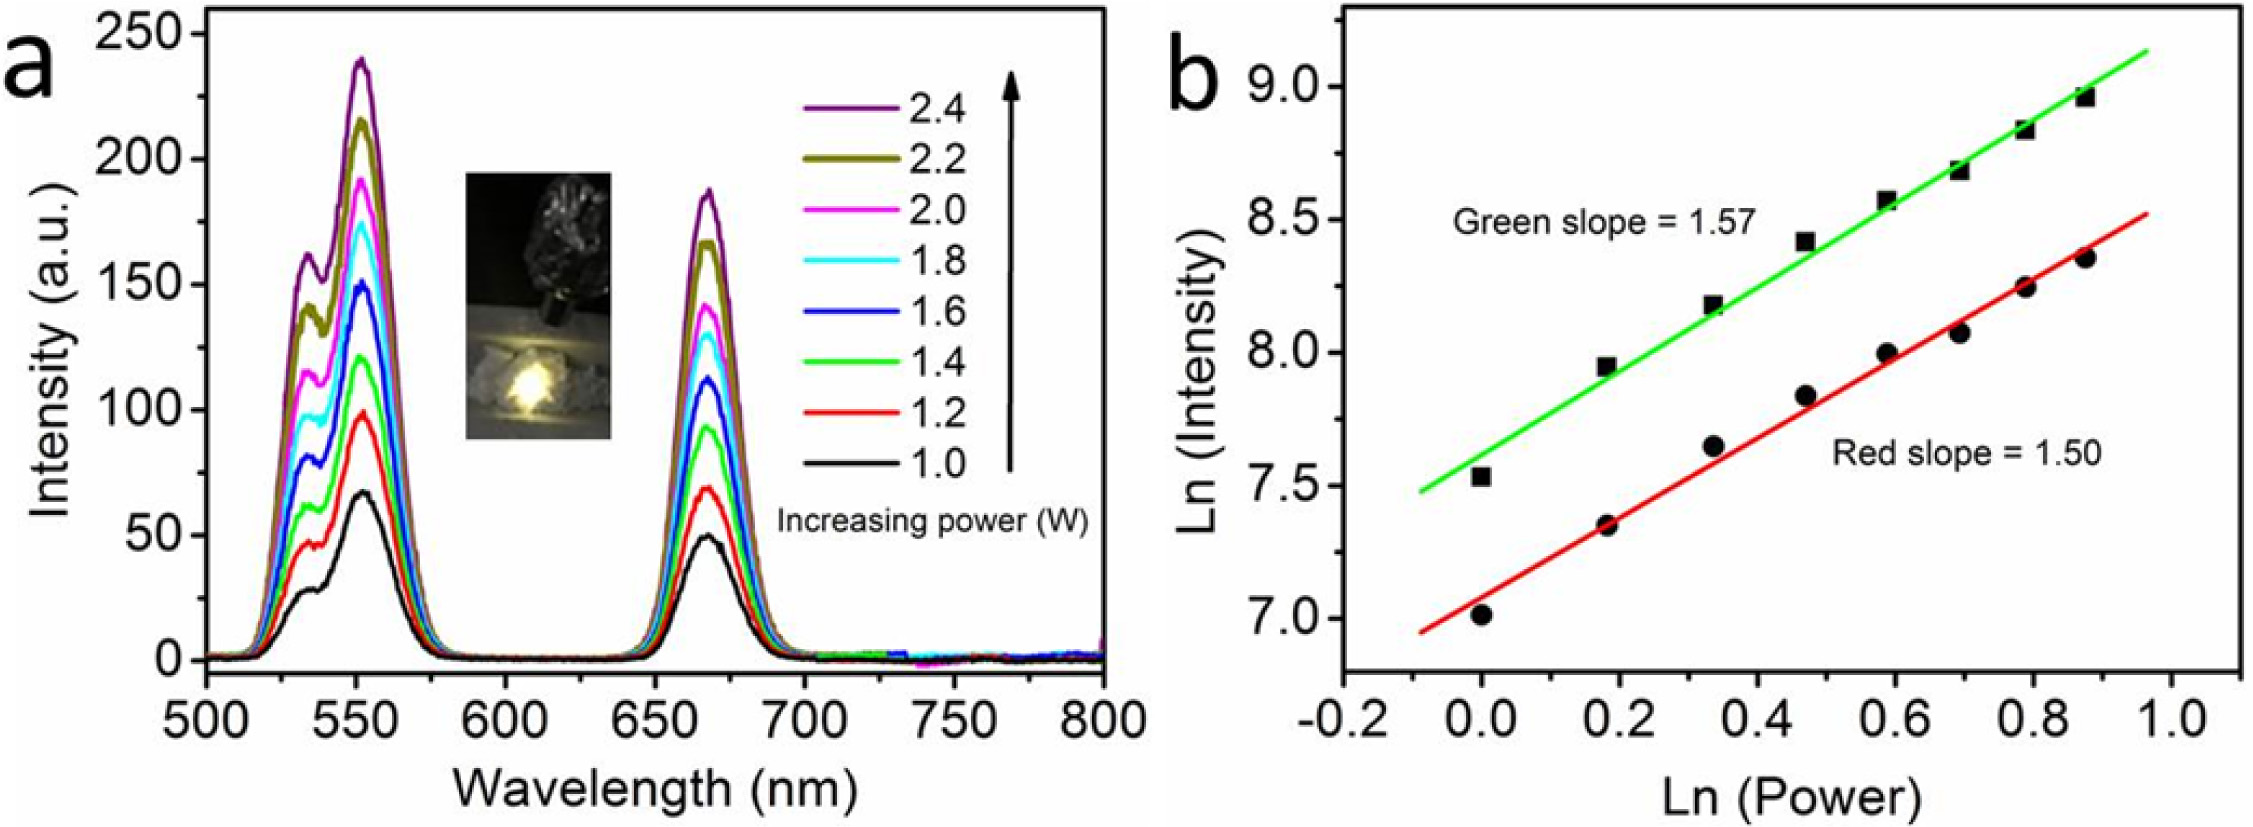
Fig. 4(a) shows the UCL spectra of representative NaYF4:
Yb3+ 5%, Er3+ 0.5% hexagonal nanoplates excited by a 980
nm near-infrared laser. The NaYF4: Yb3+ 5%, Er3+
0.5% hexagonal nanoplates exhibit UCL from infrared to visible emission. The
visible emission bands are around at 530 nm and 550 nm, which originate from
the transition of electrons from 2H11/2 and 4S3/2
to 4I15/2 in Er3+ ions. The emission band near
660 nm is attributed to the transition of 4F9/2 level to 4I15/2
level in Er3+ ions. The emission intensities of green and red bands
of the NaYF4: Yb3+ 5%, Er3+ 0.5% hexagonal
nanoplates increase gradually with the increase of the laser excitation power.
To understand the UCL process and the population of 2H11/2,
4S3/2 and 4F9/2
excited states under infrared wavelength excitation, it is
necessary to study the relationship between laser excitation power and UCL
intensity. The upconversion process involves multiphoton absorption, and there
is a relationship between the intensity of the output visible light and the
excitation power:
where IVIS
is the intensity of visible upconversion emission, IIR is the
excitation power, and n is the number of infrared photons needed to be absorbed
by the sample to emit a visible photon. Fig. 4(b) shows the excitation power
relationship of the UCL spectra of the NaYF4: Yb3+ 5%, Er3+
0.5% hexagonal nanoplates. The emission intensity increases with the increase
of excitation power density. The slopes of (2H11/2, 4S3/2)
→4I15/2 and 4F9/2→4I15/2
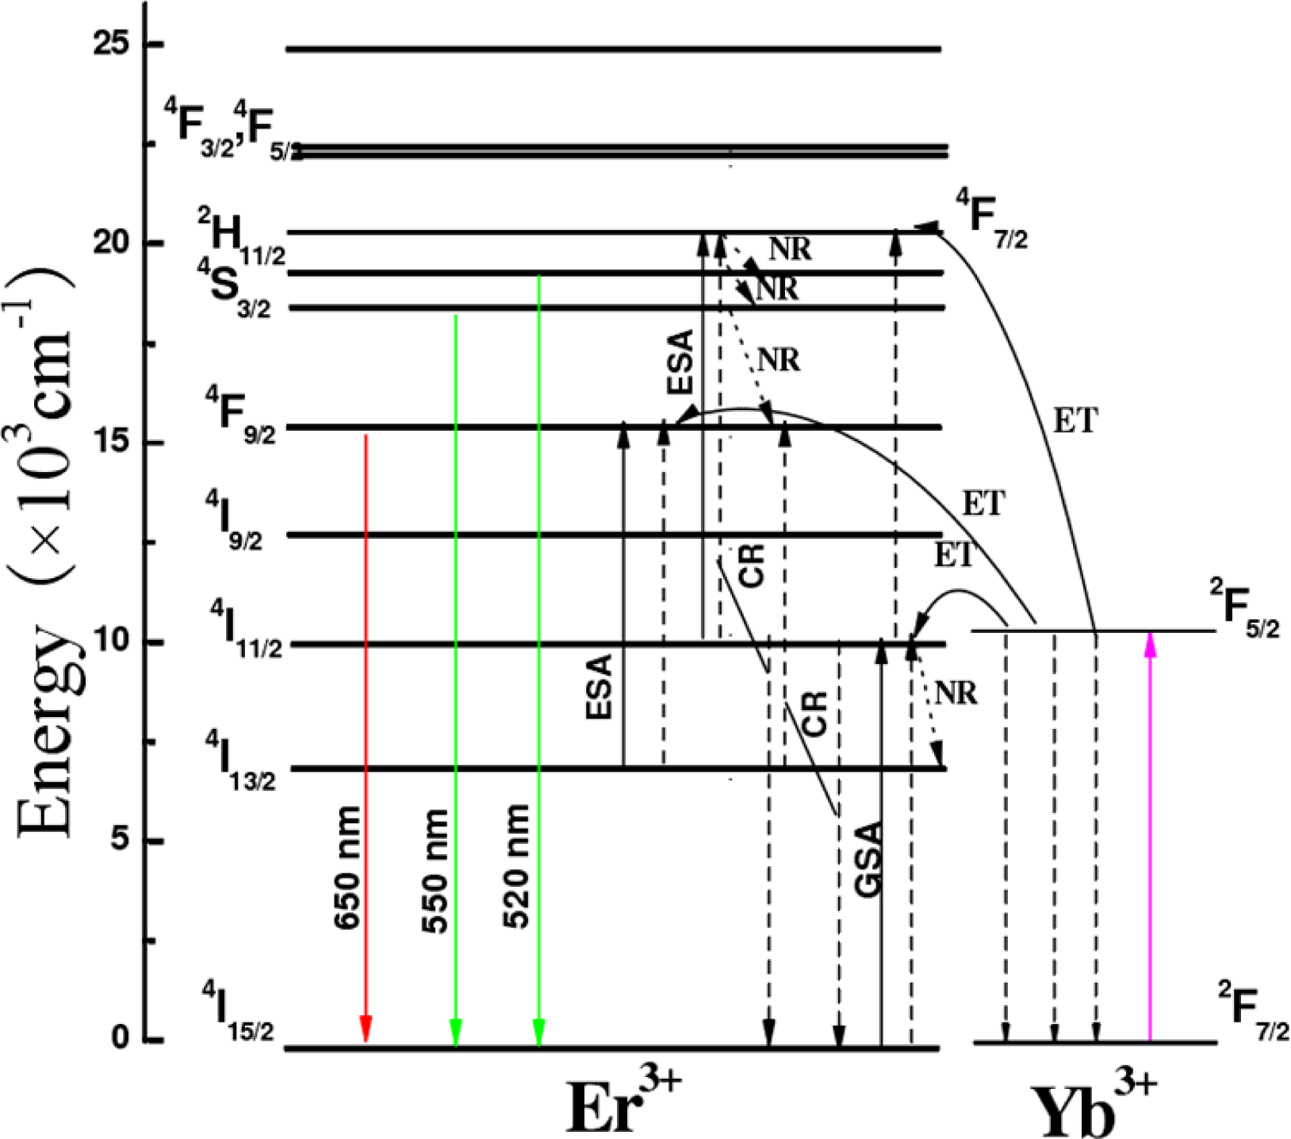
transitions are 1.57 and 1.50, respectively. It is shown that UCL involves a
two-photon absorption process (Fig. 5) [28, 29]. The slopes deviate from 2
because of the competition between different decay channels in the intermediate
state. These decay channels include multiphonon relaxation of low energy state,
radiation decay of ground state, upconversion of intermediate state and
non-radiation capture [30].
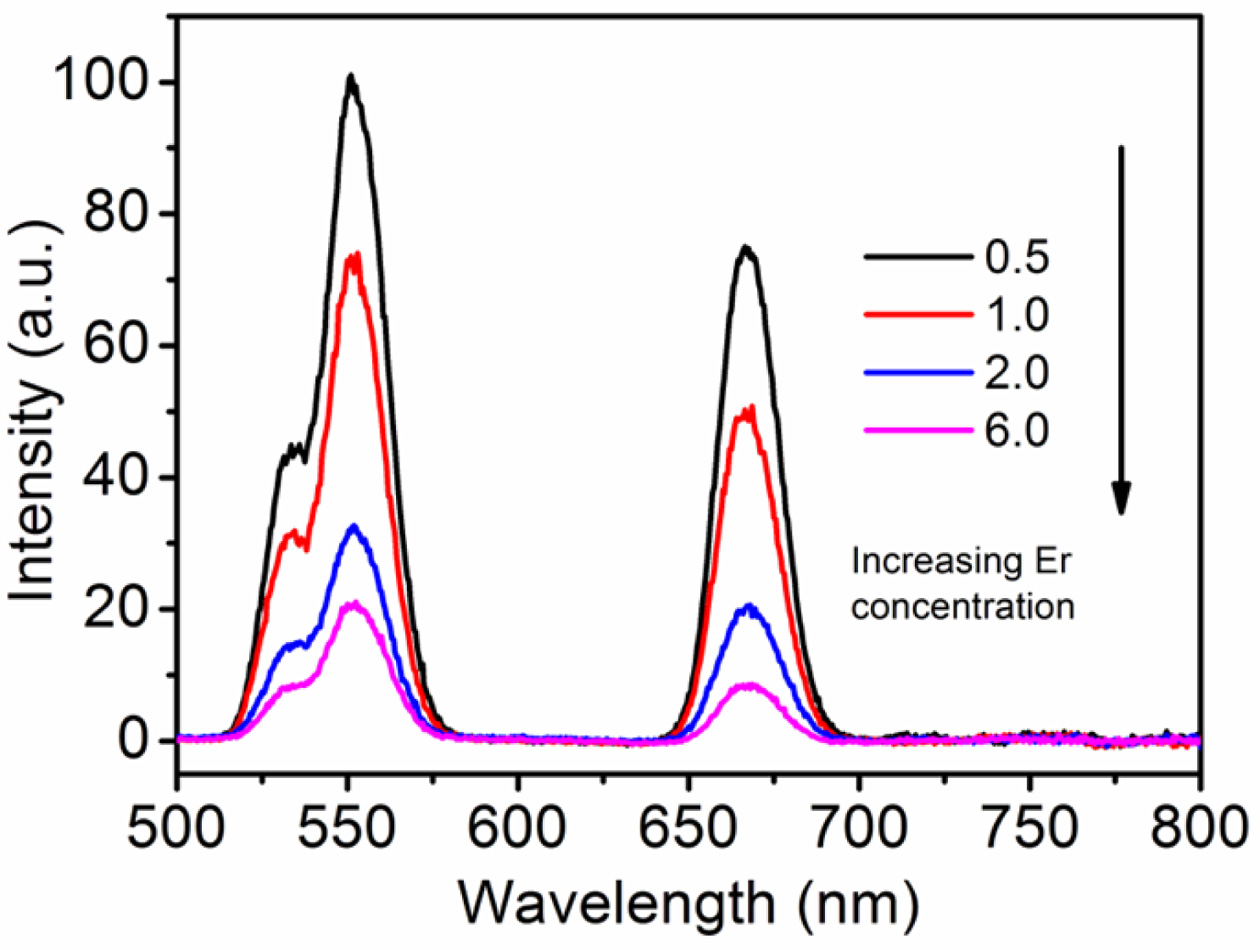
To study the effect of Er3+ concentration on
UCL in NaYF4: Yb3+, Er3+ hexagonal nanoplates
and to explore the optimum doping concentration of Er3+, a series of
powder samples of NaYF4: Yb3+ 10%, Er3+ x%
doped with Er3+ of different concentrations were made and their UCL
spectra were measured. Generally speaking, the intensity of green emission is
high, and the intensity of red emission is relatively weak (Fig. 6). It should
be noted that with the increase of Er3+ concentration, the green and
red emission intensities of the samples decrease gradually. In our case, when
the Er3+ ion doping concentration is 0.5 mol%, the green and red UCL
intensity reached the maximum (Fig. 7(a)). The UCL intensity decreases with the
increase of Er3+ concentration, which may be due to the decrease of
the distance between two adjacent Er3+ ions and the increase of the
interaction between the two ions when the concentration of Er3+ ion
is high, which leads to the concentration quenching of Er3+ ion and
the weakening of UCL intensity. It is also found from Figure 7b that the ratio
of green to red emission intensity increases with the increase of Er3+
concentration. The main reason is due to the following cross relaxation (CR)
between two adjacent Er3+ ions (Fig. 5):
With the increase of Er3+ doping concentration,
the cross relaxation becomes stronger and stronger, resulting in higher
green/red emission intensity ratio.
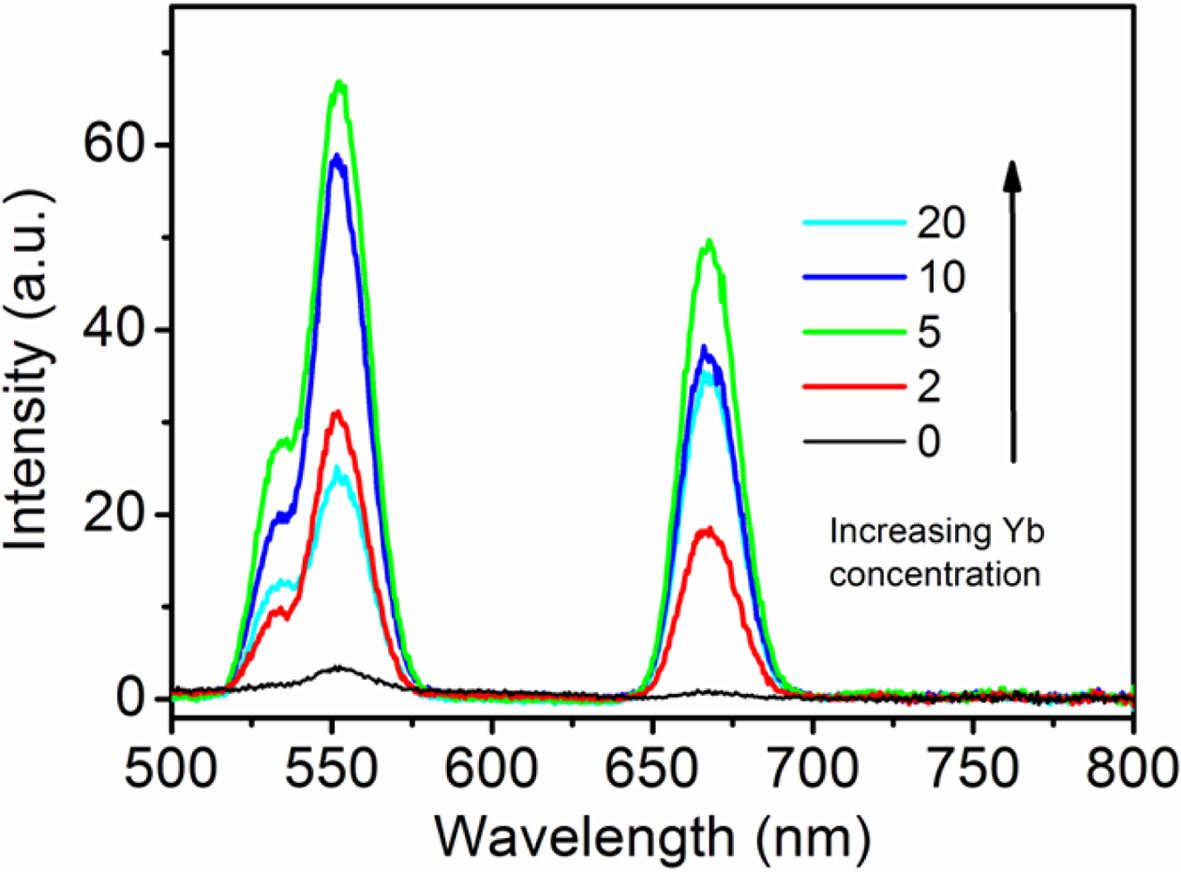
In order to reveal the relationship between the UCL
mechanism of NaYF4: Yb3+, Er3+ and Yb3+
doping concentrations, samples doped with Yb3+ concentration (from
0 mol% to 20 mol%) were prepared by controlling the
concentration of Er3+ at 0.5 mol%. Fig. 8 exhibits the UCL spectra
of NaYF4: Yb3+ x%, Er3+ 0.5% hexagonal
nanoplates with different Yb3+ ion doping concentrations under 980
nm laser excitation. The UCL intensity of the samples varies greatly by
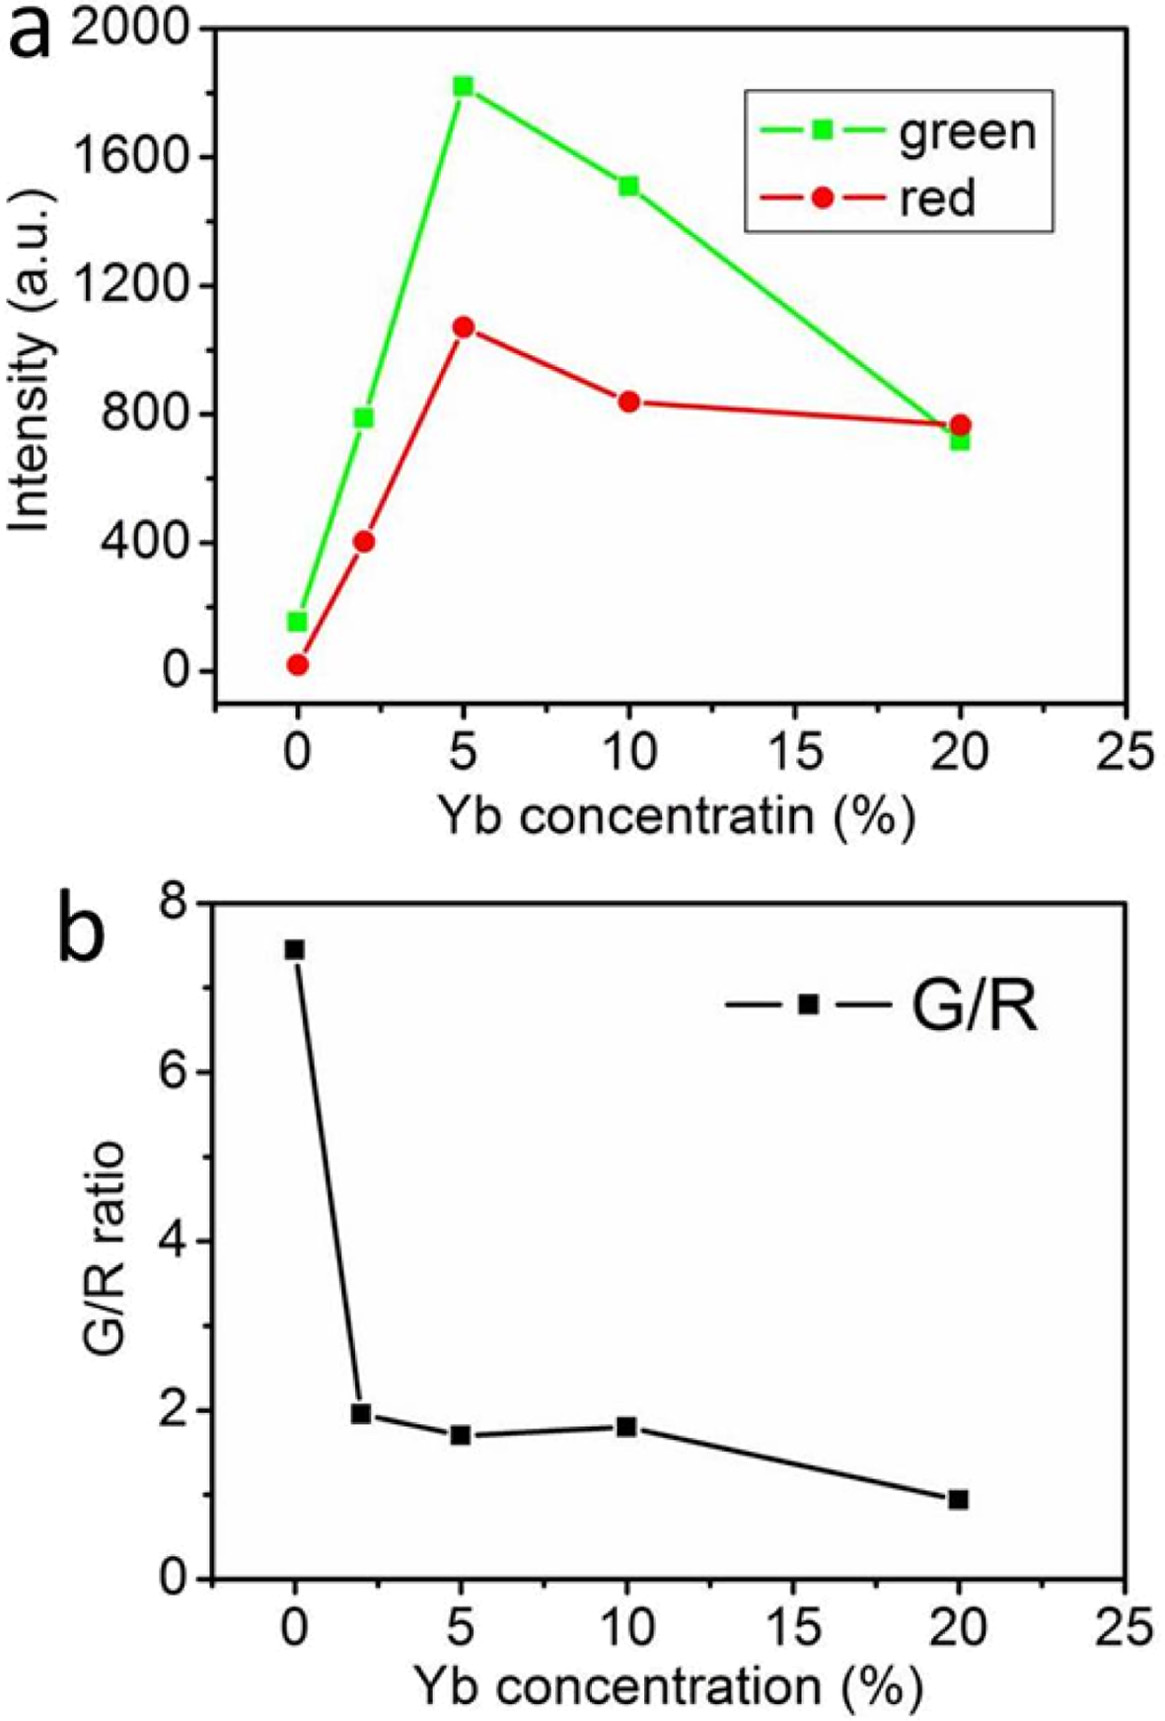
increasing Yb3+ doping concentrations (Fig. 8). With the increase of
Yb3+ concentration, the UCL intensity of the samples
gradually increases to the strongest and then decreases, while the ratio of
green to red emission intensity decreases all the time (Fig. 9). When the Yb3+
ion doping concentration is 5.0 mol%, the intensity of red and
green emission is the highest. When the concentration of Yb3+
exceeds 5.0%, the UCL of the sample is obviously suppressed. The concentration
quenching and reverse energy transfer can be occurred when the concentration of
sensitizer is too high. Therefore, there is an optimal concentration of Yb3+
in NaYF4: Yb3+, Er3+. Yb3+ ions can
be doped as sensitizer because the first excited states absorption energy of Yb3+
ion and Er3+ ion are consistent, and the near-infrared absorption
cross section of Yb3+ ion is much higher than that of Er3+.
Yb3+ ions can transfer the energy absorbed by themself
to their neighboring Er3+ ions. When the doping
concentration of Yb3+ ions in the sample is high, the energy
transfer probability between Yb3+ and Er3+ will be
higher and there will be more electrons in the energy levels of 4I11/2
and 4I13/2 in Er3+ ions. Therefore, with the
increase of Yb3+ ion concentration, the following CR process will
occur [31]:
As a result, the intensity of UCL of red emission becomes
stronger.
|
Fig. 1 Schematic illustration of the synthesis process of
NaYF4:Yb, Er. |
|
Fig. 2 The representative XRD pattern of NaYF4: Yb3+, Er3+
phosphors. |
|
Fig. 3 The representative SEM images of NaYF4: Yb3+, Er3+ phosphors with different magnifications. |
|
Fig. 4 (a) The UCL spectra and (b) relationship between excitation power and UCL intensity of representative NaYF4: Yb3+ 5%, Er3+ 0.5%
hexagonal nanoplates excited by different laser powers (λex = 980 nm). Inset: Digital photo of the UCL phosphors irradiated by infrared laser. |
|
Fig. 5 Energy level diagram of UCL of NaYF4: Yb3+, Er3+
phosphors excited by 980 nm laser. |
|
Fig. 6 UCL spectra of NaYF4: Yb3+ 10 %, Er3+ x% hexagonal
nanoplates with different Er3+ ion doping concentrations (power =
1.0 W). |

|
Fig. 7 Emission intensity (a) and green-to-red intensity ratio (b) of the UCL spectra of NaYF4: Yb3+ 10 %, Er3+ x% hexagonal nanoplates
with different Er3+ ion doping concentrations (power = 1.0 W). |
|
Fig. 8 UCL spectra of NaYF4: Yb3+ x %, Er3+ 0.5 % hexagonal
nanoplates with different Yb3+ ion doping concentrations (power =
1.0 W). |
|
Fig. 9 Emission intensity (a) and green-to-red intensity ratio (b) of
the UCL spectra of NaYF4: Yb3+ x %, Er3+ 0.5 % hexagonal
nanoplates with different Yb3+ ion doping concentrations (power =
1.0 W). |
NaYF4: Yb3+, Er3+
hexagonal nanoplates were synthesized by an IDS Na4 assisted hydrothermal synthesis method
for the first time. Under NIR excitation (980 nm), NaYF4: Yb3+,
Er3+ hexagonal nanoplates exhibited obviously strong green UCL at
530 and 550 nm and red UCL at 660 nm. The UCL intensity depends on the
concentration of Yb3+ ion, which acts as a sensitizer ion to improve
the absorption around 980 nm, while Er3+ acts as an activator ion
for UCL in the NaYF4 matrix. The optimum doping concentrations of Er3+
and Yb3+ for strong UCL luminescence were 0.5 and 5.0 mol%,
respectively. The possible CR process in the NaYF4: Yb3+,
Er3+ hexagonal nanoplates was discussed in detail, which is the main
reason for the intensity of UCL related to doping concentration.
This work was supported by the Opening Foundation of Henan
Key Laboratory of Special Protective Materials (Grant No. SZKFJJ201903).
- 1. F. Auzel, Chem. Rev. 104[1] (2004) 139-174.
-

- 2. P. Huang, W. Zheng, S. Zhou, D. Tu, Z. Chen, H. Zhu, R. Li, E. Ma, M. Huang, and X. Chen, Angew. Chem. Int. Ed. 53[5] (2014) 1252-1257.
-
- 3. D.K. Chatterjee, M.K. Gnanasammandhan, and Y. Zhang, Small 6[24] (2010) 2781-2795.
-
- 4. H.H. Gorris, and O.S. Wolfbeis, Angew. Chem. Int. Ed. 52[13] (2013) 3584-3600.
-
- 5. H. Dong, L.D. Sun, and C.H. Yan, Nanoscale 5 (2013) 5703-5714.
-
- 6. Z. Gu, L. Yan, G. Tian, S. Li, Z. Chai, and Y. Zhao, Adv. Mater. 25[28] (2013) 3758-3779.
-
- 7. Y. Liu, D. Tu, H. Zhu, and X. Chen, Chem. Soc. Rev. 42[16] (2013) 6924-6958.
-
- 8. E. Hemmer, N. Venkatachalam, H. Hyodo, A. Hattori, Y. Ebina, H. Kishimoto, and K. Soga, Nanoscale 5[23] (2013) 11339-11361.
-
- 9. S. Wang, J. Feng, S. Song, and H. Zhang, CrystEngComm 15[36] (2013) 7142-7151.
-
- 10. M. Haase, and H. SchC$fer, Angew. Chem. Int. Ed. 50[26] (2011) 5808-5829.
-
- 11. P. Qiu, N. Zhou, H. Chen, C. Zhang, G. Gao, and D. Cui, Nanoscale 5[23] (2013) 11512-11525.
-
- 12. Q. Liu, W. Feng, and F. Li, Coordin. Chem. Rev. 273-274 (2014) 100-110.
-
- 13. X. Liu, R. Deng, Y. Zhang, Y. Wang, H. Chang, L. Huang, and X. Liu, Chem. Soc. Rev. 44[6] (2015) 1479-1508.
-
- 14. L. Tu, X. Liu, F. Wu, and H. Zhang, Chem. Soc. Rev. 44[6] (2015) 1331-1345.
-
- 15. J. Zhao, H. Yang, J. Li, Y. Wang, and X. Wang, Sci. Rep-UK. 7 (2017) 18014.
-
- 16. J. Zhou, Q. Liu, W. Feng, Y. Sun, and F. Li, Chem. Rev. 115[1] (2015) 395-465.
-
- 17. Y. Wang, L. Tu, J. Zhao, Y. Sun, X. Kong, and H. Zhang, J. Phys. Chem. C 113 (2009) 7164-7169.
-
- 18. A.S. Oliveira, M.T. De Araujo, A.S. Gouveia-Neto, J.A. Medeiros Neto, A.S.B. Sombra, and Y. Messaddeq, Appl. Phys. Lett. 72[7] (1998) 753-755.
-
- 19. C. Strohhöfer, and A. Polman, J. Appl. Phys. 90[9] (2001) 4314-4320.
-
- 20. Y. Wang, K. Zheng, S. Song, D. Fan, H. Zhang, and X. Liu, Chem. Soc. Rev. 47[17] (2018) 6473-6485.
-
- 21. S.H. Kang, J.H. Ryu, C.W. Park, J.H. Park, H.M. Kim, H.S. Kang, J.S. Choi, J.H. Jung, B.G. Choi, and K.B. Shim, J. Ceram. Process. Res. 17[2] (2016) 118-121.
- 22. J.H. Ryu, S.H. Kang, and K.B. Shim, J. Ceram. Process. Res. 17[3] (2016) 253-256.
- 23. S.H. Kang, H. A. Lee, J.H. Park, C.W. Park, H.M. Kim, H.S. Kang, J.S. Choi, J.H. Jung, J. H. Ryu, and K.B. Shim, J. Ceram. Process. Res. 17[5] (2016) 468-471.
- 24. T. Nunokawa, Y. Onodera, H. Kobayashi, T. Asahi, O. Odawara, and H. Wada, J. Ceram. Process. Res.14[s1] (2013) 1-4.
- 25. K.W. Krämer, D. Biner, G. Frei, H.U. Güdel, M.P. Hehlen, and S.R. Lüthi, Chem. Mater. 16[7] (2004) 1244-1251.
-
- 26. N. Menyuk, K. Dwight, and J.W. Pierce, Appl. Phys. Lett. 21[4] (1972) 159-161.
-
- 27. Y. Sun, Y. Chen, L. Tian, Y. Yu, X. Kong, J. Zhao, and H. Zhang, Nanotechnology 18[27] (2007) 275609.
-
- 28. J. Zhao, Y. Sun, X. Kong, L. Tian, Y. Wang, L. Tu, J. Zhao, and H. Zhang, J. Phys. Chem. B 112[49] (2008) 15666-15672.
-
- 29. J. Zhao, X. Liu, D. Cui, Y. Sun, Y. Yu, Y. Yang, C. Du, Y. Wang, K. Song, K. Liu, S. Lu, X. Kong, and H. Zhang, Eur. J. Inorg. Chem. 2010[12] (2010) 1813-1819.
-
- 30. M. Pollnau, D.R. Gamelin, S. R. LüthiL, H.U. Güdel, and M.P. Hehlen, Phys. Rev. B 61[5] (2000) 3337-3346.
-
- 31. H.Q. Liu, L.L. Wang, and S. Chen, Mater. Lett. 61[17] (2007) 3629-3631.
-
 This Article
-
2020; 21(6): 699-704
Published on Dec 31, 2020
- 10.36410/jcpr.2020.21.6.699
- Received on Jul 22, 2020
- Revised on Oct 17, 2020
- Accepted on Oct 23, 2020
Services
- Abstract
introduction
experimental
results and discussion
summary
- Acknowledgements
- References
- Full Text PDF
Shared
Correspondence to
- Junwei Zhao
-
Materials Science and Engineering School & Henan Key Laboratory of Special Protective Materials, Luoyang Institute of Science and Technology, Luoyang, 471023, P. R. China
Tel : +86-379-65928196 Fax: +86-379-65928196 - E-mail: jwzhao2010@lit.edu.cn
Clean-Energy Research Institute(CRI), Hanyang University, 222, Wangsimni-ro, Seongdong-gu, Seoul, 04763, Korea
E-mail: jcpr@hanyang.ac.kr