


- Synthesis and characterization of TiC powders by sol-gel method
Liang Gaoa,b, Yun Zhangb,*, Xue Yangb, YanBin Heb and LiHua Songb
aHeji Hospital Affiliated to Changzhi Medical College, Shanxi, 046012, China
bDepartment of pharmacy, Changzhi Medical College, Shanxi, 046012, China
TiC powders were successfully
synthesized by carbothermal reduction of Ti-O-C precursor in argon at
1,400 °C for 2 h. And the Ti-O-C precursor was formed by
sol-gel method using titanium butyrate (Ti(OC4H9)4),
fructose (C6H12O6), and acetyl acetone (acac).
Here, acac was used as chemical modifier to control Ti(OC4H9)4
hydrolysis to obtain stable sol. Furthermore, TG-DSC, XRD, FTIR, Raman, SEM,
and EDS were employed to characterize the precursor and TiC powders. Moreover, acac
as stabilizer was studied using FTIR when reacted with Ti(OC4H9)4
formed stable six-member ring as a result of the existence of tautomer, prevent the
nucleophilic attack of water, which reduced the hydrolysis rate of Ti(OC4H9)4.
Besides, the composition of TiC phase was further understood by the Raman
spectra, and the results showed that the peaks at 403 cm-1, 513 cm-1, and 629 cm-1 were ascribed to the characteristic peaks of TiC.
Finally, the photomicrograph revealed an equiaxed shape and the average grain
size of TiC particles was ca. 1 um. The EDS indicated that the particles
contain elements of Ti and carbon according to dot and line scan.
Keywords: Raman, sol-gel, FTIR, scan, TiC
Titanium carbide (TiC) has become an important nonoxide
ceramic material as it possesses a number of desirable properties such as high
melting temperature, high hardness, high modulus, high chemical stability, and
good electrical conductivity [1-3]. Combined with high surface area and unique
physical properties, TiC material has great potential for applications as
leaning edge parts, rocket nozzle throat liners, hypersonic re-entry vehicles,
jet engine components, and high-speed cutting tools [4-14]. However, the
applications of TiC ceramic material have been limited as its strong
covalent bonding contribute to properties of low self-diffusion
coefficient and poor sintering ability [15, 16].
As known, the properties of powder have significant
influence on the subsequent forming and sintering of ceramics,
especially on the microstructure and mechanical properties
of ceramics. In general, powders with high activity, high purity, and small
particle size are conducive to the preparation of ceramic materials with
uniform structure and high performance. Therefore, a synthesis method to meet
the above requirements is needed. Until now, TiC powders can be prepared by
high- temperature carbothermal reduction of a mixture of rutile (TiO2)
and carbon (C) according to reaction (1) [17]:
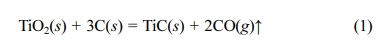
Carbothermal reduction was widely used to synthesize
TiC due to a convenient process route, low cost of raw material, and capacity
of production. However, such process usually required high temperature
(1,700 ~ 2,100 oC) and a long production period. Besides
this, several methods have been proposed to synthesize TiC powder, such as
hydrogen plasma [18], mechanical alloying [19], microwave carbothermal
reduction (CR) [20], petroleum coke salt bath [21], Mg thermal
reduction [22], self-propagating high
temperature synthesis (SHS) [23-25], and Chemical Vapor
Deposition (CVD) [26]. However, such processes need an higher temperature
or a long production period. Besides, the synthesized powders usually have a
relatively coarse particle and a low purity. Comparing with
traditional synthetic methods, the sol-gel
chemical process with carbothermal reduction is a novel
routine to synthesize metal carbides [27]. When prepared by a sol-gel
technique, the polymeric precursor reactants are homogeneously distributed at a
molecular level that reduces the kinetic barriers between the
developed metal oxides and carbon particles created in pyrolysis
of a metal alkoxide polymer precursor. Increased contact area of the
nanoparticles results in carbothermal reduction of metal oxide and carbon at
lower temperature and shorter time as compared to conventional methods of
carbide synthesis. Moreover, the use of molecular precursors and the control of
the process conditions allow preparation of homogeneous and pure multicomponent
systems [27-31]. Actually, many ceramic powders have been synthesized by
sol-gel method. For example, Kwon et al. synthesized K(Ta0.6Nb0.4)O3/SrTiO3
double layer thin films [32]. Muñiz-Serrato et al. prepared TiO2 thin
films by sol-gel method [33].
In the present study, a single phase of TiC powders was
prepared by sol-gel method combining with carbothermal reduction process. Here,
acac was used as chemical modifier to control Ti(OC4H9)4
hydrolysis to obtain stable sol. Fructose was selected as carbon source because
it can decompose to carbon and H2O completely, so that the C/Ti
molar ratio in the Ti-O-C precursor can be fixed precisely.
Then, a metal alkoxide reaction system with acac was
investigated by FTIR spectra. Besides, the Ti-O and Ti-B
bonds were analyzed by FTIR and Raman spectra. And the elements of Ti
and boron were investigated by energy dispersive spectrum (EDS).
Titanium butyrate (TBOT, Ti(OC4H9)4)
and fructose (C6H12O6) were utilized as
starting materials in the present work. Acetylacetone (acac)
was used as chelating agent and chemical modifier. Methyl
alcohol (CH3OH) and water (H2O) were used as solvent.
These materials were supplied by the Lanyi Reagents Co. Ltd., Beijing, China.
The grade of all the above reagents was analytical.
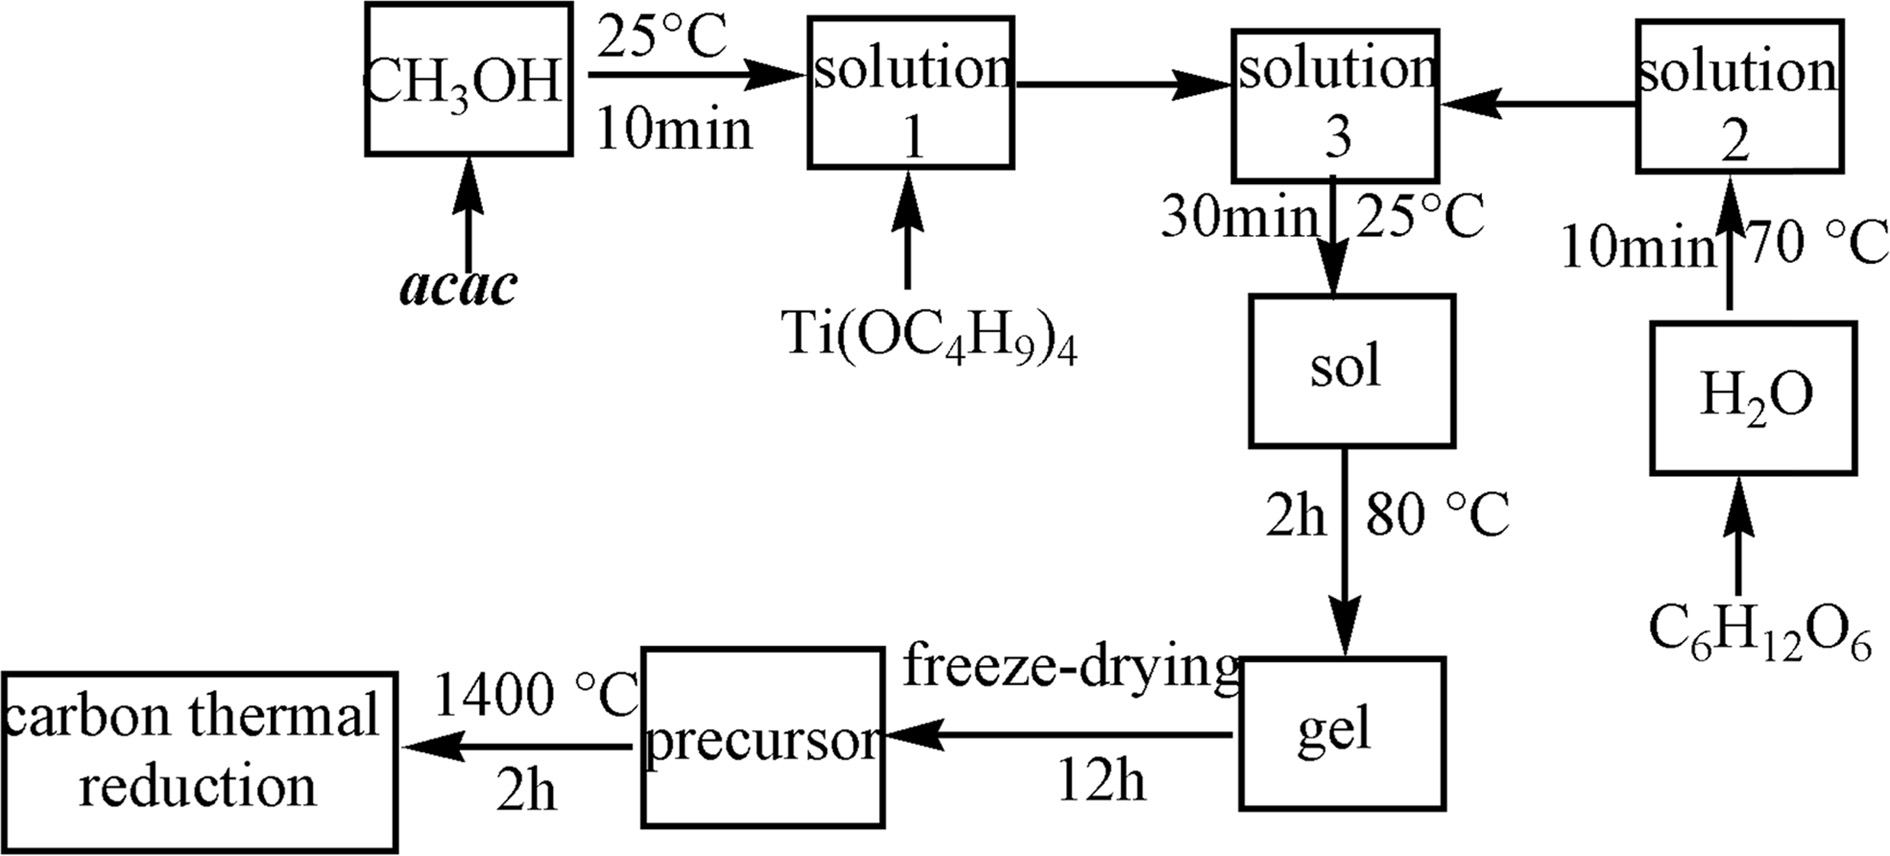
In the present work, the TiC powders were synthesized
by sol-gel method as shown in Fig. 1. In a typical synthesis,
3.0 g acac was dissolved in 25 mL of CH3OH using
a 80 mL beaker at 25 °C
for 10 min on the magnetic stirrer. We refer to this solution as Solution 1.
Then, 1.8 g of C6H12O6 was dissolved in 5 mL
of H2O using a 80 mL beaker at 70 °C for 10 min in the water bath pot. We refer to this
solution as Solution 2. Afterward, 6.8 g of Ti(OC4H9)4
was dropwise added to the Solution 1. This was Solution 3. After that, the
Solution 2 was slowly dripped into the Solution 3. Then, the sol was formed at
25 °C for 30 min.
The resulting sol was heated with vigorous stirring to 80 °C and maintained for 2 h to form a
wet gel. Finally, it was dried by freeze-drying under vacuum for 12 h followed
by grinding process using an agate mortar and a pestle. In this way, a
precursor was prepared. After that, the precursor was placed in alumina
crucible using an alumina tube furnace in argon at 1,400 °C for 2 h. Then, the TiC
powders were synthesized by carbothermal reduction
according to the eq. (1).
The
mass and heat flow of the samples were monitored by thermal analysis (TG-DSC,
Beijing Hengjiu instrument Co. Ltd., Beijing, China). The crystallographic
constitution was identified by means of an X-ray
diffractometer (XRD) using graphite monochromatized CuKa radiation
(Rigaku, D/MAX 2200 PC). Crystallite size was estimated using the Debye-Scherrer
equation,
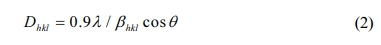
Where Dhkl
is the crystallite size, λ is the wavelength of CuKα radiation, βhkl
is the full-width at half maximum, and θ is the Bragg diffraction angle. The sol
and precursor were characterized by FTIR in the range of
400 ~ 4,000 cm-1 using SHIMADZU 8400S
apparatus. Raman spectra were measured with the spectrometer Aramis (Horiba
Jobin Yvon) equipped with 532 nm laser. The morphology and element of the final
products were characterized by SEM and
EDS using a JEOL S4800 JAPAN microscope.
|
Fig. 1 Flow chart of synthesis of TiC powders. |
As known, metal alkoxides tend to react spontaneously with
water and form precipitates resulting from successive hydrolysis
and condensation reactions. In order to obtain a sol, Ti(OC4H9)4
must be chemically modified by a complexing agent to decrease the alkoxide
reactivity with water. In this work, acac was used as a chemical modifier.
In order to reveal the transformation of chemical group and
mechanism of reactions during the early stage of the synthesis process, the
FTIR spectrums of acac, Ti(acac)2 and precursor
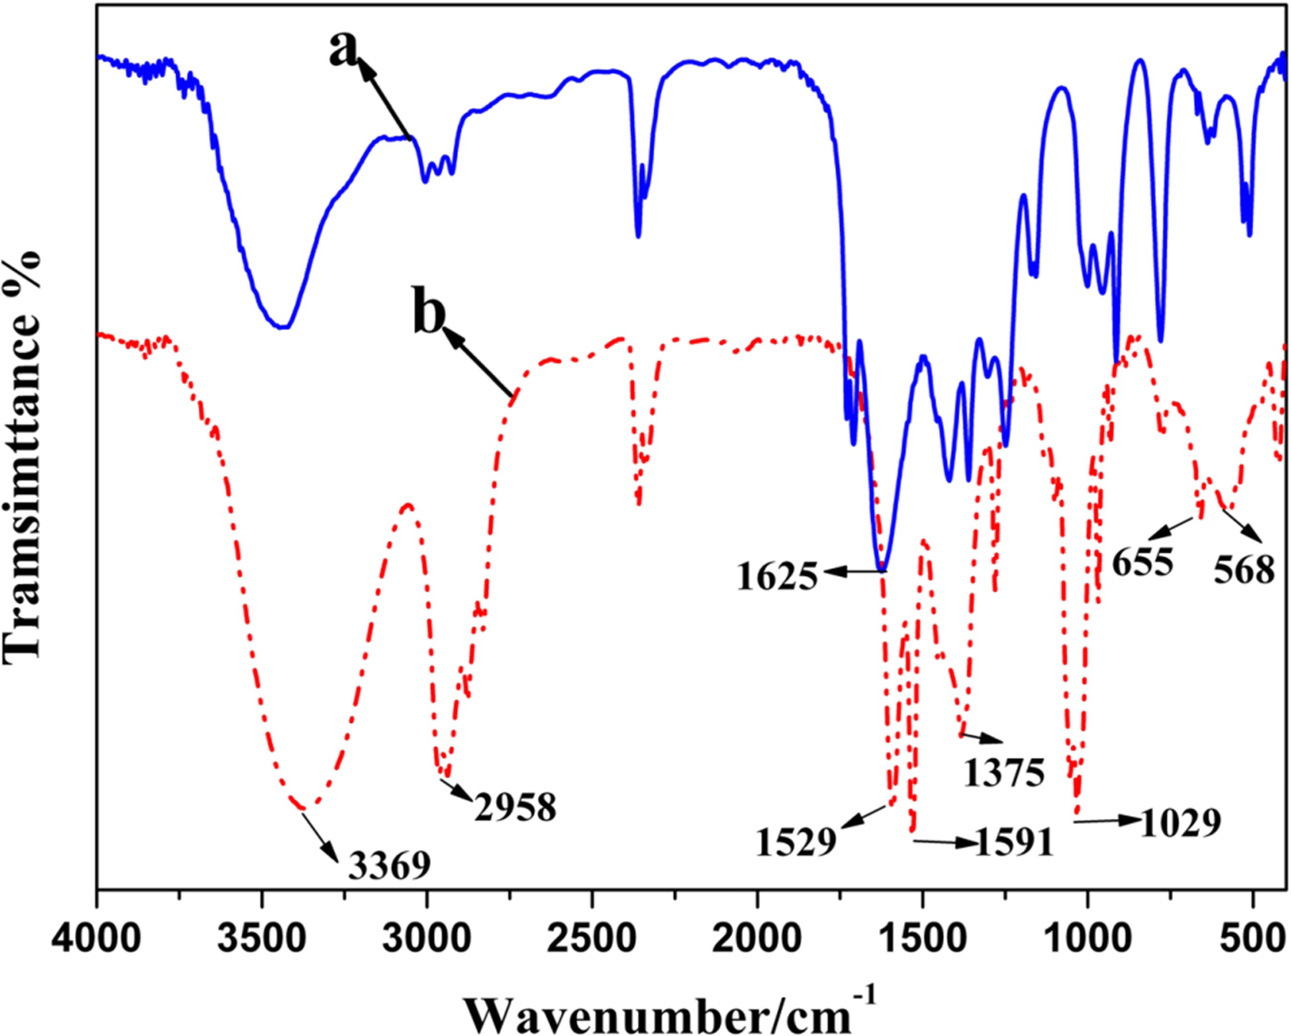
powders were presented in Fig. 2 and Fig. 3. Fig. 2(a) shows the FTIR of acac.
It could be seen that the bond centred at 1,625 cm-1
was ascribed to the C=O double bond in acac. As can be seen from Fig.
2(b), the bands situated at 1591 and 1,529 cm-1
correspond, respectively, to the C=O and C=C stretching vibration of
acetylacetone tautomers [34]. The C-H bending vibration of RCH=CH2
was observed as a band close to 1,375 cm-1.
The band centered at 1,029 cm-1
corresponds to the C-O stretching vibration. Therefore,
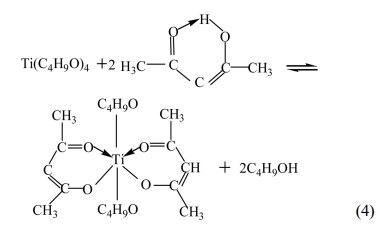
the keto-enol tautomeric formation occurs as the following
equation [see eq. (3)]:
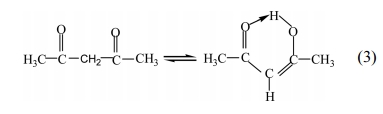
The electron withdrawing effect caused by the carbonyl
makes the polarity of CH2 increase and the α–H be a proton to
derivate from the CH2 bond easily [34]. The presence of n-BuOH,
which was produced by the chelating reaction between
alkoxide and acetylacetone, was corroborated by the bands
located at 3369 and 655 cm-1
that were assigned to O-H stretching vibration and formation
vibration in n-BuOH, respectively. As regards the broad
band close to 568 cm-1,
it was deduced to correspond to the hexatomic ring vibration caused by the α–H
of acetylacetone substituting for the BuO–band. Therefore, the chelation
reaction between the Ti(C4H9O)4 and
acetylacetone is deduced to take place according to the following equation
[34]:
As a chelating agent, the acetylacetone not only
substitutes the alkoxy group of the double alkoxide to enhance the
steric effects, but also forms steady hexatomic rings,
which embarrasses the nucleophilic attack of water molecule
to the alkoxide and slows down the hydrolysis effectively.
According to different needs, diverse kinds and amount of chelating agent could
be added to control the structure of gel and achieve the intention of designing
and tailoring molecules. Then, the processes of hydrolysis and concentration
were taken place in the following equations [see eq. (5) - (8)].
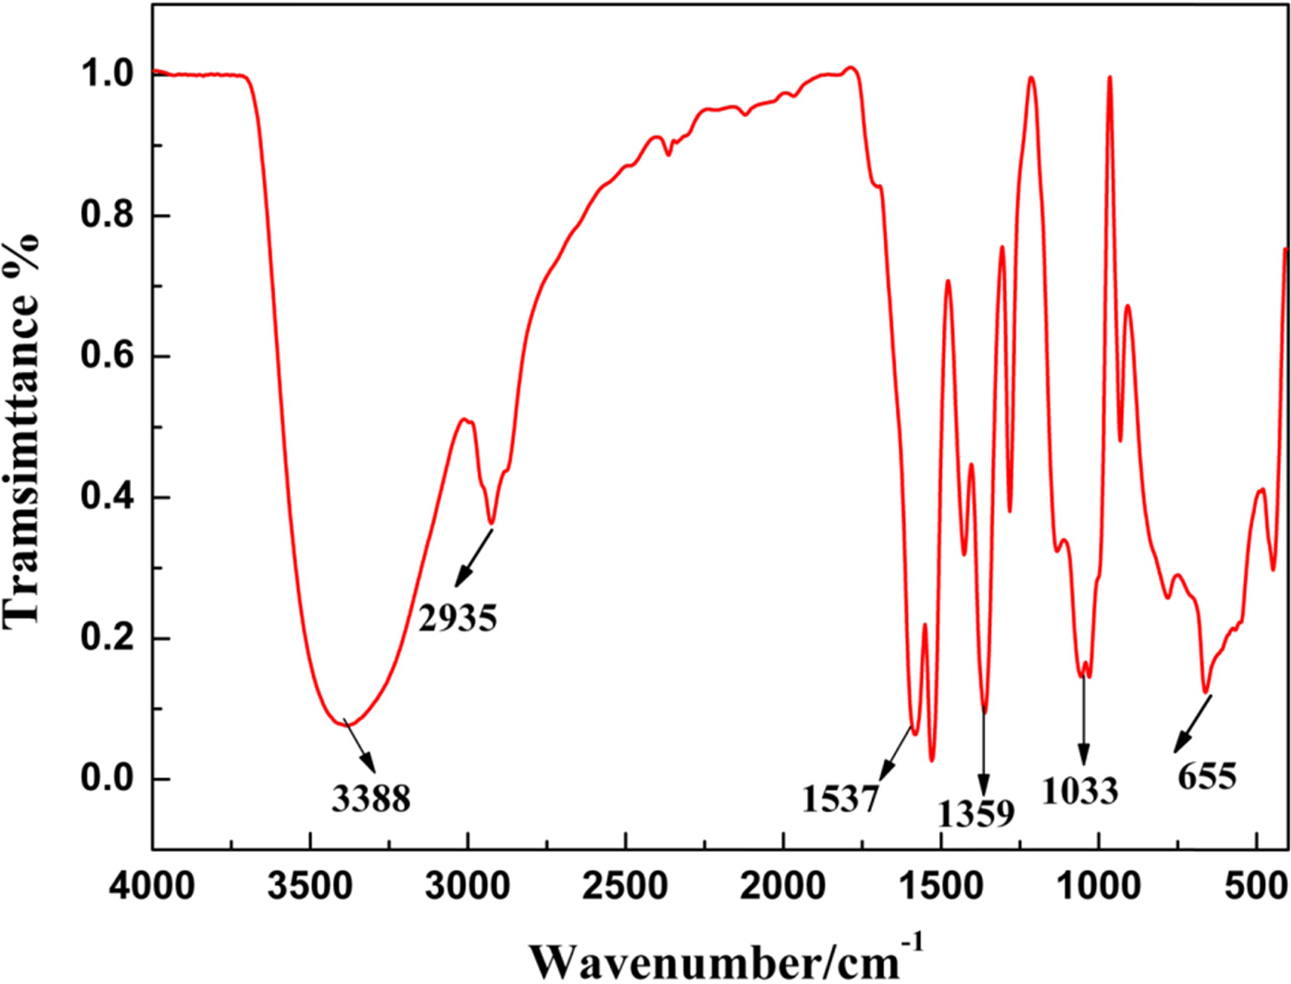
Fig. 3 shows the FTIR of precusor powder. Acorrding
to literature[35], the peak of 655 cm-1
was attributed to stretching vibration of Ti-O bond. And the peaks of 1,033
cm-1,
1,359 cm-1,
1,537 cm-1,
2,935 cm-1
and 3,388 cm-1 were attributed to
stretching vibrations of –CH2, –CH3, and O-H bonds, respectively. The
results of FTIR explained what
happened in the preparing process of sol and precursor.
TG-DSC analysis in argon was conducted to
understand the thermal behavior and reactions of precursor during the
heat treatment from room temperature to 900 °C. The complementary information obtained
allows differentiation between
endothermic and exothermic events which have no
associated weight loss (e.g. melting and crystallization) and
those which involve a weight loss (e.g. degradation).
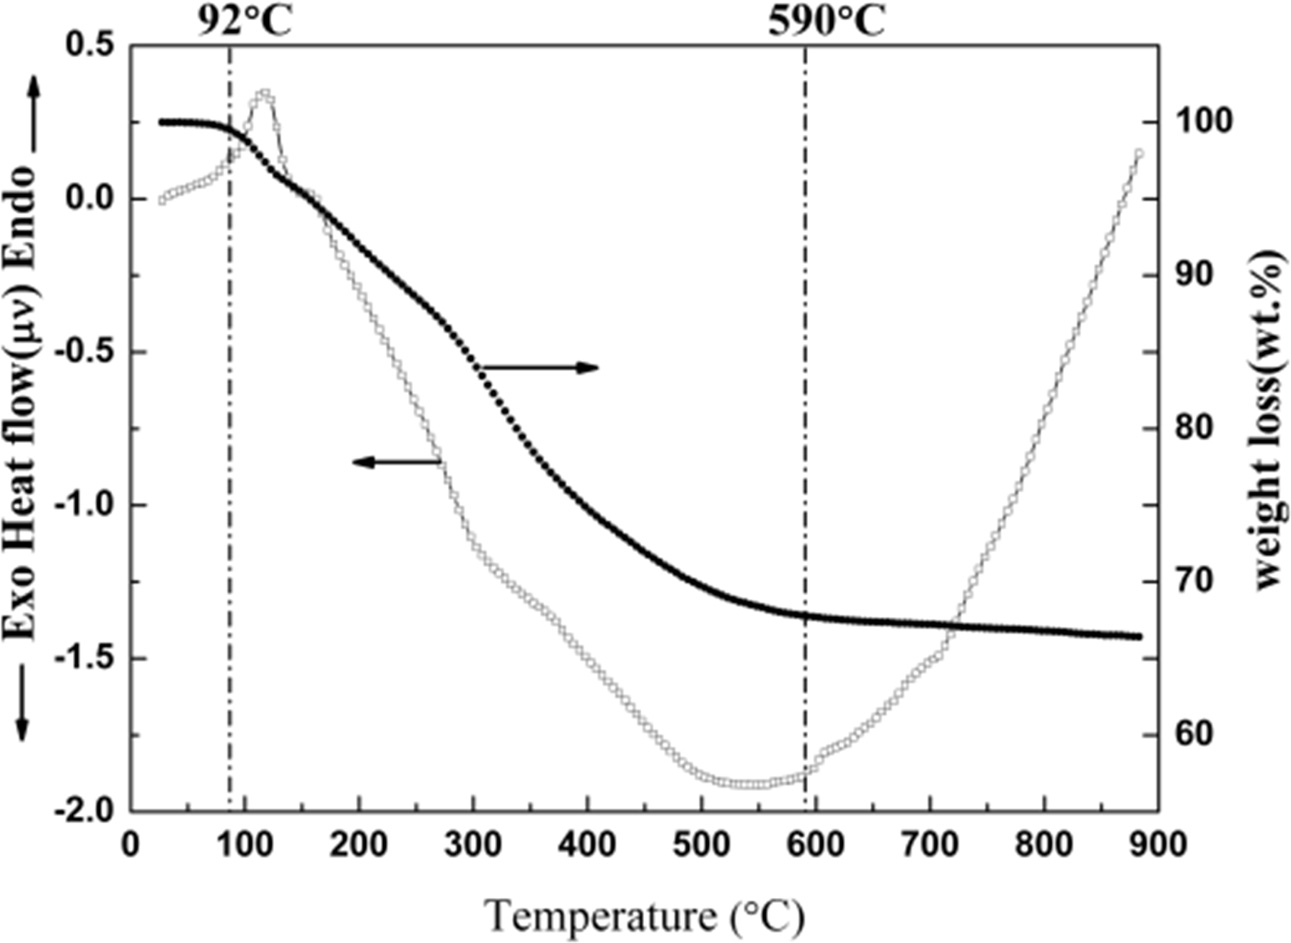
TG analysis showed that a considerable weight loss occurred in a temperature
range of 92 ~ 590 °C
for the precursor as shown in Fig. 4. The whole process could be divided into
two stages according to TG curve. The first stage of weight loss was mainly
caused by the evaporation of water less than 200 °C. The
second stage was completely caused by the
transformation of C6H12O6
to amorphous carbon and H2O from 200 °C to 590 °C (C6H12O6
= 6C + 6H2O). Alternatively, DSC curve in Fig. 4 revealed that one
endothermic peaks and a broad exothermic peak during these stages.
It could be explained that the
former was mainly attributed to the evaporation of the
bonded water and the latter could be correlated with the transformation of C6H12O6,
remaining organic compounds and crystallization of TiO2.
Moreover, the weight loss was slow and the DSC curve was
approximately straight as well from 600 °C to 900 °C.
It could be revealed that there was only the change of crystallinity and crystal transformation of TiO2
during this stage, and scarcely any other reactions. That is to
say, the main weight loss of precursor was mainly caused by the evaporation of
water and the decomposition of C6H12O6
during the process of heating.
Based on the above results of the thermal analysis, the
precursor was firstly heated to 600 °C
in order to completely transform C6H12O6, then
to 1,100 °C at 3 °C/min and maintained at this
temperature for 2 h in argon using an alumina tube furnace. Afterwards, the
precursor powder was continued to heat from 1,100 °C to 1,400 °C
at a heating rate of 2 °C/min
and kept at this temperature for 2 h. Then, the sample was cooled to room
temperature at a cooling rate of 5 °C/min.
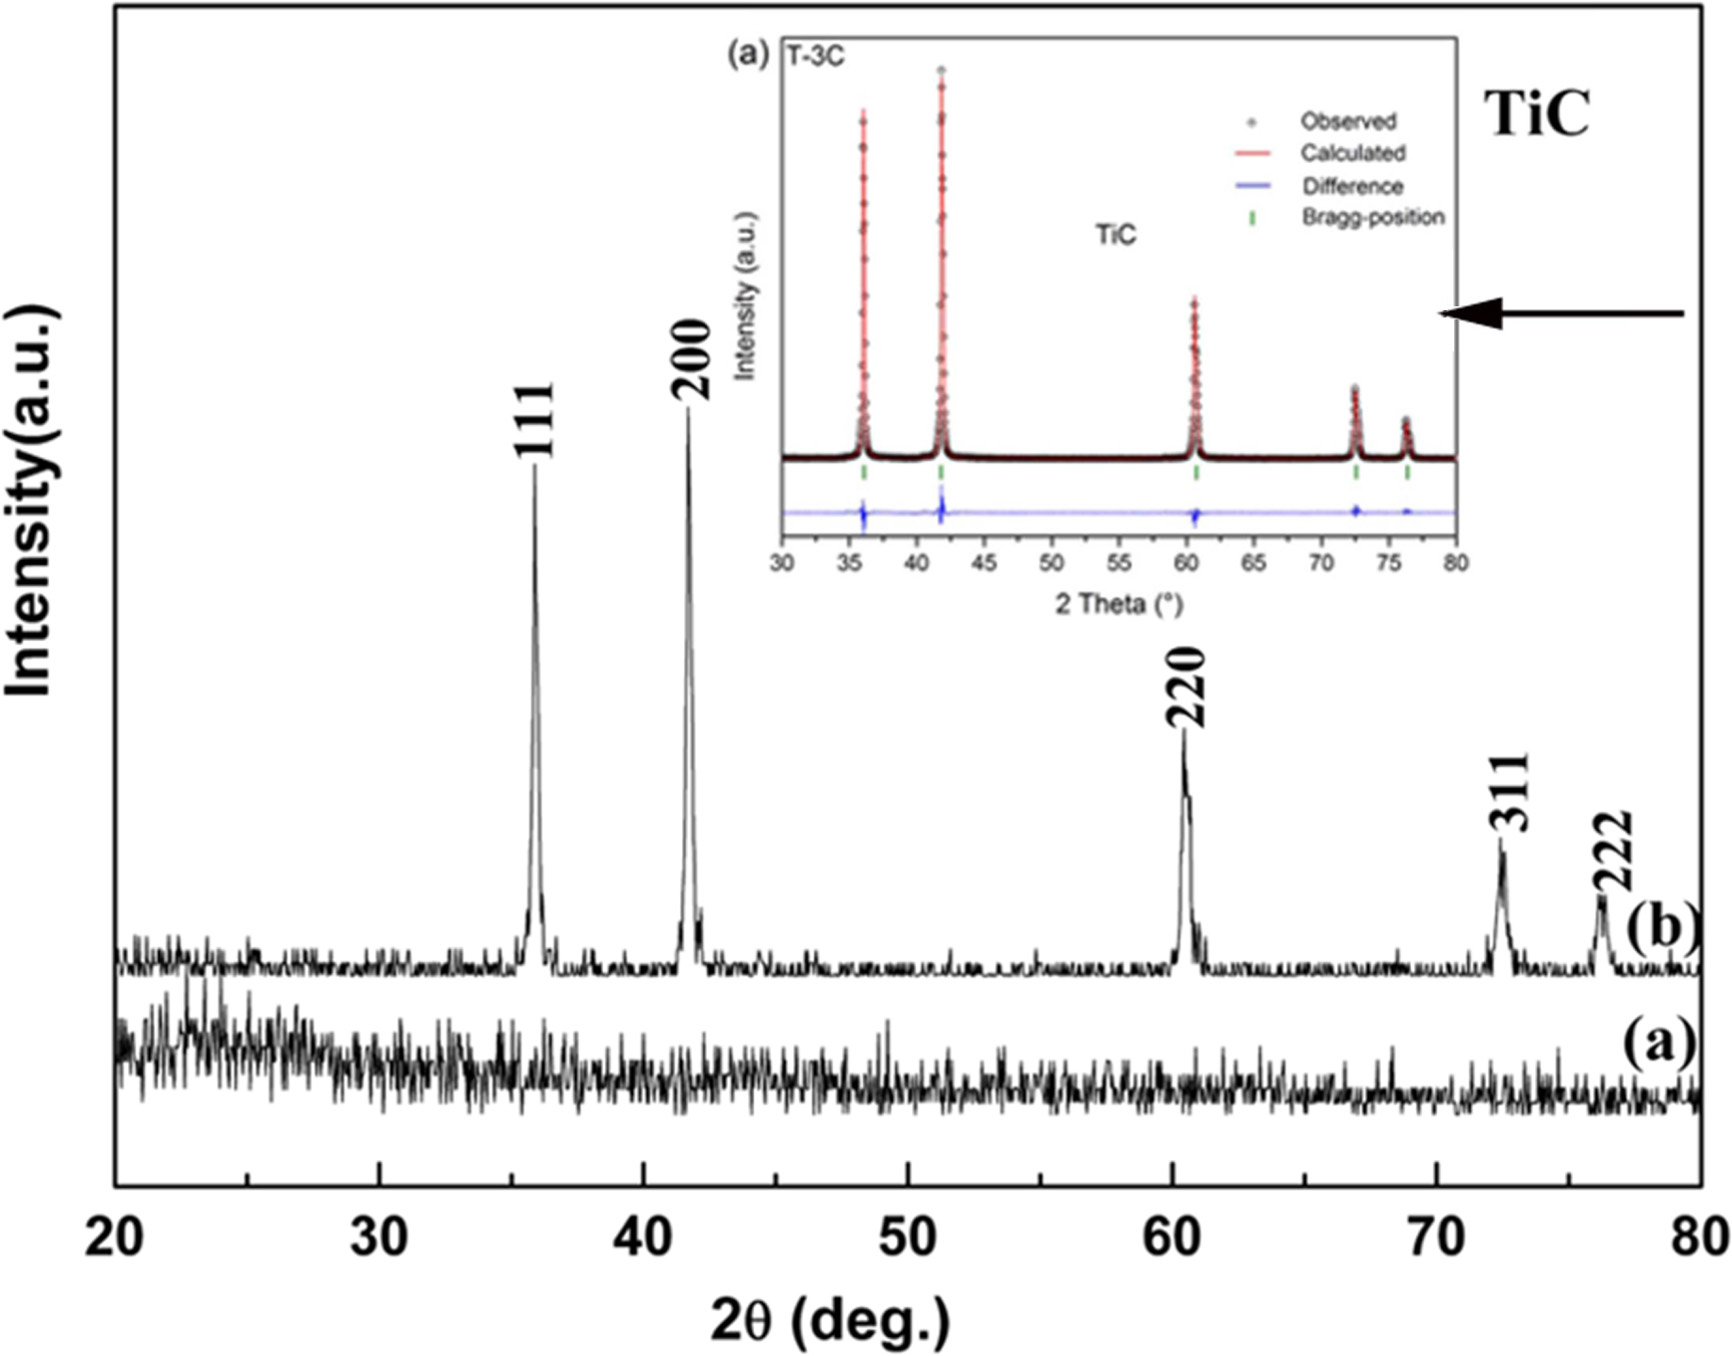
Fig. 5 shows XRD patterns of the TiC precursor powders calcined at
different temperatures. Clearly, the precursor was in a
typical amorphous state without any peak in its XRD pattern [see Fig. 5(a)].
Fig. 5(b) shows the XRD pattern of the precursor heated at 1,400 °C for 2
h in argon, the peaks of TiC have been found at 2θ = 41.7°, 35.9°,
60.4°, 72.3°, and 76.1° respectively. That is to say, a single phase of TiC
evolves by heating at 1,400 °C,
for 2 h. And the reaction temperature of synthesizing TiC powders was much
lower than other traditional method, which could be attributed to the
homogeneous mixing and enormous contact area of reactants in
the precursor. In this work, the experimental conditions
were limited, so the temperature was only raised 1,400 °C. A further study was conducted to
evaluate the average particle / grain size based on the Debye-Scherrer
equation. The result reveals that it was about 1 um.
Raman
spectroscopy involves the spectral analysis of the light produced by the inelastic scattering of monochromatic light by
molecules or crystal lattices. This information can then be used to determine
details of the structure of the molecule or crystal lattice. As reported in
literature, stoichiometric TiC is Raman in-active due to the high inversion
symmetry present in the Oh point group of the crystal structure of
TiC, and the screening effect of the valence electron present in most metallic bonds [36-38]. However,
non-stoichiometric TiC1−x
has been reported to be Raman-active, probably due to the presence of carbon
vacancies, deformation defects and lattice imperfections contained in the
off-stoichiometric TiC1−x structure. A Raman spectroscopic signal
for off- stoichiometric TiC1−x has been reported by Lohse et al.
[39], Klein et al. [36], Amer et al. [37], Huong et al. [40], Oláh et al. [41],
and Pellegrino et al. [42]. Essentially, Klein et al. reported normal
vibrations of off-stoichiometric TiC1−x bonds that corresponds to
Raman-active modes [see eq.(9)][36].
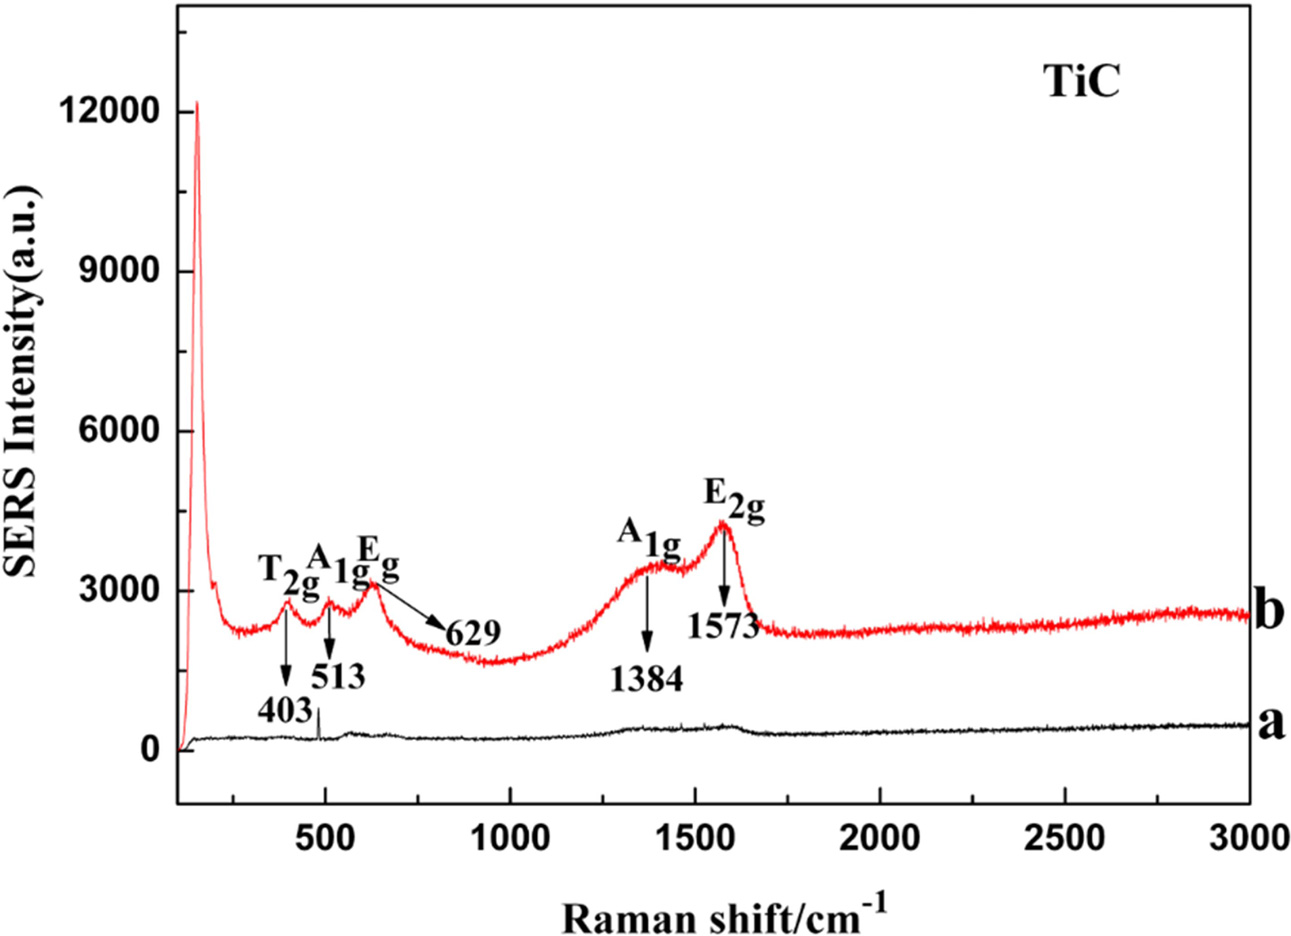
Fig. 6 shows the Raman spectra of the synthesized TiC
powder which give further insight into the depth of the TiC phase formation.
Obviously, there were not any peaks in the Raman spectra in Fig. 6(a). As can
be seen from Fig. 6(b), Raman spectra obtained for the synthesized TiC
powder were observed to display five characteristic peaks. Two
of the peaks were broad and were located at 1,384 and 1,573 cm−1,
assigned respectively to A1g and E2g Raman-active modes
of carbon while the other three peaks that were located at 403,
513, and 629 cm−1 were reportedly associated to signal
of Ti-C bond vibrations of off-stoichiometric TiC1−x [39, 37].
According to Klein et al. [36], these three peaks were assigned to
Raman-active modes. The A1g and Eg peaks, typically
located in the optical phonons region were vibrational bond motion due to the
carbon atom while the T2g peak located within the acoustic region is
associated with the titanium motion [36]. This implies that the vibrational
bond contribution due to carbon atoms present in the off-stoichiometric
TiC1−x is probably stronger than motion that comes
from the titanium bonded atoms. That is to say, in
addition to TiC, there was a small amount of carbon in the
powder.
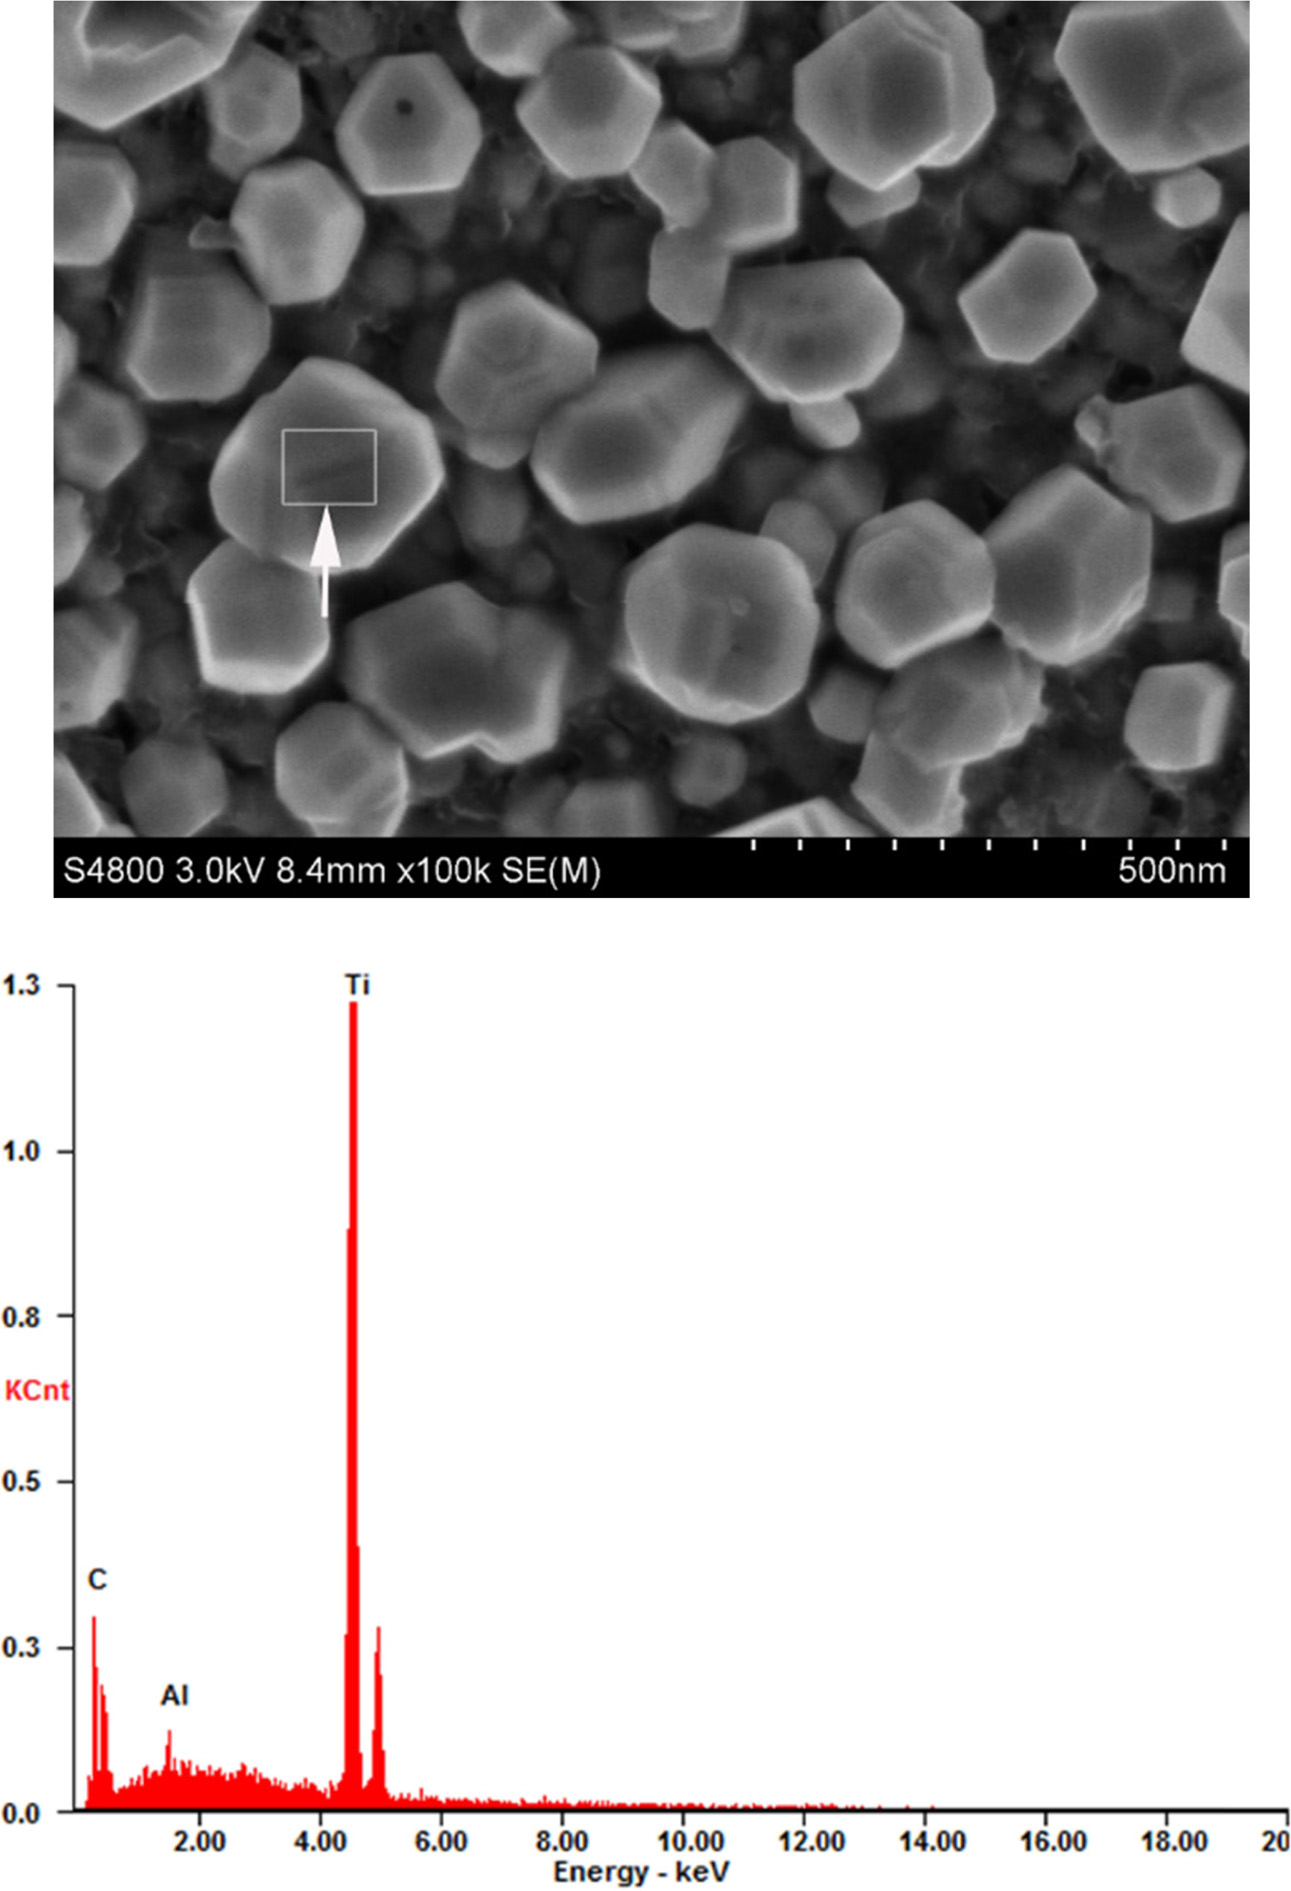
In general, the morphology of particles is a compre- hensive reflection of the
synthesis reactions and processes. Energy
dispersive spectrum (EDS) reveals the distribution of
elements; these distributions can be displayed as either
dot maps or line profiles to distinguish particles with different chemical
compositions. Fig. 7 shows a SEM image of TiC powders carbothermally reduced at
1,400 °C for 2 h.
The SEM image revealed TiC particles with equiaxed shape and the particle size
was uniform, around 1 um in diameter. The EDS indicated that the particle
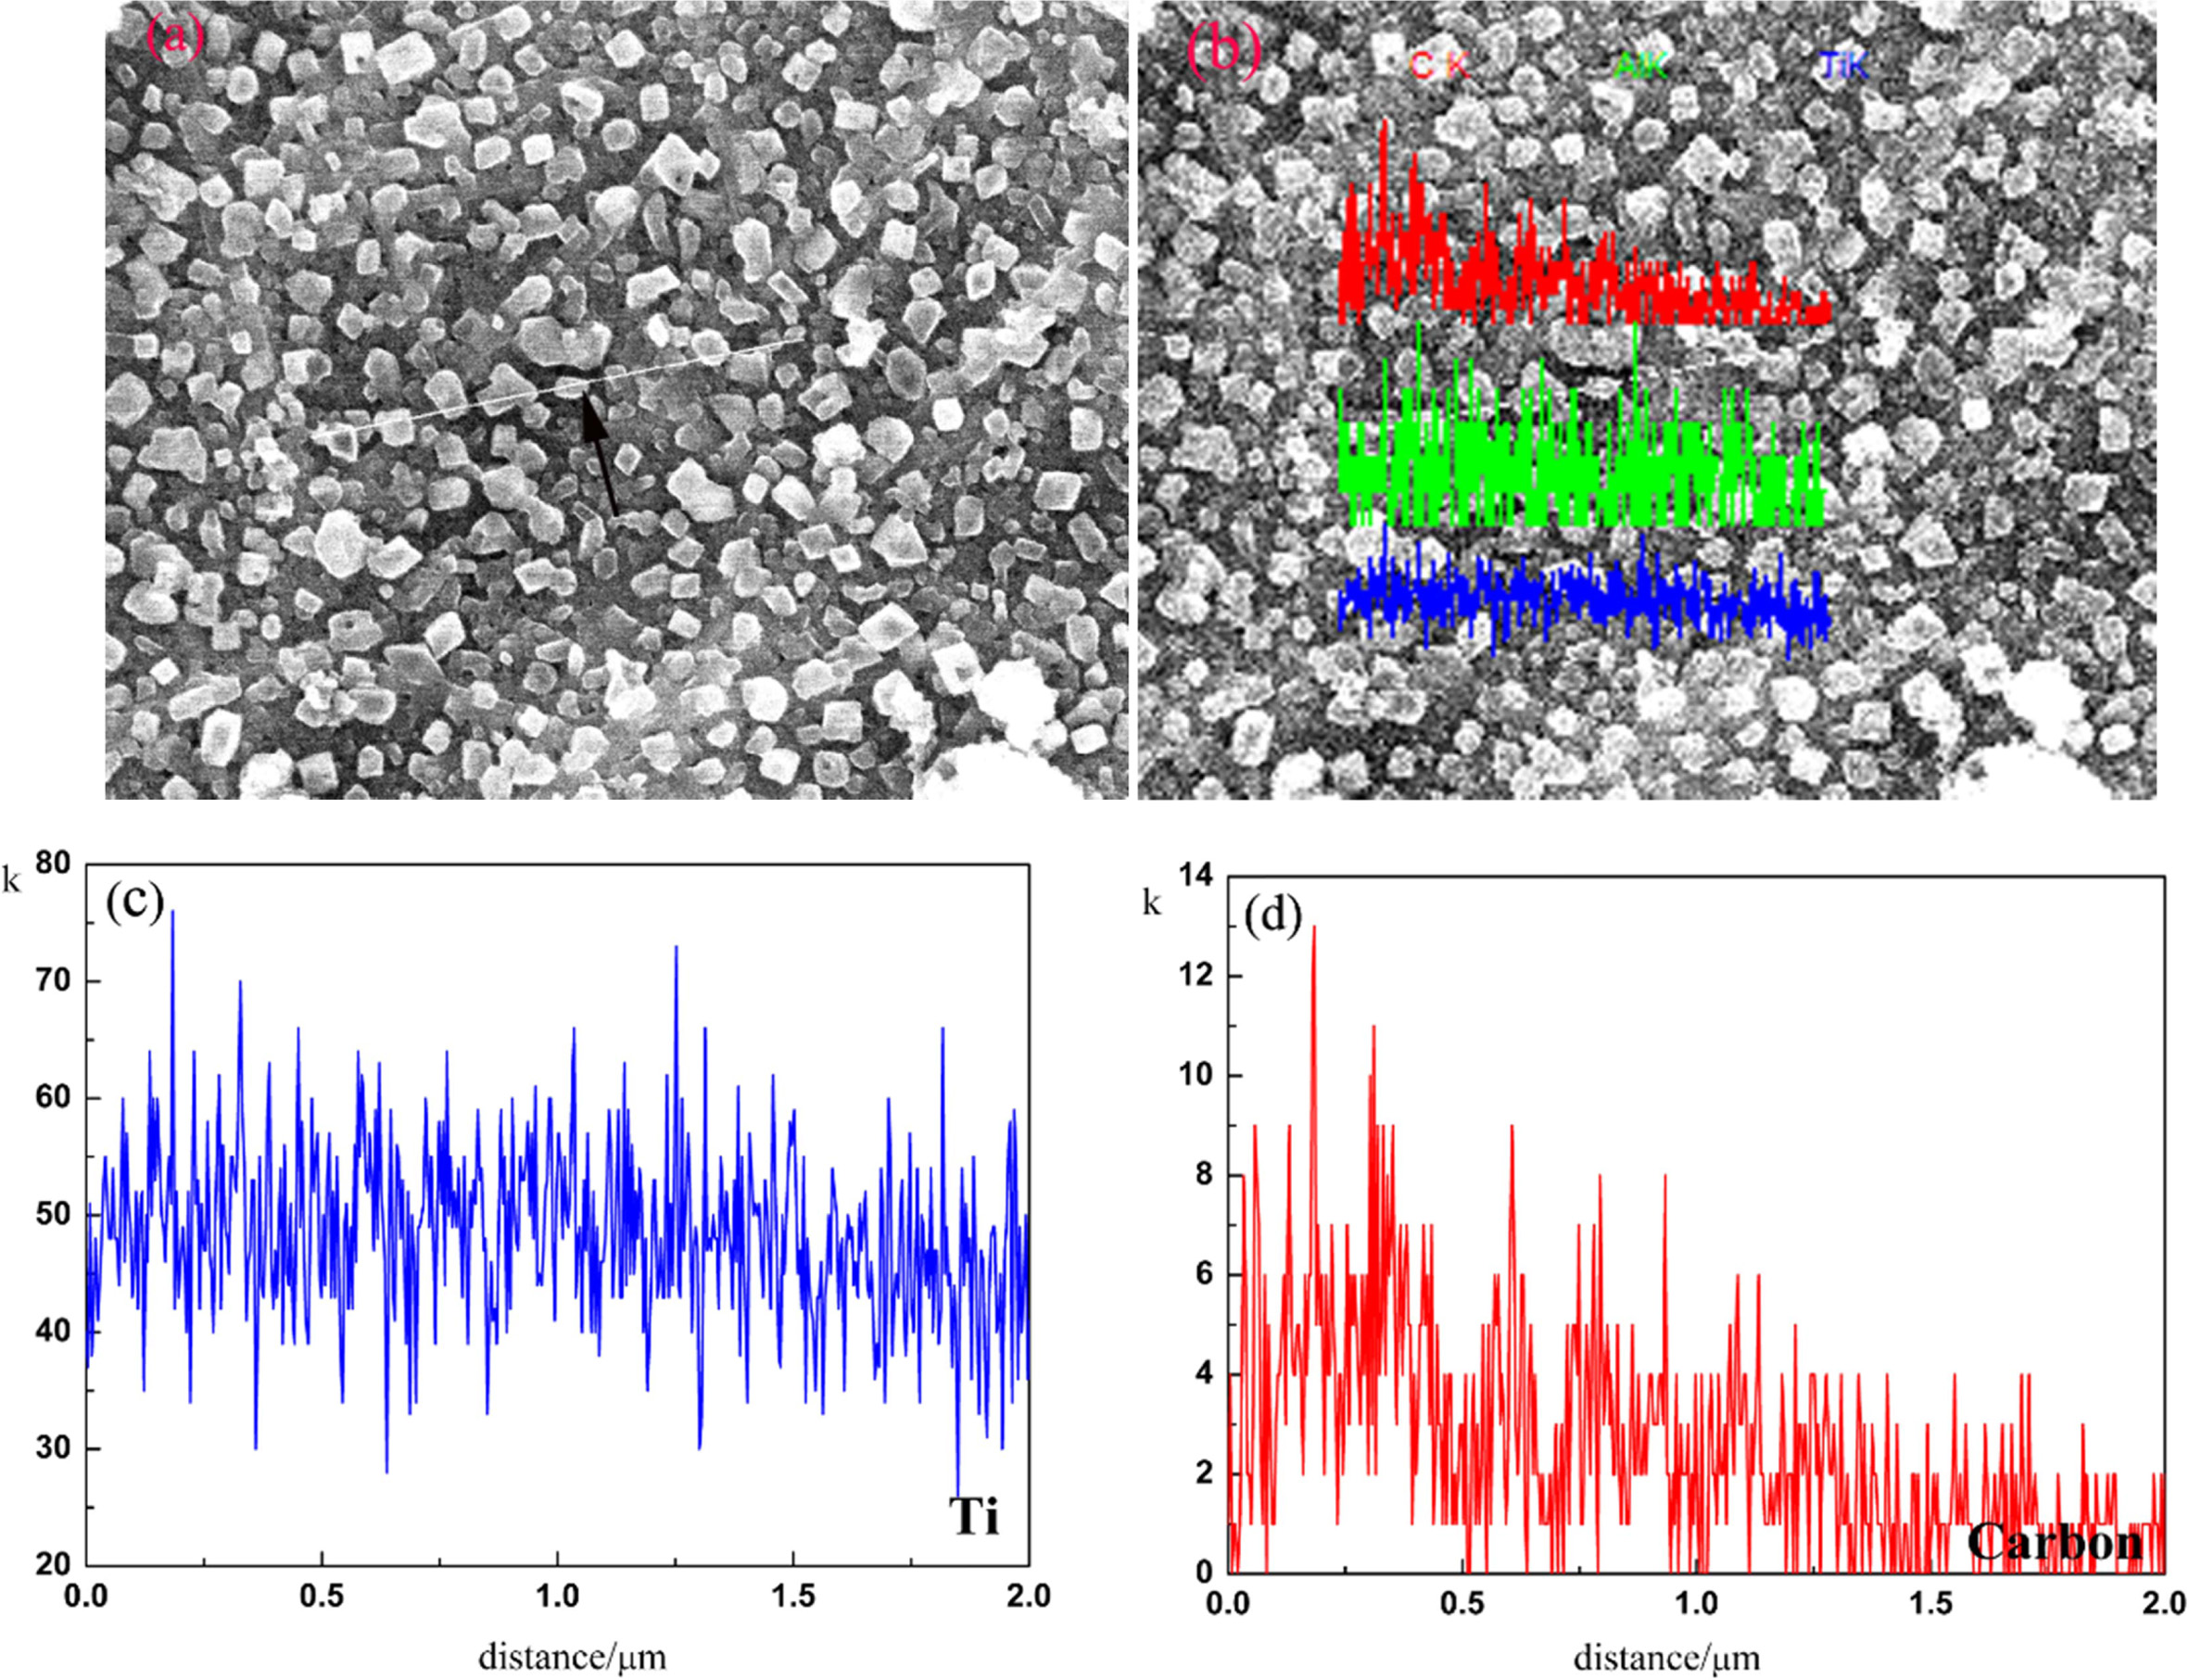
contains Ti and carbon (arrowhead). Additionally, the EDS of
one particle was not completely proven the whole TiC powders, so it was
necessary to do the EDS line scan for particles (arrowhead) (see Fig 8(a)). The
straight line in Fig. 8(b) was a reference line for the EDS line scan; the
signal profiles of line scans for Ti and carbon following this reference line
were also shown. Figs. 8(c) and (d) show the total recorded EDS line scans for Ti and
carbon, respectively. The EDS profiles of line scans shown in Fig. 8(b) were consistent
with the scans in Figs. 8(c) and (d). When scanning along the reference line,
the synchronized alternation of Ti and carbon signals were clearly seen in
Figs. 8(c) and (d). That is to say, the changes in Ti and carbon contents with
distance across the particles were similar and just as for the line scans, Ti
and carbon showed similar behavior.
|
Fig. 2 FTIR spectra for starting material (acac) and material after
being reacting with Ti(OC4H9)4. |
|
Fig. 3 FTIR spectra of TiC precusor. |
|
Fig. 4 TG-DSC of TiC precursor from room temperature to
900 °C in argon. |
|
Fig. 5 XRD of patterns of (a) precursor, and the precursor reduced carbothermally at (b) 1,400 °C. |
|
Fig. 6 Raman spectra of (a) precursor; (b) TiC powders. |
|
Fig. 7 SEM image of TiC powders along with the EDS pattern. |
|
Fig. 8 SEM image TiC powders (a, b), and the EDS spectra for elements Ti (c) and carbon (d). |
TiC powders were synthesized by sol-gel method
using Ti(OC4H9)4 and C6H12O6
as starting materials. It was notable that the monophasic TiC could be obtained
at 1,400 °C
for 2 h in argon. Moreover, acac as stabilizer reacted with
Ti(OC4H9)4 formed stable six-member ring
due to the existence of tautomer, prevent the nucleophilic
attack of water, which reduced the hydrolysis rate of Ti(OC4H9)4.
Besides, the formation of TiC phase was characterized not only by XRD but also
by Raman and the results showed that the peaks at 403 cm-1,
513 cm-1,
and 629 cm-1
were ascribed to the characteristic peaks of TiC in Raman spectra. Finally, the SEM shows TiC powders with equiaxed shape and the average
grain size of TiC particles was ca. 1 um. And EDS indicated that the particles
contain elements of Ti and carbon according to dot and line scan.
This work was supported by Doctoral Scientific Research
Foundation of Changzhi Medical College (BS201915),
Applied Basic Research Program of Shanxi Province
(201701D221046), and Innovation Team Project of Changzhi
Medical College (CX201904).
- 1. M.B. Rahaei, R.Y. Rad, A. Kazmzadeh, and T. Ebadzadeh, Powder Tech. 217 (2012) 369-376.
-

- 2. S.B. Li, W.H. Xiang, H.X. Zhai, and Y. Zhou, Powder Tech. 185 (2008) 49-53.
-
- 3. C. Benoit, H. Ellen, K. Nikhil, V. Dominique, and D. Sylvain, Powder Tech. 157[1-3] (2005) 92-99.
-
- 4. S. Li, K. Kondoh, H. Imai, B. Chen, L. Jia, J. Umeda, and Y. Fu, Mater. Des. 95 (2016) 127-132.
-
- 5. L. Cheng, Z. Xie, and G. Liu, J. Eur. Ceram. Soc. 33[15-16] (2013) 2971-2977.
-
- 6. C. Magnus, T. Kwamman, and W.M. Rainforth, Wear 422-423 (2019) 54-67.
-
- 7. J. Zhang, L. Wang, W. Jiang, and L. Chen, Mater. Sci. Eng. A 487[1-2] (2008) 137-143.
-
- 8. B. Zou, W. Ji, C. Huang, J. Wang, S. Li, and K. Xu, J. Alloy. Comp. 585 (2014) 192-202.
-
- 9. S. Liu and D. Liu, Int. J. Refract. Metals Hard Mater. 82 (2019) 273-278,
-
- 10. M. Sribalaji, B. Mukherjee, S.R. Bakshi, P. Arunkumar, K. Suresh Babu, and A.K. Keshri, Compos. B Eng. 123 (2017) 227-240.
-
- 11. J.X. Xue, J.X. Liu, G.J. Zhang, H. Bin Zhang, T. Liu, X.S. Zhou, and S.M. Peng, Scr. Mater. 114 (2016) 5-8.
-
- 12. X. Yue, Z. Cai, X. Lü, J. Wang, and H. Ru, Mater. Sci. Eng. A 668 (2016) 208-214.
-
- 13. Z. Shi, W. Shao, T. Hu, C. Zhao, X. Xing, Y. Zhou, and Q. Yang, J. Alloy. Comp. 805 (2019) 1052-1059.
-
- 14. L. Cheng, Z. Xie, and G. Liu, Ceram. Int. 39[5] (2013) 5077-5082.
-
- 15. X. Chen, J. L. Fan, and Q. Lu, J. Solid State Chem. 262 (2018) 44-52.
-
- 16. S. Mohapatra, D.K. Mishra, and S.K. Singh, Powder Tech. 237 (2013) 41-45.
-
- 17. Y.C. Woo, H.J. Kang, and D.J. Kim, J. Eur. Ceram. Soc. 27[2-3] (2007) 719-722.
-
- 18. L. Tong and R.G. Reddy, Scr. Mater. 52[12] (2005) 1253-1258.
-
- 19. M. Razavi, M.R. Rahimipour, and A.H. Rajabi-Zamani, J. Alloys Compd. 436[1-2] (2007) 142-145.
-
- 20. X.L. Hu, Y. Liu, W.N. Zhang, K. Chen, H. Yin, L.K. Zeng, Z.X. Chen, and Z.L. Zhao, China Patent 01129991.6. (2003)
- 21. L.S. Cui, J.L. Zhao, X.L. Cui, Y.J. Zheng, and W.F. Gao, China Patent 02159005.2. (2006)
- 22. D.W. Lee and B.K. Kim, Scr. Mater. 48[11] (2003) 1513-1518.
-
- 23. L.L. Ye and M.X. Quan, Nanostruct. Mater. 5 (2001) 103-105.
- 24. B. Ghosh and S.K. Pradhan, Mater. Chem. Phys. 120[2-3] (2010) 537-545.
-
- 25. M. Razavi, M. R. Rahimipour, and R. Kaboli, J. Alloy Compd. 460[1-2] (2008) 694-698.
-
- 26. R. Alexandrescu, E. Borsella, S. Botti, M.C. Cesile, S. Martelli, R. Giorgi, S. Turtu, and G. Zappa, J. Mater. Sci. 32 (1997) 5629-5635.
-
- 27. M.D. Sacks, C. Wang, Z. Yang, and A. Jain, J. Mater. Sci. 39 (2004) 6057-6066.
-
- 28. C.R. Rambo, J. Cao, O. Rusina, and H. Sieber, Carbon 43[6] (2005) 1174-1183.
-
- 29. H. Zhang, F. Li, Q. Jia, and G. Ye, J. Sol-Gel Sci. Technol. 46(2008) 217-222.
-
- 30. M. Umalas, V. Reedo, A. Lohmus, I. Hussainova, and K. Juhani, Key Eng. Mater. 527 (2012) 62-67.
-
- 31. C. Giordano and M. Antonietti, Nano Today 6[4] (2011) 366-380.
-
- 32. M.S. Kwon, S.G. Lee, and K.M. Kim, J. Ceram. Process. Res. 19[4] (2018) 316-320.
- 33. O.M. Serrato and J.S. Rodríguez, J. Ceram. Process. Res. 19(4) (2018) 306-310.
- 34. W. Liu, J.L. Yang, H. Xu, Y.Z. Wang, S.L. Hu, and C.Y. Xue, Adv. Powder Tech. 24[1] (2013) 436-440.
-
- 35. X. Chen, J.L. Fan, and Q. Lu, J. Solid State Chem. 262 (2018) 44-52.
-
- 36. M.V. Klein, J.A. Holy, and W.S. Williams, Phys. Rev. B 17 (1978) 1546-1556.
-
- 37. M. Amer and M.W. Barsoum, J. Appl. Phys. 84 (1998) 5817-5824.
-
- 38. J.R. Ferraro, K. Nakamoto, and C.W. Brownand, in “Intro- ductory Raman Spectroscopy” (Academic Press, 2003) p.406-421.
- 39. B.H. Lohse, A. Calka, and D. Wexler, J Alloys Compd 434-435 (2007) 405-409.
-
- 40. P.V. Huong, A.L. Verma, J.P. Chaminade, L. Nganga, and J.C. Frison, Mater. Sci. Eng. B 5[2] (1990) 255-260.
-
- 41. N. Oláh, M. Veres, A. Sulyok, M. Menyhárd, J. Gubicza, and K. Balázsi, J. Eur. Ceram. Soc. 34[1-4] (2014) 3421-3425
-
- 42. S. Pellegrino, L. Thomé, A. Debelle, S. Miro, and P. Trocellier, Atoms. 327 (2014) 103-107.
-
 This Article
-
2020; 21(6): 615-621
Published on Dec 31, 2020
- 10.36410/jcpr.2020.21.6.615
- Received on Aug 30, 2019
- Revised on Dec 26, 2019
- Accepted on Jan 21, 2020
Services
- Abstract
introduction
experimental
results and discussion
conclusions
- Acknowledgements
- References
- Full Text PDF
Shared
Correspondence to
- Yun Zhang
-
Department of pharmacy, Changzhi Medical College, Shanxi, 046012, China
Tel : +863558503489 Fax: +863558503489 - E-mail: zhangyun0320@126.com
Clean-Energy Research Institute(CRI), Hanyang University, 222, Wangsimni-ro, Seongdong-gu, Seoul, 04763, Korea
E-mail: jcpr@hanyang.ac.kr