


- Photocatalytic degradation of synthetic dye by immobilised doped nanoparticles on polyurethane foam reactor using RSM
T. Usharania,b,*, R. Baskarb and B. Palanisamyc
aDepartment of Chemical Engineering, Erode Sengunthar Engineering College, Perundurai 638 057, India
bDepartment of Food Technology, Kongu Engineering College, Perundurai 638 052, India
cDepartment of Chemistry, J.K.K. Nataraja College of Arts & Science, Komarapalayam 638 183, India
The aim of this work is to
optimize the functional factors that influence the efficiency of the
photodegradation of methylene blue using SiO2–TiO2
nanoparticles on polyurethane foam reactor by UV-TiO2 photocatalytic
process. The experimental factors like dye concentration, pH value,
temperature, reaction time are analyzed by RSM (Response Surface Methodology)
to achieve the efficacy of the best textile dye decomposition. The effect of
operational factors to check the photodegradation efficiency of the methylene
blue (MB) for SiO2 nanoparticles and SiO2-TiO2 nanoparticles
are examined by response surface methodology and contour plots. The degradation
percentage of MB by SiO2 and SiO2-TiO2 nanoparticles
are 40.32% and 67.01% respectively. The best values of MB decomposition is
achieved by SiO2-TiO2 with 10 ppm initial dye
concentration, pH 6.88, temperature of 32 oC and 480 min
reaction time. The satisfactory results is obtained through the correlation of
the experimental values and predicted data by regression analysis (R2
= 0.9984).
Keywords: TiO2- SiO2 nanoparticles, Polyurethane foam, Photocatalytic degradation, Methylene blue, Response surface methodology
Efficient elimination and separation processes are important
for purifying the polluted water resources in the environment. The water
reservoirs are always polluted by reason of unsystematic
methods implemented by the dyeing, textile, paper, pharmaceutical and
sugar industries and so on, during the release of hazardous and toxic chemicals
[1,2]. Textile dye compounds are highly complicated and cannot be
biodegraded using normal methods. But in a few occasions, conversion of carcinogenic
byproducts takes place by partial degradation. Therefore,
physicochemical and various biological methods
were developed for the decomposition of textile dye liquid waste from
industries. Coagulation, precipitation, as well as oxidizing agents were
utilized for degradation of various organic dyes. Significant limitations of
chemical treatment techniques are that this process needs costly chemical
compounds and the yield produced after textile dye effluent process are also highly contaminating the water bodies.
Furthermore, they occasionally form a secondary pollution that requires chemical oxidation and additional
techniques. Newly, an Advanced
Oxidation Process (AOP) used to increase the complete degradation of organic
pollutants [3-5]. AOP is an emerging
process for the photodegradation of various contaminants in air and water
because of the highly efficient, non-solubility, non-toxicity, feasibility at low pressure and temperature, and low fabrication cost [6-9]. Various
semiconductors (sulfides and oxides)
like TiO2, ZnO, WO3, SiO2, SrTiO3, CdS and ZnS are typically utilized as
photocatalysts for pollutant degradation [10-16].
To enhance the degradation efficiency optimization of
various factors such as pH, concentration, time and temperature plays a very
important role in degradation system. Conventional wastewater treatment methods
are multivariable and the optimization using the classical
methods are unreliable, inflexible and time-consuming [17-19].
Hence, an alternative process which will be more effective and can be adapted
for parameter optimization of different
wastewater treatment methods is
preferred. RSM is most efficient and extensively used method. RSM can be
utilized to optimize and examine the effects of many independent variables on
treatment method to attain the maximum output and system performance
optimization [20-22]. RSM has been
utilized to optimize various types of the wastewater treatment methods for industries like paper,
tannery, textile etc [23-27]. In present trend the direction of replacing
this ineffective operation with effective methods
(chemometric), namely RSM, DOEs (statistical designs of experiments) [24]. This practical approach to achieve the
most favorable factors is an proficient practice for use under a multivariable
setup. RSM being effectively applied to several methods to attain optimization
by experimental designs, together with titania coated/UV light photo oxidation
[28,29]. Some studies have been already stated the photodegradation and
decolorization efficiency of textile dye using immobilized titanium dioxide
nanoparticles on poly Polyurethane Foam Reactor [5, 30, 31].
Various studies have been explained for the enhancement of the catalytic activity of
bare titania [11]. Investigation of
photocatalytic operations are broadly performed in slurry methods operating
using TiO2 powder materials [14,17]. The major difficulty in
this process is the recycling and isolation of titania powder particles after
degradation treatment, which is costly process and time consuming. To avoid
this recycling issues, photocatalytic materials are immobilized on larger
surfaces such as polymer foam, polymer spheres, ceramic foam [5,15]. For
large scale water treatment process this type of photocatalytic degradation
system is greatly advantageous. Although, currently small development has been
completed in the improvement in large scale applications of photocatalytic
water treatment technology. The existence of various system conditions that
need fast treatment testing is the one scientific barriers to enhance
photocatalytic treatment technology.
In the current work, doped SiO2-TiO2
nanoparticles on polyurethane foam reactor is employed to photocatalytic
degradation. This photocatalytic reactor is highly useful for large scale water
treatment. The optimization efficiency of the photodegradation of methylene
blue by immobilized SiO2-TiO2
nanoparticles on polyurethane foam reactor
the pH, initial dye concentration, temperature, reaction time
have considerable effects on the decomposition of textile dye in
photodegradation method [32,33]. Hence, these factors taken into account
as independent variables, RSM was utilized to investigate
their impacts and to upgrade the effectiveness of the
photodegradation of MB.
Materials
In this study, analytical grade reagents such as titanium
isopropoxide, ammonium hydroxide, ethanol, tetraethyl ortho silicate,
hydrochloric acid, isopropanol, tetrahydrofuran, α-terpineol, ethyl
cellulose are procured from Merck Specialties Private Ltd,
Mumbai and these chemicals utilized in pure form. All the solutions were
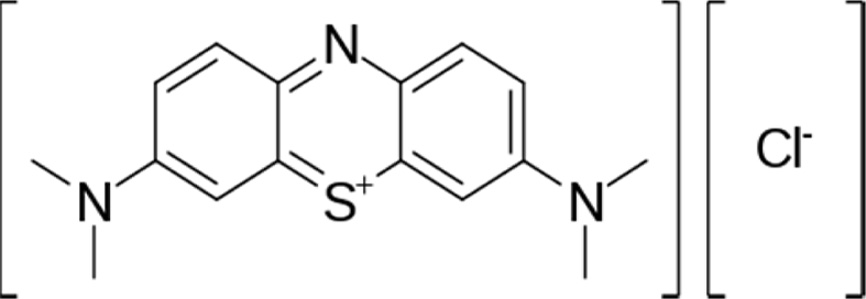
made-up with triple distilled water. Methylene blue is a synthetic dye. C16H18N3SCl.
MB dye sample was acted as model pollutant for degradation studies.
The MB dye chemical structure is shown in Fig. 1.
Synthesis
of pure SiO2
Pure SiO2 was synthesized by hydrolysis of the
TEOS at room temperature in alkaline medium. About 15 ml of H2O and
4 ml of NH4OH were mixed with 100 ml of ethanol into Teflon coated
reactor and stirring with magnetic stirrer for 20 min. After that TEOS (3 ml)
were added instantly to above said reaction mixture and magnetic stirring
continued for another 1 h. Afterwards hydrolysis polycondensation process, the
reaction mixture used to be neutralized by 5 mol per litre hydrochloric acid
and centrifuged for 10 min at 3,000 rpm. The supernatant was not needed and the
precipitate washed thrice with distilled water. The obtained residue was dried
by 70 oC for 15 h.
Synthesis
of SiO2-TiO2
Powdered silica material was dried by 110 oC
for 1hour and 0.2gram taken from it, that diffused in 30 ml 2-propanol by
sonication process for 1 hour. This SiO2 suspension
then shifted to Teflon coated reactor and 50 ml of 2-propanol were mixed and
allowed for 5 min under constant stirring. Then 18.2 g of
Titanium isopropoxide were immediately added and then lid was firmly closed in
the reactor. The reaction mixture was stirred further another 19 h with
magnetic stirring. Then 9 ml alcohol-water mixture (6 ml 2-propanol: 3 ml H2O)
was added gradually and stirring continued another 1 h. The suspension
(colloidal gel) of SiO2-TiO2 was then centrifuged for 10 min at
3,000 rpm, the supernatant was not needed and the precipitate washed with 2-propanol once and with double distilled water twice. The amorphous TiO2 was
crystallized using hydrothermal
technique. The obtained amorphous mixture were suspended with 50 ml water and
applied to hydrothermal process at
105 oC for 24 h in a homemade air-proof teflon coated reactor.
After hydrothermal process the
samples were centrifuged once again for 10 min at 3,000 rpm and that precipitate
were dried in air at 100 oC.
Synthesis
of pure SiO2 and doped SiO2-TiO2
SiO2 paste was prepared by adding 1 g of SiO2,
2.5 g of α-terpineol (C10H18O), 12 ml of ethanol (C2H5OH)
and 0.25 g
of ethyl cellulose in a beaker and kept under constant stirring in magnetic
stirrer for about 24 hrs. This process can be repeated for SiO2-TiO2
nanoparticles. This paste is used for fixing in the polyurethane foams.
Synthesis
of dye
Methylene blue is a heterocyclic aromatic chemical
compound. The methylene blue was collected from laboratory. The prepared stock
solution of methylene blue by dissolving dye (MB 10 g) in 1 L of
double distilled water. The different concentration solutions of MB were
prepared with serial mixing.
Photocatalyst
characterization
There are various techniques existing for characterization
of nanoparticles. X-Ray diffraction analysis of the synthesized materials was
characterized by the XPERT-PRO, Field emission scanning electron microscopic image
nanomaterials were captured by ZEISS instruments, metal
composition of the SiO2 and SiO2-TiO2
nanoparticles taken by ZEISS SEM
attached with EDAX by Oxford Instruments, UV-Vis spectra of the prepared catalysts
were analyzed by UV–visible spectrophotometer (model
AU2701).
Photoreactor and experimental
procedure
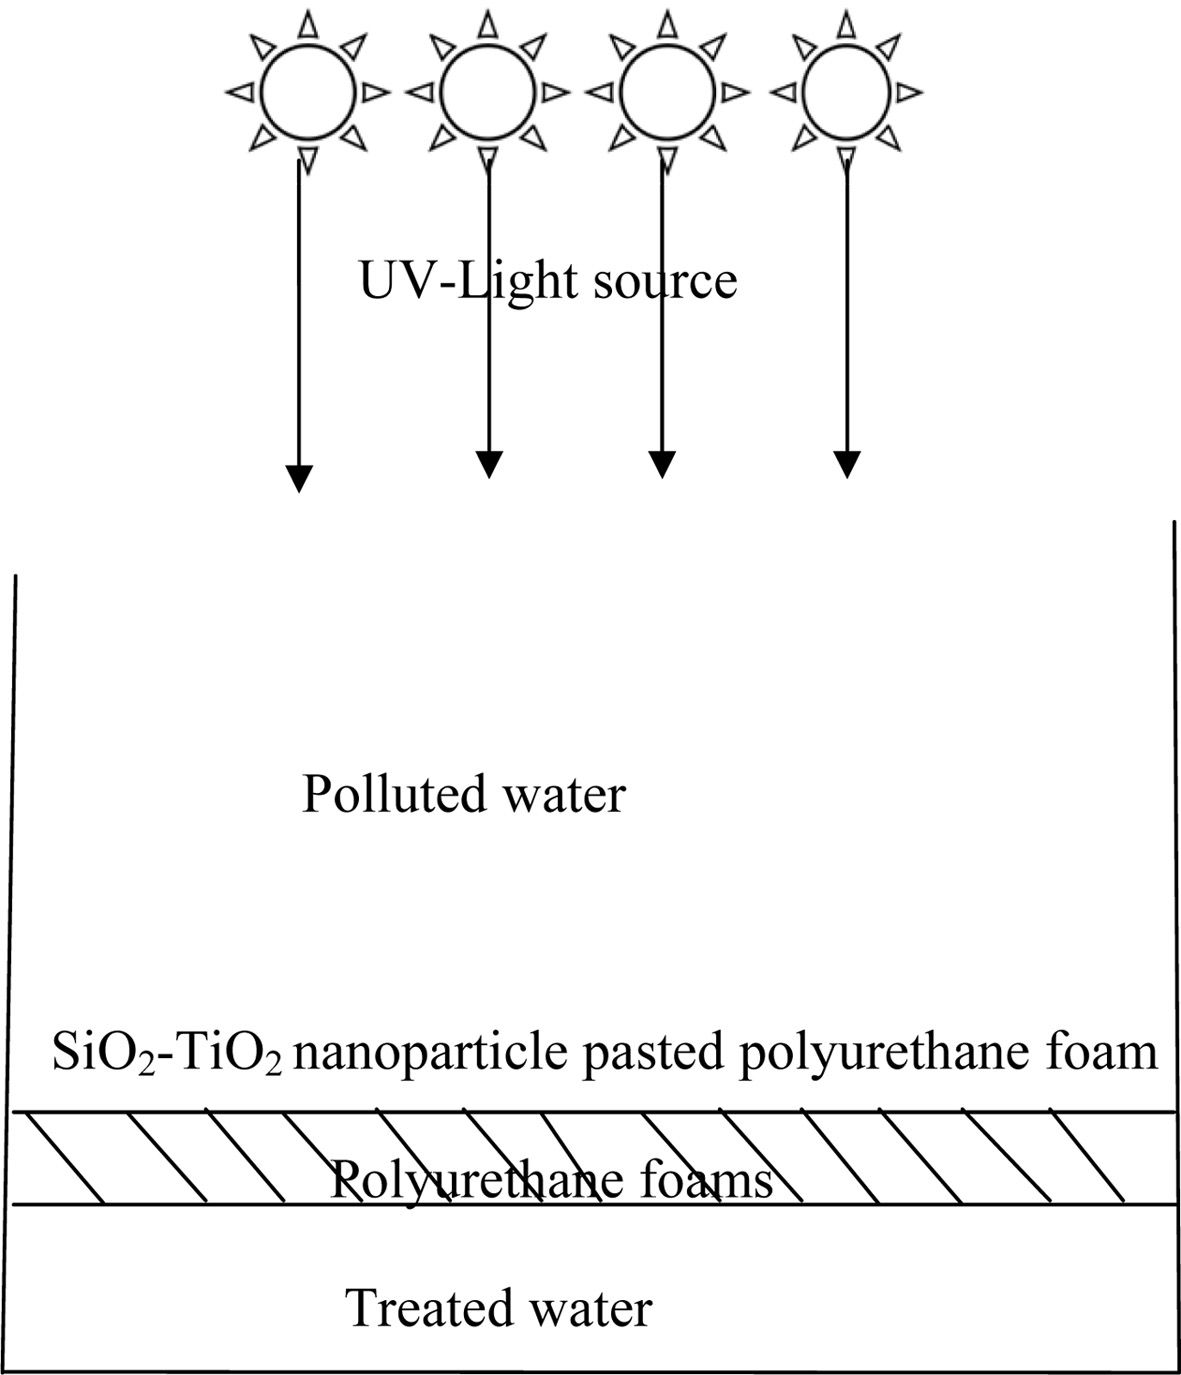
Photochemical reactor, Philips TUV lamp, high pressure pump,
polyurethane foams, nanoparticles paste, Reactor setup, 1/4”
tubes. The SiO2-TiO2 nanoparticle pasted polyurethane
foam was acted as the photocatalyst for the degradation of MB. The design of
photo reactor are fixed in two certain position reduce nanoparticles to escape
from the reactor. This type of reactor can be created for SiO2 and
SiO2-TiO2 separately. The reactor have the capacity of
1,500 ml and the effluent tank have a capacity of 5000 ml.
The fixed SiO2 pasted polyurethane foams in the
reactor was placed in the photochemical reactor with the setup of Ultraviolet
Lamps and connected with high pressure pump to the Effluent tank. This setup is
used for circulating the effluent in the reactor setup for about 8 hours and
the UV-VIS spectroscopy can be done for each hours and for each reactors. This
same process is to be repeated for Reactor with the SiO2-TiO2
paste coated polyurethane foams. Fig. 2 Fig. 3
|
Fig. 1 Structure of MB. |
|
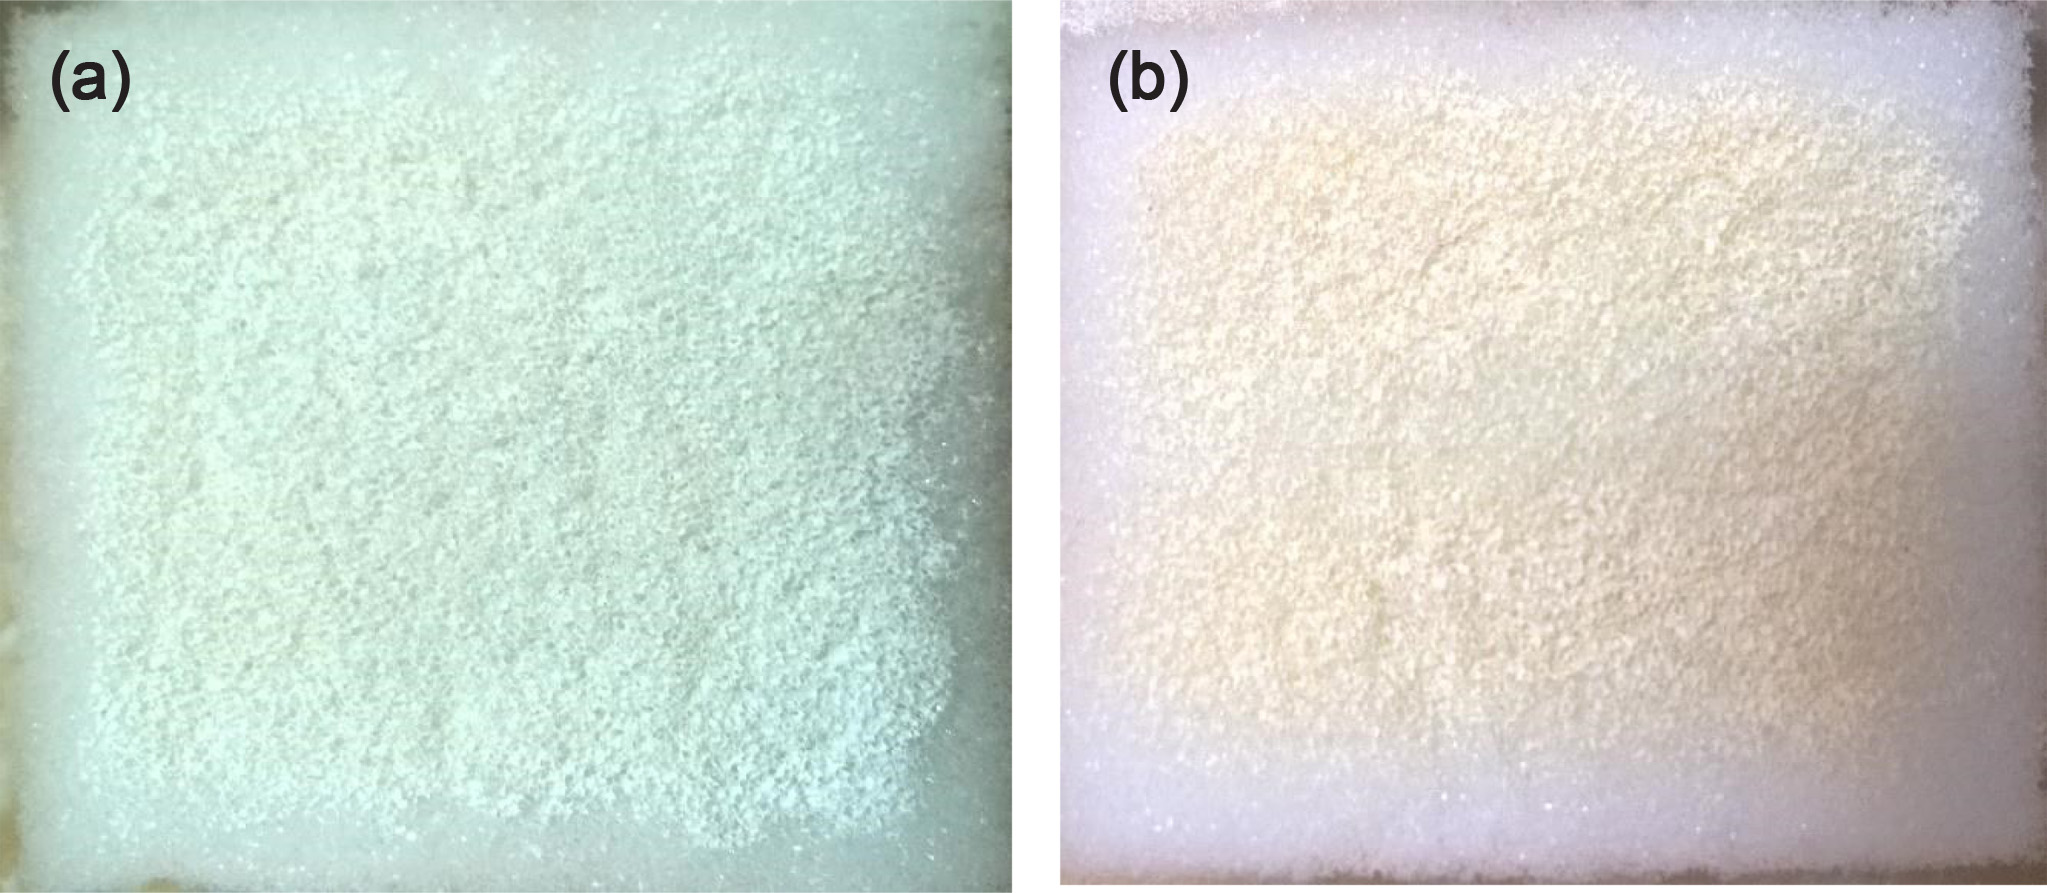
Fig. 2 (a) SiO2 pasted PU foams. (b) SiO2- TiO2 PU foams. |
|
Fig. 3 Photo catalytic reactor set up. |
XRD
analysis
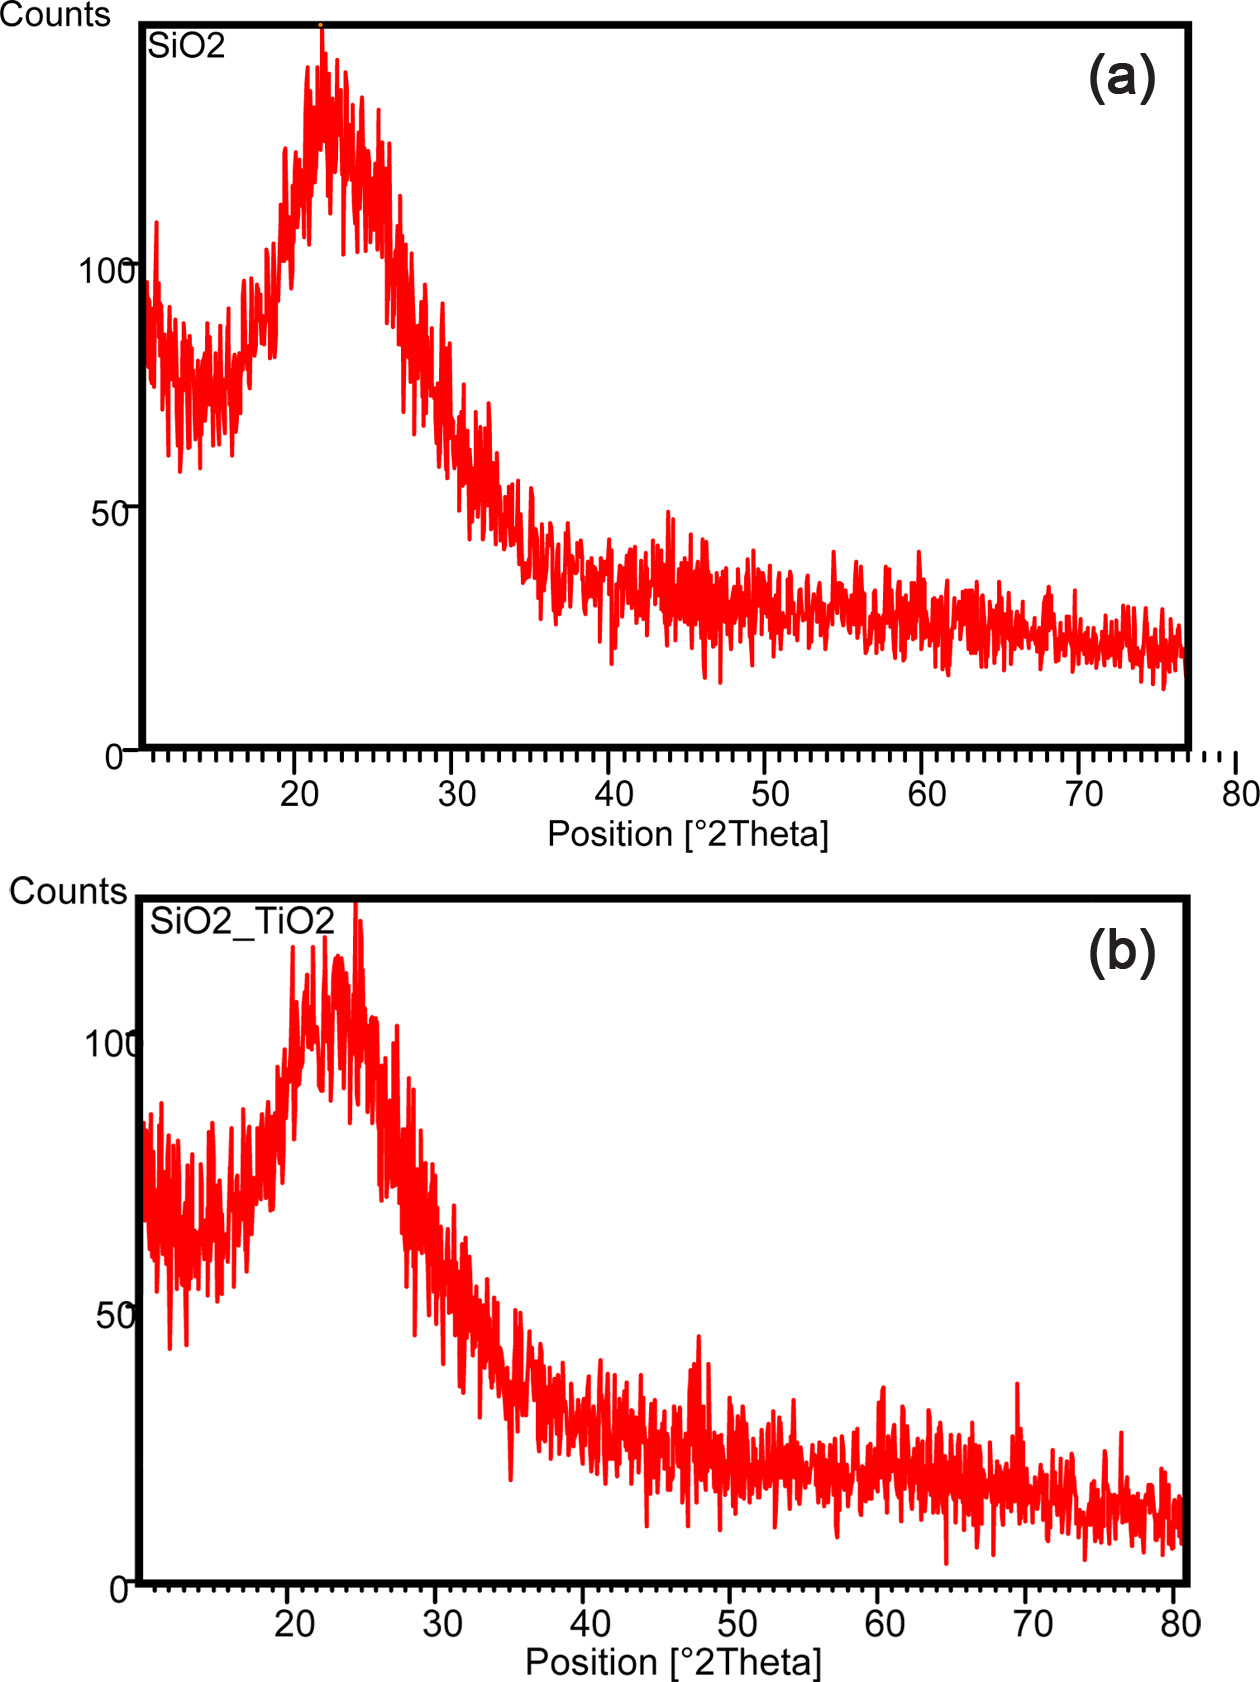
Different factors such as particle size, dislocation
density and strain were calculated by XRD. The XRD patterns of
SiO2 and SiO2-TiO2 nanoparticles were shown
in the Fig. 4(a) and 4(b) respectively. On comparing the SiO2 peak
with the SiO2-TiO2, SiO2-TiO2 shows
a slight deviation which shows the presence of TiO2 material as a
dopant over SiO2, due to this the particle size are increased. The
miller indices (hkl) values which are given the graph based on the reference
JCPDC-02-0406.
The calculated values are shown in the Table 1. The
average size of the particle for pure SiO2 is 3.372 nm, for SiO2-TiO2
nanoparticles the particle size increased to 3.572 nm. This confirms that size
of the particle increases with increasing concentration. Also particle size
increases with doping on TiO2 and the consequent reduction of
bandgap causes red shift in absorption spectrum.
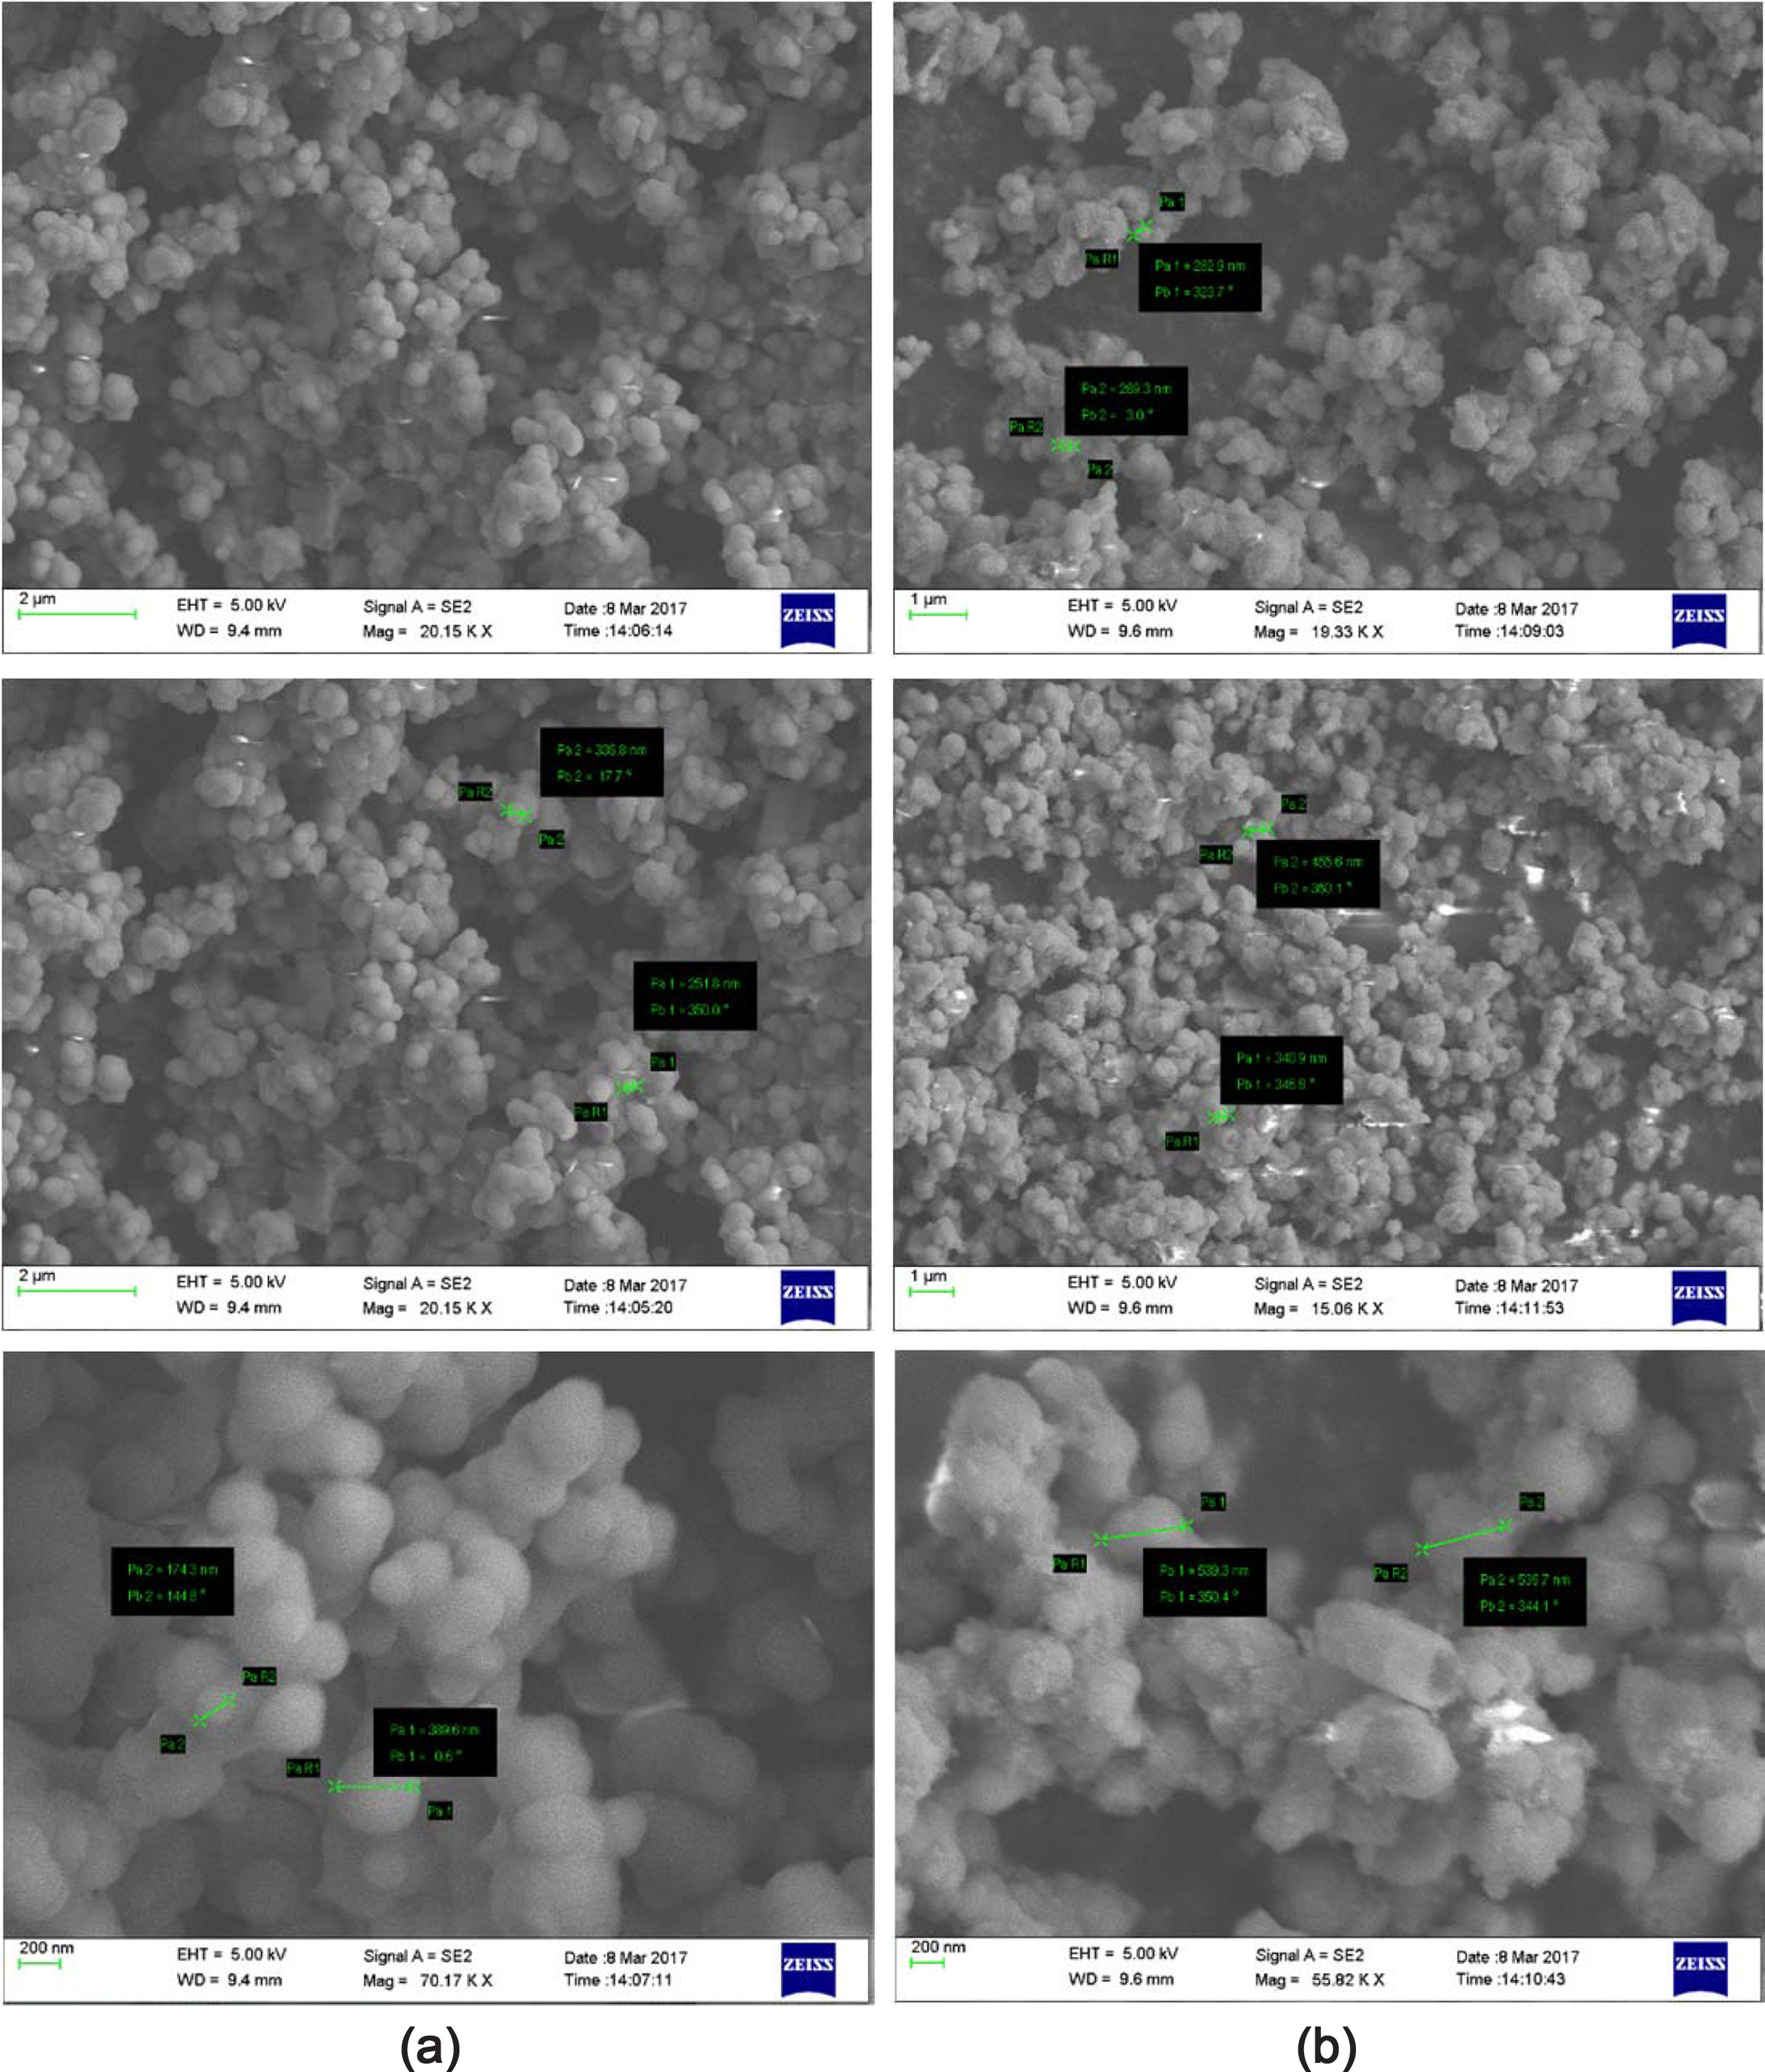
FESEM analysis
The FESEM images of SiO2 and SiO2-TiO2
nano- particles are shown in the
Fig. 5(a) & 5(b). These typical FESEM analysis was visibly confirmed that synthesized
samples are nanoparticles. Surface structure of
nanomaterial plays a very important responsibility in the photocatalytic
applications. The FESEM images shows that surface morphology of nanoparticless,
and its size. The size of SiO2 and SiO2-TiO2
which is shown on line integration of the FESEM software nano-sized particles.
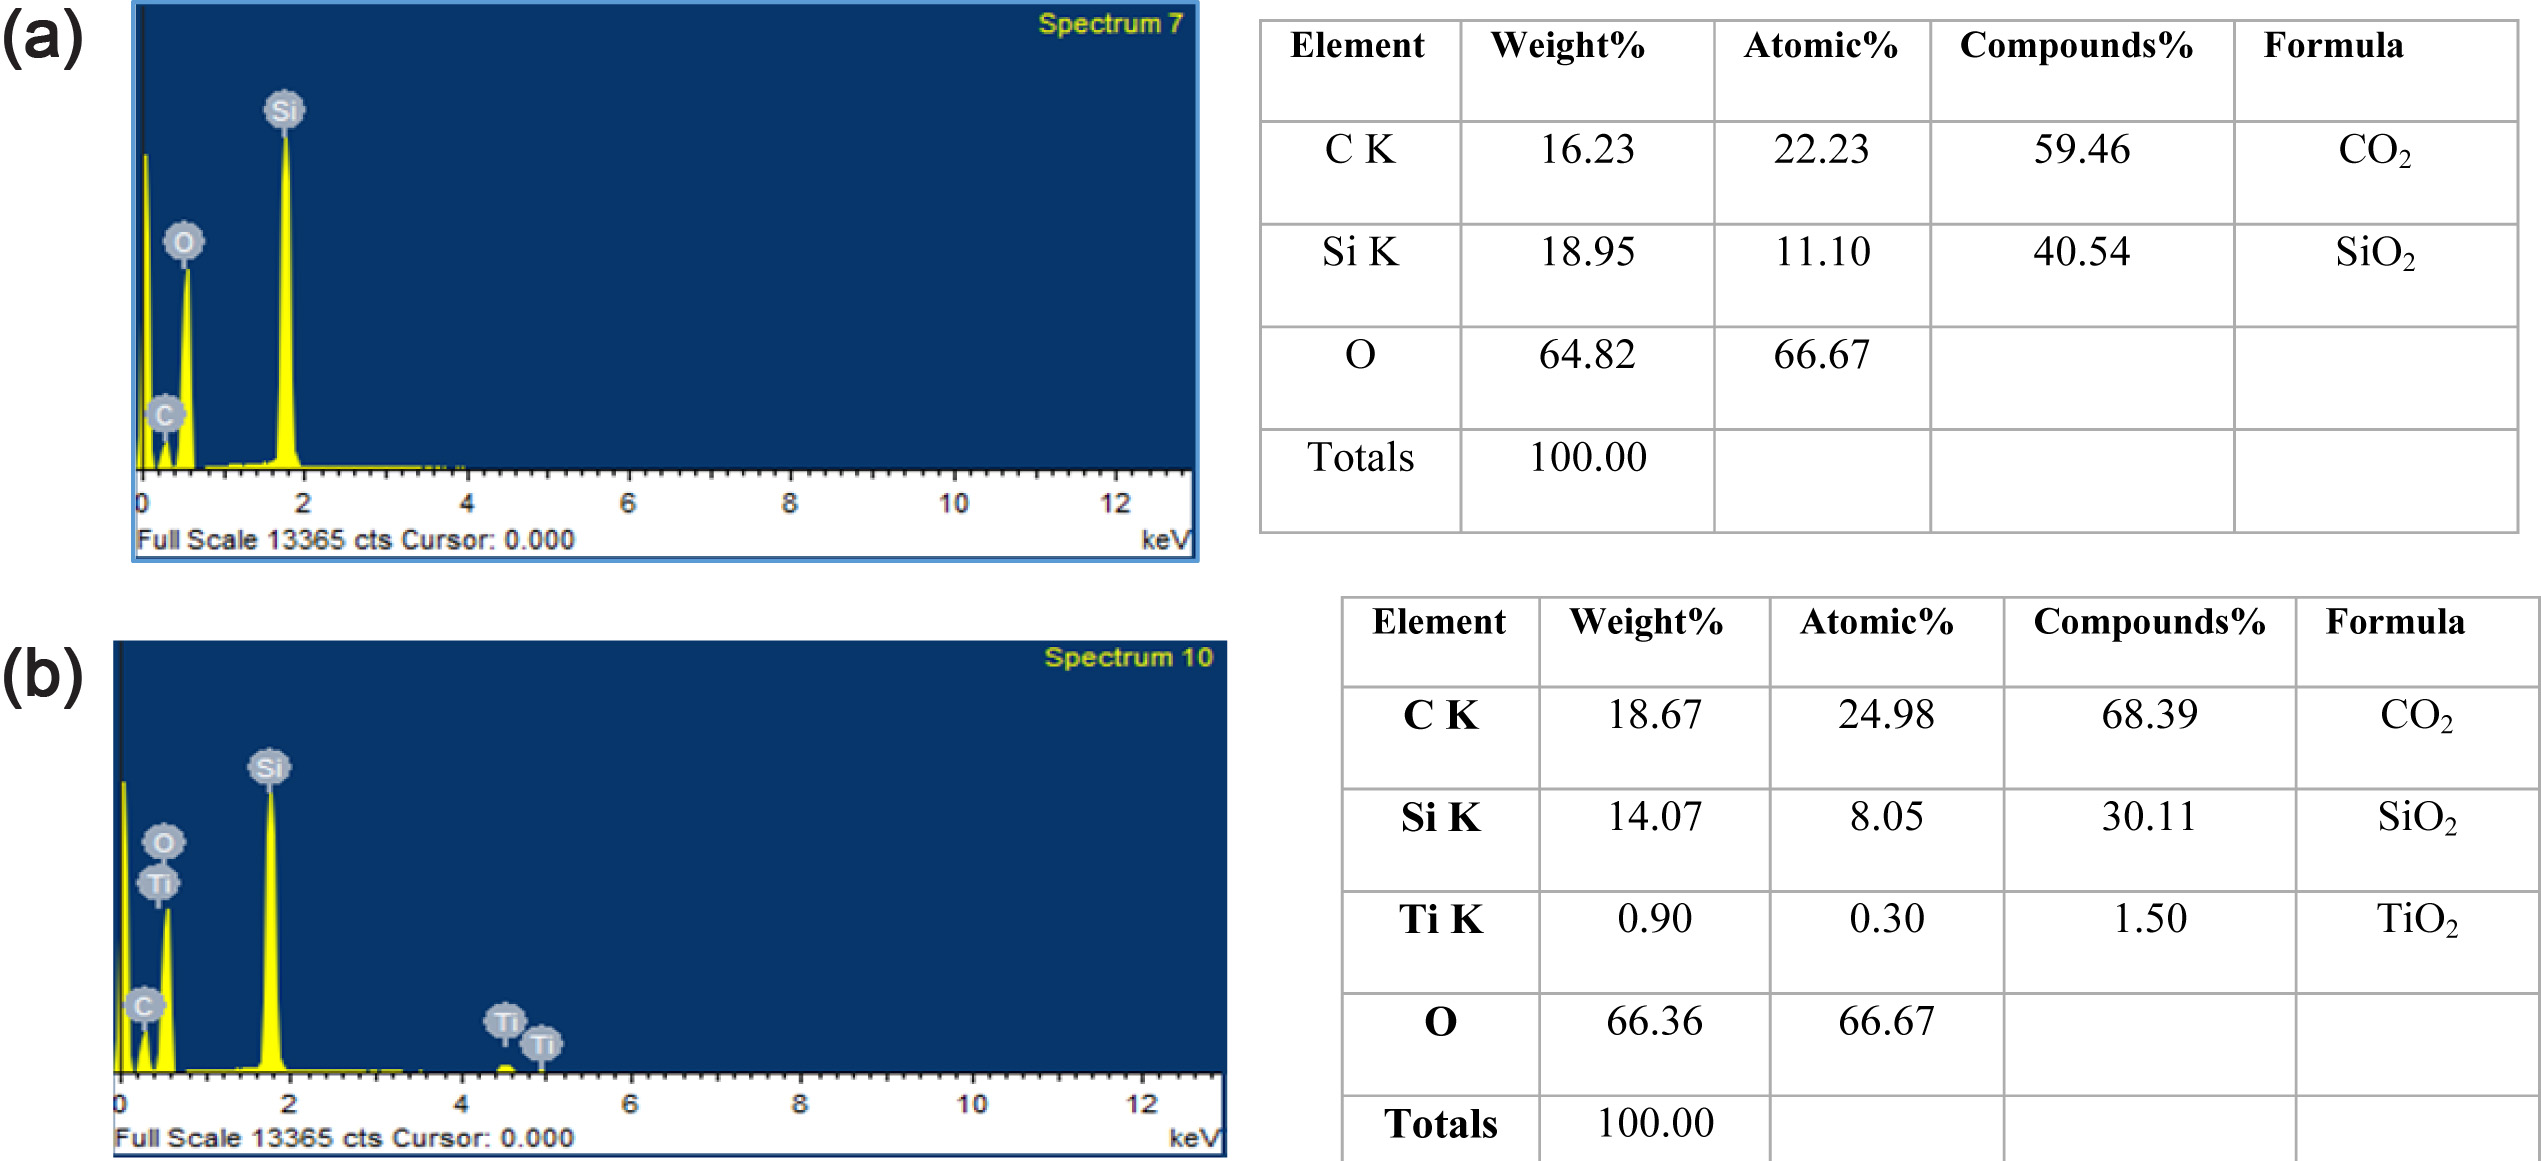
EDAX
analysis
The EDAX analysis of SiO2 and SiO2-TiO2
nano- particles are shown in the
Fig. 6(a) & 6(b). EDAX technique is used to identify the
composition of elements in the prepared nanomaterials. The
EDAX analysis of SiO2-TiO2 nanoparticles revealed that
the existence of all elements with proper composition. According to the
outcomes, the dopant SiO2 completely incorporated into TiO2 lattice
with good interaction.
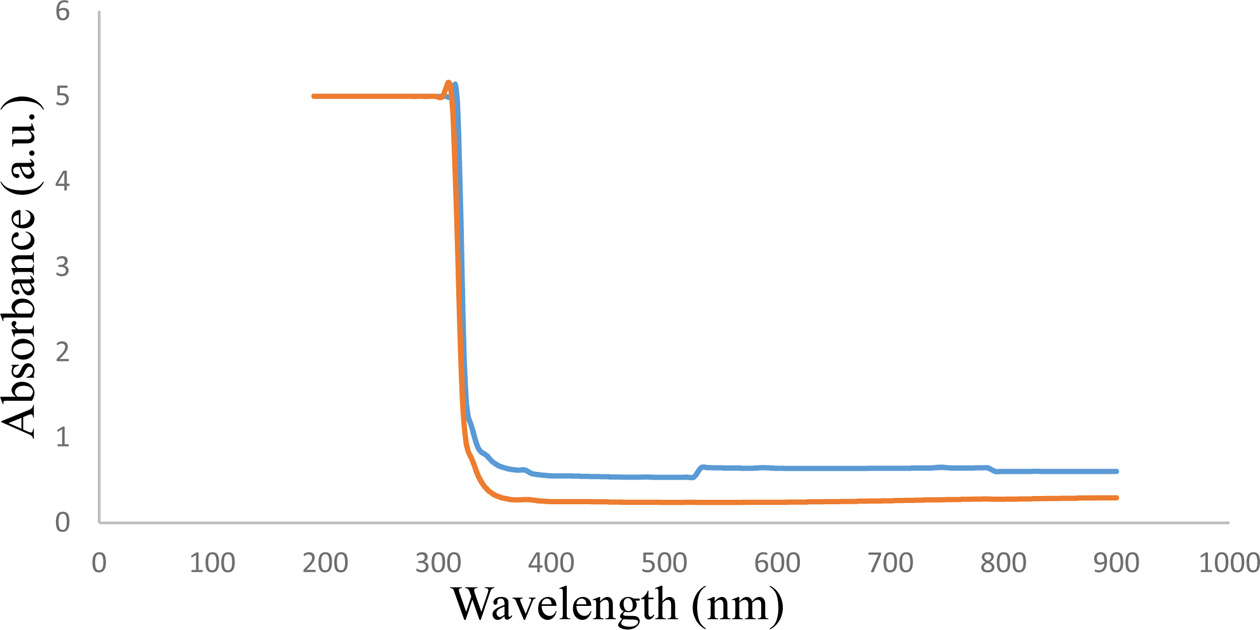
Ultraviolet-Visible spectra of prepared
nanoparticles
The UV-Visible Spectrophotometry of prepared catalysts are
shown in Fig. 7. Optical properties of produced nanoparticles are
recognized using UV-Visible double beam spectroscopy. UV-Visible spectra of SiO2
and SiO2-TiO2 nanoparticles were analyzed from 190 to 700
nm wavelength range. Pure SiO2 and SiO2-TiO2
illustrates the absorption spectral lines at 345 nm and 355 nm. The minute
change in absorption spectra is in accordance with doping of SiO2 in
TiO2. The bandgap (Eg) values of SiO2 and SiO2-TiO2
were estimated using the following formula
E = hc/λ,
Where h is the Plank’s constant, c is the light velocity
and λ is the light wavelength. Bandgap of SiO2 and SiO2-TiO2
were identified to 3.59 eV and 3.54 eV respectively.
Photocatalytic
degradation using SiO2 and SiO2-TiO2 nanoparticles
The systematic behavior of the synthetic nanoparticles
are analyzed in the unique reactor which are fitted with the photochemical
reactor setup. The aliquots are withdrawn each 1 h and the readings are taken
in the UV-VIS Spectrophotometry for each reactors separately. This
shows the photocatalytic degradation which causes changes in
the dye concentration. The treatment of dye can leads to
no wastage of nanoparticless during reaction, effective
photocatalytic degradation with nanoparticles.
Fig. 8(a) shows the hour wise absorbance of dye samples
using SiO2 pasted polyurethane reactor, 1 hour residence time is
allowed for getting each samples. Samples collected are instantaneously placed
in the UV-VIS Spectrophotometer for getting instantaneous absorbance values with
the form of graph. Totally 8hrs gone through to get a sets of the readings for
the SiO2 pasted polyurethane reactor. The maximum degradation
obtained after completion of 8 hrs.
The method followed in the above procedure is repeated for
the SiO2-TiO2 nanoparticle and UV-VIS reading is
repeated for each hour to analyse the degradation value and shown in the Fig.
8(b). Totally 8 hrs gone through to get a sets of the readings for the SiO2
– TiO2 pasted polyurethane reactor. The maximum
degradation obtained after completion of the 8 hrs, this degradation value is
high when compared to SiO2 catalyst.
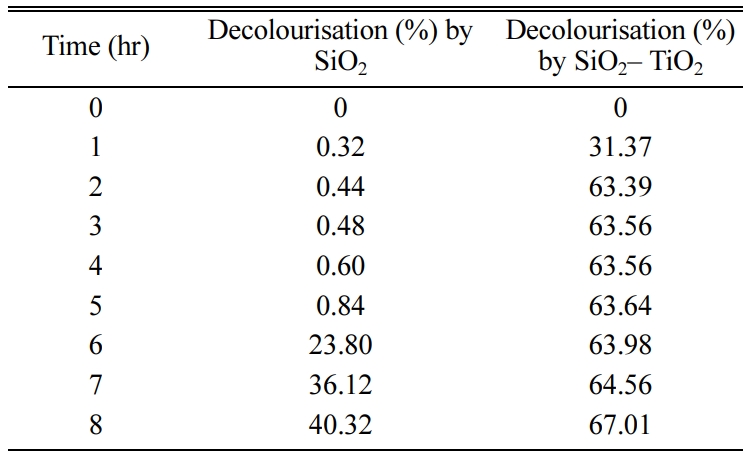
Comparing the SiO2 and SiO2-TiO2
nanoparticles the photodegradation of methylene blue is given in the
Table 2. From the above value it is infer that, SiO2 and SiO2-TiO2
have degradation value of 40.32% and 67.01% respectively.
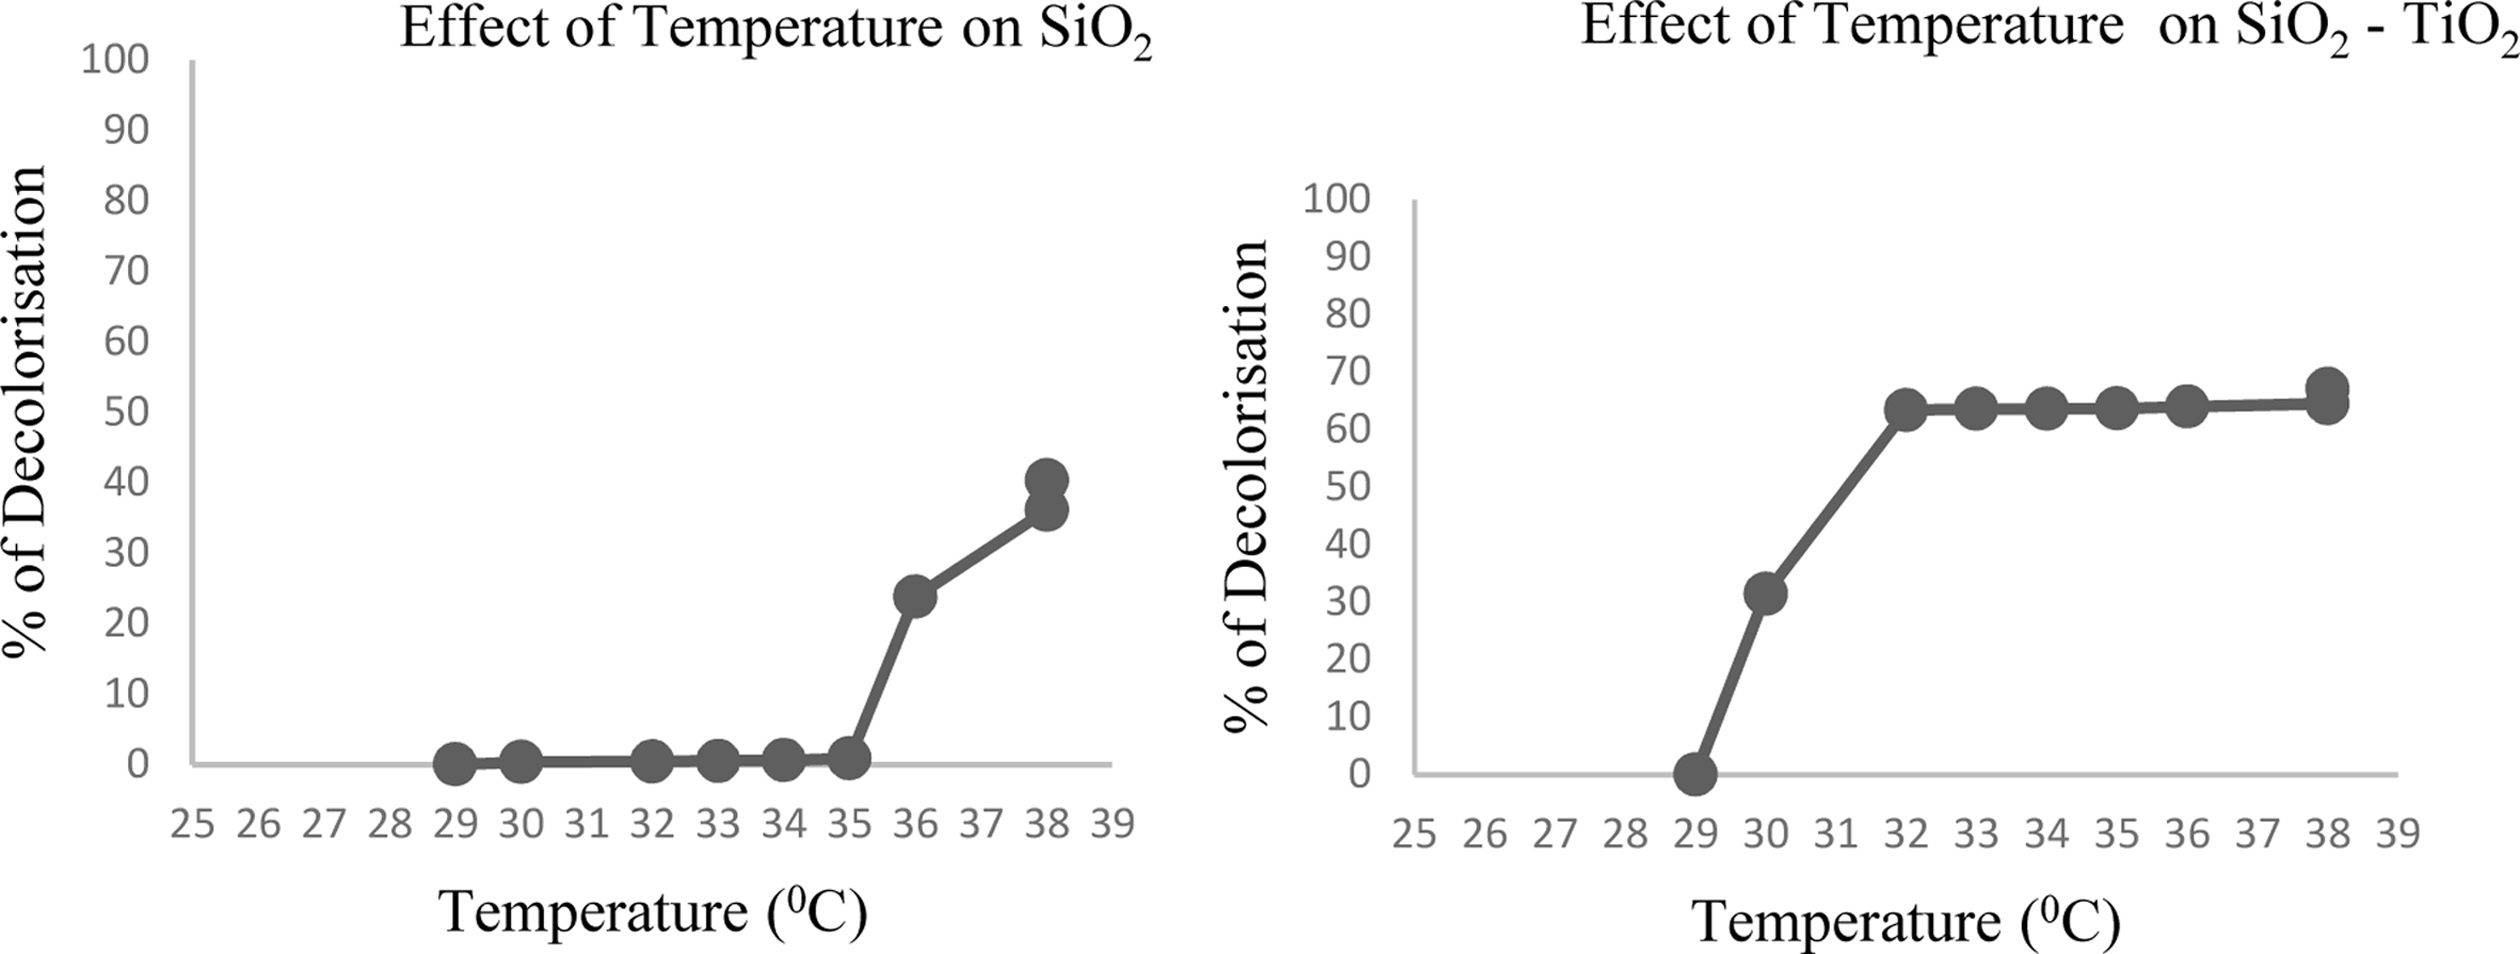
Effect of temperature
Temperature plays most significant role in the degradation
process. So the percentage of decolourisation was
investigated for every 1 oC rise in temperature and the
investigated report is shown in Fig. 9. Decolourization efficiency
of MB was high for at 38 oC@ SiO2, 32 oC@
SiO2-TiO2. So decolourisation efficiency of
SiO2-TiO2 was high at low temperature when compared to
SiO2 alone.
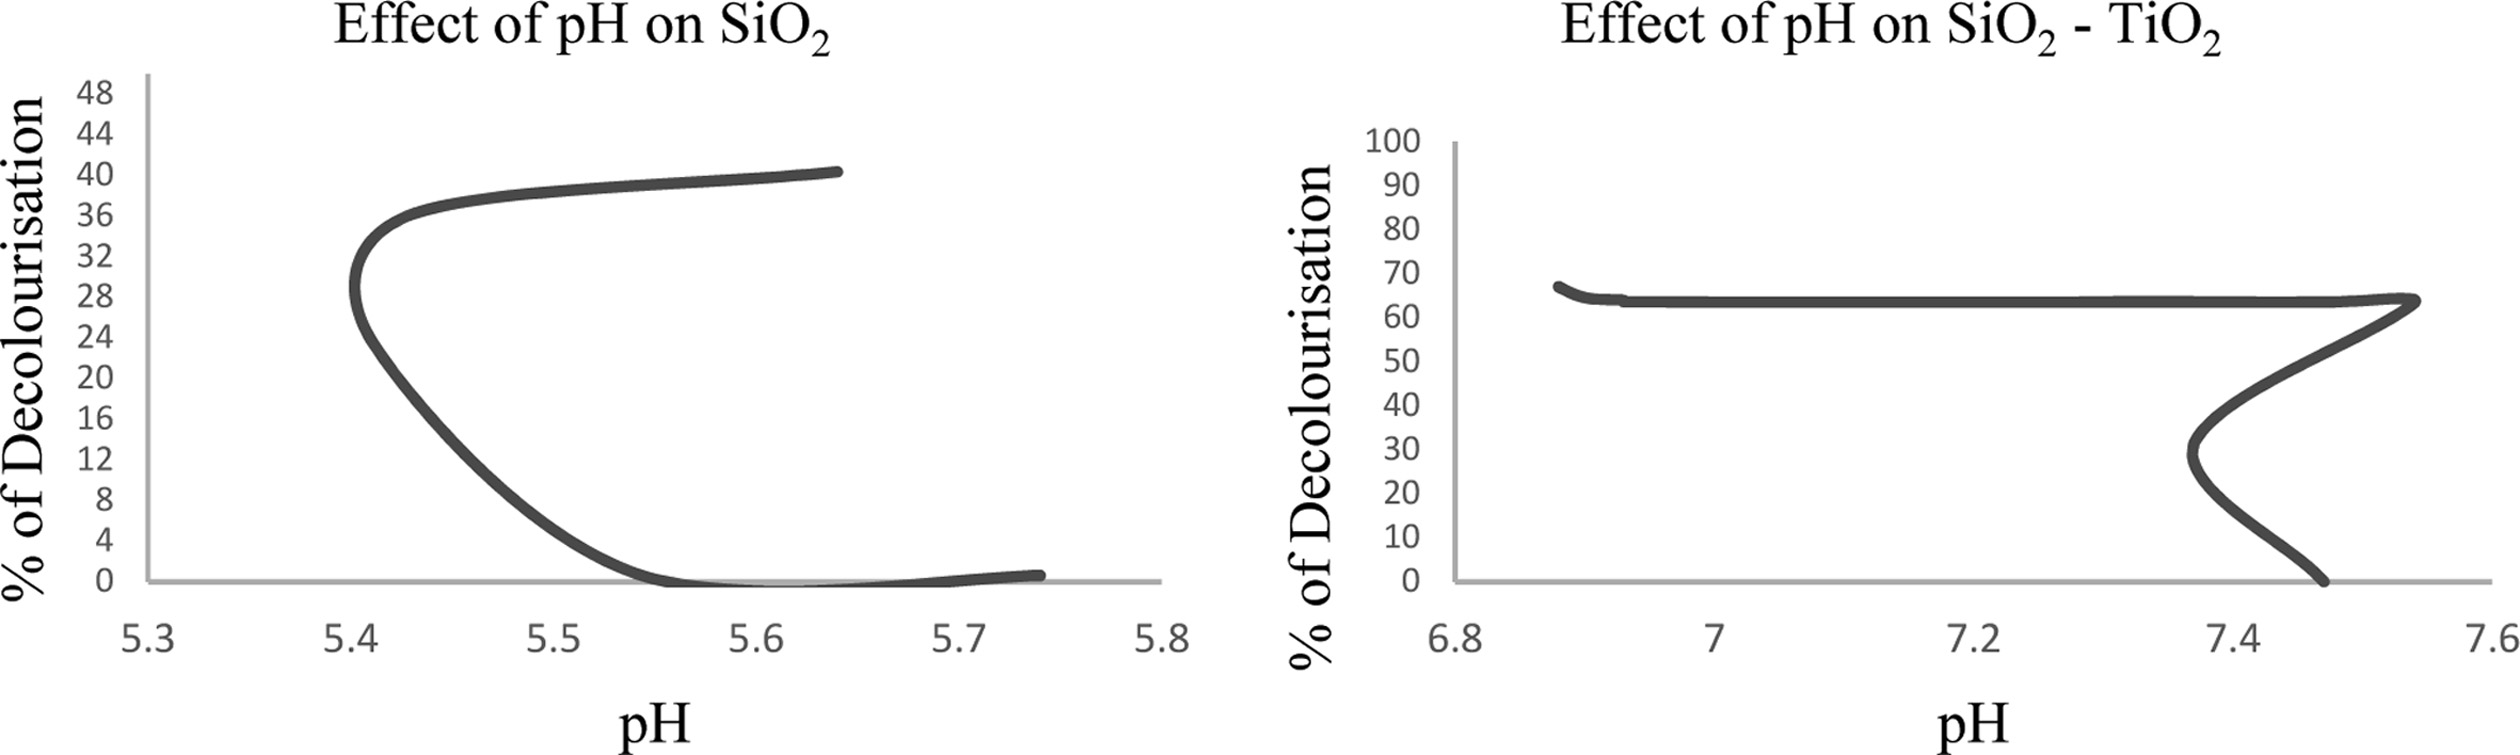
Effect of pH
The effect of pH on percentage decolourisation of MB was
conducted with different values of pH. From the Fig. 10
it is known that the percentage decolourization efficiency
of methylene blue for SiO2 and SiO2-TiO2
nanoparticles was evaluated, decolourization of MB is high at pH 5.42 and 6.88
respectively.
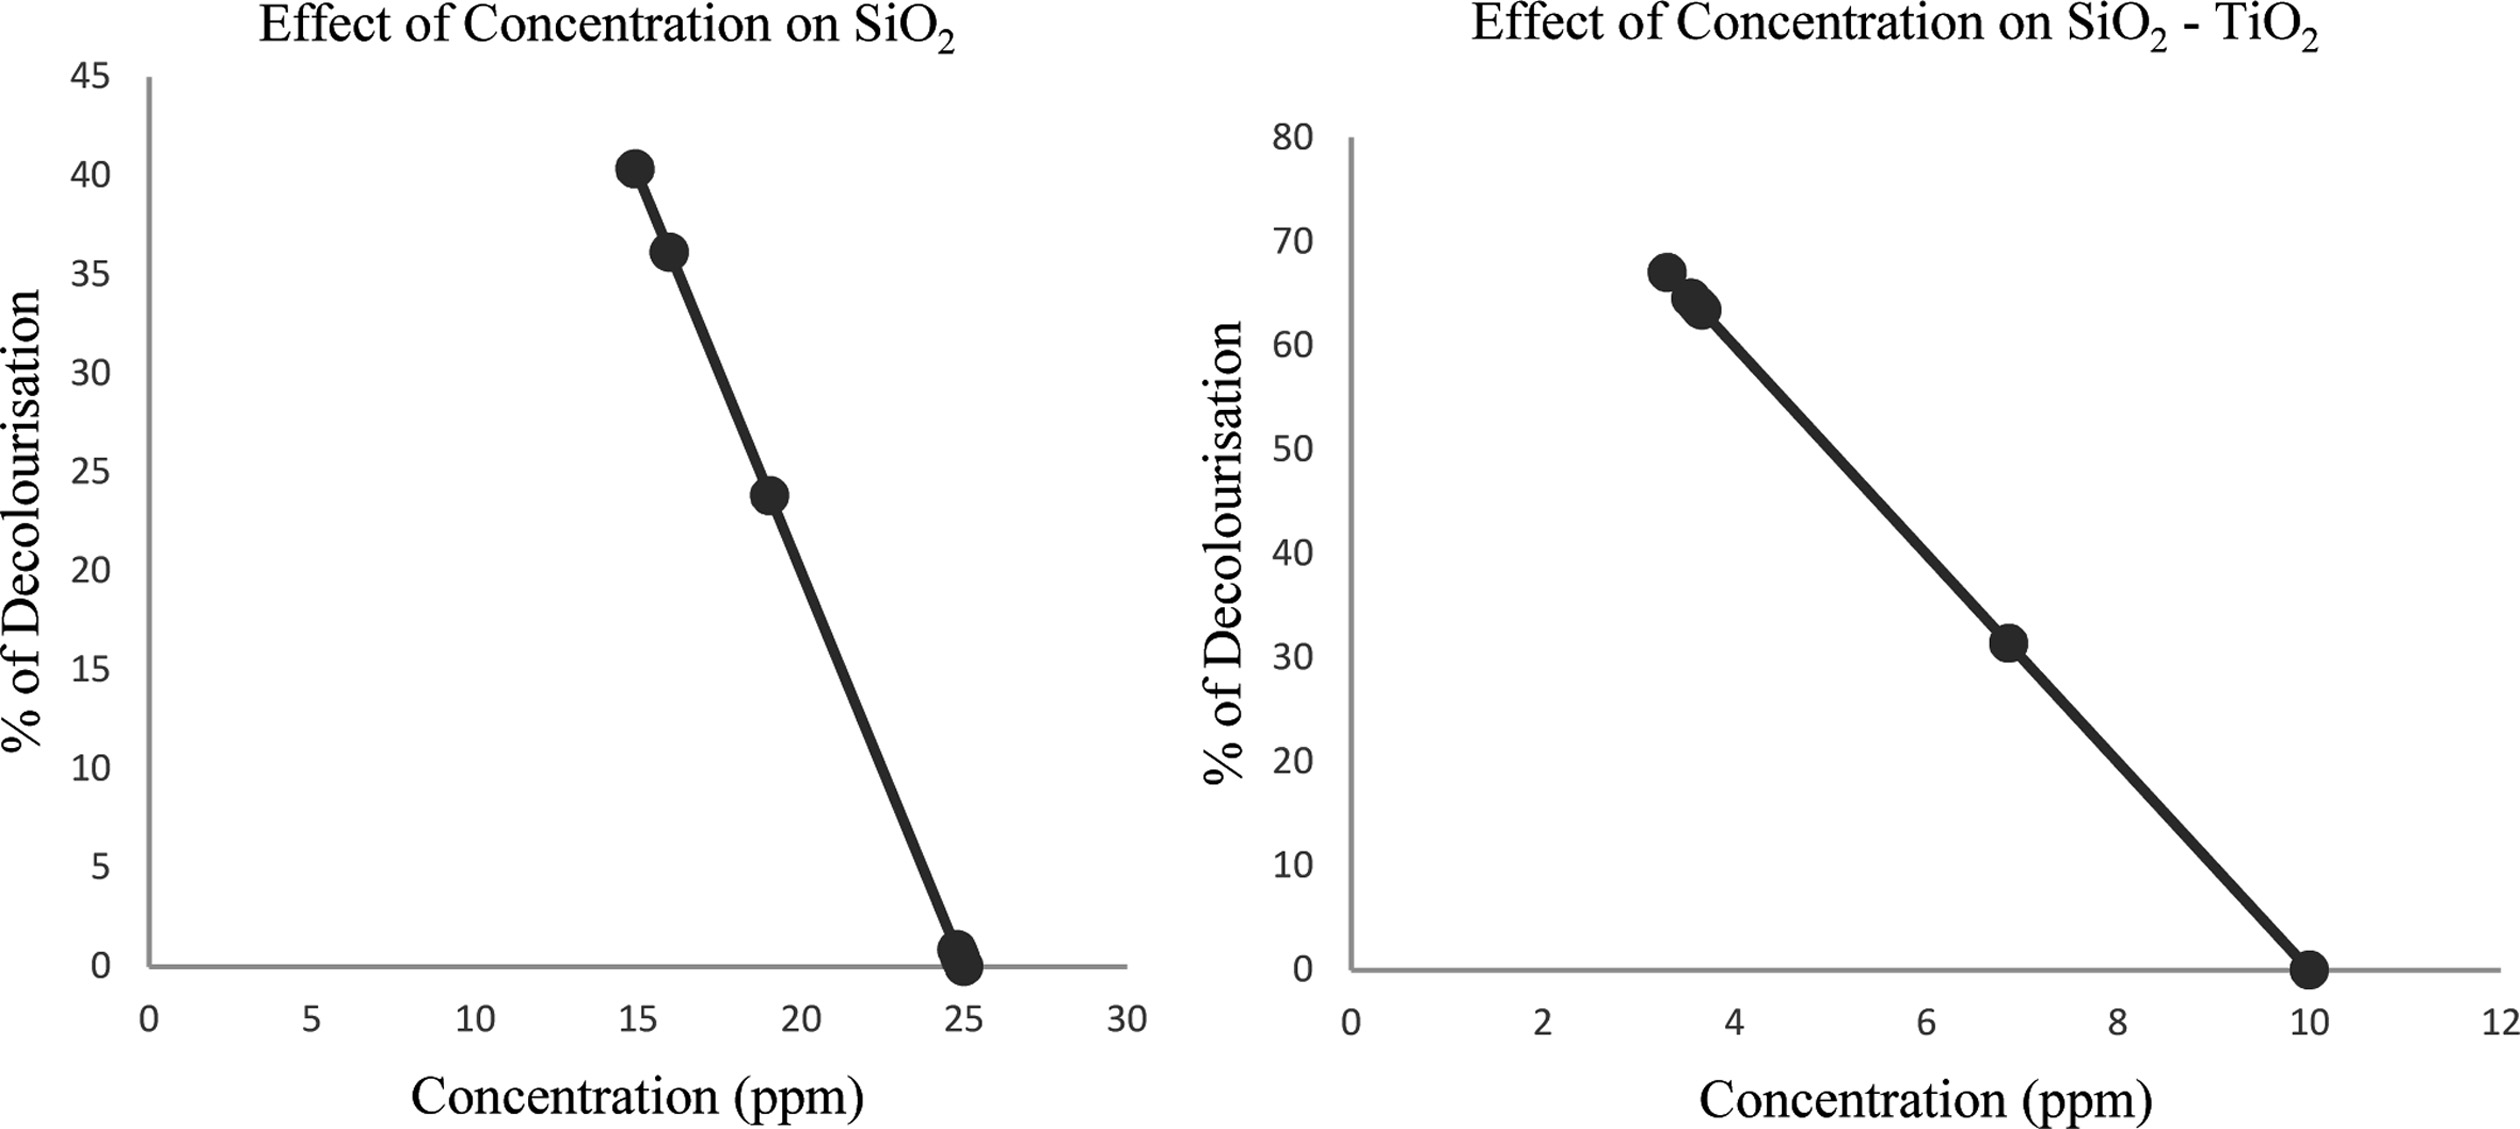
Effect of concentration
Aiming to estimate the percentage of decolourisation
versus concentrations strength of synthesized materials, experiments were
performed with catalytic material having different quantity shown in Fig. 11.
When compare between undoped and doped SiO2, the doped catalytic
materials proved more effective photocatalytic activity using irradiation of UV
light. This is due to the reducing bandgap of titania, less particle size and
vast surface area, this resulting to absorb more quantity of
dye compounds. Therefore, from the prepared photocatalyst
doped SiO2-TiO2 has shown 67.01% of degradation in 10 ppm
(Fig. 11). The variations in the concentration value not only facilitate to
access the decolourisation value, but also helps to determine the degradation
of the dye. So the percentage of decolourisation was investigated for each
concentration value with the help of Beer – Lamberts law and the investigated
report is shown in figures.
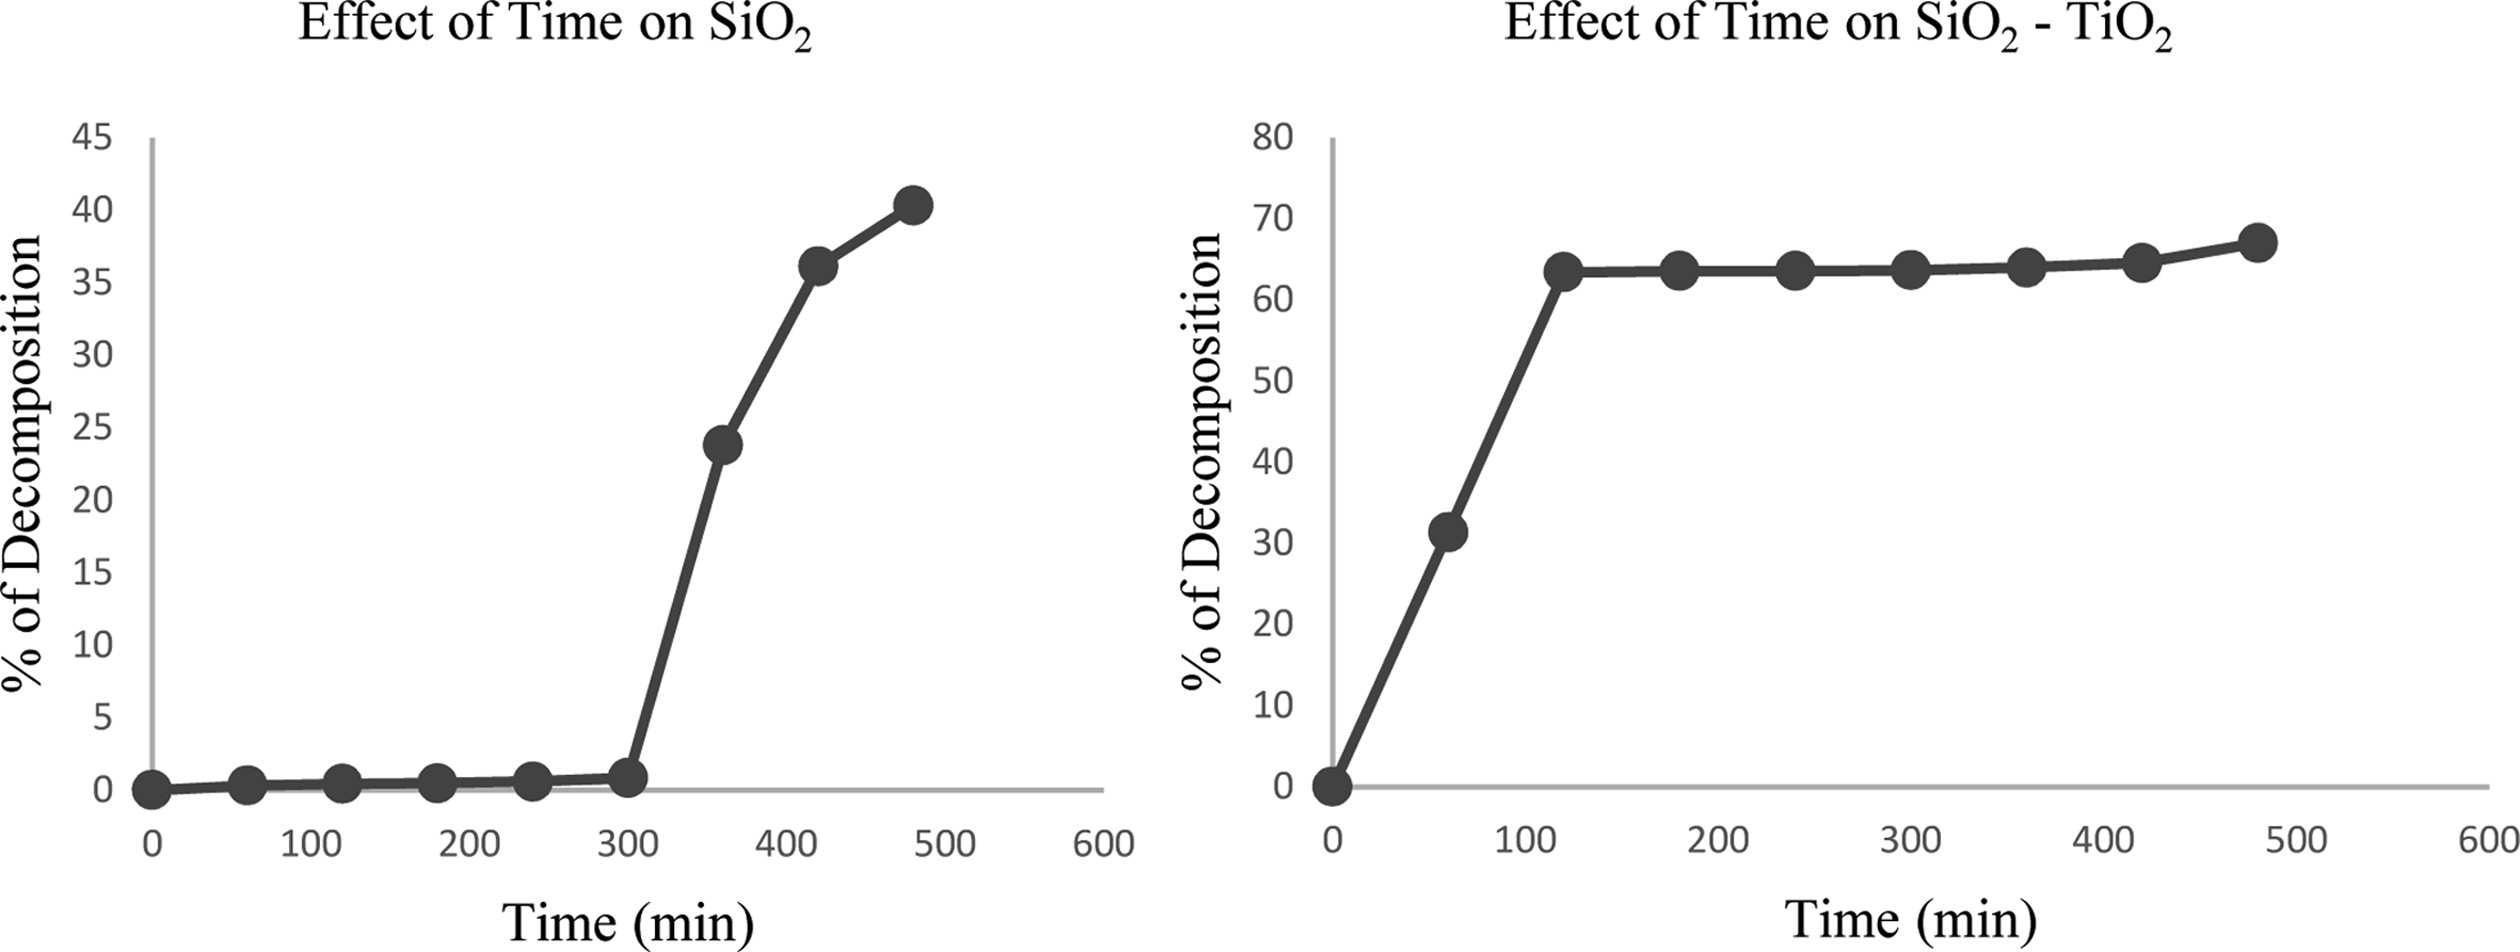
Effect of time
Time
also plays a most significant role in the degradation
process. So the percentage of decolourisation was investigated for every 1 h and the investigated report is shown in
the Fig. 12. From the grapes, it was observed that the percentage of
decolourization efficiency of methylene blue for SiO2 and SiO2-TiO2
nanoparticles was evaluated, decolourization of MB was high at time 480 mins
for both.
|
Fig. 4 (a) XRD patterns for SiO2 nanoparticles and (b) XRD
patterns of SiO2 – TiO2 nanoparticles. |
|
Fig. 5 (a) FESEM images and sizing of Pure SiO2 and (b) FESEM images and sizing of SiO2–TiO2. |
|
Fig. 6 (a) EDAX composition result of SiO2 and (b) EDAX composition result of SiO2-TiO2. |
|
Fig. 7 UV-VIS spectra synthesized nanoparticles. |

|
Fig. 8 (a) Hour wise Photo catalytic activity of SiO2 pasted
Polyurethane Foams in the reactor Placed in Photochemical
Reactor for 8 hrs. (b) Hour wise Photo catalytic activity of SiO2 –
TiO2 pasted Polyurethane Foams in the reactor Placed in
Photochemical Reactor for 8 hrs. |
|
Fig. 9 Effect of temperature on decolourisation for SiO2 nanoparticle and SiO2-TiO2 nanoparticles. |
|
Fig. 10 Effect of pH on decolourisation for SiO2 nanoparticle and SiO2-TiO2 nanoparticles. |
|
Fig. 11 Effect of concentration on decolourisation for SiO2 and SiO2-TiO2 nanoparticles. |
|
Fig. 12 Effect of time on decolourisation for SiO2 nanoparticles and SiO2-TiO2 nanoparticles. |

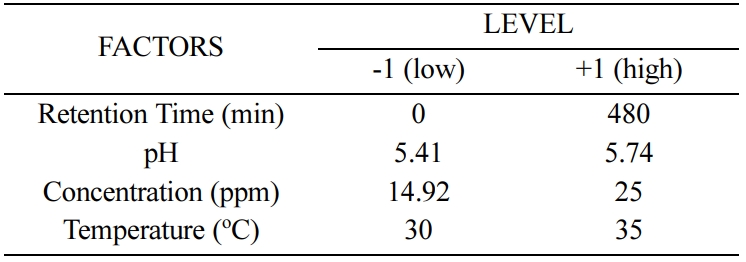
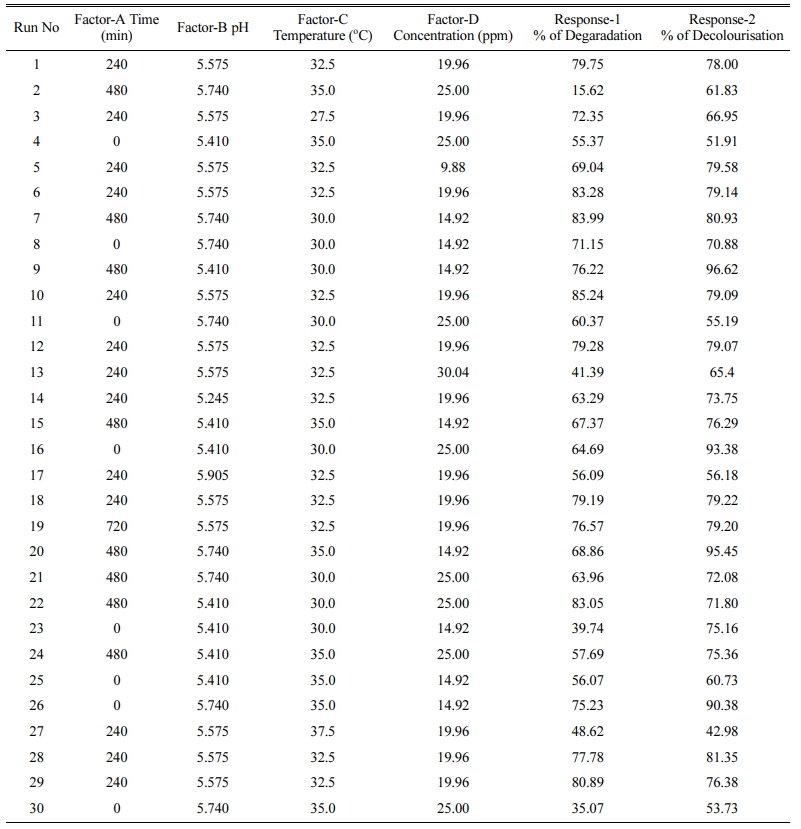
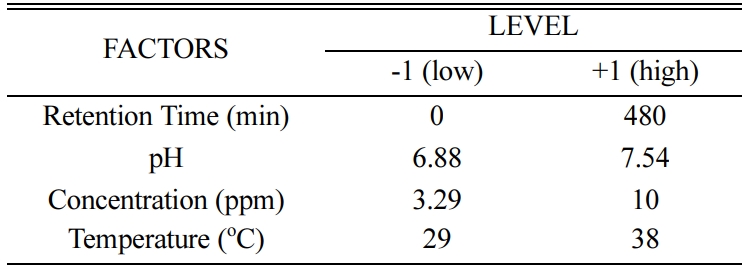
RSM using CCD is worked in statistical design of the
experiments, data analysis, clarifies to achieve the best parameters of
independent factors, estimation of correlation between 4 important independent
factors, these are concentration of the MB dye, pH, temperature and reaction
time. All independent factors are diverse over two levels based on face
centered CCD as -1 and +1, correspondingly at the defined ranges found on set
of preface experiments. Number of test experiments carried out for 4 factors are
calculated according to equation given below.
No. of Experiments = 2k +2k + 6
Where, k is factors number.
In this study, number of test experiments carried out for
4 parameters is thirty with sixteen factorial points, eight axial points, six
repetitions to evaluate the error and achieve a excellent value. The
degradation and decolourisation are dependent factors (responses) under this
practice. Efficiency is estimated by testing the percentage of degradation and
decolourisation.
The conduct of the scheme is clarified through an
empirical 2nd order polynomial model, as showed in below Equation
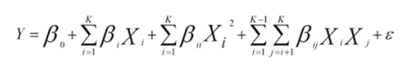
Y is response.
Xi, Xj are variables.
b is regression coefficient.
k is number of factors studied and optimize in the
experiment.
e is random error.
Analysis of variance (ANOVA) for photocatalytic
reaction by immobilized SiO2 nanoparticles
A total of thirty runs are executed by the CCD relations
among the 4 independent factors are believed in every run
to examine the strength of photodegradation of MB dye
using immobilized nano doped polyurethane foam
reactor. The results are summarized in below Tables 3-6. The analysis of
variance is utilized for graphical analysis of data to attain the relations
among the process conditions and responses. To fit polynomial model is shown by
coefficient of determination (R2). Model conditions are evaluated
using P-value by 95% of confidence level.
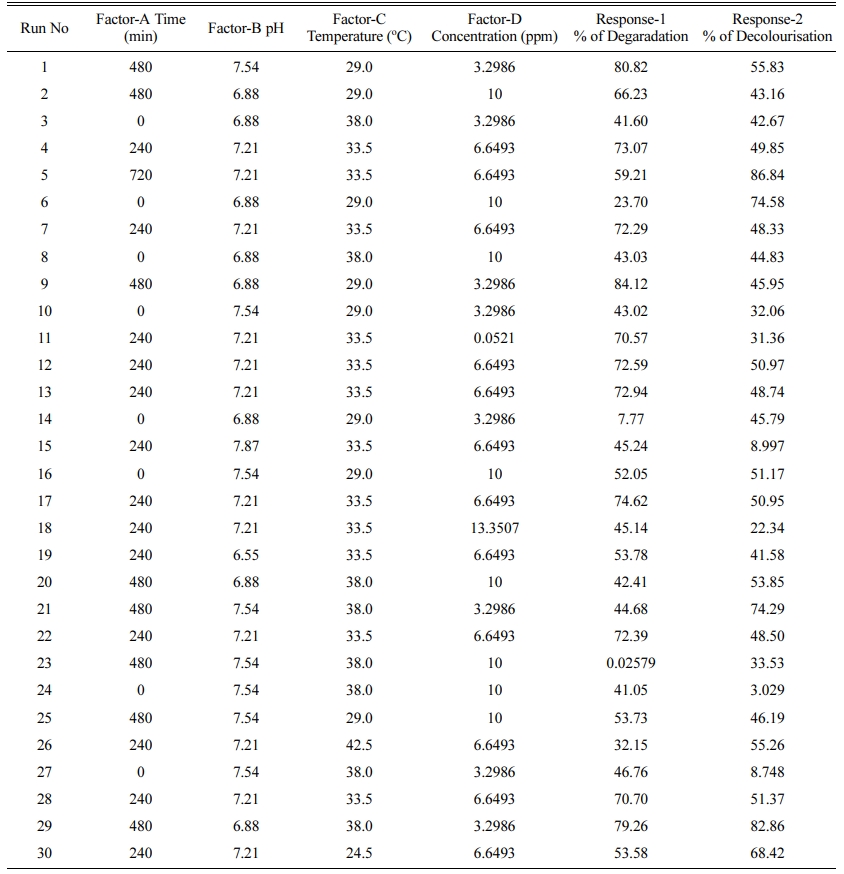
Analysis
of variance (ANOVA) for photocatalytic reaction by immobilized SiO2 -TiO2
nanoparticles
Effects
and optimum values of parameters
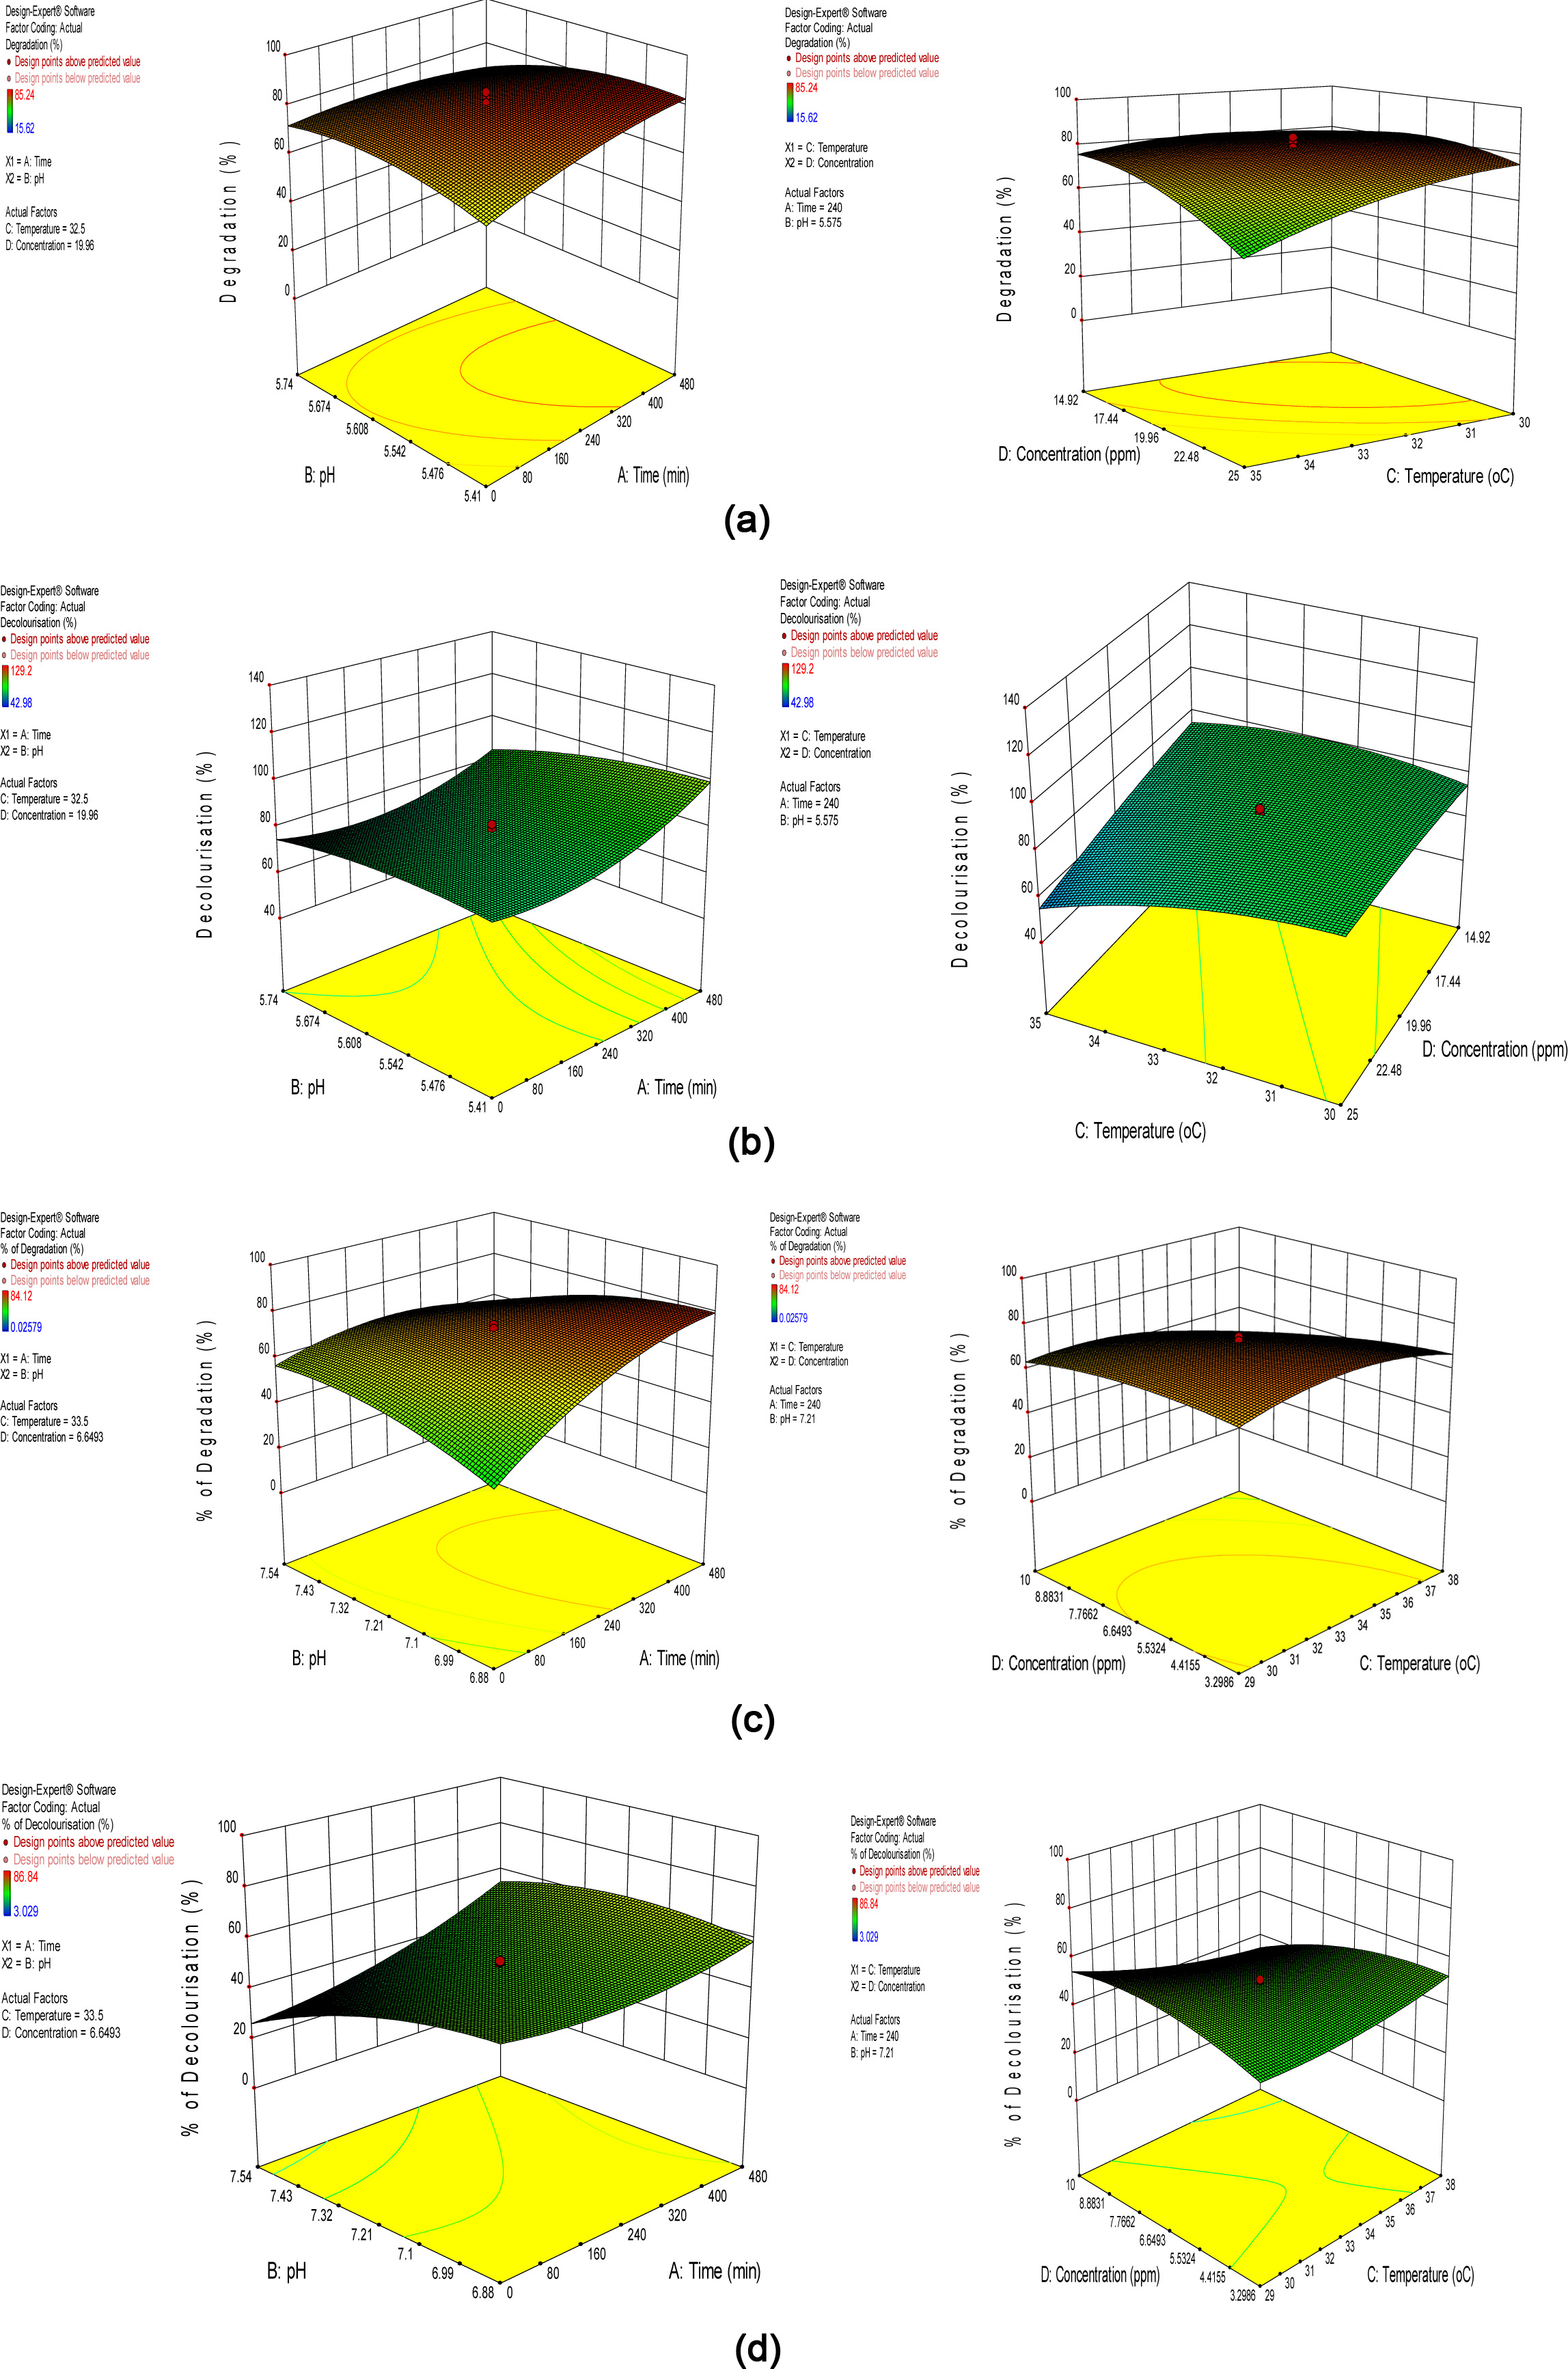
Response surface and counter plots are used to prove the
impact of parameters on photocatalytic degradation and decolourisation
efficiency for SiO2 and SiO2-TiO2 Fig.
13(a-d). The percentage photodegradation of MB as function of the time & pH
and temperature & concentration. It shows that percentage of degradation
increases when the reaction temperature rises and time increases.
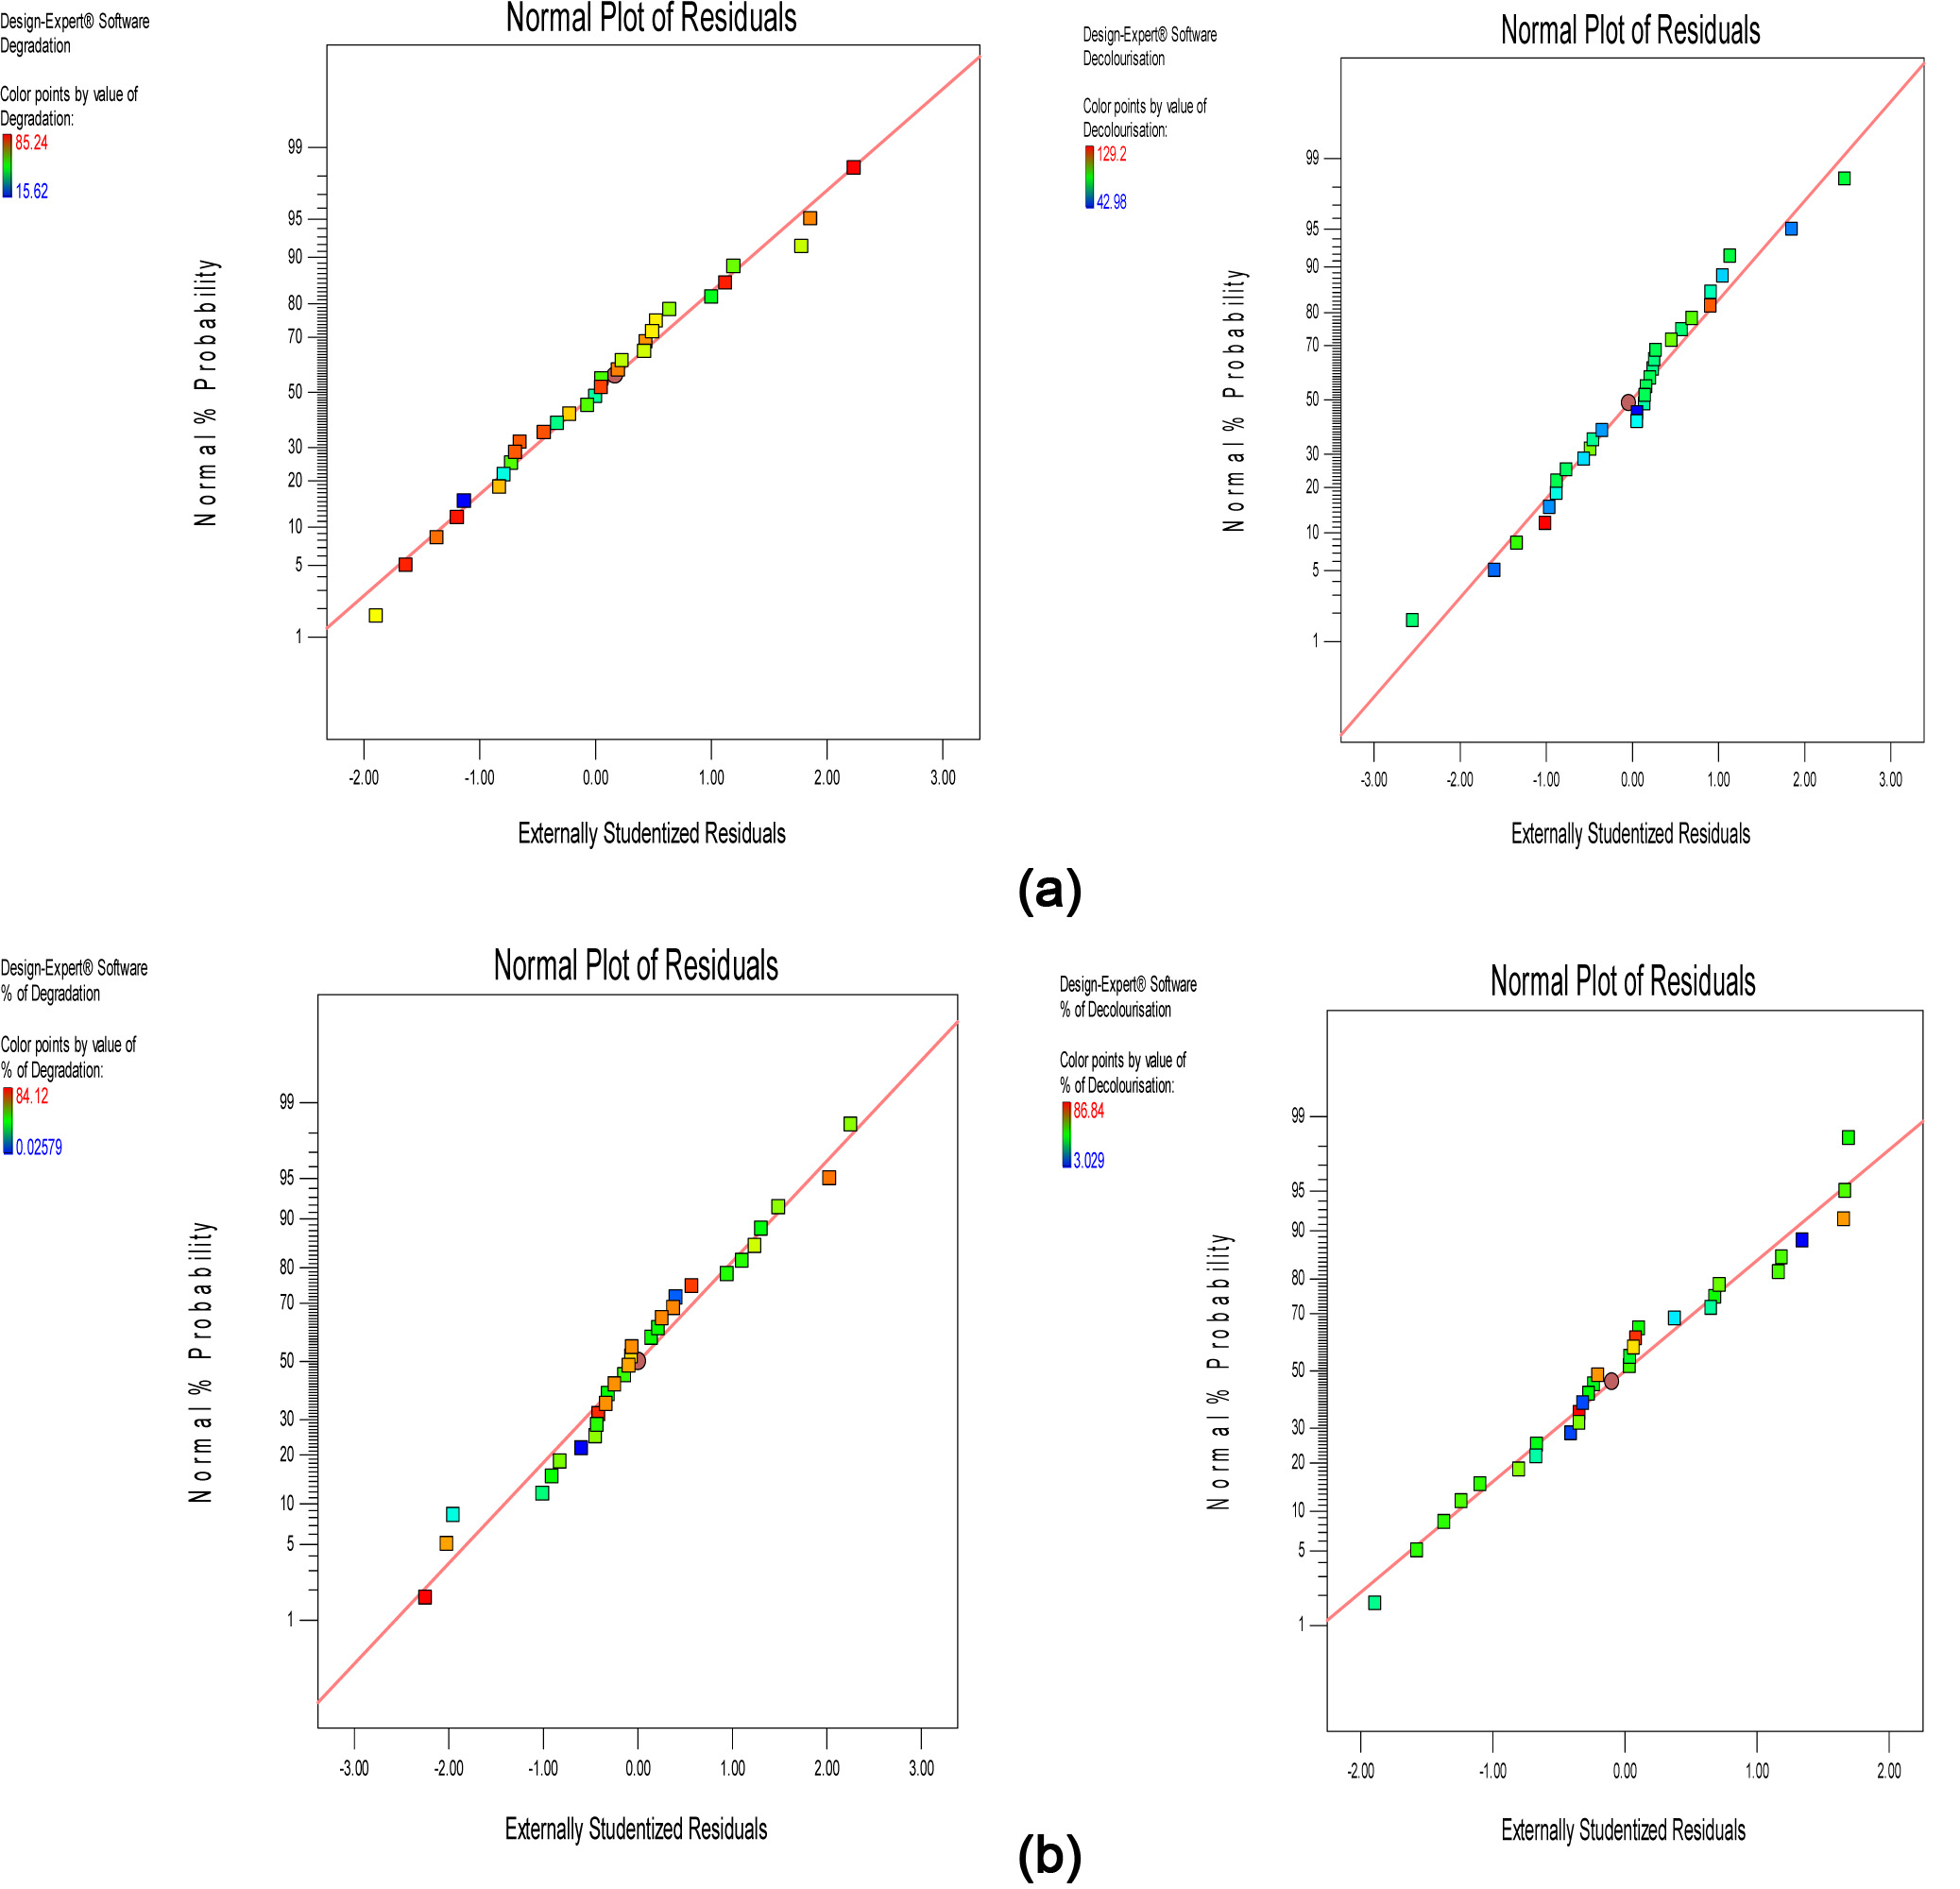
The
above Fig. 14(a&b) shows the experimental and predictive values for
methylene blue degradation and
decolourisation. It shows that the high relationship between
experimental values and predicted data (R2 = 0.9984) proved
the data fit with the model in the range calculated. At the same time, residual
analysis was conducted in order to prove the capability of model. Table 3 Table 4 Table 5 Table 6
|
Fig. 13 (a) Response graph for the percentage of degradation of SiO2 nanoparticles for the factor time and pH and temperature &
concentration. (b) Response graph for the % of decolourisation of SiO2 nanoparticles for the factor time & pH and temperature &
concentration. (c) Response graph for the percentage of degradation of SiO2 - TiO2 nanoparticles for the factor time & pH and temperature
& concentration. (d) Response graph for the percentage of decolourisation of SiO2 - TiO2 nanoparticles for the factor time & pH and
temperature & concentration. |
|
Fig. 14 (a) Normal plot of residuals for degradation of SiO2 nanoparticles and decolourisation of SiO2 nanoparticles. (b) Plot of residuals for
degradation of SiO2 - TiO2 nanoparticles and decolourisation of SiO2 - TiO2 nanoparticles. |
|
Table 4 Response value for the
different experimental conditions of SiO2 nanoparticle. |
|
Table 6 Response value for the different experimental conditions
of SiO2–TiO2 nanoparticles |
From the experimental studies the photocatalytic
degradation of aqueous methylene blue solution as a model pollutant from
textile dyeing industries, was analyzed using SiO2 and SiO2-TiO2
nanoparticles immobilised on polyurethane foam reactor. The value of decolourisation
efficiency was calculated for SiO2 and SiO2-TiO2 nanoparticles
as 40.32% and 67.01% respectively. Effect of operational factors on the
photocatalytic degradation efficiency of methylene blue for SiO2 and
SiO2-TiO2 nanoparticles was analyzed by the contour plots
and response surface methodology. The SiO2 and SiO2-TiO2
optimum values of reaction time, pH, temperature and initial dye concentration
were, 480 mins, 5.42, 38 oC, 14.42 ppm and 480 mins,
6.88, 320C, 10 ppm respectively. Regression analysis R2
value of 0.9984 showed a good agreement between experimental results and
predicted values.
- 1. M.N. Chong, B. Jin, C.W.K. Chow, and C. Saint, Water Res. 44[10] (2010) 2997-3027.
-

- 2. M.A. Behnajady, N.Modirshahla, and R.Hamzavi, J. Hazard. Mater. 133[1-3] (2006) 226-232.
-
- 3. R.A. Elsalamony, J. Mater. Sci. 4[2] (2016) 2347-2278.
- 4. S. Chakrabarti and B.K. Dutta, J. Hazard. Mater. 112[3] (2004) 269-278.
-
- 5. M. Vaez, A.Z. Moghaddam, N.M. Mahmoodi, and S. Alijani, Saf. Environ. 90[1] (2012) 56-64.
-
- 6. R.M. Abhang, D. Kumar, and S.V. Taralkar, Int. J. Che. Eng. Appl. 2[5] (2011) 337-41.
-
- 7. B. Neppolian, H.C. Choi, S. Sakthivel, B. Arabindoo, and V. Murugesan. J. Hazard. Mater. 89[2-3] (2002) 303-1747.
-
- 8. Rauf and S. Ashouraf, Chem. Eng. J. 15 (2009) 10-19.
- 9. U.G. Akpan and B.H. Hameed, J. Hazard. Mater. 170[2-3] (2009) 520-9.
-
- 10. A.Y. Shan, T.I.M. Ghazi, and S.A. Rashid, Appl. Catal. A 389[1-2] (2010) 1-8.
-
- 11. R.J. Tayade, H.C. Bajaj, and R.V. Jasra, Desalination 275[1-3] (2011) 160-165.
-
- 12. Y. Lei, G. Zhao, Y. Zhang, M. Liu, L. Liu, B. Lv, and J. Gao, Environ. Sci. Technol. 44[20] (2010)7921-7927.
-
- 13. T. Zhang, W. Li, and J.P. Croué, Environ. Sci. Technol. 45[21] (2011) 9339-9346.
-
- 14. T.S. Natarajan, M. Thomas, K. Natarajan, H.C. Bajaj, and R.J. Tayade, Chem. Eng. J. 169[1-3] (2011)126-134.
-
- 15. K. Natarajan, T.S. Natarajan, H.C. Bajaj, and R.J. Tayade, Chem. Eng. J. 178 (2011) 40-49.
-
- 16. I. Pallecchi, G. Grassano, D. Marré, L. Pellegrino, M. Putti, and A.S. Siri, Appl. Phys. Lett. 78 (2001) 2244-2246
-
- 17. A.R. Khataee, M. Fathinia, S. Aber, and M. Zarei, J. Hazard. Mater. 181[1-3] (2010) 886-897.
-
- 18. H. Han and R. Bai, Ind. Eng. Chem. Res. 50[21] (2011) 11922-11929.
-
- 19. A. Kar, Y.R. Smith, and V. Subramanian, Environ. Sci. Technol. 43[ 9] (2009) 3260-3265.
-
- 20. M.N. Chong, B. Jin, C.W.K. Chow, and C.P. Saint, Chem. Eng. J. 152[1] (2009) 158-166.
-
- 21. A.P. Toor, A. Verma, C.K. Jotshi, and P.K. Bajpai, Dyes Pigm. 68[1] (2006) 53-60.
-
- 22. I.J. Ochuma, R.P. Fishwick, J. Wood, and J.M. Winterbottom, Appl. Catal. B 73[3-4] (2007) 259-268.
-
- 23. V.A. Sakkas, M.A. Islam, C. Stalikas, and T.A. Albanis, J. Hazard. Mater. 175[1-3] (2010) 33-44.
-
- 24. J. Herney-Ramirez, M. Lampinen, M.A. Vicente, C.A. Costa, and L.M. Madeira, Ind. Eng. Chem. Res. 47[2] (2007) 284-294.
-
- 25. A.A. Babaei, A.R. Mesdaghiniai, N.J. Haghighi, R. Nabizadeh, and A.H. Mahvi, J. Hazard. Mater. 185[2-3] (2011) 1273-1279.
-
- 26. I.H. Cho and K.D. Zoh, Dyes Pigm. 75[3] (2007) 533-543.
-
- 27. L.C. Chen and C.M. Huang, Ind. Eng. Chem. Res. 43[20] (2004) 6446-6452.
-
- 28. R. Nadarajan, W.A.W. Bakar, R. Ali, and R. Ismail, Arab. J. Chem. 11[1] (2018) 34-47.
-
- 29. K.M. Lee and S.B.A. Hamid, Materials 8 (2015) 339-354.
-
- 30. M. Vaez, A. Zarringhalam Moghaddam, and S. Alijani, Ind. Eng. Chem. Res. 51 (2012) 4199-4207.
-
- 31. V.R. Nair and V.S. Kodialbail, Environ. Sci. Pollut. Res. 27 (2020) 14441-14453.
-
- 32. J. Dostanic, D. Loncarevic, L. Rozic, S. Petrovic, D. Mijin, and D.M. Jovanovic, Desalin. Water Treat. 51 (2013) 2802-2812
-
- 33. S. Mortazavian, A. Saber, and D.E. James, Catalysts 9[4] (2019) 360.
-
 This Article
-
2020; 21(5): 552-564
Published on Oct 31, 2020
- 10.36410/jcpr.2020.21.5.552
- Received on Apr 21, 2020
- Revised on Jul 15, 2020
- Accepted on Aug 14, 2020
Services
- Abstract
introduction
materials and synthetic procedures
results and discussion
experimental design and optimization by rsm
conclusion
- References
- Full Text PDF
Shared
Correspondence to
- T. Usharani
-
aDepartment of Chemical Engineering, Erode Sengunthar Engineering College, Perundurai 638 057, India
bDepartment of Food Technology, Kongu Engineering College, Perundurai 638 052, India
Tel : +91 8883208346
Fax: +91 9942148895 - E-mail: chemusharani@gmail.com
Clean-Energy Research Institute(CRI), Hanyang University, 222, Wangsimni-ro, Seongdong-gu, Seoul, 04763, Korea
E-mail: jcpr@hanyang.ac.kr