


- Wear behavior of irregular shape Ti6Al4V powder reinforced with carbon nanotubes
Muhammet Ceylana,* and İsmail Topcub
aDepartment of Mechatronics Engineering, Istanbul Commerce University, Istanbul, Turkey
bDepartment of Metallurgy and Materials Engineering, Alanya Alaaddin Keykubat University, Antalya, Turkey
The purpose of this study was
to investigate the sintering behavior, microstructural evolution, and the
effect on wear resistance of carbon nanotubes (CNT) with the addition of a
mechanical alloy (Ti6Al4V) and sintered irregular Ti64 powder. The mechanical
alloy powders utilized in this study were produced through the process of CIP
(Cold Isostatic Press) in order to produce samples by compress on under various
pressures within a 300 MPa floating molded press. The samples were
sintered at a high vacuum (10-5 mbar) for 60 minutes at a temperature of
1275 oC. After sintering, the materials were characterized
using an optic microscope (OM), scanning electron microscopy (SEM) and EDX
(Energy-dispersive X-ray spectroscopy) to determine whether the materials had
wear resistance, density measurement, etc. The Carbon Nanotube wear and
friction behavior were investigated under various conditions using a pin wear
tester on a disc followed by a scanning electron microscopy (SEM) analysis. The
objective of this study was to evaluate the density, metallographic properties
and hardness of Ti64 samples supplemented with different CNT ratios as a
function of sintering temperature. Theoretical density and micro-hardness of
mechanical alloyed and sintered irregular Ti64 powders changed with the
additions to CNT under increased sintering temperatures.
Keywords: Sintering, Ti6Al4V, Carbon Nanotubes, Wear, Ti6Al4V Powder
Titanium alloys can be used in a wide variety of
applications. A few examples include the biomedical, automotive and aerospace
industries. Ti6Al4V alloy with 4% vanadium and 6% aluminum
weight is preferred for use in surgical implants, turbines and
airplanes because of its sufficient mechanical strength, heat
treatment ability, good corrosion resistance, and biocompatibility.
It is a powder metallurgy (PM) technique used in the production of titanium
alloys and their composites [1-4]. As a result of the possibility of
reinforcement in metal matrix composites, the properties of the com- posites can be changed and thus their
applications can be extended. The in situ formation technique
for changing the properties of composites provides the advantage of
greater size and reinforcement control [5, 6].
Since the invention of the aircraft, the need of high
strength and lightweight materials has been recognized and increased. When the
hardness and strength of a material increases, the dimensions and therefore the
mass of the material must also be reduced for a given load bearing application.
This allows many advantages in automobiles and aircraft, such as increased load
and improved fuel efficiency. The increase in fuel efficiency
of engines has become an important issue due to the steady decline in global
oil resources. The reason for the development of metal matrix composites (MMCs)
is the inability of metals and alloys to provide a structure with both strength
and hardness. The strength and ductility in the material are then provided by
the metal matrix produced [7-9]. Titanium carbide (TiC) is used
because of its compatibility and properties favorable in
strengthening titanium alloy matrices [10]. Materials designed
for particulate doped titanium matrix composites, bearings,
abrasion resistant gears, erosion resistant pipes, shafts and
friction resistant motors [11]. Component selection plays a significant role
when it comes to the application of materials exhibiting the properties and
characteristics needed for the production of titanium alloys and composites
[12]. Titanium alloys are well known for their poor tribological properties
[13-18]. In addition, titanium deforms very poorly on the opposite surface and
easily transfers the material in the non-lubricated tribosystems. Furthermore,
due to the great affinity of titanium to oxygen, it is easily transferred to
both metallic and non-metallic surfaces that remain as polymers. This results
in an oxide surface layer which in turn leads to severe adhesive wear. Under
extreme fatigue terms at environmental temperature, force decrease
factors between 2.6 and 3.6 were observed in titanium alloys as a result of the
loss of the respective material [14]. Lastly, titanium alloys have weak wear
resistance; for example, Budinski [16] found that the dry sand rubber wheel for
his wear test utilizing Ti-6Al-4V alloy and pure Ti to wear 15 times higher
than D2 tool steel. This weak tribological conduct is attributed to the low
hardness and absolute values of the tensile-shear strength of titanium and
titanium alloys [17-24].
Carbon nanotubes (CNTs) were first discovered in 1991 by
S. Iijema [25]. From a science and technology perspective, carbon nanotubes
(CNTs) are on their way to becoming one of the fastest growing research areas
in many disciplines including materials and life technologies,
physics and chemistry. Unlike cast graphite and diamond,
carbon nanotubes (CNTs) have unique optical, magnetic, electrical, mechanical,
and thermal properties [26, 27]. Carbon nanotubes (CNTs) have interesting
electrochemical properties as well. In the study by
Hussain et al., it was found that the electroactivity of CNTs was
due to the presence of surface reactive groups [28].
The purpose of this research is to investigate how the
addition of 0.5% - 5% CNT has an effect on the wear properties
of Ti64 P / M alloy. Metallographic techniques
were used to characterize the CNT added as sintered samples. Each sample was
subjected to abrasion tests with a pin on the disc. It was then characterized
by, scanning electron microscopy (SEM), hardness tests, optical microscopy and
X-ray diffraction (XRD). Worn surfaces of the sintered samples were analyzed
under SEM.
Raw
materials and sintering process
In this study the Ti64 and CNT powders were purchased from
industrial suppliers to do the first experiments and tested to determine their
values. The purchase process; Ti64 and composite reinforced with
0.5% - 5% CNT 10-30 nm were used. The materials were fabricated
(Phelly Materials Company) by a PM technique. As raw materials, atomized Ti64
powders having a purity density of 4.43 g / cm3 and a
nominal size of 45-180 99 µm were used. The materials used as matrix
material were CNT and Commercially Ti64 powders. The reinforcement CNT material
utilized in this study were (Chep Tubes Company and Choggo Company China -
density 2.31 g/cm3) particles. The CNT particle has a size of
about 10-30 nm.
Production
of composites
During the production of composites, 0.5% - 5%
Volume CNT was reinforced to Ti64 by means of a tubular milling. Milling was
performed for five hours. The ball / powder weight ratio was 6:1. The grinding
speed was 400 rpm and the alumina ball diameter was 10 mm. Powder
materials were easily pressed at 300 MPa by Cold Isostatic Press (CIP) process.
The reason for its ease is because of the ceramic behavior of the CNT during
the process. The selected sintering atmos-
phere was in high vacuum (1.2 10-5 mbar). Other
sintering atmospheres may cause oxidation of TiO2
material in the working rooms, so that the sintering of the
samples was carried out at two different temperatures (1275 oC).
Characterization
SEM is one of the most versatile tools available in the
field of materials science, used to analyze the microstructural properties of
materials. SEM sends a high energy electron beam to the sample surface and
scans the surface and takes images. The powder morphology
and microstructures of the prepared sintered samples were
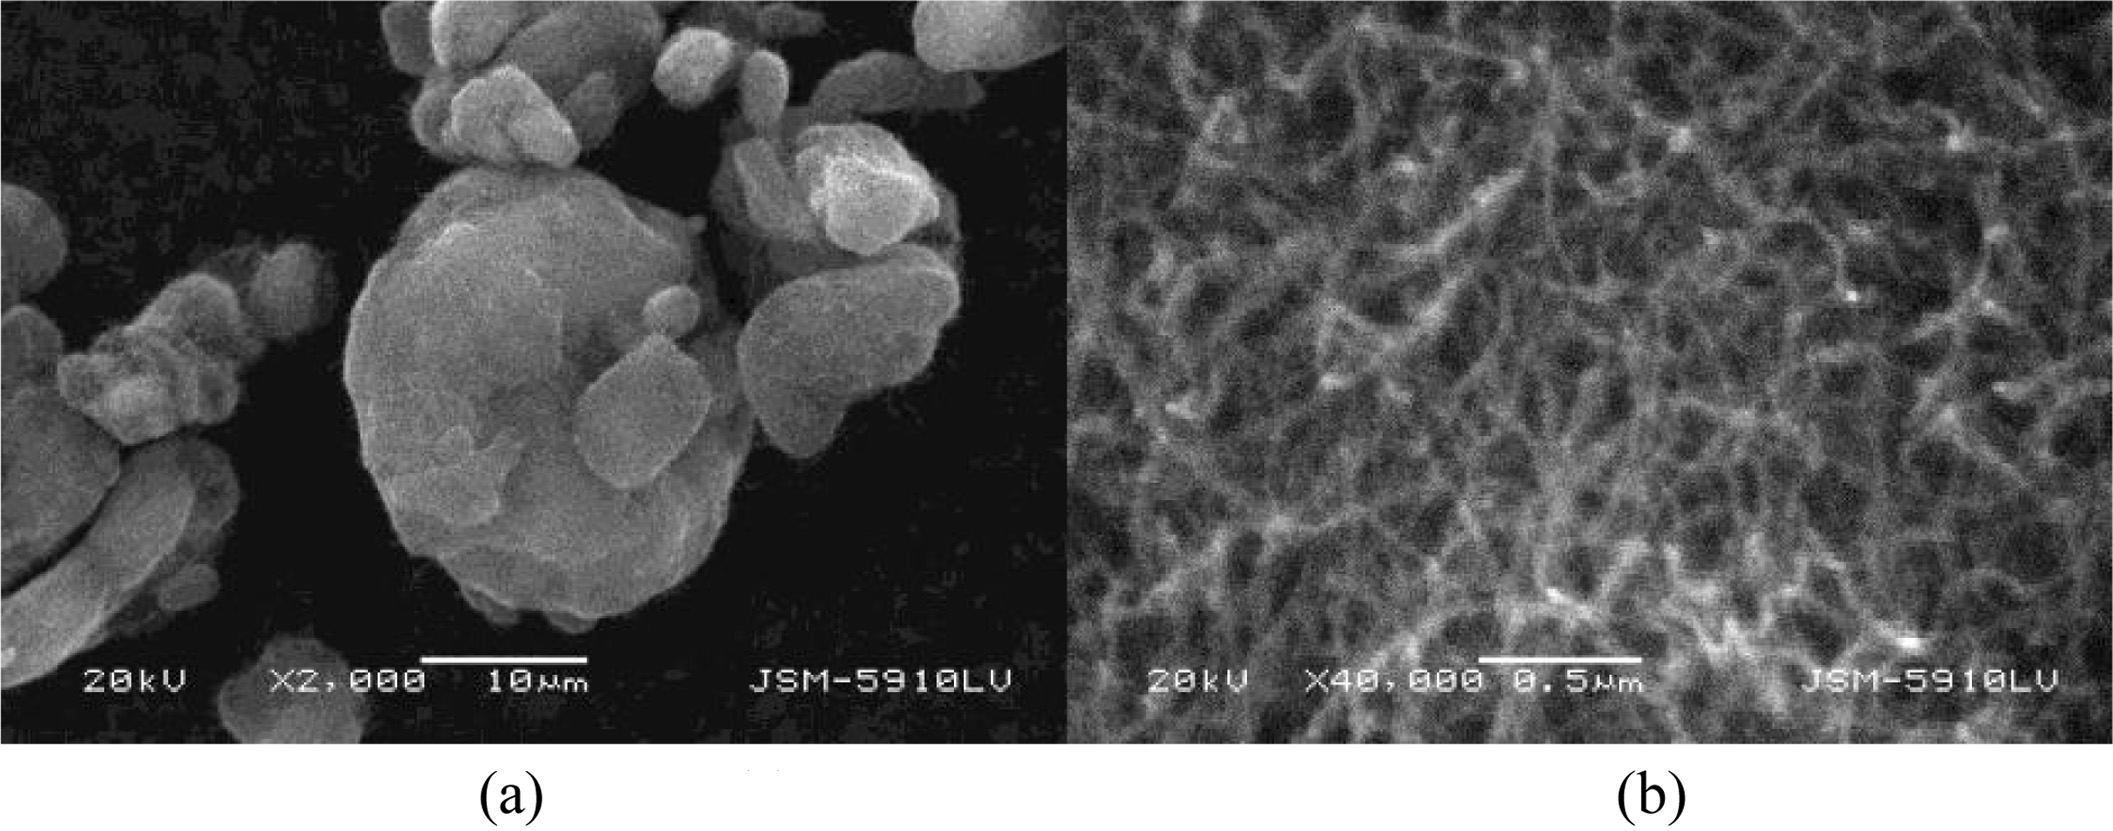
examined using a scanning electron microscope (SEM, JEOL Ltd., JSM-5910LV). Fig.
1. shows the morpholFig.ogies of the starting materials.
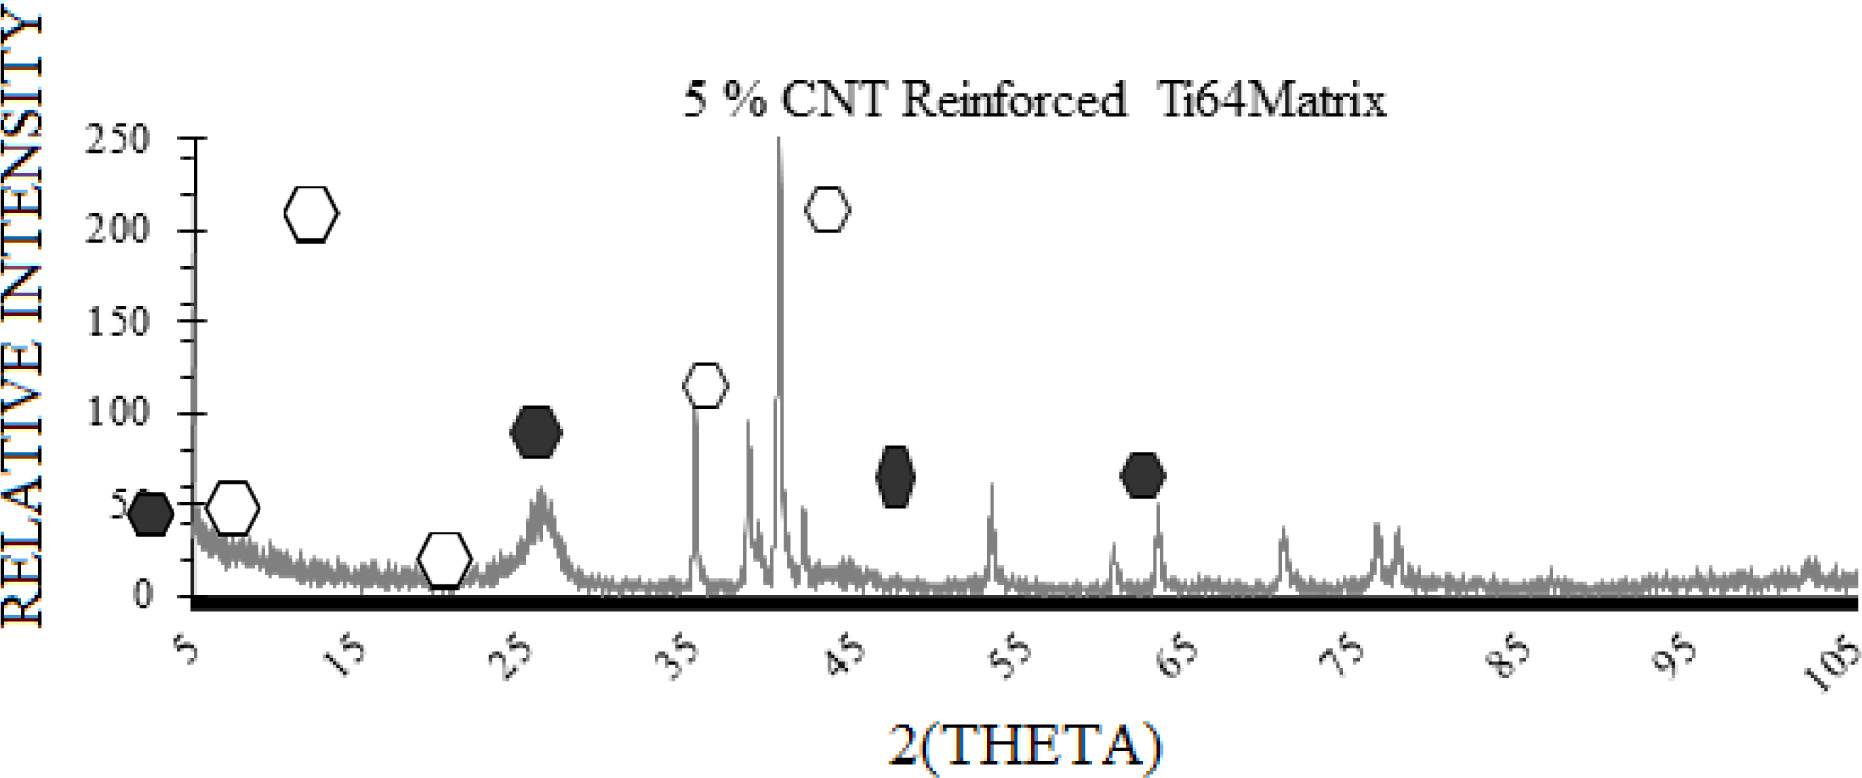
A Rigaku X Ray diffractometer was used to identify the
phases in pure Ti64 powder and CNT powder from different companies as
demonstrated in Fig. 2 with an incident angle of 2 oC / Ka
radiation. The angle of refraction was between 5-120o with a step
increase of 0.02o and a counting time of 1 s. Energy Dispersive
Spectrometer (EDS, OXFORD Industries INCAx-sight 7274, (133-eV
resolution) were used to analyze material
composition.
Hardness
and density experiments
The mechanical properties of the produced samples were
determined with the help of hardness measure-
ments. The hardness tests of the samples prepared by metallography were
performed with a Micro-Hardness Tester Machine (FM-700, Future Tech Corp. in
Japan). The Vickers 136o diamond in the metallographic
samples was used to determine the hardness of the cutting
compounds. Test load for each sample was 500 gr. Since the indentation
trace covers both the matrix and the reinforcing material, the stiffness value
shown represents the bulk stiffness of the composite. The results of these
hardness tests were evaluated by taking the average of 10 consecutive test
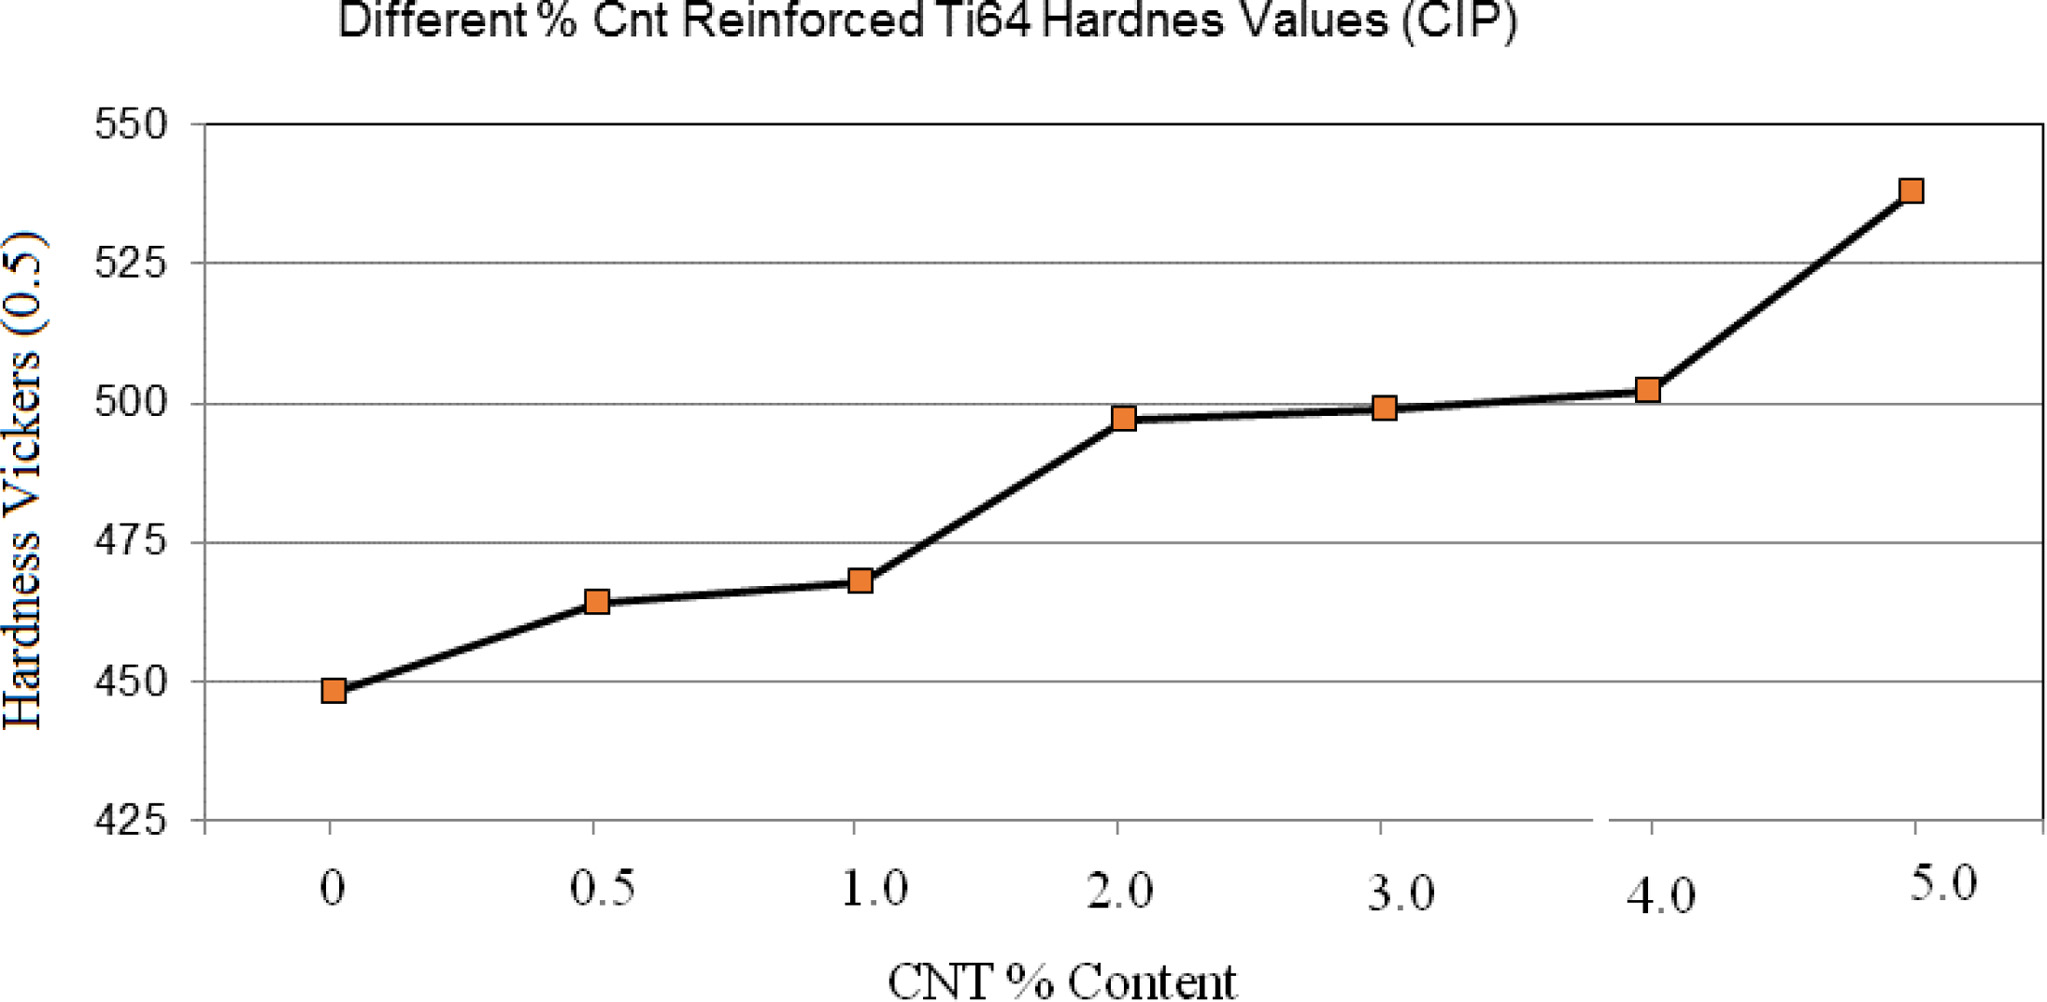
results. Hardness values with various CNT contents are demonstrated in Fig. 3.
The macro and micro-hardness measurements, which are
referred to as hardness (HRC) (Wolpert Instron Corp. USA) were compared using
the methods described within this section. There is an observed difference in
the macro and micro surface hardness measurements; this significant difference
in material phase change is thought to arise from the matrix material formed by
the CNT material.
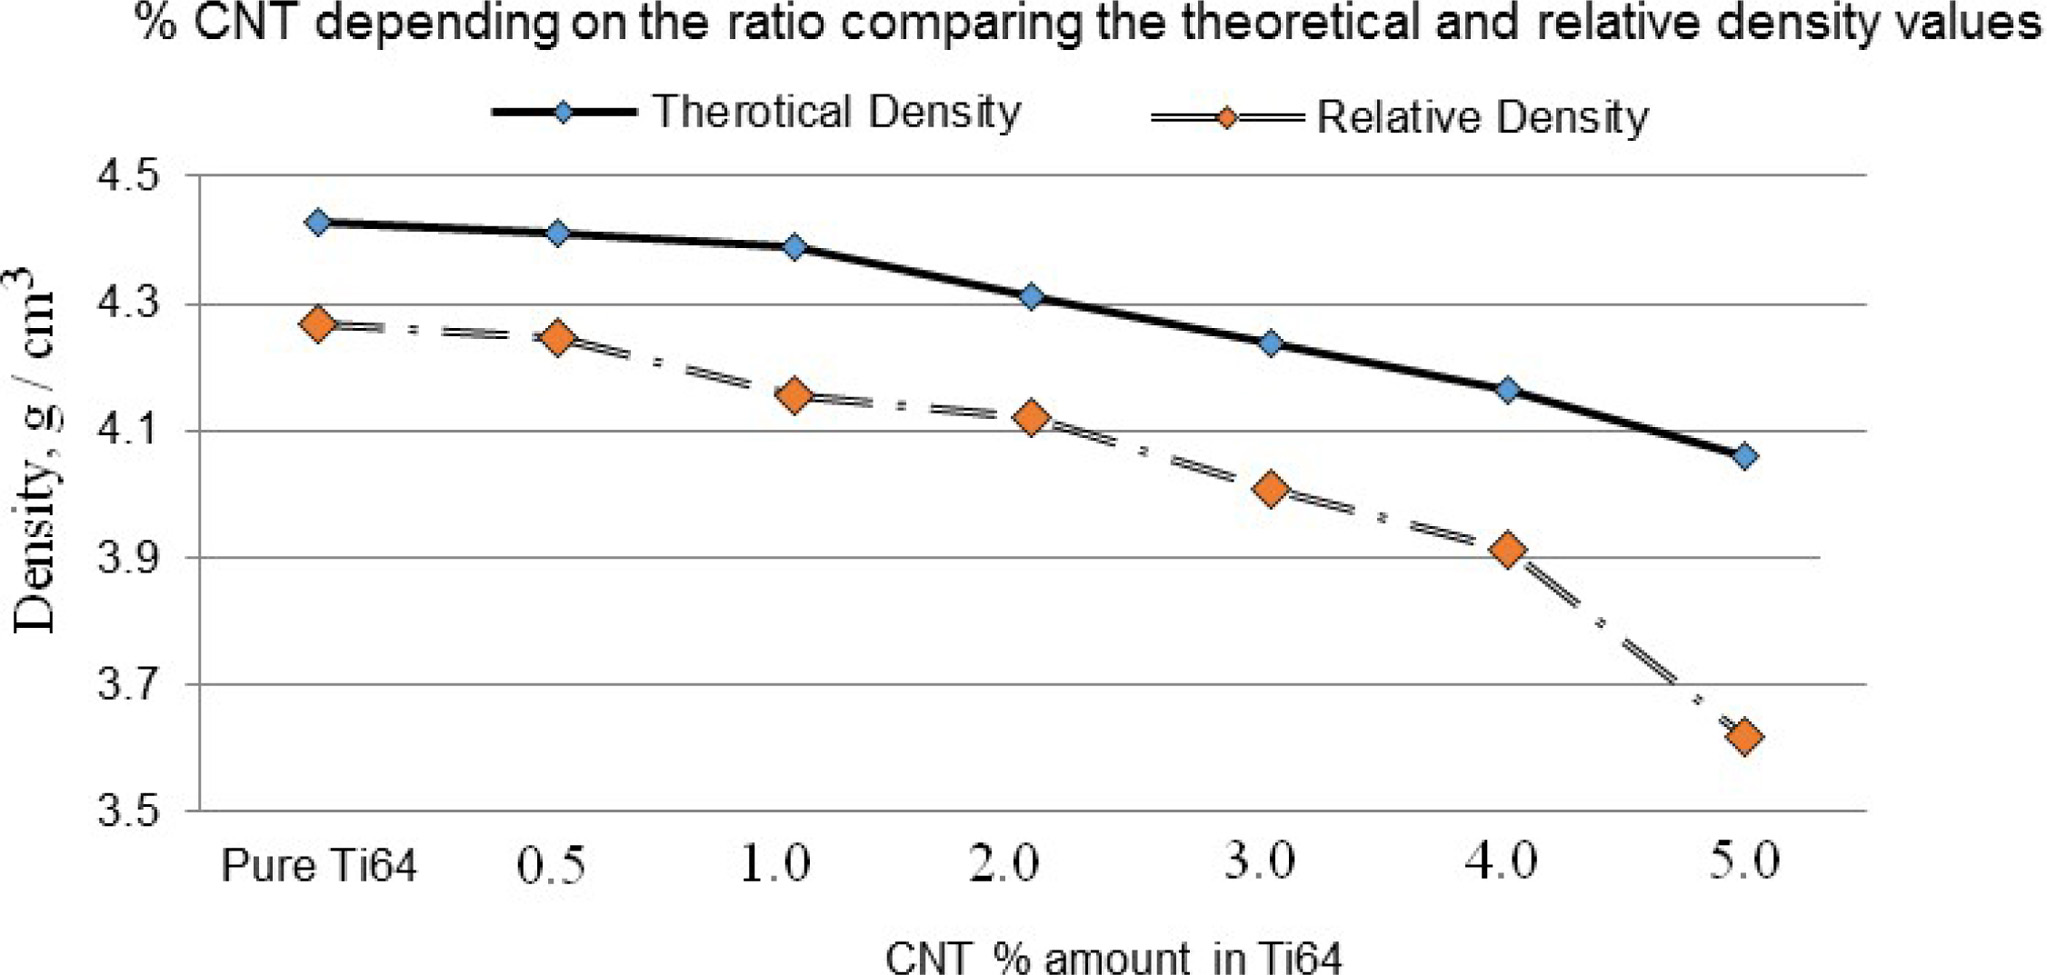
The Archimedes water immersion method was used to
determine the densities of the sintered samples (Precisa XB 320M, Switzerland).
Theoretical density measurements of the composite samples Ti64 /CNT in
different proportions according to the literature ranged from 90 to 99.5%. The
main reason for the variances of density measurements in the range from
literature of these composites is the increased ratio CNT. Density calculations
are presented in Fig. 4. The highest density of CNT, which had the lowest
percentage of low density alloys, was found to have the highest CNT %. Selected
composite samples are CNT-reinforced Ti64 powder produced by powder metallurgy.
Information on the properties of the powders is provided in the previous
section. The average density values of the composites containing different CNTs
are shown in Fig. 4. Here, the densities of the specimens approxi- mate the theoretical density with increasing
sintering temperatures for the CNT contents in all ratios.
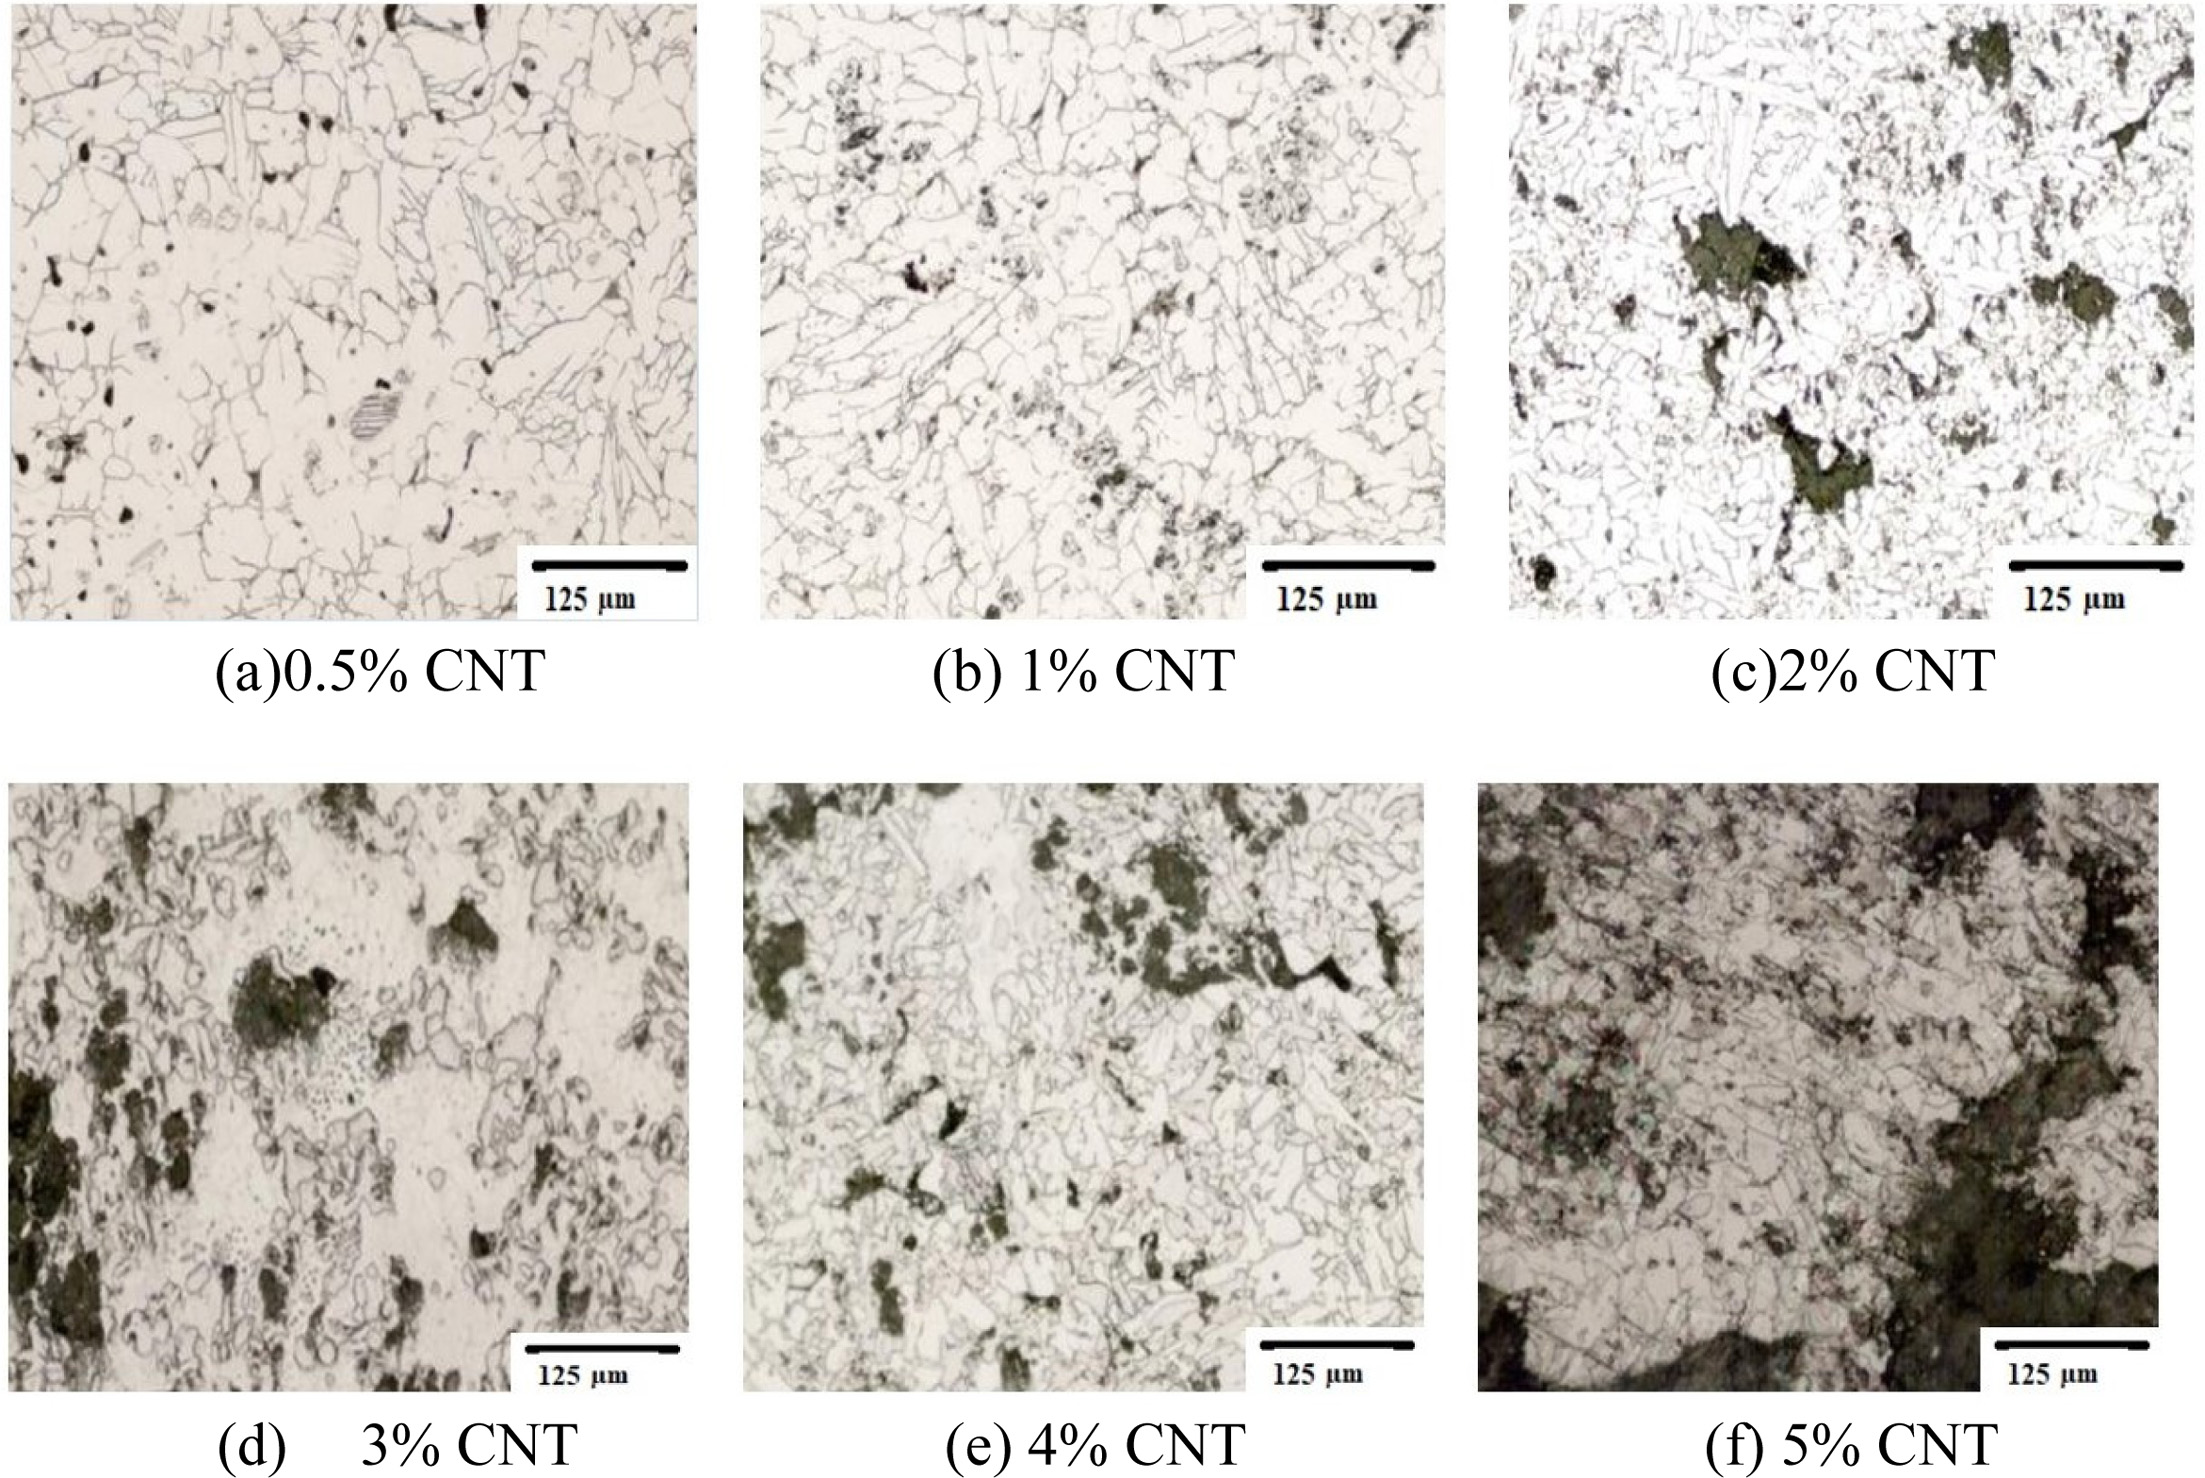
Metalographic
examination
For metallographic examination, each sintered test samples
were evaluated for each composite material. A Kroll reagent (3 mL HF,
6 mL HNO3 in 100 mL H2O) was used to etch the
samples for optical metallography. Prepared from longitudinal sections of
composites after examination of metallographic samples. All samples were slowly
ground with 240, 500, 800 and 1000 mesh SiC sand papers, respectively. In the
next step, the samples were slowly polished with Kroll solutions. The
microstructures of the composites were examined using Optimus Optic microscope.
Metallographic images at different magnifications were taken for each sample
after the sample preparation process (X50, X100 and X200), press and sections
in the direction of the image. Figs. 5 and 6 display these images. In these
studies, the alpha and beta shows the structure of Ti64 powder. As seen in the
figures, the images contain gray areas of TiC structures, the gray area
increased as the ratio of CNT % increased. Porosity can be seen in Fig. 5 and 6
on the other hand, porosity was not calculated in our study.
Wear
tests
Wear tests were performed on a standard disc on a machine
disk with a hardness of 62 HRC, with a continuously rotating D2 set of steel
plates without lubricant at room temperature. The specimen pin for the wear
test is Ø10 × 10 mm and the polished wear surface for Ra
roughness of 0.159 nm. The test was carried out with three trials in order
to ensure its repeatability for each sample. The disk surface was grounded.
Then, 0.830 µm Ra was polished to a roughness 0.830 µm Ra. sliding
speed, sliding distance and load were kept constant at 1.04 m/s,
1,000 m and 10 N respectively for all tests. All the specimens were
carefully cleaned with and dried. The specimens were cleaned with
ethanol before and after test for measuring wear loss
by a balance with an accuracy of ± 0.0001 g.
The wear rate was calculated using the following equation
where Ws is
wear rate, mm3/Nm, Dm the mass loss of test samples during
wear test of N revolutions, g, q the density of test materials, g/cm3. L is
total sliding distance, m and F the normal force on the pin, N. The total
sliding distance was monitored on an auto-recorder. The worn surfaces of all
the samples were examined using SEM.
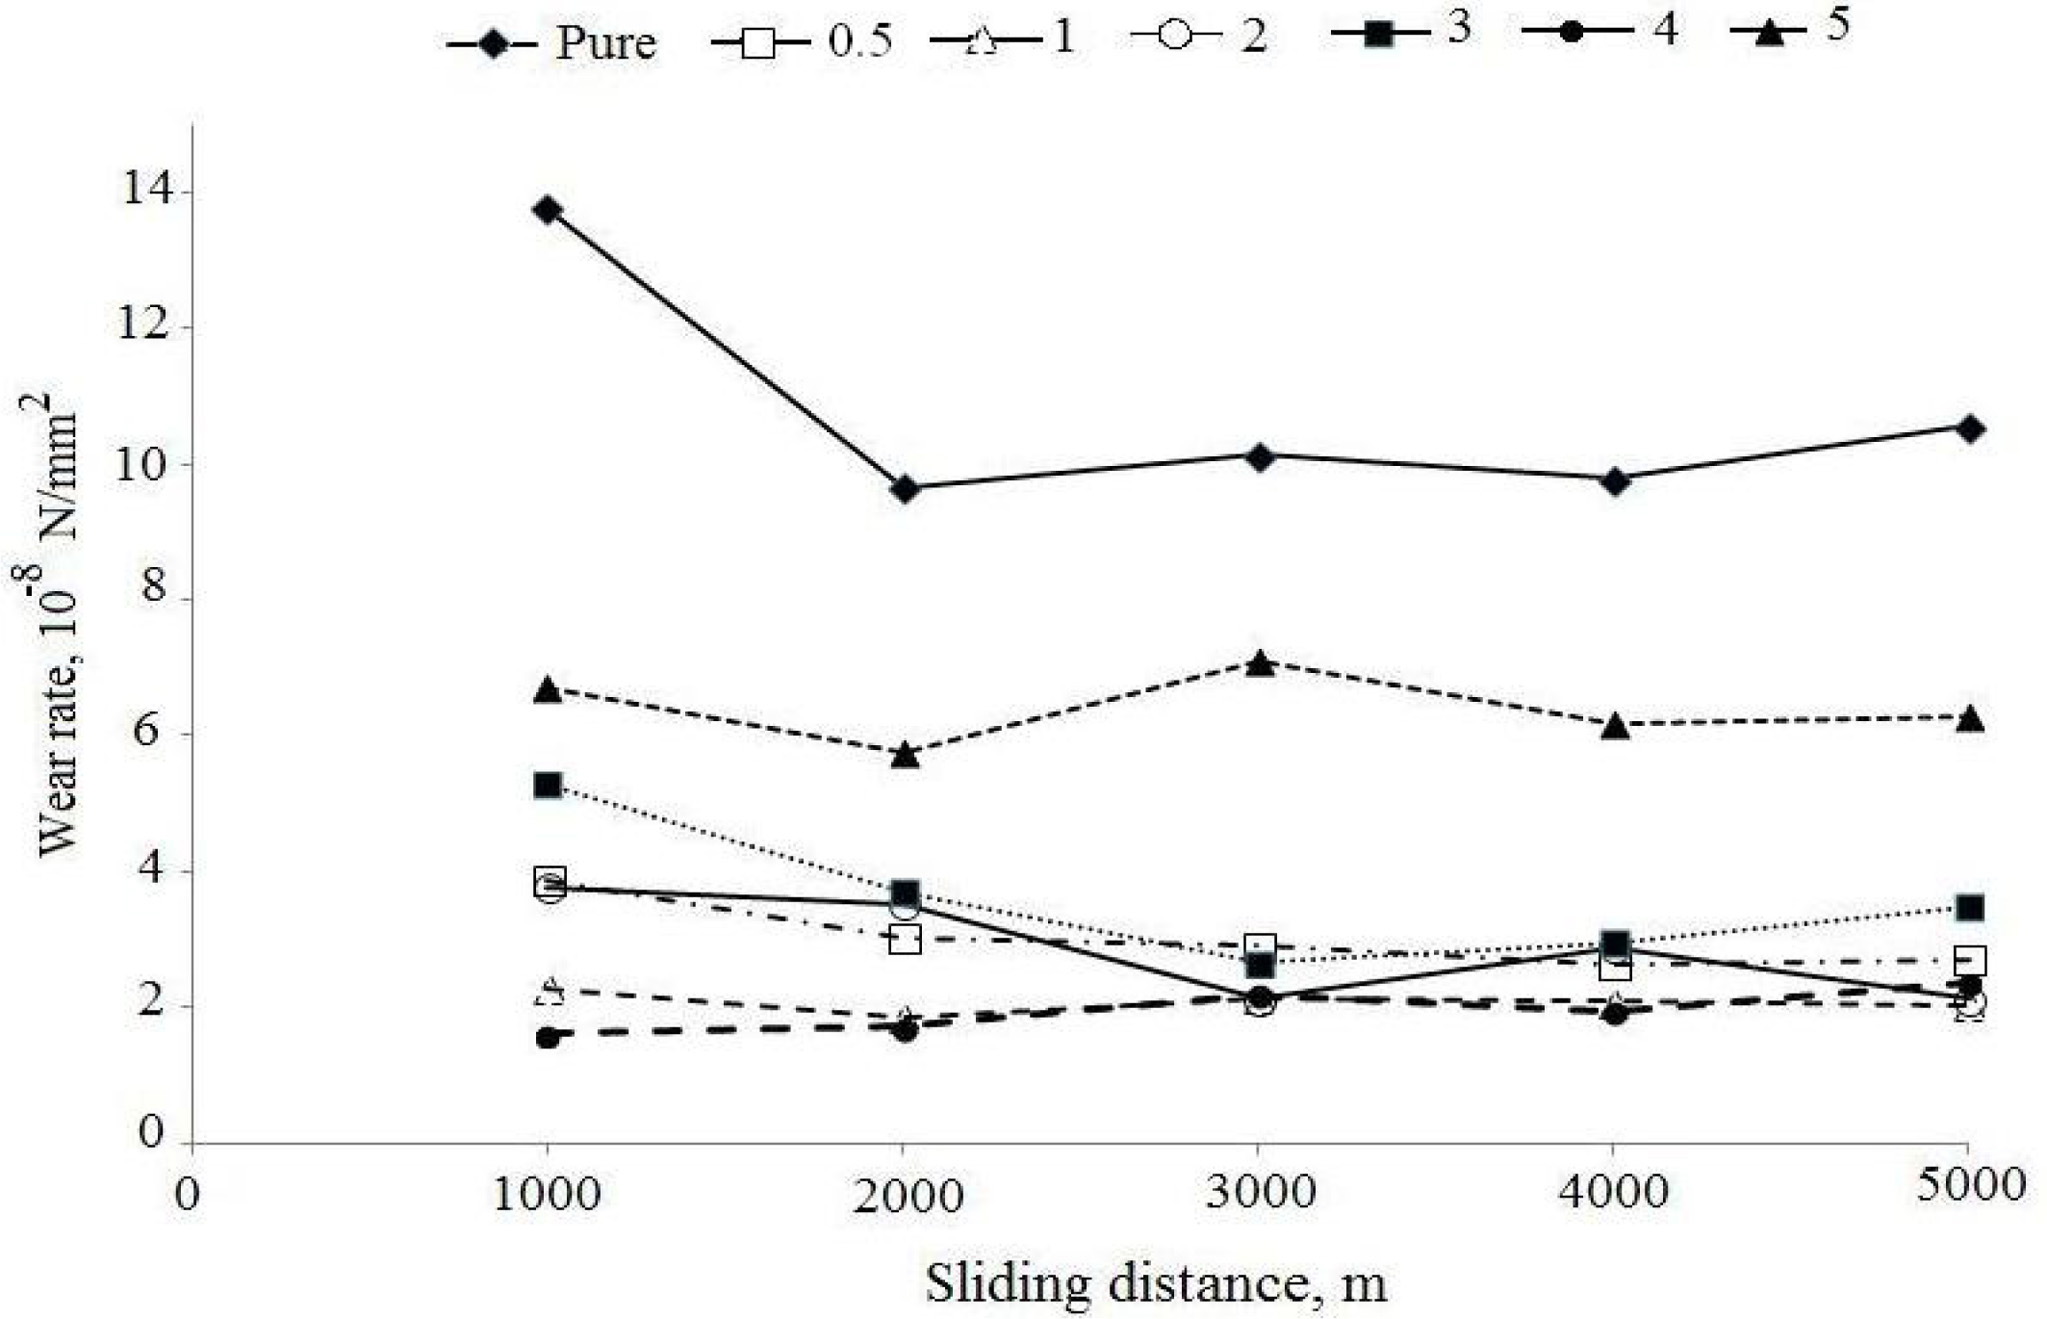
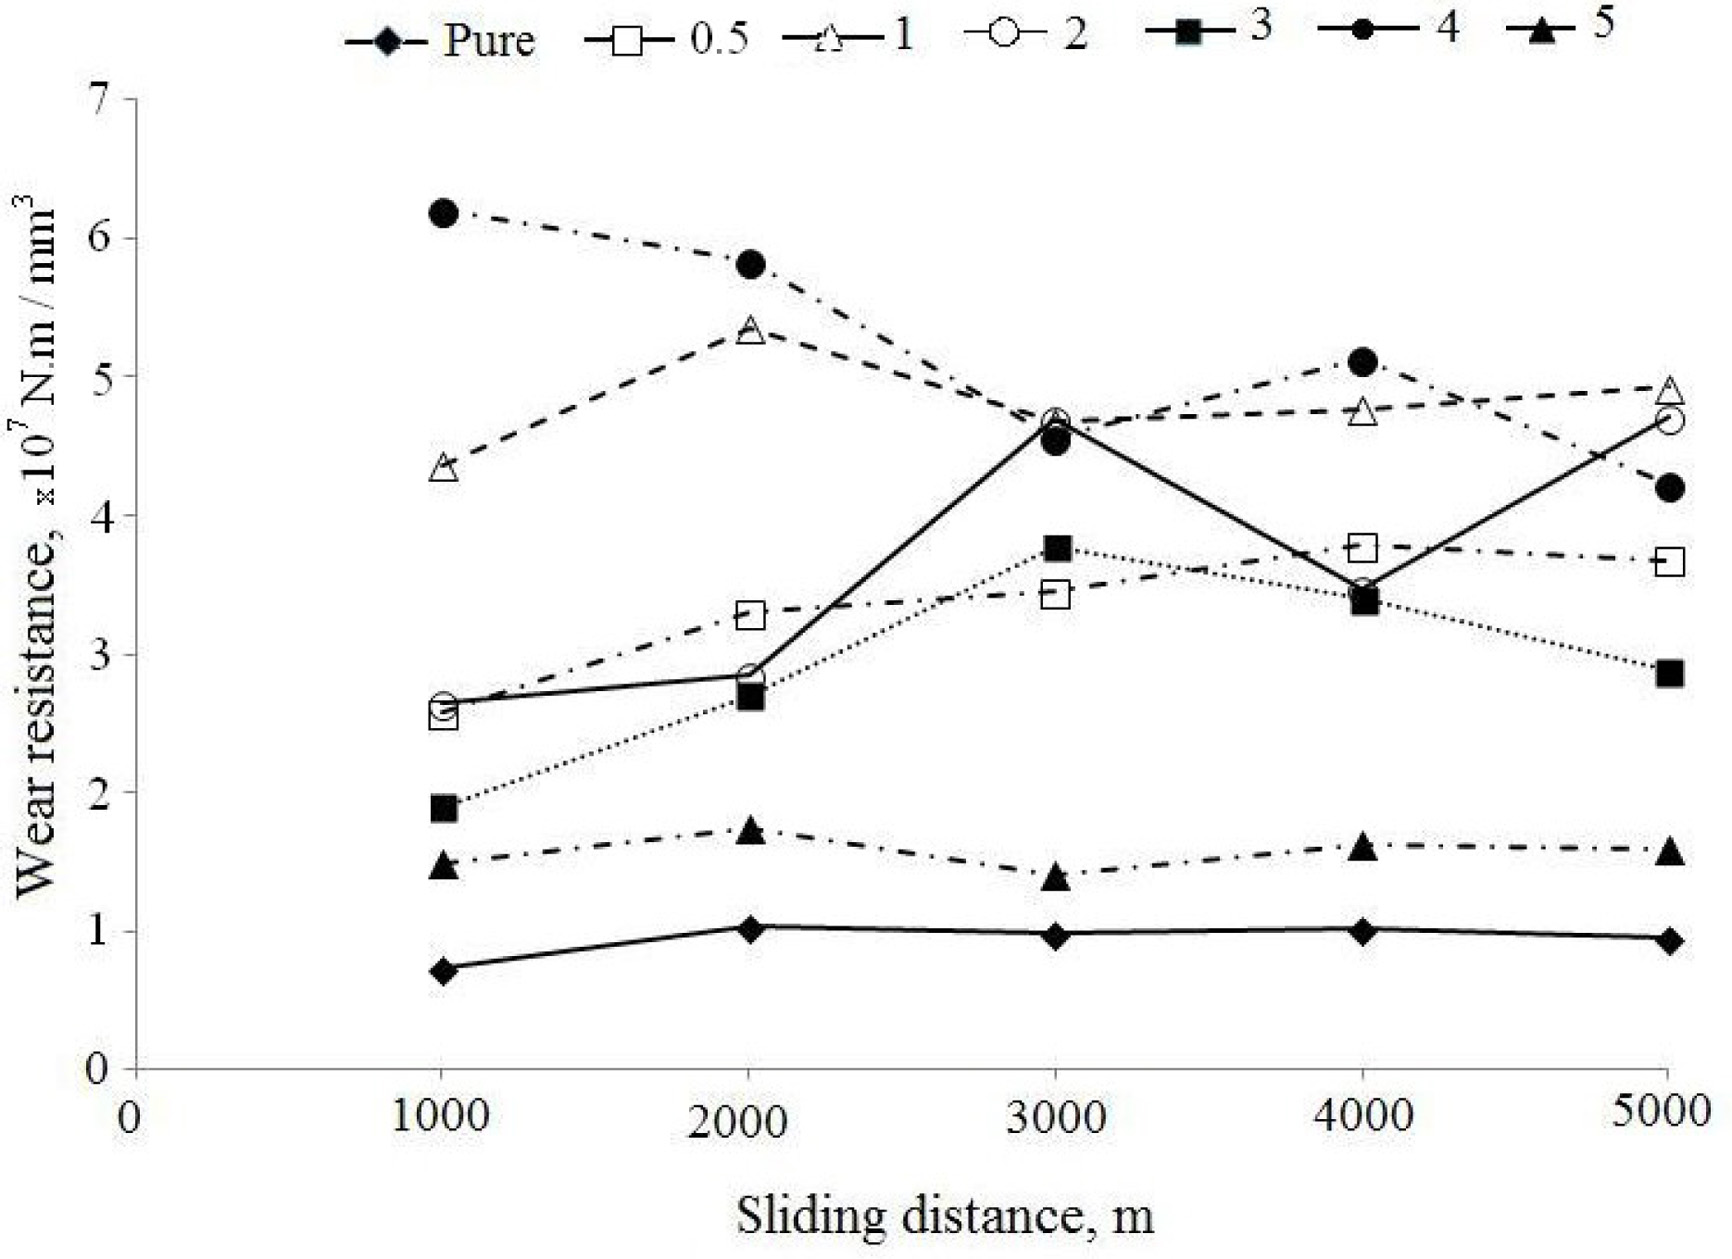
The variation of wear rate with sliding distance for all
samples with and without Ti64 and CNT % are shown in Fig. 7. As seen in Fig. 7,
the wear rate of specimens decreases with increasing CNT % con- centration in the alloy. Wear loss increased
due to increased slip distance and wear rate decreased with increasing slip
distance. In Fig. 7, it can be clearly seen that wear
rate decreased by increased CNT % additions. Generally,
with the increasing hardness dramatically decreased wear rate
until CNT 4% additions. However, the lowest wear rate
obtained 4% CNT addition. The most interesting result of this study was the
fact that the highest wear rate was obtained in materials with the highest
hardness values in the additive materials. As shown in Fig. 7, the CNT additive
was increased to reduce wear loss and wear rate. The hardness observed from
these observations has a significant effect on the wear behavior of the investigated
materials. Wear tests show that CNT addition increases
the wear resistance by 4% on average.
It is clearly displayed in Fig. 8 the effect of CNT additions
on wear resistance. The highest wear resistance and
hardness obtained with 4% CNT addition in Fig. 8 and 3. This observation shows
that hardness has a significant effect on the wear behavior of the inves- tigated CNT materials. The CNT 5% has a
wear rate less than the CNT 4% materials.
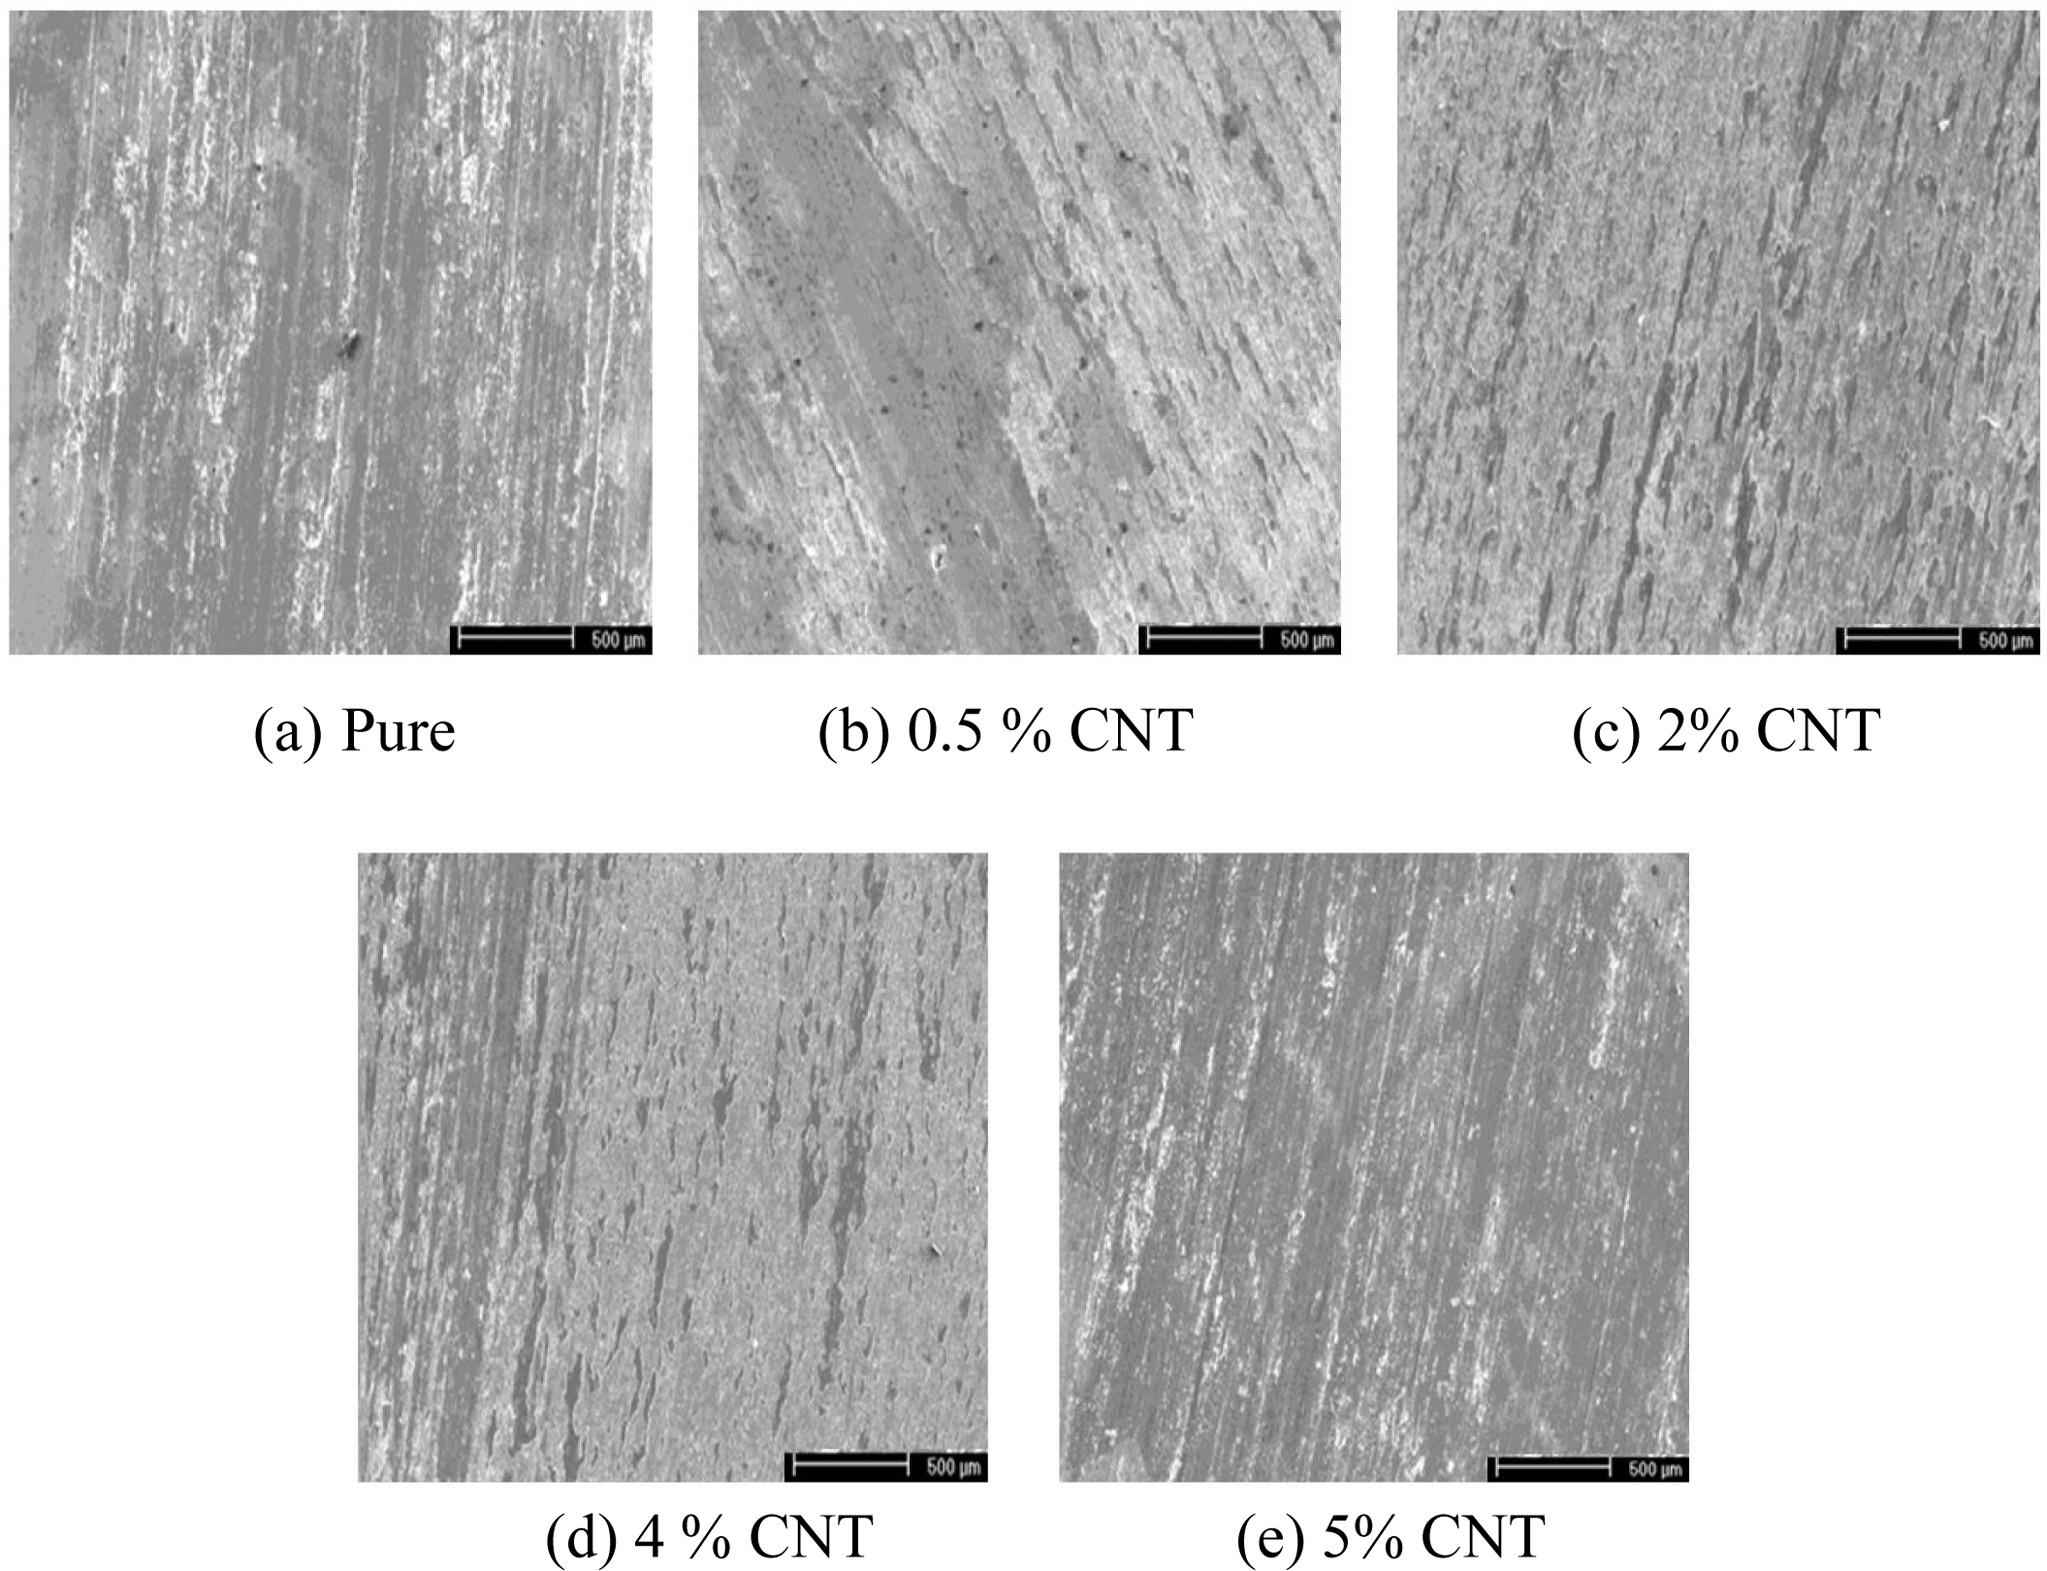
Fig. 9 shows worn surface images of CNT additions affects
s using SEM between several wear mechanisms. On the worn
surface, with the exception of CNT 2% and CNT 4%, many scratches were found
that were eroded by wear and plastic deformation on the surface, as shown in
Figs. 9(c) and (d). In addition, many cracks were observed on the worn surface.
The growth of these cracks leads to an increase in the length of wear residues.
Based on these CNT results, we can state that the amount of wear increased
significantly. Otherwise, as shown in Figs. 9(a), (b) and (e), scratches were
found around the surface caused by abrasive wear. The
results show that the addition in CNT prevents crack propagation to a certain
point as displayed in Fig. 9. This reinforcing microstructure,
effectively prevented the scratching and cracking of the
matrix material during wear and led to the removal of a small amount of debris.
Compared to low content reinforcement (0.5%, 1, 2 CNT), this turned out to be a
very different wear condition. As shown in Figs. 9(a), (b), (e), many particles
were observed on the surface. In fact, it is a transfer layer of hardened
particles caused by adhesion, abrasion, and oxidation. As expected, the
addition of CNT to the reinforcing bars was effective in increasing the wear
resistance and friction properties of titanium. The mechanism of wear has
changed after CNT 4%. The mechanism of wear was obtained pure, 0.5, 1 and 5 CNT
% adhesive wear. Increased reinforcement per-
centages of CNT, lead to the mechanism of wear becoming abrasive wear.
Therefore, the CNT 5% with the highest hardness does not achieve the highest
wear resistance. This shows that the addition of additives should be at a
certain CNT percentage.
|
Fig. 1 SEM images of Ti64 and CNT powders: (a) Ti64 and (b) CNT. |
|
Fig. 2 XRD pattern of 5% content CNT particles in Ti64 Matrix. |
|
Fig. 3 The hardness versus different CNT content (0.5 - 5%). |
|
Fig. 4 CNT % reinforced by the density of different exchange rates. |
|
Fig. 5 Optical microscopy images of Ti64 (a), (b), (c), (d), (e) and (f) different reinforced CNT. |
|
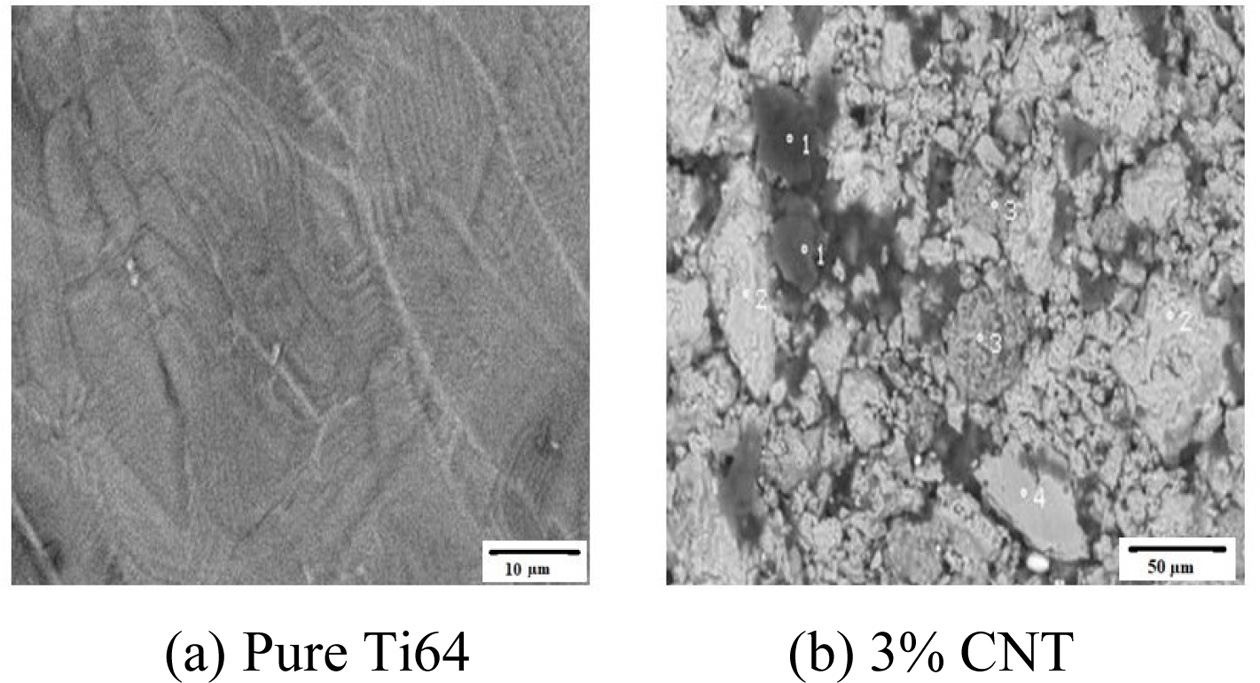
Fig. 6 SEM microscopy images of Ti64 (a) and (b) reinforced
CNT. |
|
Fig. 7 Variation of wear rate with sliding distance for samples. |
|
Fig. 8 Variation of wear rate with sliding distance for samples. |
|
Fig. 9 Worn surfaces of titanium matrix composites. |
The selected examples in this study are CNT-reinforced
Ti64 powder produced by powder metallurgy. The mean density worth of the
composites containing different ratios of CNT are as shown in Fig. 4. As the
sintering temperature decreased, the density of the samples approached the
theoretical density.
The XRD of samples having various CNT contents are
displayed in Fig. 2. Fig. 2 shows the peaks at 2 θ of 36.4 and 40.7 belongs to
the Ti6Al4V, and 25,42, and 53 belongs to the CNT. As can be seen in Fig. 2, an
increase in the intensity and region of the main peak of the CNT with
increasing CNT contents leads to a change.
Vickers hardness tests were performed on six different
compositions and sintering temperatures of 1300 oC. In Fig. 3,
mean hardness values of the samples are given. Increasing the weight percentage
of CNT also increased the stiffness of the composite. The ratio of composite
materials (CNT %), Ti64 / CNT, as increased
demonstrated increased micro-hardness measurements. However, the composite
demonstrated abrasive wear after 4-5% weight of CNT.
Optical microscopy and SEM test were taken from the
samples. In Fig. 5 and 6 displays increasing the percentage of CNT, lead to
increase porosity.
The wear rate of the samples decreased rapidly due to the
increase in theoretical density. However, in this case the hardness increased
in the opposite direction. From 0.5 and 4 wt% CNT addition decreased
sintered density, but increased hardness. Therefore, the highest wear
resistance is obtained with 4 wt% CNT addition. The result of the wear
test, despite being with the hardest 4 wt% CNT, wear resistance is not the
highest. After 4% CNT additional, the wear mechanism has changed
as displayed in Fig. 9(d) and (e). Therefore, the wear
resistance is lower and identifies 4% wt CNT as the critical value. Due to
5 wt% CNT additive material having almost as much wear rate as pure
material in Fig. 7. High wear resistance has been obtained in the case of
adhesive wear in Fig. 7. Many scratches were found on the worn surface, except
for those containing 1%, 2% and 4% CNT. In the case of CNT, the surface is worn
with wear and plastic deformation, as shown in Figs. 9(c) and (d). Also, many
cracks were observed on the worn surface, especially 5 wt% CNT. The spread
of these cracks increases the size of the wear residues. On the other hand, as
shown in Figs. 9(a), (b) and (e), we have found scratches around the worn
surface caused by abrasive wear. Supplementing in CNTs have been proposed to
prevent spreading of abrasive wear at certain rates.
The aim of this study was to investigate the density, metallographic
properties and hardness of Ti64 samples supplemented
with different CNT ratios as a function of sintering temperature. The densities
of the samples obtained from the results of this study approach the theoretical
density with increasing sintering temperatures applicable
to all different ratios of CNT contents. Besides, low CNT content resulted in a
closer result density. The images obtained from the SEM analysis show that the
CNT particles are homogeneously dispersed in the matrix and there is no
disintegration in a particular region. However, the presence of porosity at the
ends of the CNT particles is present. XRD indicates that the increased CNT
content causes an increase in density or area of the main peak. By increasing
the weight percentage and the sintering temperature of the CNT, the hardness of
the composite also increased. The effect of the sintering temperature above
1,300 oC is lost after 4-5 wt% of CNT. The dispersion
strengthening effect can be attributed to increased hardness by addition of
CNT. The addition of CNT to the base alloys leads to a reduction in weight loss
and wear rate during sliding wear tests. In addition, the 4 wt% Carbon
Nanotube content was found to be the best way to improve friction properties.
Looking at the result of the abrasion test, the wear loss is clearly reduced as
the Carbon Nanotube content increases. The highest wear
resistance has been obtained in the case of adhesive wear at
Carbon Nanotube 4 wt % content. It is clearly demonstrated that with the
increased addition of carbon nanotubes, the wear mechanisms
change. The results showed that the addition of carbon
nanotube up to 4 wt% lowered wear loss and increased wear resistance.
- 1. A.G. Jackson, J. Moteff, and F.H. Froes, J. Met. 31 (1979) 145.
- 2. L. Bolzoni, E.M. Ruiz-Navas, and E. Gordo, Mater. Sci. Forum 765 (2013) 383-387.
-

- 3. Z.Y. Ma, R.S. Mishra, and S.C. Tjong, Acta Mater. 50 (2002) 4293-4302.
-
- 4. M. Hagiwara, Y. Kaieda, Y. Kawabe, and S. Miura, ISIJ Inter 31 (1991) 922-930.
-
- 5. L. Wang, Z.B. Lang, and H.P. Shi, T. Nonferr. Metal Soc. 17 (2007) 639-643.
- 6. J.Q. Jiang, T.S. Lim, Y.J. Kim, and B.K. Kim, Mater. Sci. Techno. 12 (1996) 362-365.
-
- 7. A. Kelly, J. Mater. Sci. 41 (2006) 905-917.
-
- 8. S. Rawal, JOM, 53 (2001) 14-24.
-
- 9. J.S. Shelly, R. LeClaire, and J. Nichols, JOM 53[4] (2001) 18-21.
-
- 10. P. Rohatgi, JOM, 43 (1991) 10-15.
-
- 11. S. Ranganath, J. Mater. Sci., 32 (1997) 1-16.
- 12. M. Yamada, Mater. Sci. Eng. A. 213 (1996) 8-15.
-
- 13. S.L. Rice, S.F. Wayne, and H. Nowotny, Wear 65 (1980) 215-226.
-
- 14. S.R. Nutt and A.W. Ruff, Wear of Mater. (1983) 426-433.
- 15. R.B. Waterhouse and A. Iwabuchi, Wear 106 (1985) 303-313.
-
- 16. K.G. Budinski, Wear of Mater. (1991) 289-299.
- 17. F.M. Kutas and M.S. Misra, ASM Handbook, 18 (1992) 778-784.
- 18. A.P. Mercer and I.M. Hutchings, Wear, 124 (1988) 165-176.
-
- 19. I. Topcu, H.Ö. Gülsoy, N. Kadıoğlu, and A.N. Güllüoğlu, J Alloy Compd. 482 (2009) 516-521.
-
- 20. D.E. Alman and J.A. Hawk, Wear (1999) 629-639.
-
- 21. I. Topcu, B.N. Çetiner, A.N. Güllüoğlu, and H.Ö. Gülsoy, J. Chem. Soc. Pak. 42 (2020) 70-80.
- 22. I. Topcu, A.N. Güllüoğlu, M.K. Bilici, and H.Ö. Gülsoy, J Fac Eng Arch. Gazi Univ. 34 (2019) 141-149.
- 23. I. Topcu, H.Ö. Gülsoy, and A.N. Güllüoğlu, Gazi Univ. J. Sci. 32 (2019) 286-298.
- 24. I. Topcu, J Teh. Glas. 14 (2020) 7-14.
-
- 25. K. Saeed and N. Khan, J. Chem. Soc. Pak 37 (2015) 284-289.
- 26. K. Saeed, J. Chem. Soc. Pak. 32 (2010) 559-564.
- 27. D.H. Lee, B. Jang, C. Kim, and K.S. Lee, J. Ceram. Process. Res. 20 (2019) 499-504.
-
- 28. S.T. Hussaın, S.M. Abbas, M.A. K. Bangash, M.U. Rehman, and N. Ahmad, J. Chem. Soc. Pak. 35 (2013) 604-610.
 This Article
-
2020; 21(5): 539-546
Published on Oct 31, 2020
- 10.36410/jcpr.2020.21.5.539
- Received on Mar 6, 2020
- Revised on Apr 5, 2020
- Accepted on Apr 7, 2020
Services
Shared
Correspondence to
- Muhammet Ceylan
-
Department of Mechatronics Engineering, Istanbul Commerce University, Istanbul, Turkey
Tel : +90 444 0 413-331
Fax: +90 (216) 489 02 69 - E-mail: mceylan@ticaret.edu.tr
Clean-Energy Research Institute(CRI), Hanyang University, 222, Wangsimni-ro, Seongdong-gu, Seoul, 04763, Korea
E-mail: jcpr@hanyang.ac.kr