


- Fabrication and photocatalytic properties of ceramic ZnS nanocomposites
Soon-Do Yoona,†, Jeong Woo Yunb,† and Yeon-Hum Yunc,d,*
aDepartment of Chemical and Biomolecular Engineering, Chonnam National University, Yeosu, Jeonnam 59626, South Korea
bSchool of Chemical Engineering, Chonnam National University, Gwangju 61186, South Korea
cDepartment of Energy & Resources Engineering, Chonnam National University, Gwangju 61186, South Korea
dGeoconvergence Research Center, Chonnam National University, Gwangju 61186, South Korea
Ceramic ZnS nanocomposites
were prepared by mechanical processing and one-step heat sintering with powder
mixtures of fly ash, waste glass, and ZnS (template-free hydrothermal method
manufacturing). Chemical durability and morphological characteristics of
heat-treated samples at 800 oC with/without acid treatment were
evaluated. The photocatalytic activities were estimated with methyl orange
(MO), methylene blue (MB), acetaldehyde (ATA), and 2,4-dichlorophenoxyacetic
acid (2,4-D) as photodegradation targets. Crystallization behaviors of the
prepared ceramic ZnS nanocomposites were investigated using X-ray diffraction (XRD),
field emission-scanning electron microscopy (FE-SEM), and energy dispersive
X-ray spectrometry (EDS). In addition, compressive and bending strength as
mechanical properties were evaluated. Ceramic ZnS nanocomposites were found to
showed improvement in optimal photocatalytic reaction and physical properties
regardless of acid treatment when the amount of ZnS nanoparticles was increased
from 7.0 to 25.0 wt%. Degrees of photocatalytic decomposition of MO, ATA,
2,4-D, and MB by acid treated ceramic ZnS nanocomposites containing 25 wt%
ZnS were about 0.185, 0.121, 0.216, 0.236, respectively, after UV irradiation
for 180 min.
Keywords: Ceramic ZnS nanocomposite, Chemical durability, Acid treatment, Photocatalytic activity, Mechanical properties
ZnS (zinc sulfide), one of metal sulfides, has attracted a
lot of attention in various fields because it can be used to produce
high-efficiency photocatalysts with thermodynamically optimal
conditions for photocatalytic redox reactions and appropriate band
potential of electricity [1-3]. It is a very important transition metal sulfide
that can be used as many practical applications such as electroluminescent
phosphors [4-5], electro-photocatalysts [6-7], and optoelectronic devices
[8-9].
Photocatalytic processes in nanoscale
materials mostly require diffusion or coating of a suitable
substrate for functional performance. However, nanoscale
photocatalysts used in dispersion methods are difficult to
assemble after use. To solve this problem, photocatalysts in which
ZnS layers are formed by coating various substrates (such as ceramics, glass
plates, metal plates, or glass tubes) or by sol-gel processes have recently
been developed [10-12]. Additionally, nanocomposites added
ZnS nanoparticles can be prepared to have various physicochemical,
thermal, and other distinctive properties with
superior advantages. Nanocomposites have properties superior
to conventional micro-scale composite materials. It can be
also synthesized using simple and inexpensive methods [13-14]. In many studies,
nanocomposites that represent composite materials with nanometer particle sizes
have been fabricated using nanoclay, nanofiller, nanofibril, or nanoSiO2. Song
et al. [15] and Lai et al. [16] have reported that mechanical, chemical, thermal
properties, and water-proof functions of prepared nano- composites were improved by the addition of
nano- particles.
The main objective of this study was to prepare ceramic
ZnS nanocomposites using waste glass powders, fly ash
from thermal power plants, ZnS nanoparticles as inorganic fillers in matrix of
the composite materials and to evaluate their mechanical, chemical durability
and photocatalytic properties. Properties of nano-ZnS of ceramic composites are
known to depend essentially on properties of finely precipitated ZnS crystals
and the residual phase. Therefore, it is expected that these ceramic ZnS
nanocomposites would exhibit excellent photocatalytic activities if nano-ZnS
crystals could be densely deposited in ceramic complexes containing
ZnS crystals. Advanced microscale composite materials with
appropriately well-developed properties can have various ripple effects if they
are prepared by econo- mically
reasonable methods. In this respect, it is significant point that recycling of
waste resources such as fly ash and waste glass can improve various
environmental problems. For this reason, they can be obtained by modifying
inefficient chemical bonding with a high temperature heat sintering step, using
a disc-type ball mill, a unique mechanical bonding process
[17]. In order to verify the applicability which can respond to
environmental changes as an acidic condition, we also
evaluated the chemical durability of ceramic ZnS nanocomposites prepared by
acidic treatment. The characterization such as crystallinity and morphology of
ceramic ZnS nanocomposites prepared with different ZnS nanoparticles content
were analyzed using X-ray diffractometer (XRD) and field emission scanning
electron microscopy (FE-SEM). Energy dispersive X-ray spectroscopy (EDS) was
also used to observe and analyze their chemical compositions of ceramic ZnS nanocomposites.
Physical properties such as compressive strength, bending strength
and Vickers hardness of these fabricated ceramic ZnS nanocomposites were
investigated. Additionally, photocatalytic degradation of methyl orange (MO),
acetaldehyde (ATA), 2,4-dichlorophenoxyacetic acid (2,4-D), and methylene blue
(MB) as photodegradation targets was measured using the ceramics ZnS
nanocomposites under UV light irradiation.
ZnS nanoparticles were synthesized by the template-free
hydrothermal method [18]. In a typical method for synthesizing ZnS,
10.0 mmol Zn(CH3COO)2 (Aldrich Chemical
Company, Inc., USA) and 10 mmol Na2S2O3·
5H2O (Aldrich Chemical Company, Inc., USA) were dissolved in
110 mL of deionized water (DW) under continuous stirring for 50 min.
The pH was then controlled, and the mixture was transferred to a teflon-lined
autoclave with 125 mL capacity. The autoclave was maintained at 150 oC
for 10 h and then cooled to room temperature. The precipitate was washed
several times with distilled water (DW) and absolute ethanol to remove soluble
inorganic impurities. Fly ash from municipal waste incinerator (Yeocheon, South
Korea) and waste glass cullet mixed with several types of waste glass (bottles,
car window shields, plates, etc.) were used as raw materials.
Chemical compositions of raw materials, fly ash and waste
glass cullet are listed in Table 1. According to chemical analysis,
fly ash was composed of oxide (wt%); 46.31% SiO2,
27.58% CaO, 8.81% MgO, 13.56% Al2O3, and 6.44% Fe2O3.
Energy dispersive X-ray spectrometer (EDS, X-Max, Oxford Ins.,
UK) was used for elemental analysis. In these experiments, a fine fly
ash powder (about 200 mesh) from a municipal waste incinerator was used.
Glass cullet was carefully washed in a water bath to remove contaminants and
dried in a dry oven at 90 oC for 24 h. Glass powder was
obtained by grinding the glass cullet in a disk type ball mill (Retsch GmbH
& Co.KG., D-42781 HAAN, TYPE: RS1, Germany) for 20 minute
(700 rpm). Ceramic ZnS nanocomposites were attained by
mechanical processing using the milling technique.
Firstly, the powder mixture consisted of waste glass powder (65 wt%) and
fly ash (35 wt%). Approximately 30 g of two different powder mixtures
of waste glass and fly ash were mechanically ground in a disk-type ball mill
for 8 hours (700 rpm). After grinding, the particle size was decided with
a particle size analyzer (PSA, Malvern Ins. Lab., MS 1002). Most particles were
in the range of 0.1-1 μm. ZnS nanoparticles (0, 7, 14, 20, and
25 wt%) were then mixed directly together using a mixer for 20 min.
These mixtures were pressed into a cylindrical shape with a diameter of 10 mm
and a length of 30-50 mm without using a binder. Formed samples were fired
to 800 oC at a heating rate of 5 oC /min for
1 h under air and in a box-type SiC furnace. They were then allowed to
cool inside the furnace. The chemical durability for acidic conditions was
evaluated by the measurement of weight change. To investigate the chemical
durability, the ceramic ZnS nanocomposite specimens were
immersed into 30 mL acidic solution (1 N H2SO4)
at 50 oC for 48 h. After immersing, the specimens were
washed with DW and dried at 80 oC for 20 h.
Surface morphology and compositions of these ceramic ZnS
nanocomposites were evaluated using field emission scanning electron microscopy
(FE-SEM, ZEISS Sigma 500, Carl Zeiss Co., Ltd, Germany) equipped with an energy
dispersive X-ray spectrometer (EDS) that has a Robinson type backscattered
electron detector. An X-ray diffraction analysis for ceramics ZnS nanocomposites
was performed using Cu Kα radiation by scanning at a rate of 2
degrees/min with a diffractometer (XRD, Rigaku D/MAX Ultima III). The scan
speed was 2˚/min, and the scan range of the diffraction angle (2θ) was 15˚ £ 2θ £ 60˚. Photolumine- scence (PL) spectroscopy
(f = 0.5 m, Acton Research Co., Spectrograph 500i, USA) was
performed at room temperature a 266 nm DPSS laser (Photoluminescence
Measurement System, Gwangju center, KBSI), and an intensified CCD(PI-MAX3)
(Princeton Instrument Co., IRY1024, USA) at a room temperature.
Density was examined using an Electronic Densimeter
(ED-120T, MFD BY A&D CO., LTD, Japan). Com- pressive strength was determined with a
universal tester (Instron 4302, Instron Co., England). Bending strength
was investigated with a 3-point bending strength test using
a universal tester (Instron N8872, Instron Co., England). Vickers hardness was
estimated using a Vickers hardness tester (Shimadzu Co., HMV-2 series, Japan).
To examine chemical durability, ceramic nano-
composites were immersed into 15 mL acidic solution (1 N H2SO4)
at 60 oC for 48 h. After immersing, specimens were washed
with distilled water and dried at 80 oC for 12 h.
Photocatalytic degradation for methyl orange (MO, Aldrich
Chemical Company, Inc., USA) and 2,4-dichlorophenoxyacetic acid (2,4-D, Aldrich
Chemical Company, Inc., USA), acetaldehyde (ATA, Carlo Erba (Milan, Italy)),
and methylene blue (MB, Junsei Chemical, Japan) were performed using the method
described by Yun et al. [19]. Briefly, photocatalytic degradability of BPA,
2,4-D, MB, and MO for the prepared ceramic ZnS nanocomposite were examined
using a decomposition test in an aqueous solution under UV light.
Photocatalytic decomposition of target compounds was calculated as the ratio of
initial (C0) and final concentration (C). The initial concentration
of BPA, 2,4-D, MB, and MO was 10 ppm. UV illumi- nation was carried out with
two UV-A lamps (F10T8BLB, Sankyo Denki). Concentrations of
BPA, 2,4-D, MB, and MO were investigated by absorbance measurement with a
UV-vis. spectrophotometer (Optizen 2120UV, Neogen Co.,
Ltd, Korea). In case of ATA, it was evaluated using
a GC/MS (Gas Chromatography Mass Spectrometer, QP-5050A,
Shimadzu). Each sample and 1 mL ATA were placed into a reactor. Dark
condition was then maintained until ATA was adsorbed to the sample surface for
3 h. When ATA changes no longer appeared on the specific peak of ATA on
GC/MS, UV lamp was radiated. Table 2
|
Table 1 Density and weight change% of ceramics nanocomposites in regard to ZnS contents (0, 7, 14, 20, and 25 wt%) |

|
Table 2 The kinetic constants (k1) and correlation coefficients (R2) of the pseudo-first-order model for the liner plots of ceramic nanocomposites added ZnS nanoparticles (before and after acid immersion) |
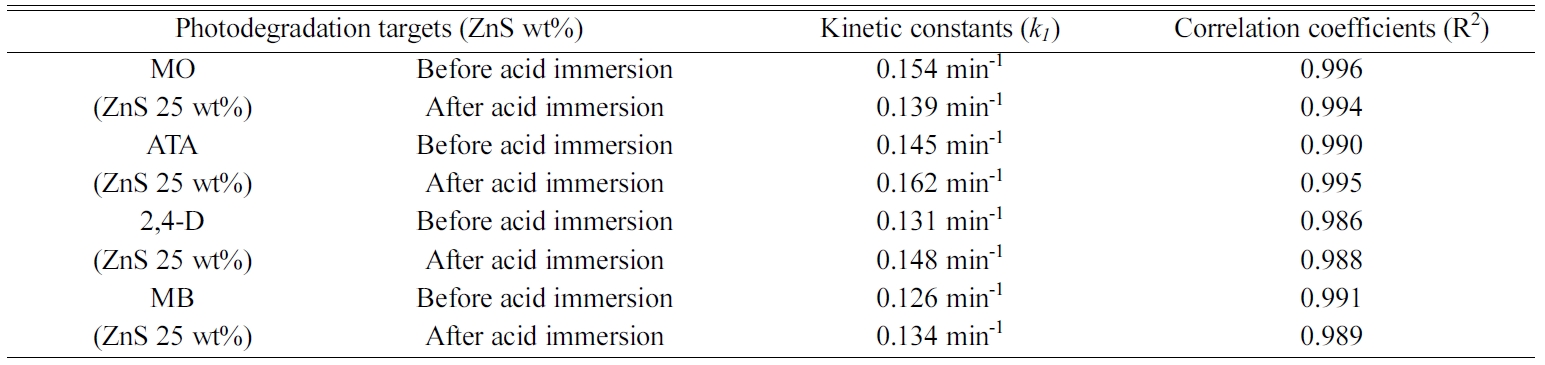
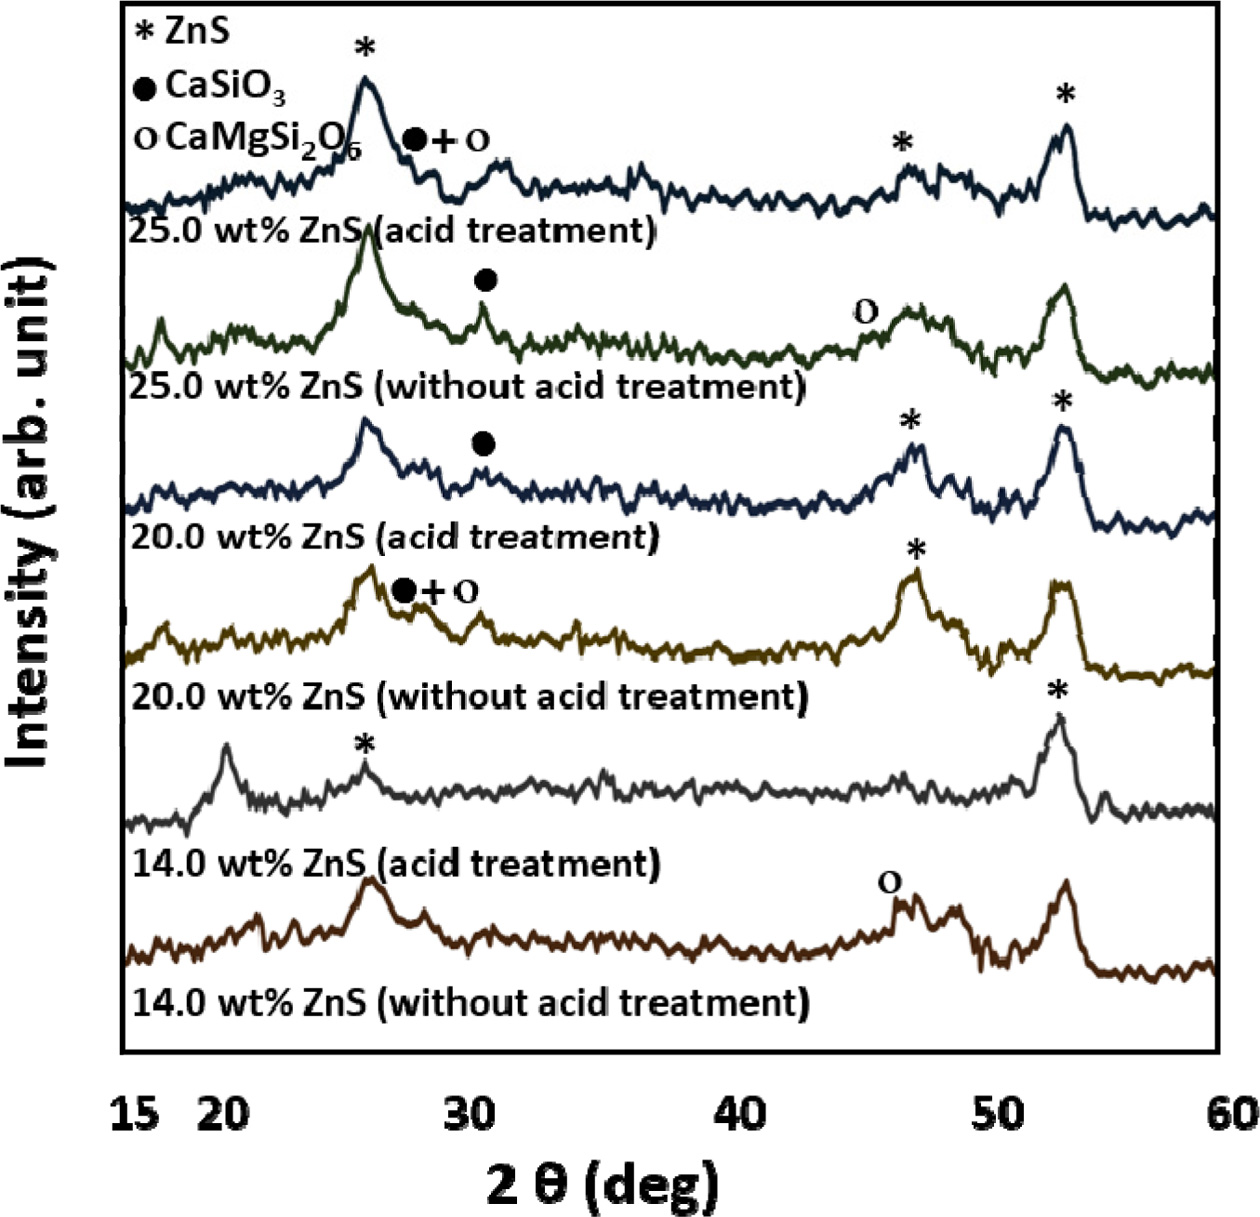
Fig. 1 represents the results of XRD patterns of ceramic
nanocomposites containing ZnS nanoparticles (14% and
25 wt%) before and after immersing in acidic
solution. Crystalline phases present in ceramic ZnS nanocomposites corresponded
to ZnS (JCPDS File 05-0566), CaSiO3 (JCPDS File 76-0925), and CaMgSi2O6
(JCPDS File 78-1390). ZnS diffraction patterns showed 2θ value main
peaks of 28.67°, 47.61°, and 56.42° corresponding to ZnS. The intensity of ZnS
distinctive peak was increased as the amount of ZnS added to the ceramic
nanocomposite increased. This designates that ZnS is included in the specimen.
The variation in ZnS phase did not detect after blending ZnS nanoparticles into
ceramic nanocomposites (non-acid & acid treatment). The results
indicate that the prepared ceramic ZnS nanocomposite has photocatalytic
activity because the characteristic peaks of ZnS with a relatively high
photocatalytic activity were observed even when it is combined with the ceramic
nanocomposite. Peak intensities corresponding to the CaSiO3 + CaMgSi2O6,
CaSiO3, and CaMgSi2O6 crystal were still
identified in specimens. It is significant to note that these peak intensities
are due to the formation of wollastonite and diopside crystals. The formation
of the crystal phase at annealing temperature of 800 oC has a
sufficient effect on physically mechanical properties. From the results, it can
be verified that the crosslinking is occurred by heat sintering between
nanocomposites components. To gain more insight into chemical durability, morpho- logical and chemical compositions of the
grain-like phase at surfaces of specimens before and after immersing in acidic
solution were examined by FE-SEM and EDS. Figs. 2 and 3 show surface morpho- logies and grain-like phase’s chemical
compositions of ceramic nanocomposites containing ZnS nanoparticles
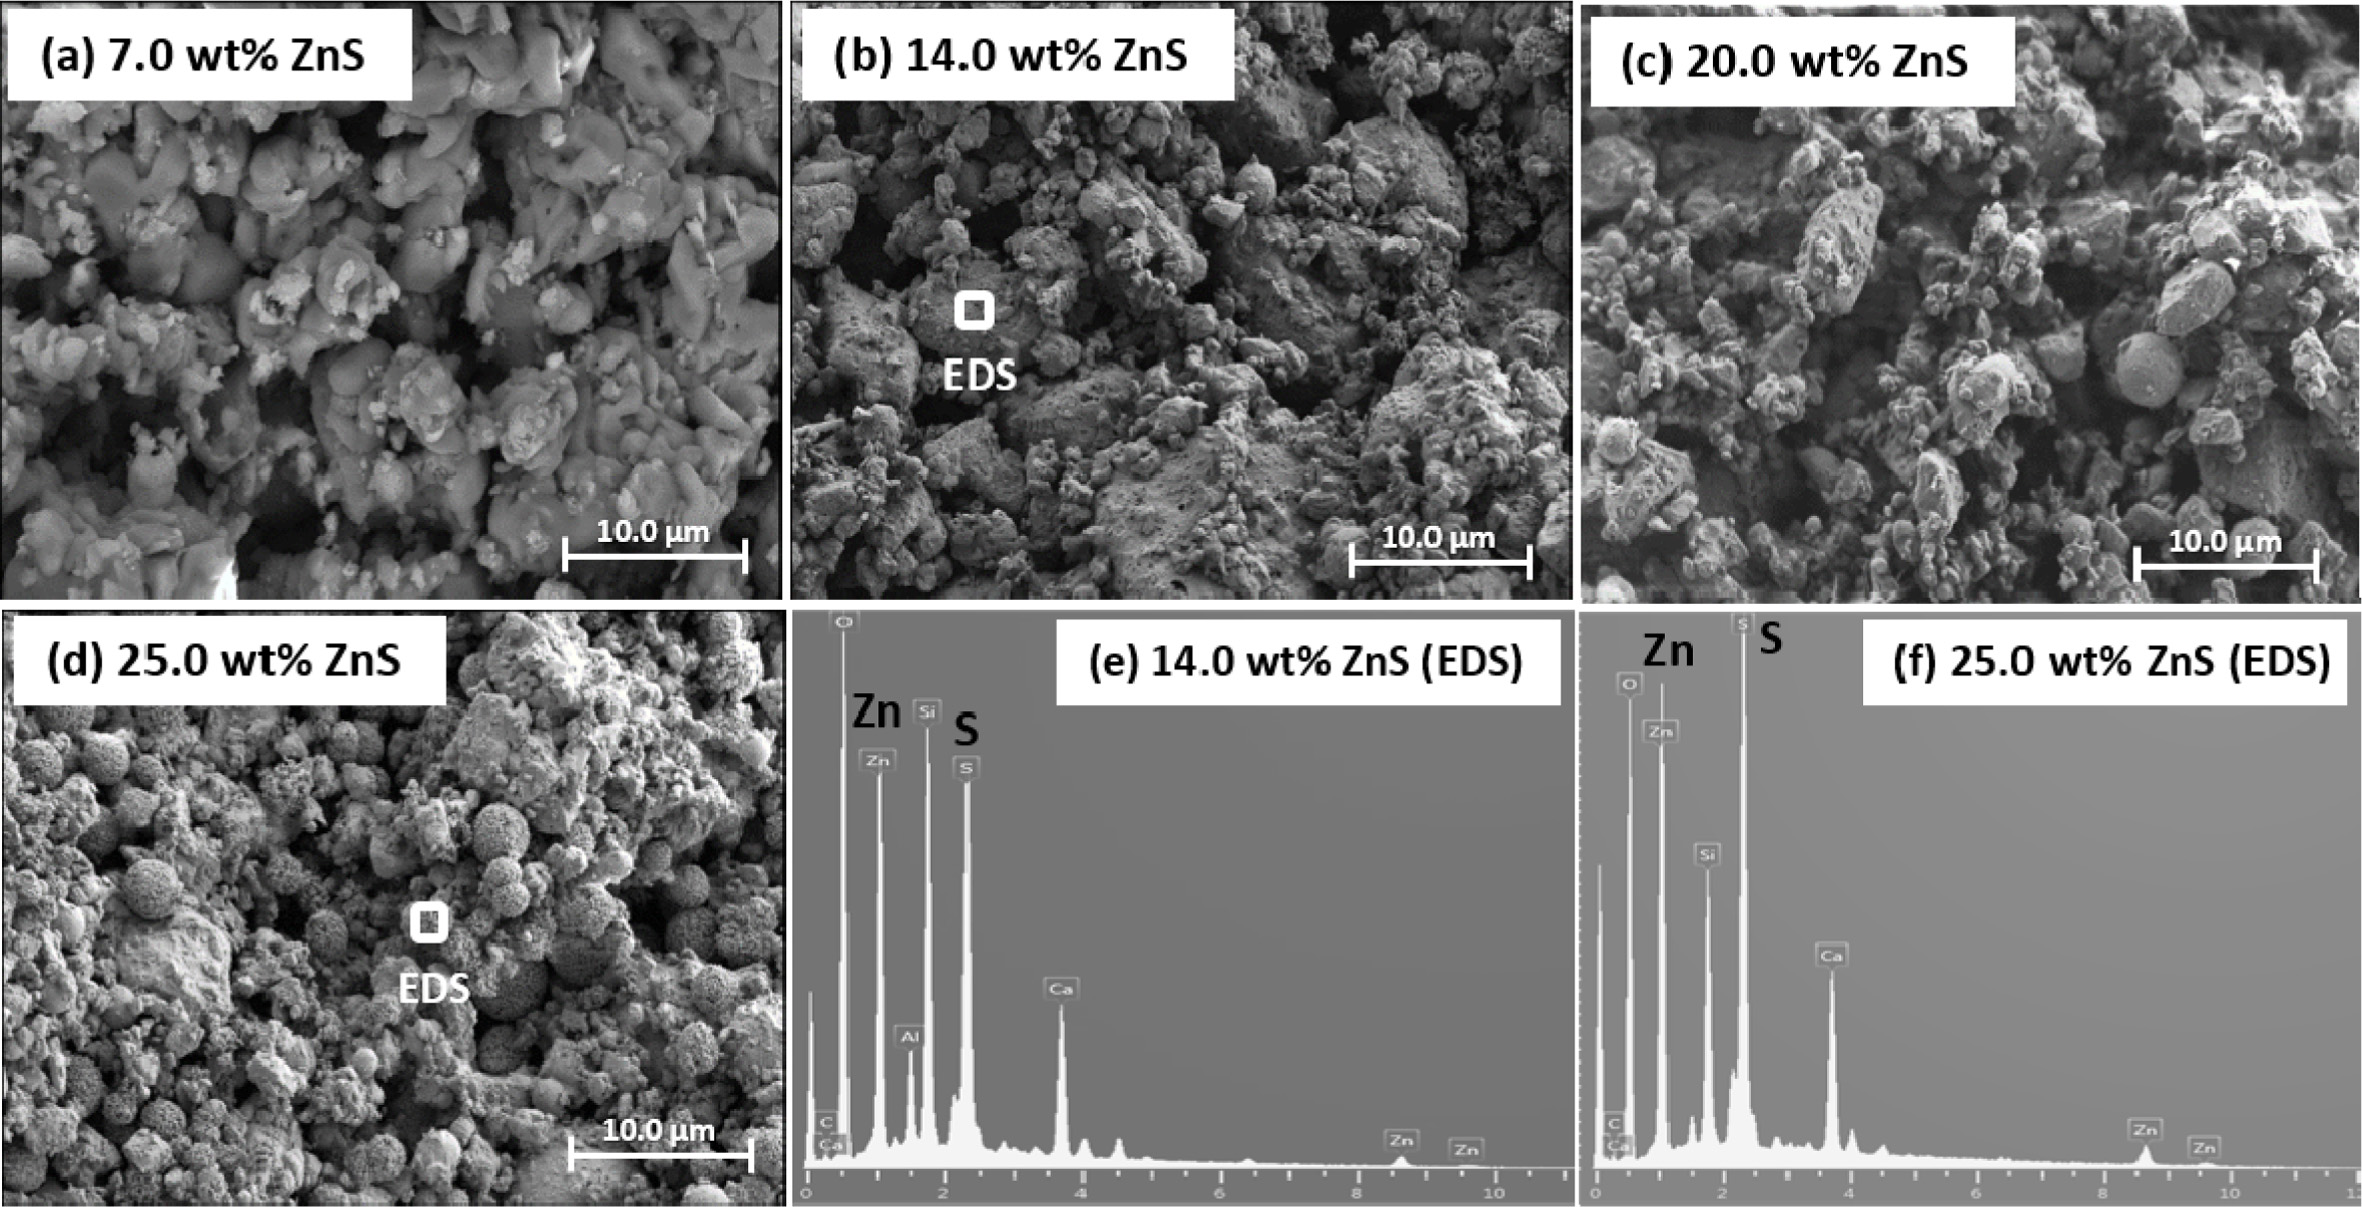
(7.0-25.0 wt%) before and after acid-immersion. Figs. 2a, b, c, and d
present the results of morphological analysis of the specimens
added with ZnS nanoparticles before acid-immersion. Fig. 2a
shows many rough angular-shape grains at size of 2.6 μm to 8.9 μm
with irregular type grains in the matrix. The grain’s surface shape was
heterogeneous and small in size. As seen in Figs. 2b and 2c, when ceramic
nanocomposites were added with ZnS nanoparticles at 14.0 and 20.0 wt%, surfaces
of specimens revealed irregular and unsystematic round-like
grains with size ranging from 2.3 μm to 7.6 μm. A morphological
analysis of specimens with ZnS contents of 25.0 wt% (Fig. 2d) showed
that round-shape grains unchangeably aggregated in the matrix before immersing
in acidic solution. It was caused by the formation of highly crystallized ZnS
nanoparticles, and the round-shape crystals are typical SEM results of ZnS.
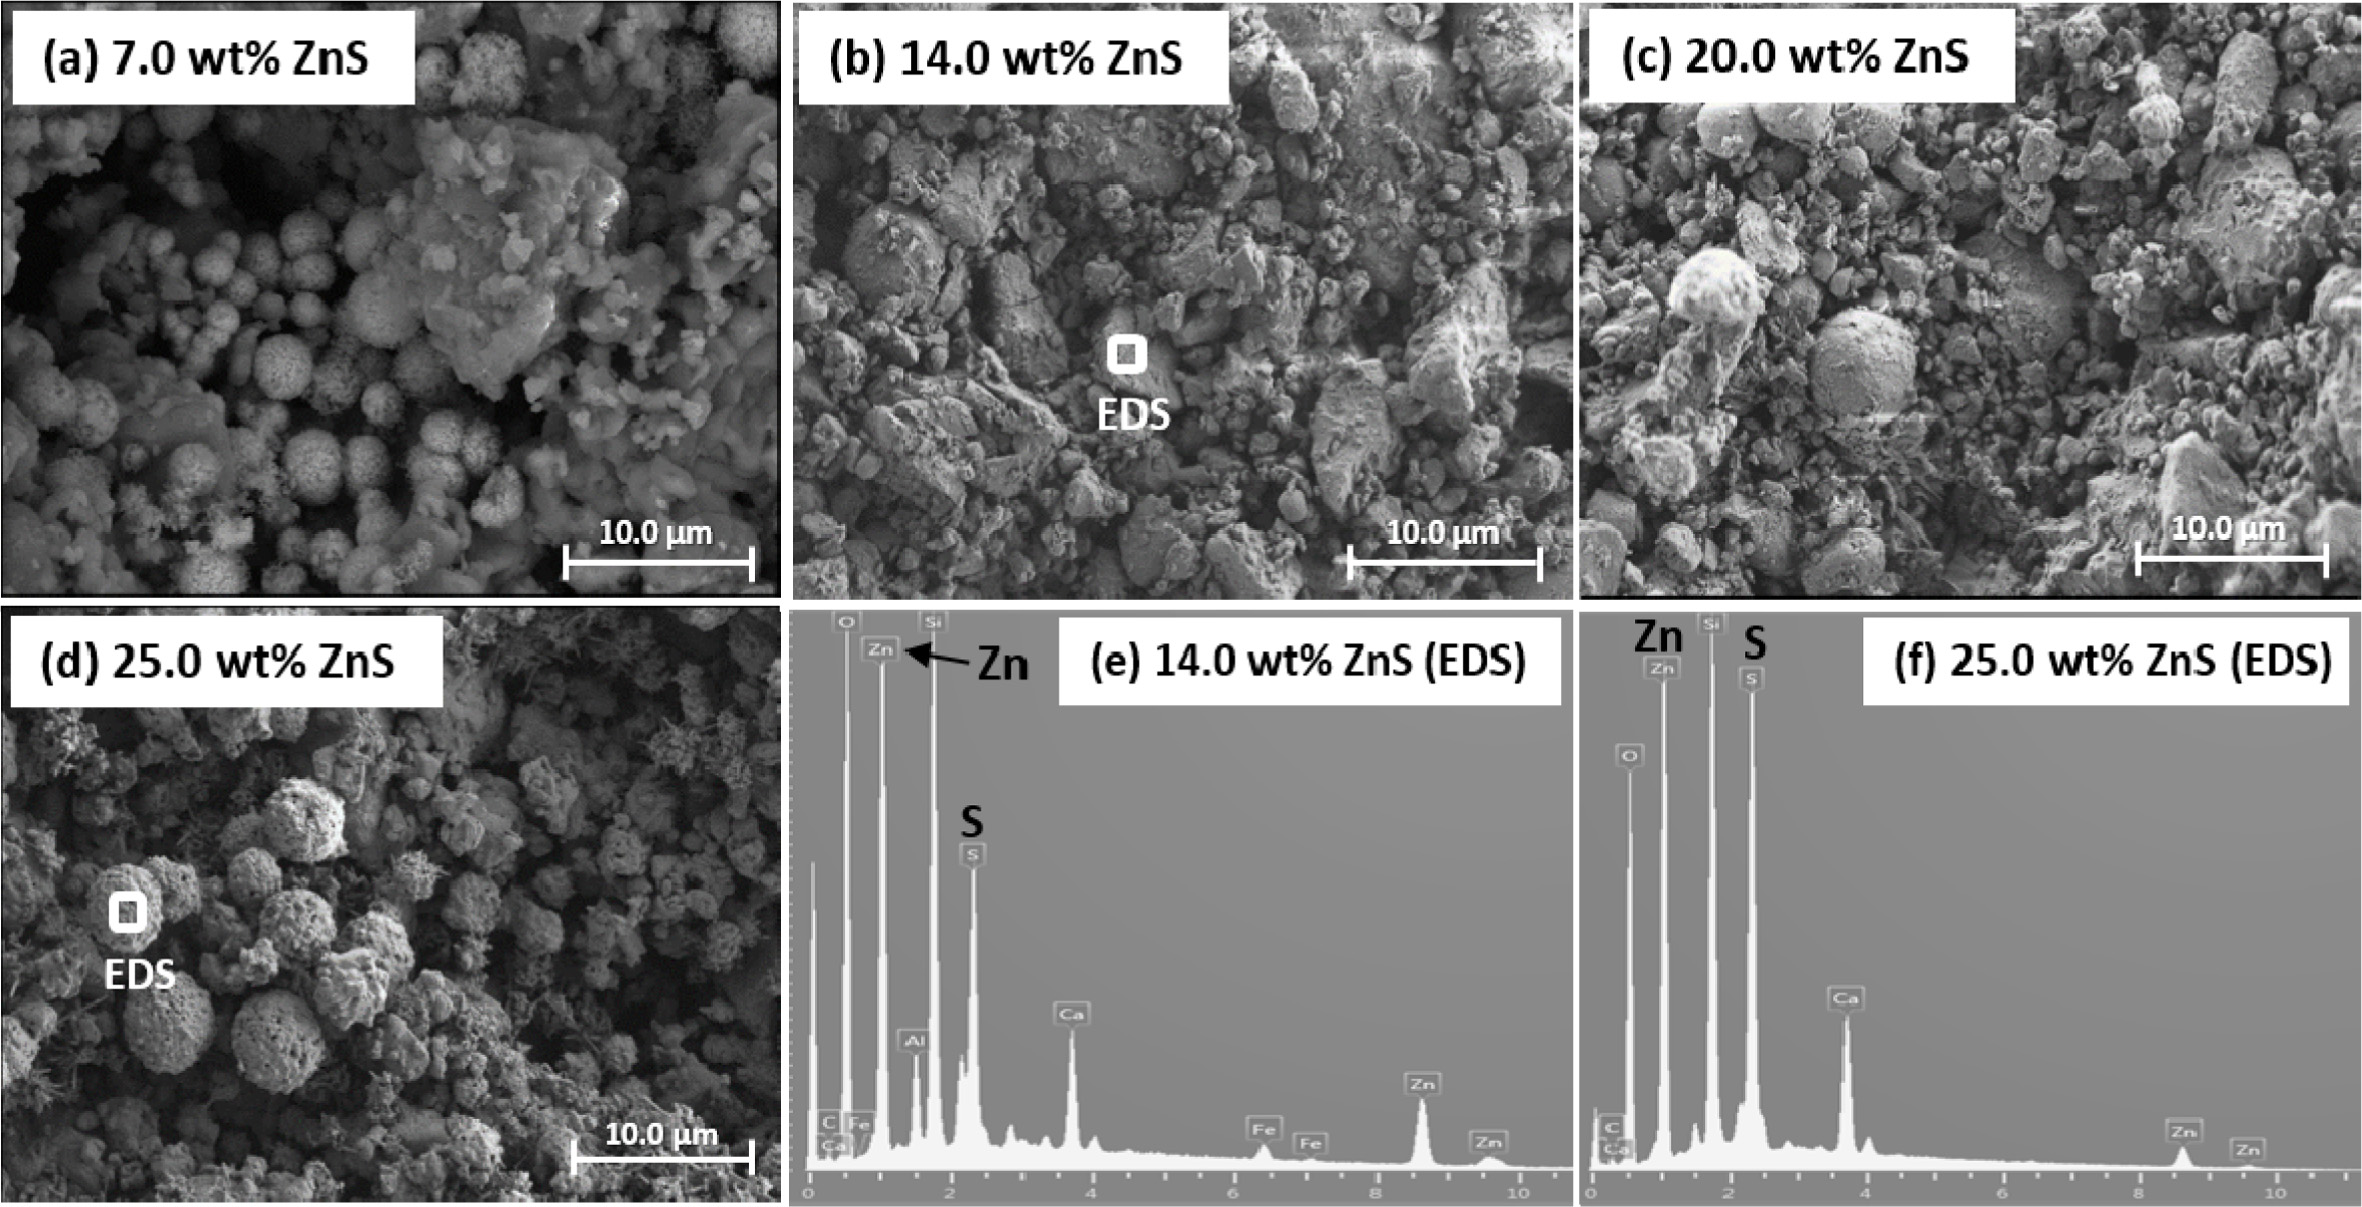
The chemical durability of nanocomposites investigated by
observing surfaces of samples with various ZnS contents (7.0-25.0 wt%)
after immersing in acidic solution is shown in Fig. 3. Chemical durability was
not significantly affected by the acid treatment and ZnS contents (Fig. 3a, b,
c, and d), and no noticeable change was seen when compared to Fig. 2. When
FE-SEM images were obtained for ceramic nanocom- posites prepared by adding ZnS nanoparticles
with heat sintering at 800 oC, no difference in chemical
durability was found between before and after acid treatment of the samples. As
clearly shown in Figs. 2 and 3, gradual increase in ZnS content caused a change
in grain shape and surface condition of the specimen regardless of acid
treatment. Therefore, an important factor for the crystal formation and surface
state of the nanocom- posite is the
change in ZnS content. From the results of EDS analysis, Si, Zn, S, Ca, Al and
Fe were detected on grain-like phase’s surfaces of all specimens before and
after acid-immersion. As shown in Figs. 2f and e, relatively
major and strong peak intensities corresponding to zinc and
sulfur were identified on surface grains for non-acid treated specimens.
Results of EDS of ceramic nanocomposites after acid treatment are shown in
Figs. 3e and f. It is very difficult to identify variations in zinc and sulfur
peak intensities between before (Figs. 2e and f) and after (Figs. 3e and f)
acid-immersion. In case of specimens added ZnS nanoparticles, nanoparticles
were closely agglomerated on specimens and crystallized, so that no significant
change in grain-like crystals’ EDS peak intensities between non-acid and acid
treatment was detected.
Compressive and bending strength were investigated for
specimens added 0, 7.0, 14.0, 20.0 and 25.0 wt% ZnS nanoparticles in
ceramic ZnS nanocomposites sintered by heating at 800 oC. For
all specimens, compressive and bending strength before immersion (BI) and after
immersion (AI) in the acidic solution are shown according to the degree of
increase of ZnS content in the nanocomposite. Tests were executed 20 times for
each specimen and the results are shown in Fig. 4. As seen in Figs. 4a and b,
compressive strengths of ceramic ZnS nanocomposites before and after acid
treatment with the increase of ZnS content ranged from 117.3 to 154.9 MPa
(BI) and from 103.9 to 150.8 MPa (AI), respectively. In addition, bending
strength was improved from 36.5 to 73.9 MPa (BI) and from 29.4 to
65.8 MPa (AI). These specimens after acid treatment tended to have
slightly lower all strengths, although they showed sufficiently good outcomes.
Figs. 4a and b show that the increase in compressive and bending strengths of
ceramic nanocomposites (25.0 wt% ZnS) is due to an increase in content of
ZnS nanoparticles contained in the sample regardless of acid treatment. These
results confirmed that ZnS nanoparticles contained in ceramic
nanocomposites could play a crosslinking of the components, thus ceramic ZnS
nanocomposites showed outstanding mechanical strengths when ZnS content was
increased. Fig. 4c shows Vickers hardness for heat-treated ceramic ZnS
nanocomposites with different ZnS content (before and after acid treatment). It
was certain that the value of Vickers hardness increased as the content of ZnS
nanoparticles increased from 0 to 25.0 wt%. As shown in Fig. 4c, ceramic nanocomposites
heat-treated at 800 oC (25.0 wt% ZnS) had the maximum
hardness values of 5218.4 ± 32 MPa before acid treatment and
4792.5 ± 36 MPa after acid treatment. These results indicate
that the development and technological improvement of ZnS nanoparticles
(increasing the content of ZnS) could make them well dispersed in ceramic
nanocomposites to improve both compressive and bending strengths so that
specimens with different contents of ZnS nanoparticles could have sufficient
mechanical strength and were suitable for practical usage.
Table 1 show density and weight changes (%) before and
after acid treatment of specimens (ZnS content: 0, 7.0, 14.0, 20.0, and
25.0 wt%) heat-treated at 800 oC. To calculate weight
changes, the degree of weight changes (%) was defined as follows:
Weight changes
(%) = (m1 -
m2) / m1 × 100
where m1 and m2 were
weights of specimens before and after immersing in the acidic solution
[20], respectively. Changes in the density and weight of specimens
with increasing ZnS content were not affected by acid treatment. The change in
weight before and after acid immersion was very small, making it
difficult to determine the exact chemical durability of
the specimens. Thus, the change in chemical durability of the specimen due to
weight gain could not be evidently explained.
Photocatalytic activities of acid treated and non-acid treated
ceramic nanocomposites with/without the addition of ZnS
nanoparticle were examined based on the decomposition degree (C/C0)
of MO as a photodeg- radation target
under UV light. Prepared specimens were irradiated with UV light having a broad
emission spectrum of 315-400 nm. The maximum illumination was yielded at
352 nm.
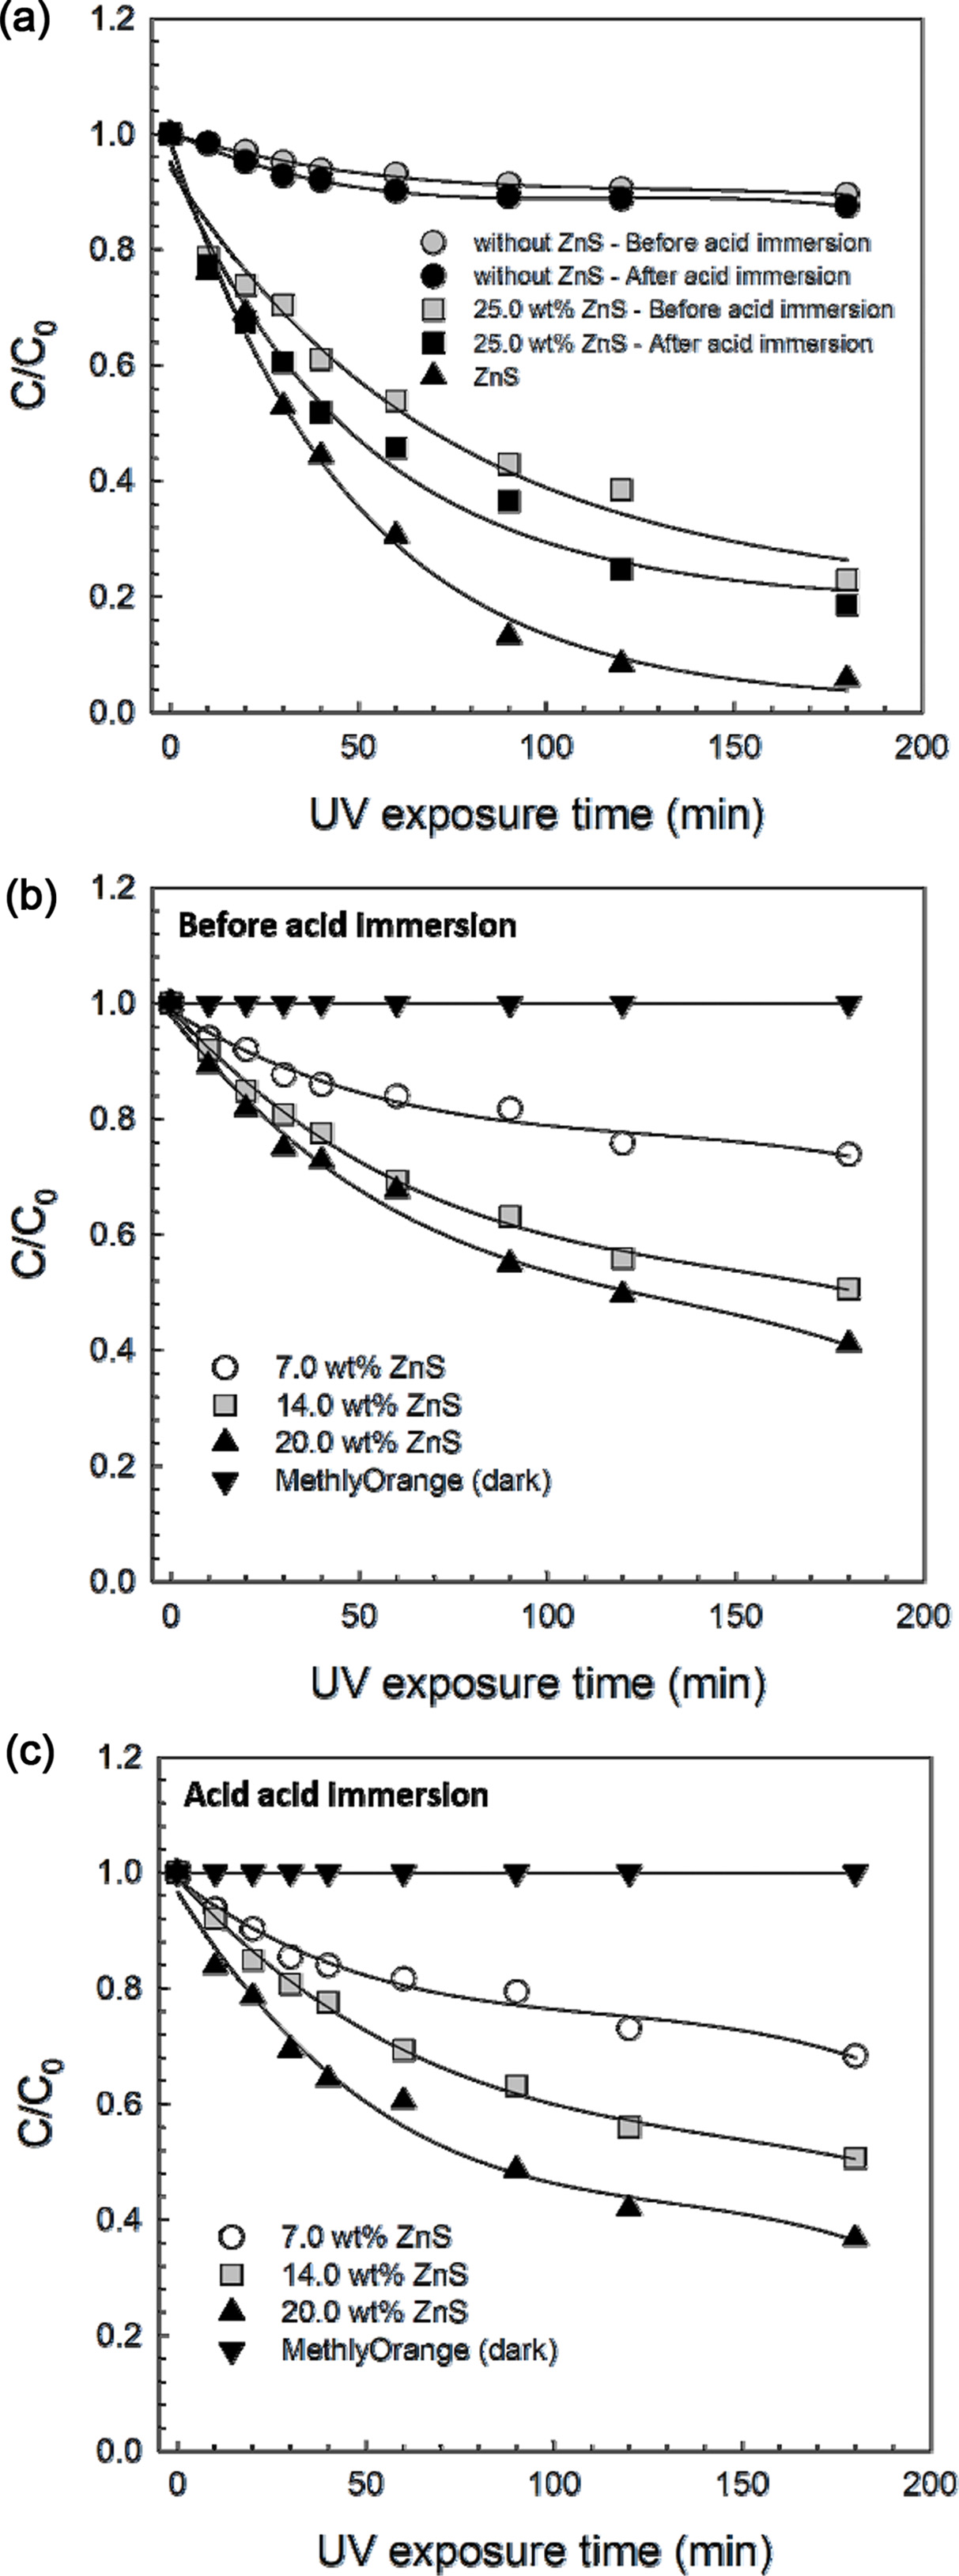
Fig. 5 shows the photocatalytic degradability of MO in
acid treated and non-acid treated ceramic nanocom- posites with/without adding ZnS nanoparticle
as a function of UV irradiation time. The variation in MO photocatalytic
degradation was visibly observed with ZnS nanoparticles and ceramic
nanocomposites added ZnS nanoparticle contents although the photocatalytic
degradability of MO on ZnS nanoparticle was superior to ceramic nanocomposites
containing ZnS (Fig. 5a). The degradation by UV irradiation also confirmed that
MO decomposition increased with increasing ZnS content in all cases acid
treated ceramic ZnS nanocom- posites
(Fig. 5b) and non-acid treated ceramic ZnS nanocomposites (Fig. 5c). From the
results, we found that the photocatalytic decomposition (C/C0) of MO
in ceramics nanocomposites added with 20.0 and 25.0 wt% ZnS were about 0.410
and 0.229 before acid treatment, 0.367 and 0.185 after acid treatment,
respec- tively. For acid treated
ceramic ZnS nanocomposites, the reason why photocatalytic decomposition of the
MO was slightly superior was found to be due to difference in the decomposition
of the MO because pores and specific surface areas were generated after acid
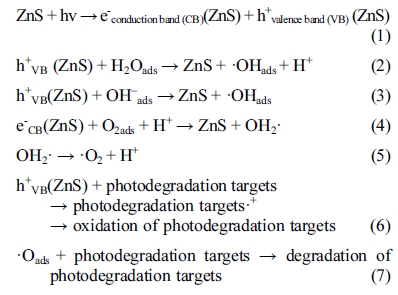
treatment of ceramic nanocomposites. The photo- catalytic mechanism can be explained as
follows. The positive holes and electrons generated by UV light on the
ZnS are attributed to the hydroxyl radicals formation. The
photocatalytic reaction between the electrons and the H2Oads
forms ·OHads, OH-ads, and HO2· as
the hydroxyl species. The OH formed by electrons is shown by the following Eq.
(1)-(7). Then, photo- degradation
targets are degraded by the attack of direct hole and hydroxyl species [21,
22].
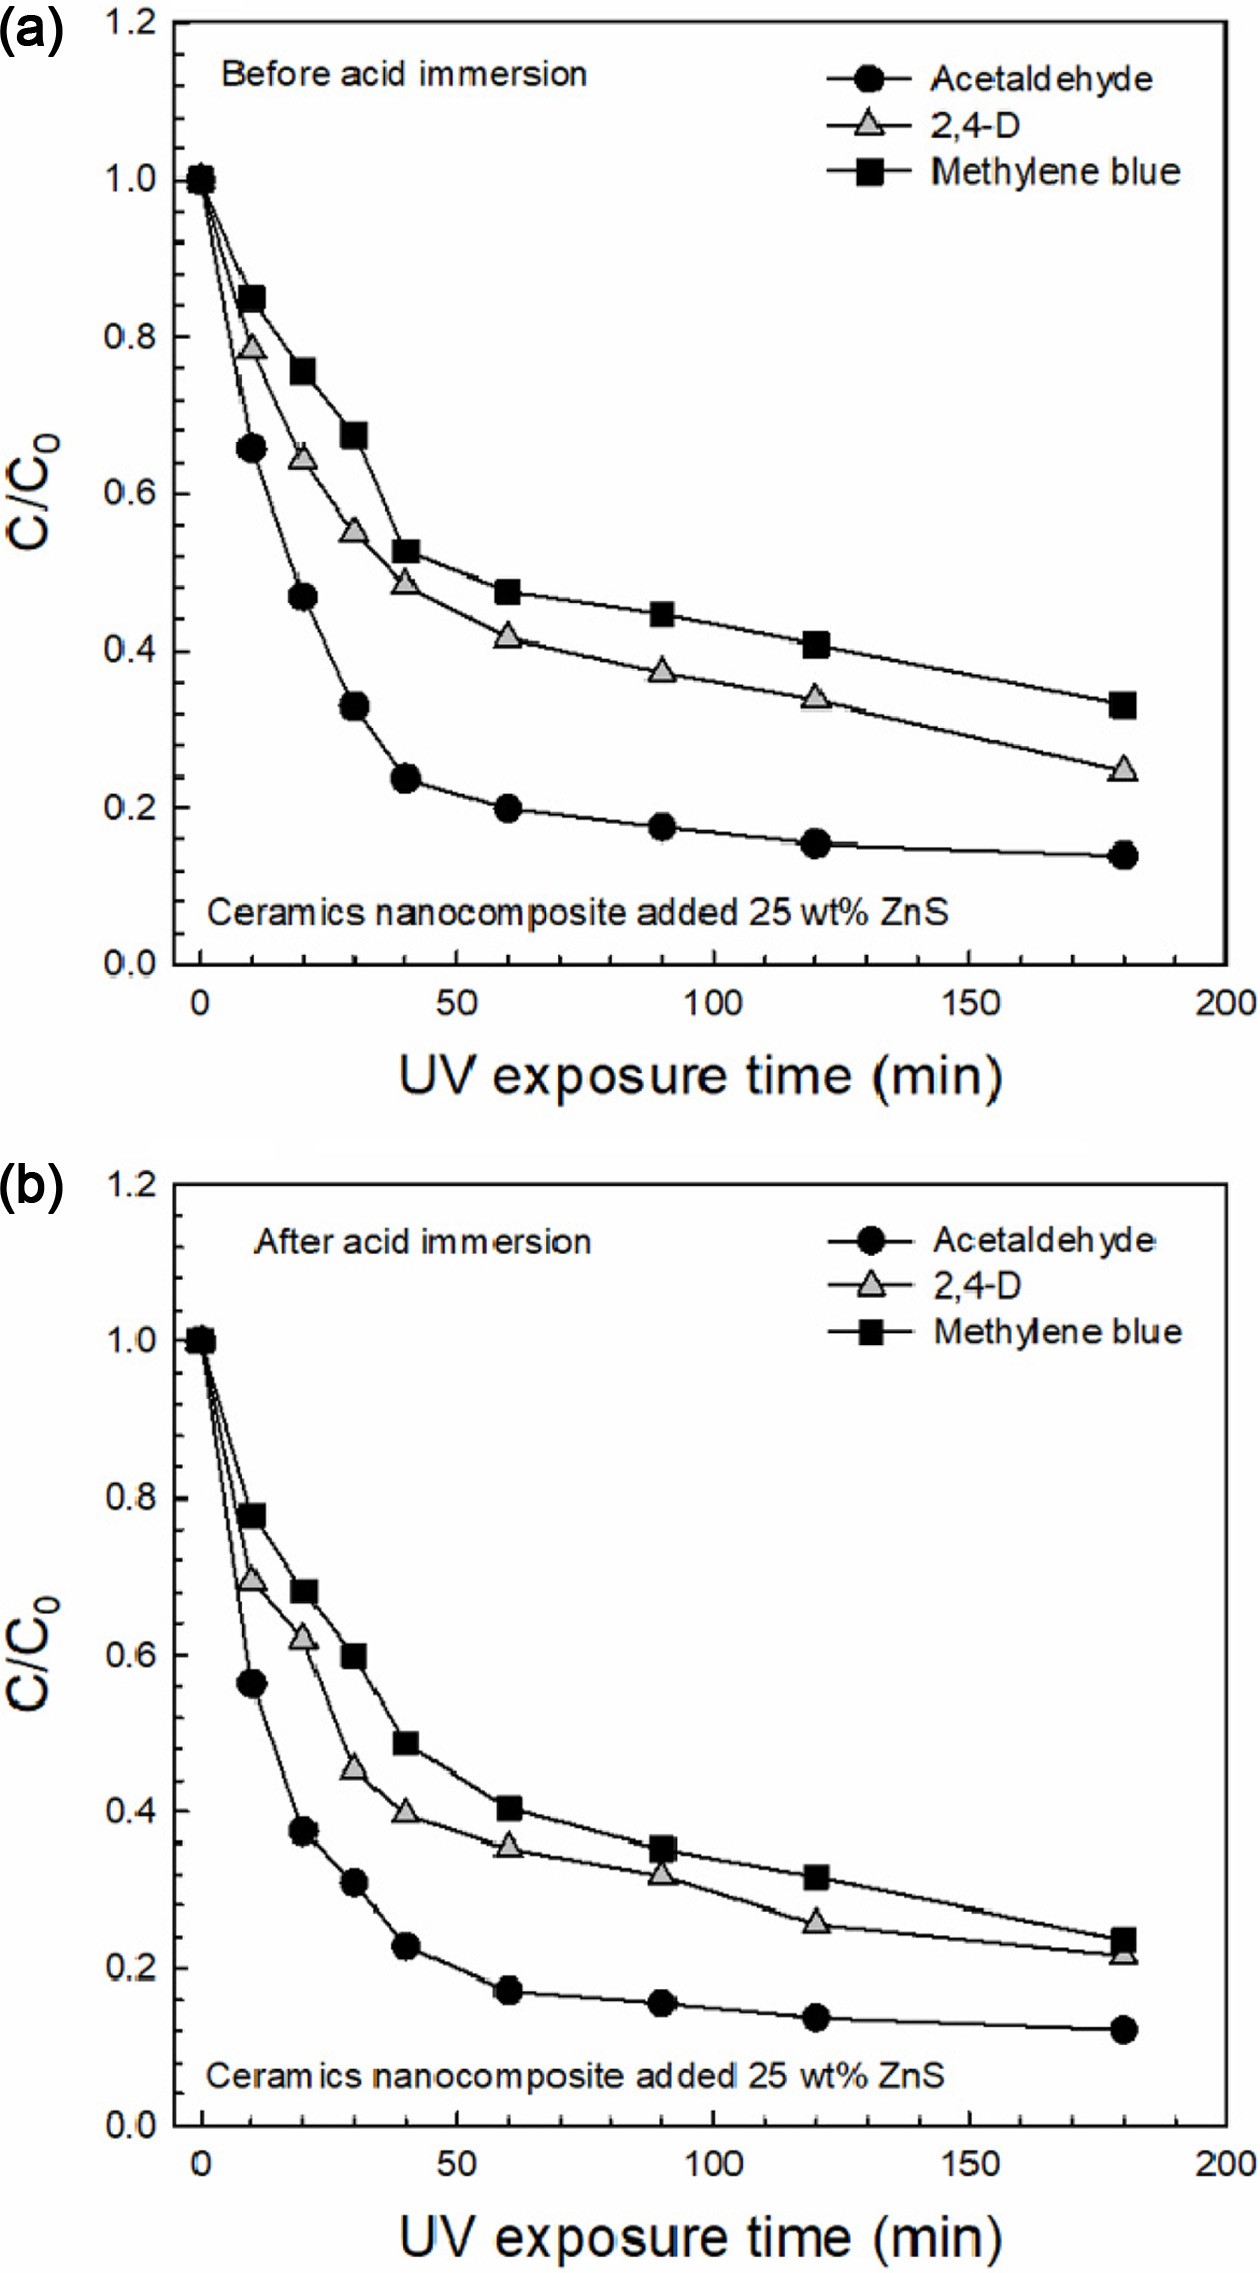
The photocatalytic decomposition of ATA, 2,4-D and MB in
acid treated and non-acid treated ceramic nanocomposites added 25.0 wt% ZnS
as a function of UV irradiation time is shown in Fig. 6. It was
confirmed that the C/C0 significantly decreased with
UV irradiation time. When compared to non-acid and acid treated specimens, the
effect of photocatalytic activity of acid treated specimens was found to be
higher than that without acid treatment. To further compare the
decomposition efficiency of photodegra- dation targets, we investigated the
pseudo-first order kinetic model. The kinetic constant was calculated using a
pseudo-first-order equation [Eq. (8)] and a simplified version of the Lagergren
equation [Eq. (9)]. Lagergren [23] has proposed a rate equation for the
sorption of a solute. It was established based on the adsorption capacity. The
Lagergren equation is the most generally used rate equation in sorption. This
kinetic model is expressed as follows:
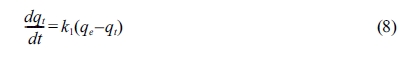
Integrating the above equation for the boundary conditions
t = 0 to t = t and qt = qt
gives:

The kinetic constant k1 (min-1) was
determined by plotting ln(qe - qt)
versus t or ln(qe - qt)/qe
versus t. From these results, the correlation coefficients (R2)
of the pseudo-first-order model for the linear plots of prepared ceramics
nanocomposite were very close to 1. Results indicated that the photocatalytic
degradation kinetics could be effectively explained by this pseudo-first-order
model. All experimental data had similar R2 values
(0.986–0.996), indicating that the typical behavior of a
pseudo-first order model perfectly follows a straight line. In addition, k1
values of the acid treated ceramics nanocomposite added with 25.0 wt% ZnS
for MO, ATA, 2,4-D, and MB were 0.139 min-1, 0.162 min-1,
0.148 min-1, and 0.134 min-1, respectively.
These results demonstrate that the ceramic nanocomposites produced
can be applied to a number of different environ- ments and chemical engineering
fields substantially.
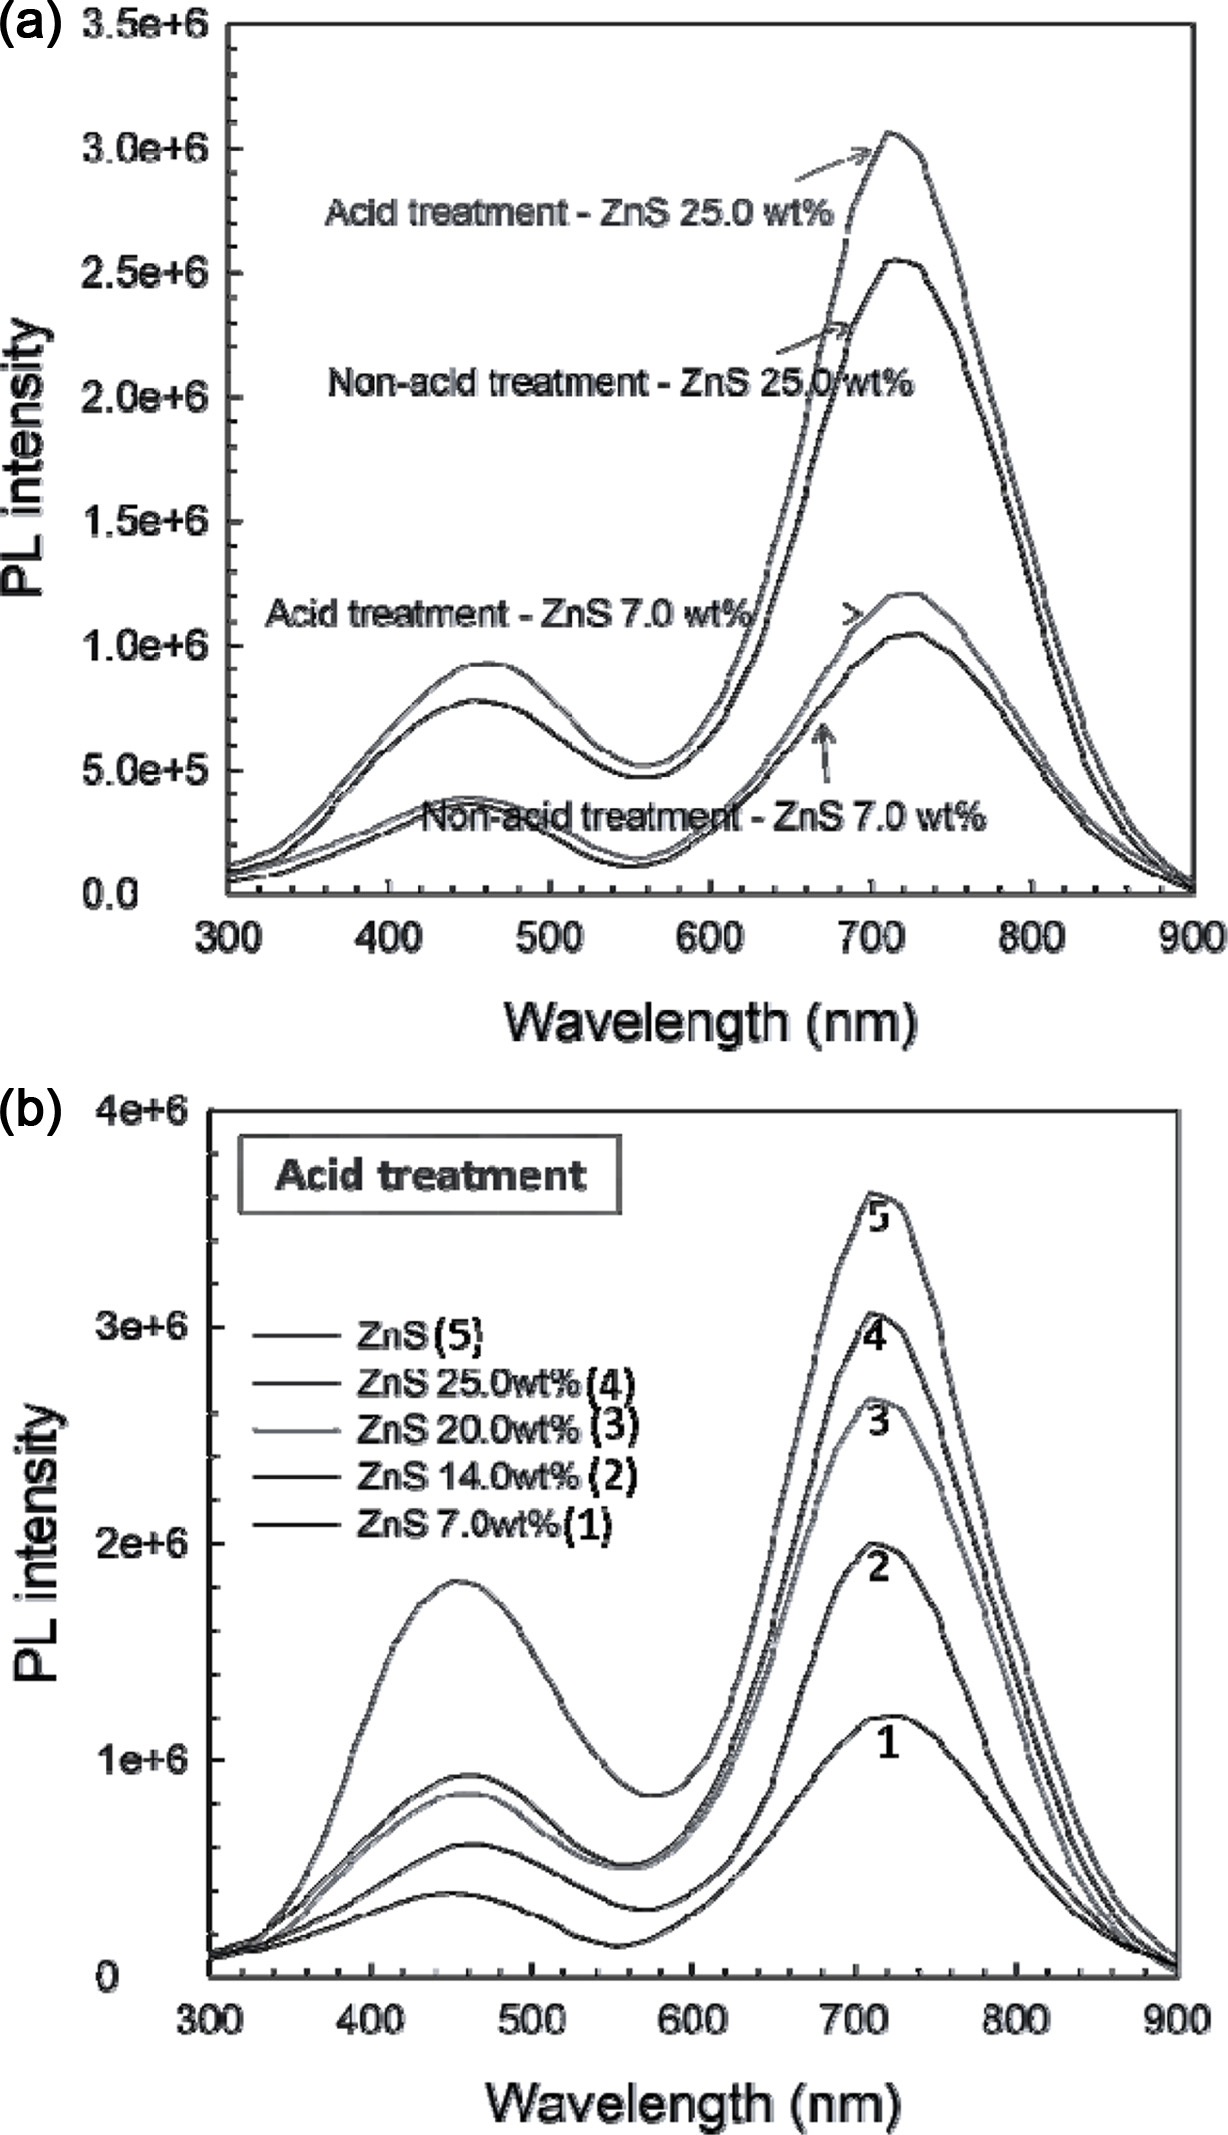
Fig. 7 represents the photoluminescence (PL) spectra of
ceramic nanocomposites (before and after acid treatment) with increasing ZnS
nanoparticle content. As shown in Fig. 7a, when compared with the PL spectra
intensity of acid and non-acid treated ceramic nanocomposites added 7.0 and
25.0 wt% ZnS nano- particles, the
PL spectra intensity was higher for nanocomposites after acid treatment.
Results showed a significant increase in photoactivity after acid
treatment. In addition, the PL spectra of acid-treated ceramic
nanocomposites manufactured with increasing content of ZnS increased in
intensity at 720.0 nm as the specific peak of ZnS (Fig. 7b). The reason is
judged that the intensity of the specific peak was increased because the pores
and specific surface of the prepared ceramic ZnS nanocomposite are increased by
the acid treatment. From the results, it can be found that the photocatalytic
activity for photodegradation targets was increased. From these results, it
could be verified that the photocatalytic activity of ceramic nanocomposites is
determined to be nanomaterials with the utility and benefits of these ZnS
nanoparticles.
|
Fig. 1 X-ray diffraction patterns of ceramic ZnS nanocomposites with/without acid treatment. |
|
Fig. 2 FE-SEM images EDS analyses of ceramic nanocomposites added ZnS nanoparticles (Before acid immersion): (a) 7 wt%, (b) 14 wt%, (c) 20 wt%, (d) 25 wt%, (e) 14 wt% EDS, and (f) 25 wt% EDS. |
|
Fig. 3 FE-SEM images EDS analyses of ceramic nanocomposites added ZnS nanoparticles (After acid immersion): (a) 7 wt%, (b) 14 wt%, (c) 20 wt%, (d) 25 wt%, (e) 14 wt% EDS, and (f) 25 wt% EDS. |

|
Fig. 4 Physical properties of ceramics nanocomposites with added ZnS nanoparticles contents (0, 7, 14, 20, and 25 wt% ZnS contents); before acid immersion and after acid immersion. (a) Compressive strength (MPa) of the prepared ceramics nanocomposites. (b) Bending strength (MPa) of the prepared ceramics nanocomposites. (c) Vickers hardness (MPa) of the prepared ceramics nanocomposites. |
|
Fig. 5 Photocatalytic degradation and kinetic linear simulation of methyl orange (MO) under UV irradiation. (a) Photocatalytic degradation and kinetic linear simulation of MO for ceramic nanocomposites with/without the addition of ZnS nanoparticles and acid treatment. (b) Photocatalytic degradation and kinetic linear simulation of MO for ceramic ZnS nanocomposites prepared with ZnS content before acid immersion. (c) Photocatalytic degradation and kinetic linear simulation of MO for ceramic ZnS nanocomposites prepared with ZnS content after acid immersion. |
|
Fig. 6 Photocatalytic degradation of acetaldehyde (ATA), 2,4-dichlorophenoxyacetic acid (2,4-D), methylene blue (MB) in the ceramic nanocomposites added 25 wt% ZnS nanoparticles (a) Before acid immersion, (b) After acid immersion. |
|
Fig. 7 Photoluminescence (PL) spectra of the prepared ceramics nanocomposites. (a) PL spectra of the ceramic nanocomposites added 7 and 25 wt% ZnS with/without acid immersion. (b) PL spectra of the ceramic nanocomposites added ZnS nanoparticles; 0, 7, 14, 20, and 25 wt% (after acid immersion). |
In this study, ceramic ZnS nanocomposites were
manufactured using fly ash, waste glass powder, and ZnS nanoparticles.
According to FE-SEM analysis, for ceramic ZnS nanocomposites with ZnS content
of 20.0 and 25.0 wt%, the alteration of irregular-type ZnS nanoparticles
in the nanocomposite matrix was not different between before and after acid
treatment. It showed an adequate improvement in chemical
durability with good enough mechanical properties under all
conditions. When the ZnS content was increased from 0 to 25.0 wt%, the
compressive and bending strength were increased by 150.8 MPa and
65.8 MPa (after immersing in acidic solution),
respectively. The analysis results indicated that the addition
of ZnS nanoparticles could advance the mechanical properties of ceramic
nanocomposites. The physical properties of ceramic nanocomposites were improved
because the addition of ZnS nanoparticles resulted in specific
matrix-streng-thening arrangements
formed between components. The photocatalytic degradation of ZnS-added ceramic
nanocomposites was investigated using MO, ATA, 2,4-D, and MB as photodegradation
targets under UV irradiation. All ceramic nanocomposites in which ZnS nanoparticles
were added showed photocatalytic activity under UV
light irradiation.
This work was supported by the Basic Science Research
Program through the National Research Foundation of Korea (NRF) funded by the
Ministry of Education (2019R1I1A3A01061508).
- 1. G.J. Lee and J.J. Wu, Powder Technol. 318 (2017) 8-22.
-

- 2. J.S. Hu, L.L. Ren, Y.G. Guo, H.P. Liang, A.M. Cao, L.J. Wan, and C.L. Bai, Angew. Chem. Int. Ed. 44 (2005) 1269-1273.
-
- 3. P. D’Amico, A. Calzolari, A. Ruini, and A. Catellani, Sci. Rep. 7 (2017) 16805-16812.
-
- 4. V. Dimitrova and J. Tate, Thin Solid Films 365 (2000) 134-138.
-
- 5. H. Chander, V. Shanker, D. Haranath, S. Dudeja, and P. Sharma, Mater. Res. Bull. 38 (2003) 279-288.
-
- 6. M. Bredol and M. Kaczmarek, J. Phys. Chem. A 114 (2010) 3950-3955.
-
- 7. M. Bredol, M. Kaczmarek, and H.D. Wiemhöfer, J. Power Sources 255 (2014) 260-265.
-
- 8. J.P. Borah and K.C. Sarma, Acta. Phys. Pol. A 114 (2008) 713-719.
-
- 9. X. Xu, S. Li, J. Chen, S. Cai, Z. Long, and X. Fang, Adv. Funct. Mater. 28 (2018) 1802029.
-
- 10. I. Altın, I. Polat, E. Bacaksız, and M. Sokmen, Appl. Surf. Sci. 258 (2012) 4861-4865.
-
- 11. L. Kashinath, K. Namratha, and K. Byrappa, J. Alloys Compd. 695 (2016) 799-809.
-
- 12. E.G. Barojas, E.S. Mora, C.C. Abriz, E.F. Rodríguez, and R.S. González, J. Supercond. Nov. Magn. 26 (2013) 2337-2340.
-
- 13. K.K Senapati, C. Borgohain, and P. Phukan, Catal. Sci. Technol. 2 (2012) 2361-2366.
-
- 14. Z. Zhang, C. Fang, X. Bing, and Y. Lei, Materials 11 (2018) 512-519.
-
- 15. E.H. Song, B.H. Kang, T.Y. Kim, H.J. Lee, Y.W. Park, Y.C. Kim, and B.K. Ju, ACS Appl. Mater. Interfaces 7 (2015) 4778-4783.
-
- 16. C.Y. Lai, A. Groth, S. Gray, and M. Duke, Water Res. 57 (2014) 56-66.
-
- 17. S.D Yoon and Y.H Yun, J. Ceram. Process. Res. 12 (2011) 361-364
- 18. J.Y. Park, D.Y. Choi, K.J. Hwang, S.J. Park, S.D. Yoon, Y.H. Yun, X.G. Zhao, H.B. Gu, and I.H. Lee, J. Nanosci. Nanotechnol. 15 (2015) 5224-5227.
-
- 19. Y.H. Yun, K.J. Hwang, Y.J. Wee, S.D. Yoon, J. Appl. Polym. Sci. 120 (2011) 1850-1858.
-
- 20. Y.H. Yun, C.H. Yoon, J.S. Oh, S.B. Kim, B.A. Kang, K.S. Hwang, J. Mater. Sci. 37 (2002) 3211-3215.
-
- 21. M.R. Hoffmann, S.T. Martin, W. Choi, D.W. Bahnemann, Chem. Rev. 95 (1995) 69-85.
-
- 22. H.R. Pouretedal , H. Beigy, M.H. Keshavarz, Environ. Technol. 31 (2010) 1183-1190
-
- 23. S. Lagergren, Handlingar 24 (1989) 1-39.
 This Article
-
2020; 21(4): 479-487
Published on Aug 30, 2020
- 10.36410/jcpr.2020.21.4.479
- Received on Feb 24, 2020
- Revised on Apr 24, 2020
- Accepted on May 4, 2020
Services
- Abstract
introduction
experimental
results and discussion
conclusions
- Acknowledgements
- References
- Full Text PDF
Shared
Correspondence to
- Yeon-Hum Yun
-
cDepartment of Energy & Resources Engineering, Chonnam National University, Gwangju 61186, South Korea
dGeoconvergence Research Center, Chonnam National University, Gwangju 61186, South Korea
Tel : +82-61-659-7297
Fax: +82-61-659-7299 - E-mail: yhhumm@empas.com
Clean-Energy Research Institute(CRI), Hanyang University, 222, Wangsimni-ro, Seongdong-gu, Seoul, 04763, Korea
E-mail: jcpr@hanyang.ac.kr