


- Fabrication of ZrB2/SiC/WC composites via spark plasma sintering and enhancement of oxidation resistance
Jae-Seok Choia,**, Jung-Hun Kimb,**, Jae Uk Hura, Sung-Churl Choia and Gye-Seok Ana,*
aDivision of Materials Science and Engineering, Hanyang University, 222 Wangsimni-ro, Seongdong-gu, Seoul 04763, Korea
bCeramicware Technology Center, Korea Institute of Ceramic Engineering & Technology, 3321 Gyeongchung-daero, Sindun-myeon, Icheon 17303, Korea
To prevent the oxidation of
ultra-high-temperature ceramic zirconium diboride (ZrB2) at high
temperatures, this study fabricated sintered composites containing silicon
carbide and tungsten carbide, and examined the properties related to
high-temperature oxidation. Spark plasma sintering was employed for rapid
sintering, and a high-temperature torch test was conducted on samples to
determine their surface oxidation behaviour. The composites oxidised at high
temperature showed different surface oxidation behaviour according to the type
of carbide-based additive. Composites containing both carbides, which have
different oxidation mechanisms, exhibited better resistance to oxidation than
those containing a single carbide.
Keywords: ZrB2, SiC, WC, Spark plasma sintering, Oxidation resistance
In general, ceramic materials tend to melt or decompose at
temperatures higher than 3,000 °C. However, ultra-high-temperature
ceramics (UHTCs) are known for their melting points above 3,000 °C, high
chemical stability, and excellent resistance to oxidation. UHTCs are group IV,
V, and VI transition metals such as boride, carbide, nitride, including TaB2,
HfC, and BN [1, 2]. The term UHTC was proposed in 2004 during a joint
workshop between the National Science Foundation of
the United States and the Air Force Office of Science Research.
UHTCs have been extensively studied as materials for
extreme environments such as space shuttles, transonic
airliners, and rocket propulsion systems [3].
Zirconium diboride (ZrB2), a covalent material
with hexagonal crystal structure, is a representative UHTC along with TiB2
and HfB2. ZrB2 has a melting point higher than
3,200 °C, Young’s modulus of 490 GPa, and hardness of at least 20 GPa. It
also offers excellent thermal and electrical conductivity. Among UHTCs, ZrB2
has relatively low density and excellent strength at high temperatures,
making it an ideal material for aerospace and next-generation energy devices
[4, 5]. Despite these advantages, the material has limited applications in
extreme environments owing to its poor durability
against surface oxidation at high temperatures. When
oxidised in air, oxide is produced in two phases on the surface of ZrB2,
the states of which change with temperature. First, a B2O3
layer has been observed on the surface at temperatures below 1,000 °C,
with a porous ZrO2 layer beneath it; the pores are filled with B2O3.
When the temperature increases further, the B2O3 glass
layer is liquefied and vaporises at approximately 1,300 °C, and the space
that was occupied B2O3 becomes a path for oxygen from the
atmosphere to enter, which accelerates the oxidation of ZrB2 [6-9].
The chemical equations describing this oxidation process are as follows.
2ZrB2 + 5O2
→ 2ZrO2 + 2B2O3
B2O3(l) → B2O3(g)
To prevent the above oxidation reactions, researchers are
studying oxidation-resistant ZrB2 composites, especially ZrB2-SiC
and ZrB2-WC. In the ZrB2-SiC composite, B2O3
binds with SiO2 to form a borosilicate layer which, in contrast to
pure ZrB2, prevents B2O3 from
becoming porous owing to volatilisation. However, B2O3
shifts to the surface when volatilised, and pulls SiO2 existing in
liquid phase to the surface layer. The surface becomes rich with SiO2,
and a layered structure rich in ZrO2 develops within the composite,
leading to separation of the borosilicate surface layer [10-17].
In the case of the ZrB2-WC composite, WC is
oxidised into WO3, and the particles experience
volumetric expansion during this process. The compressive stress acting between
the particles blocks the path of oxygen, thus interfering with the oxidation of
the composite [18-22]. The purpose of this study is to enhance
oxidation resistance by combining the two abovementioned
advantages, i.e., blocking the path of liquid-phase SiO2
due to volumetric expansion of WO3 oxidised from WC, and preventing
oxygen infiltration by the glass layer formed on the surface during the
oxidation of SiC composites. This study sintered ZrB2-SiC-WC and
compared its oxidation resistance to those of pure ZrB2, ZrB2-SiC,
and ZrB2-WC.
The materials used in the experiment were commercial powder
ZrB2 (99.5%, 1-2 µm, APS powder, Alfa Aesar), SiC
(99.8%, 1 µm, S.A. 11.5 m2/g beta-phase, Alfa Aesar),
and WC (99%, 2 µm, Sigma-Aldrich). Composites with
four different compositions were prepared using ZrB2 as a base. The
composites are referred to as Z, ZS, ZW, and ZSW according to their
compositions. The four batches are presented in Table 1. Powder samples from
each batch were placed in a Nalgene bottle with methanol and subjected to ball
milling for 24 h using WC media. The mixed powders were collected via rotary
expansion and dried for 24 h in a vacuum dryer, followed by
sieving using a 100-mesh sieve. The powders were then
subjected to spark plasma sintering. The furnace
had a vacuum atmosphere (under 2×10⁻² mmHg),
and the sintering temperature was raised at a rate of 100 °C/min.
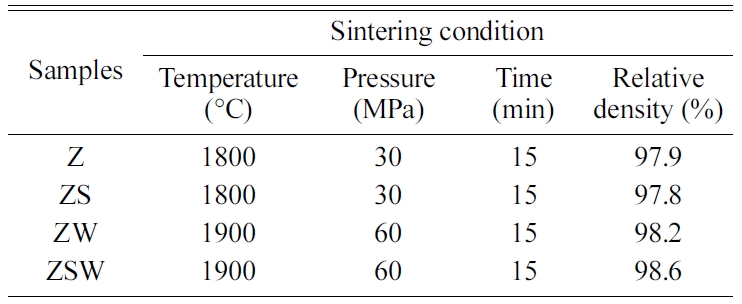
Sintering was performed for 15 min at 1,800 °C and 30 MPa for Z and ZS,
and for 15 min at 1,900 °C and 60 MPa for ZW and ZSW. The sintering
conditions for each composition are listed in Table 2. During sintering, carbon
paper was used to prevent reactions with the mould and punch, and to facilitate
separation. The sample surfaces were polished with sandpaper to remove any
traces of carbon paper after sintering. The sintered pellets were disc-type
with a diameter of 10 mm and thickness of 2 mm. The density of each pellet was
measured by Archimedes’ principle, and the relative density was obtained by
calculating the theoretical density based on the rule of mixtures. Torch
oxidation was performed to determine differences in oxidation
among pellets. The gases used in the experiment were propane
gas and oxygen gas. The gas flow rate was adjusted to maintain the flame
temperature, which was measured with a pyrometer, at 1,600 °C. The pellets
were placed on a refractory material to withstand flames at
high temperature, and a pellet-shaped holder was made to prevent the pellets
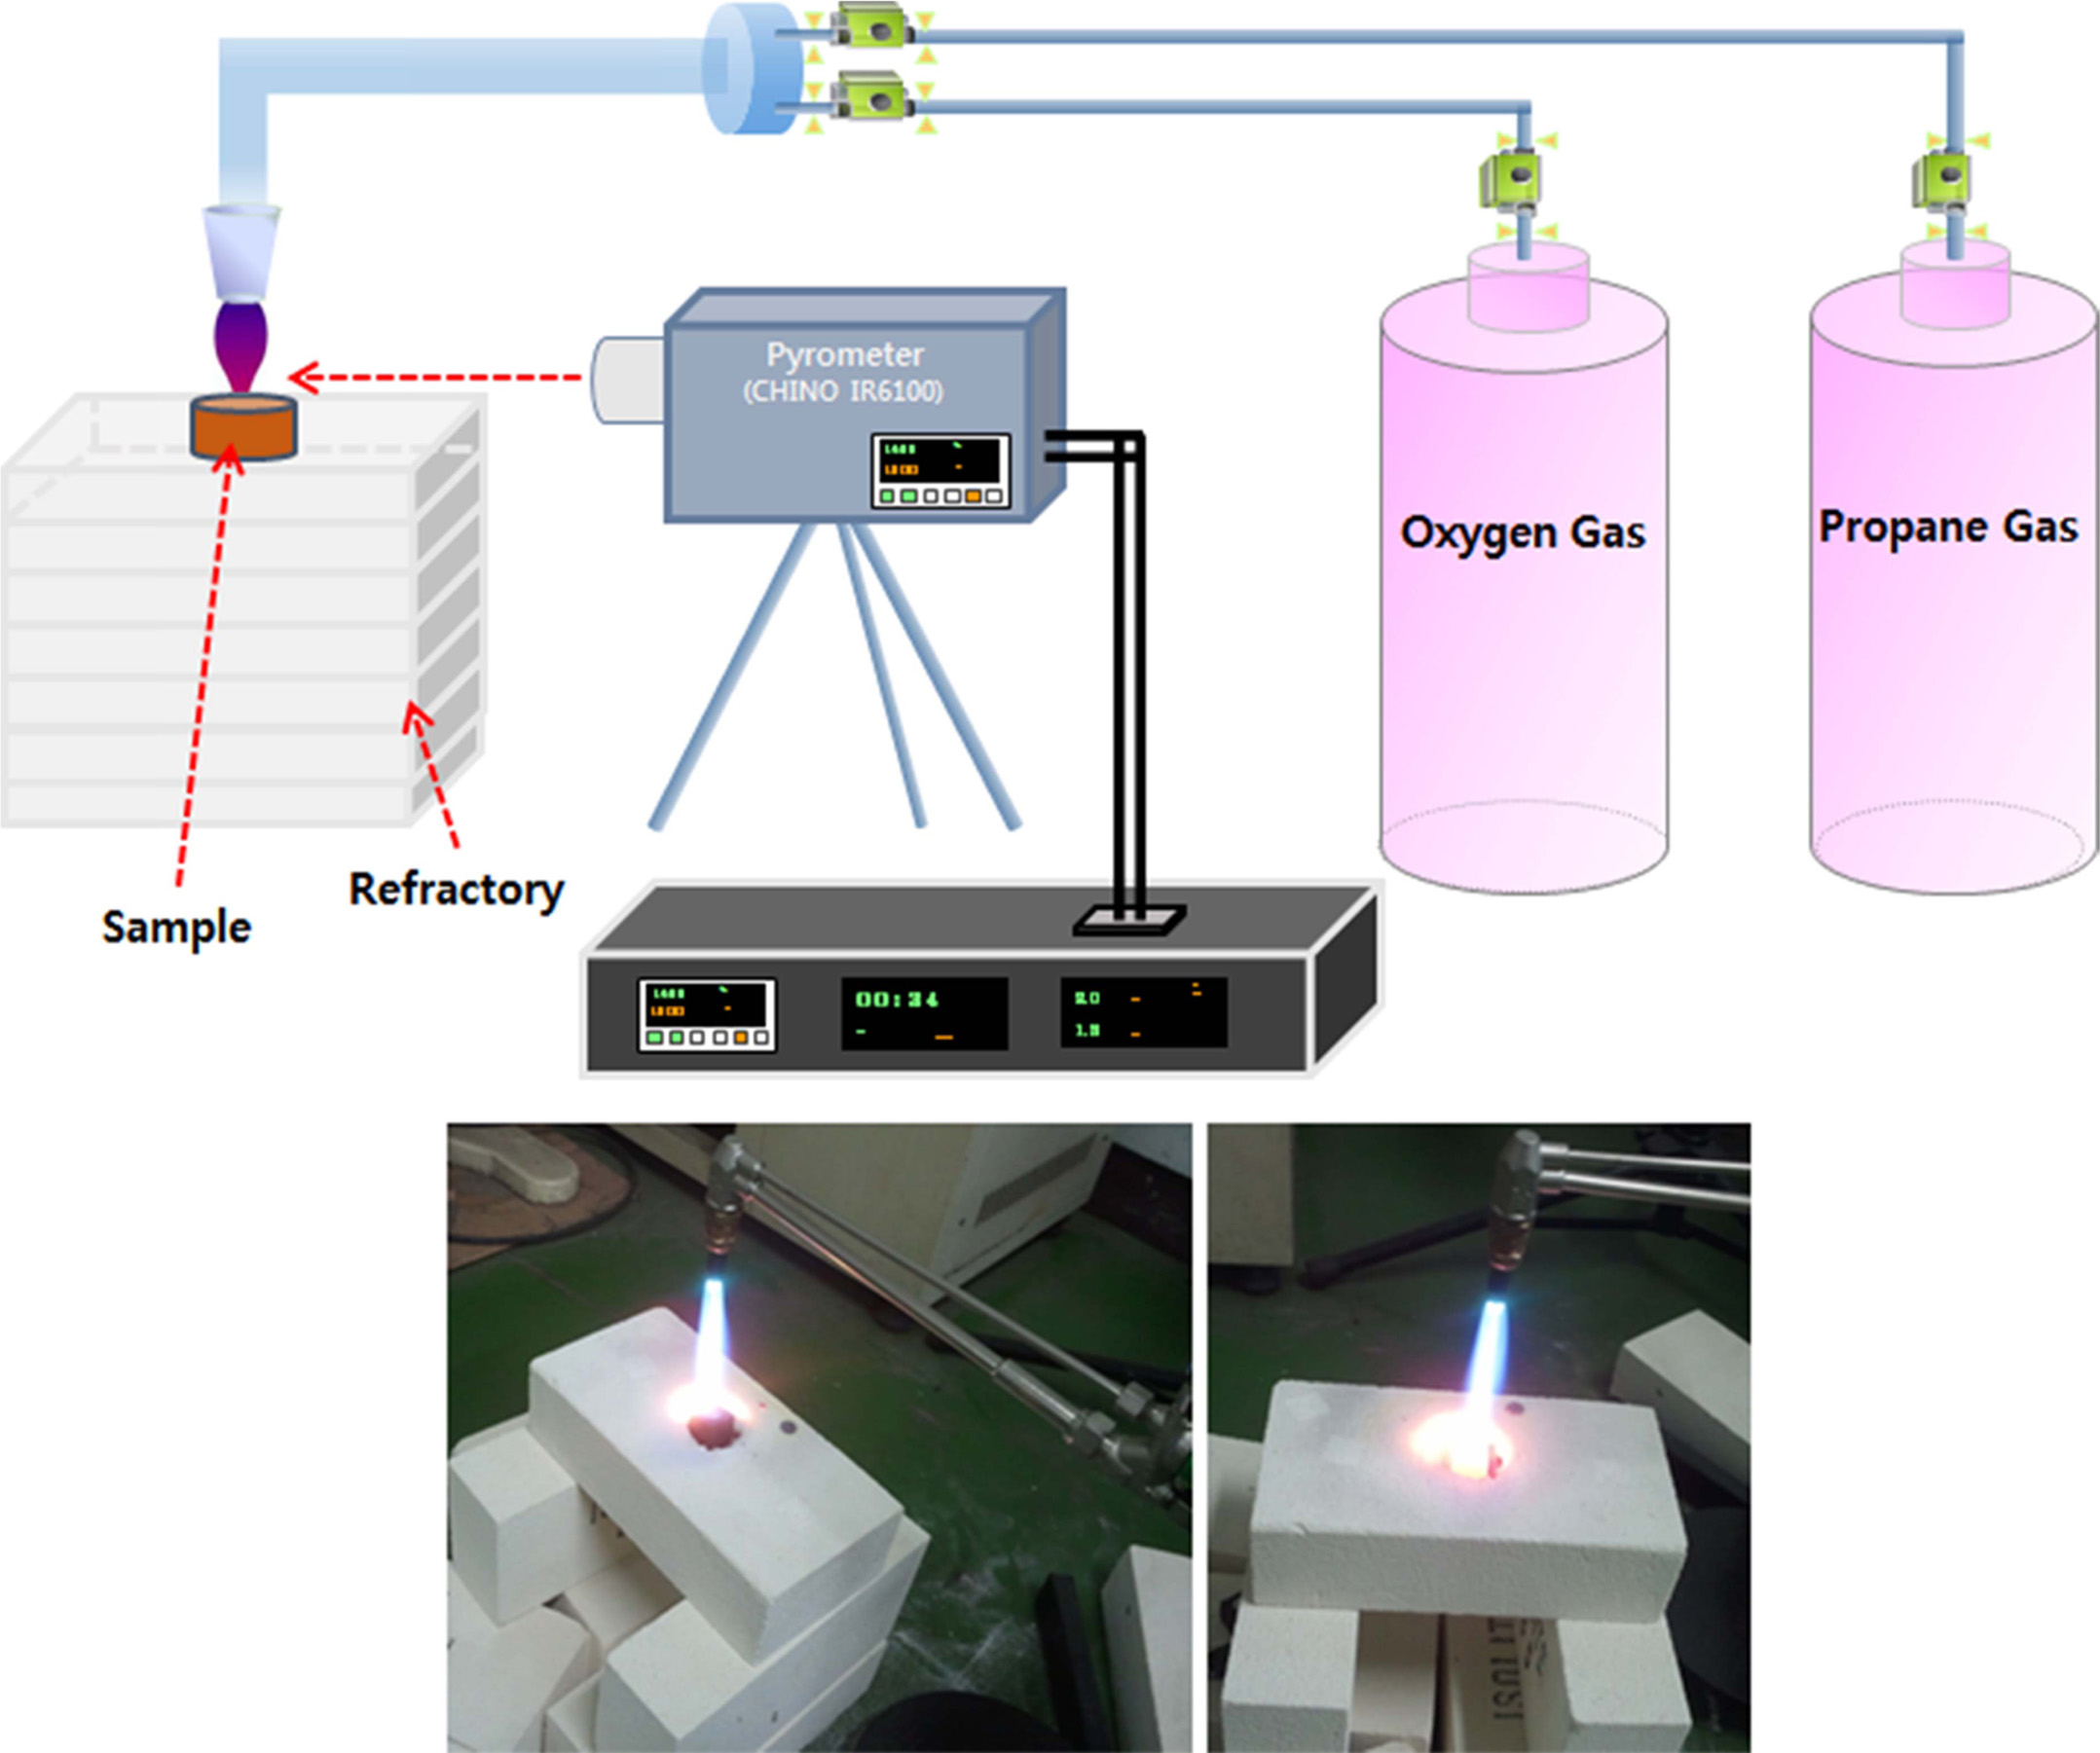
from moving about due to the strong flames. The experimental
setup for torch oxidation and a photograph of
the actual experiment are presented in Fig. 1. Thermal gravimetric
analysis (TGA; TA Instruments SDT Q600, USA) was conducted to
determine the changes in sample mass during oxidation at high temperatures
under atmospheric pressure. To analyse the phase of each pellet, X-ray
diffraction (XRD, Rigaku, Tokyo, Japan, using CuKa radiation) was used to scan
the samples at 2° per minute in the range of 2Ɵ = 20-80°. The
oxidation of composites was examined by applying
field-emission scanning electron microscopy (FE-SEM; JEOL JSM-6700, Japan) and
energy-dispersive spectroscopy (EDS; BRUKER AXS) to the cross-sections.
|
Fig. 1 Experimental setup for torch oxidation and photographs. |
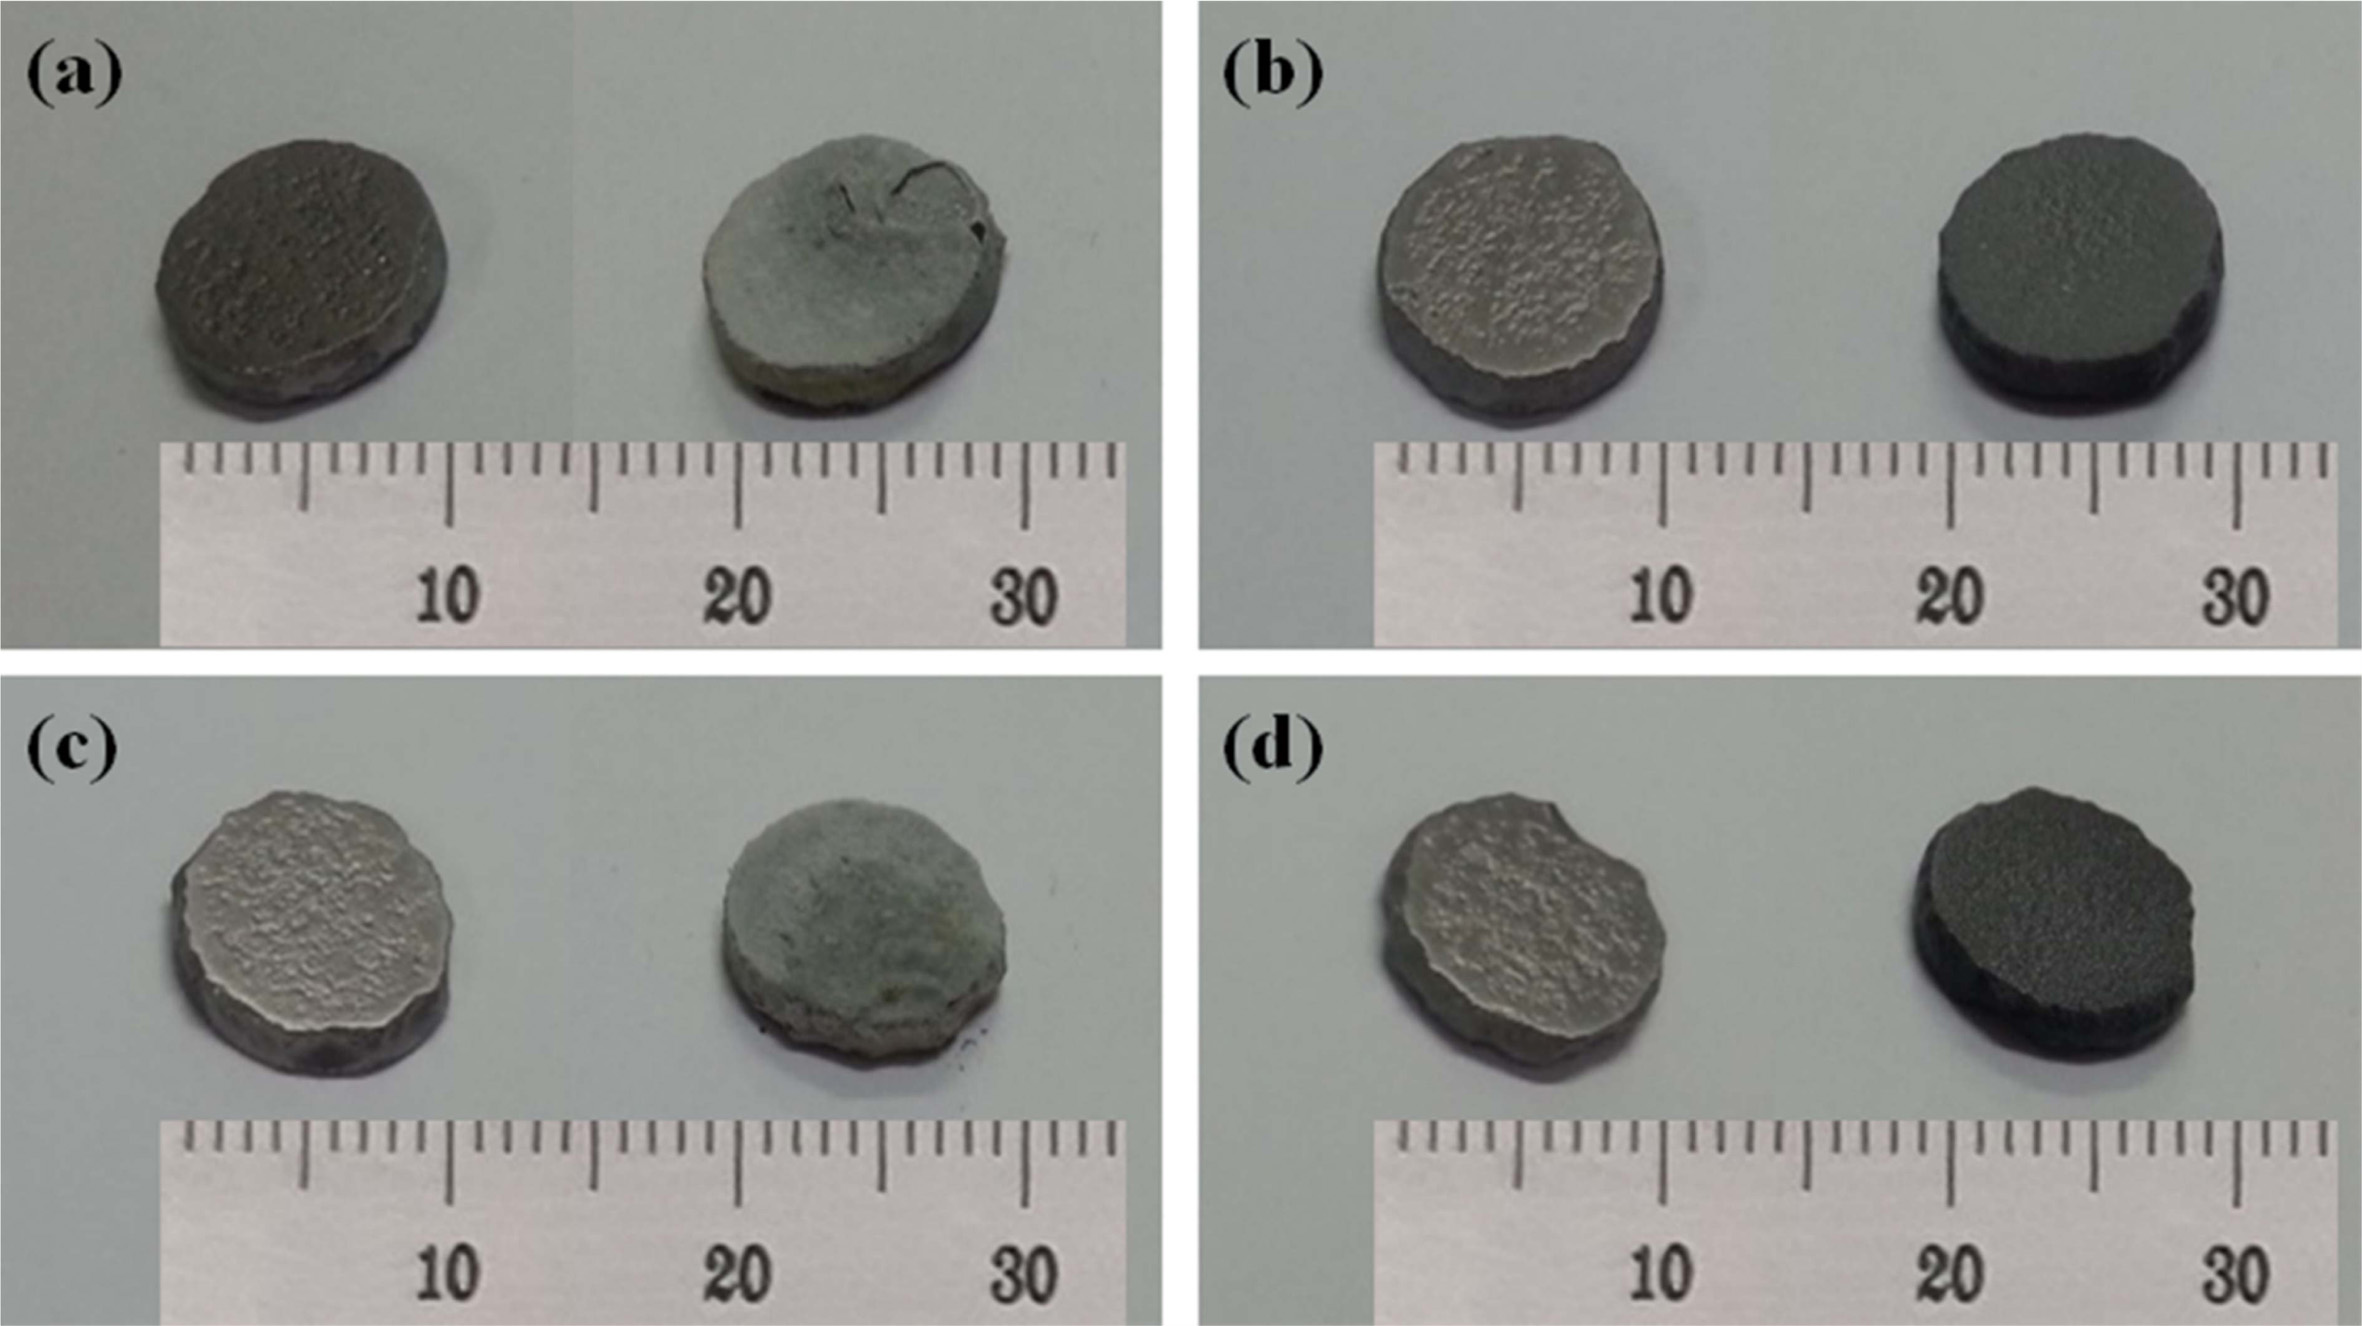
In Fig. 2, the photographs on the left and right were
taken before and after the torch oxidation experiment, respectively. The
surfaces of the sintered samples were polished. As such, the
surfaces before the torch oxidation experiment had a metallic
shine. Fig. 2(a) shows the sample with sintering of only ZrB2. The
sample on the right has a largely oxidised surface with ash-grey colour after
the torch oxidation experiment. Separation was observed
on the surface layer. Because of oxidation, only porous
ZrO2 remained on the surface layer; the layer
separation can be traced to the decrease in strength. Fig.
2(b) shows the ZrB2-SiC composite. The photograph,
taken after the torch oxidation experiment, shows that the sample has
lost its metallic shine but appears to have a shiny coating. SiC undergoes
oxidation to form SiO2, while ZrB2 forms B2O3,
thus resulting in borosilicate. Fig. 2(c) shows the ZrB2-WC
composite; the sample after the torch oxidation experiment has a surface
similar to that of Sample Z; however, the surface layer separation observed for
Sample Z did not occur. WC produces WO3 when oxidised, and WO3
is believed to have filled the space between the porous ZrO2 layers
in Sample Z. Fig. 2(d) shows the ZrB2-SiC-WC composite, which is
similar to Sample ZS in terms of surface and other properties.
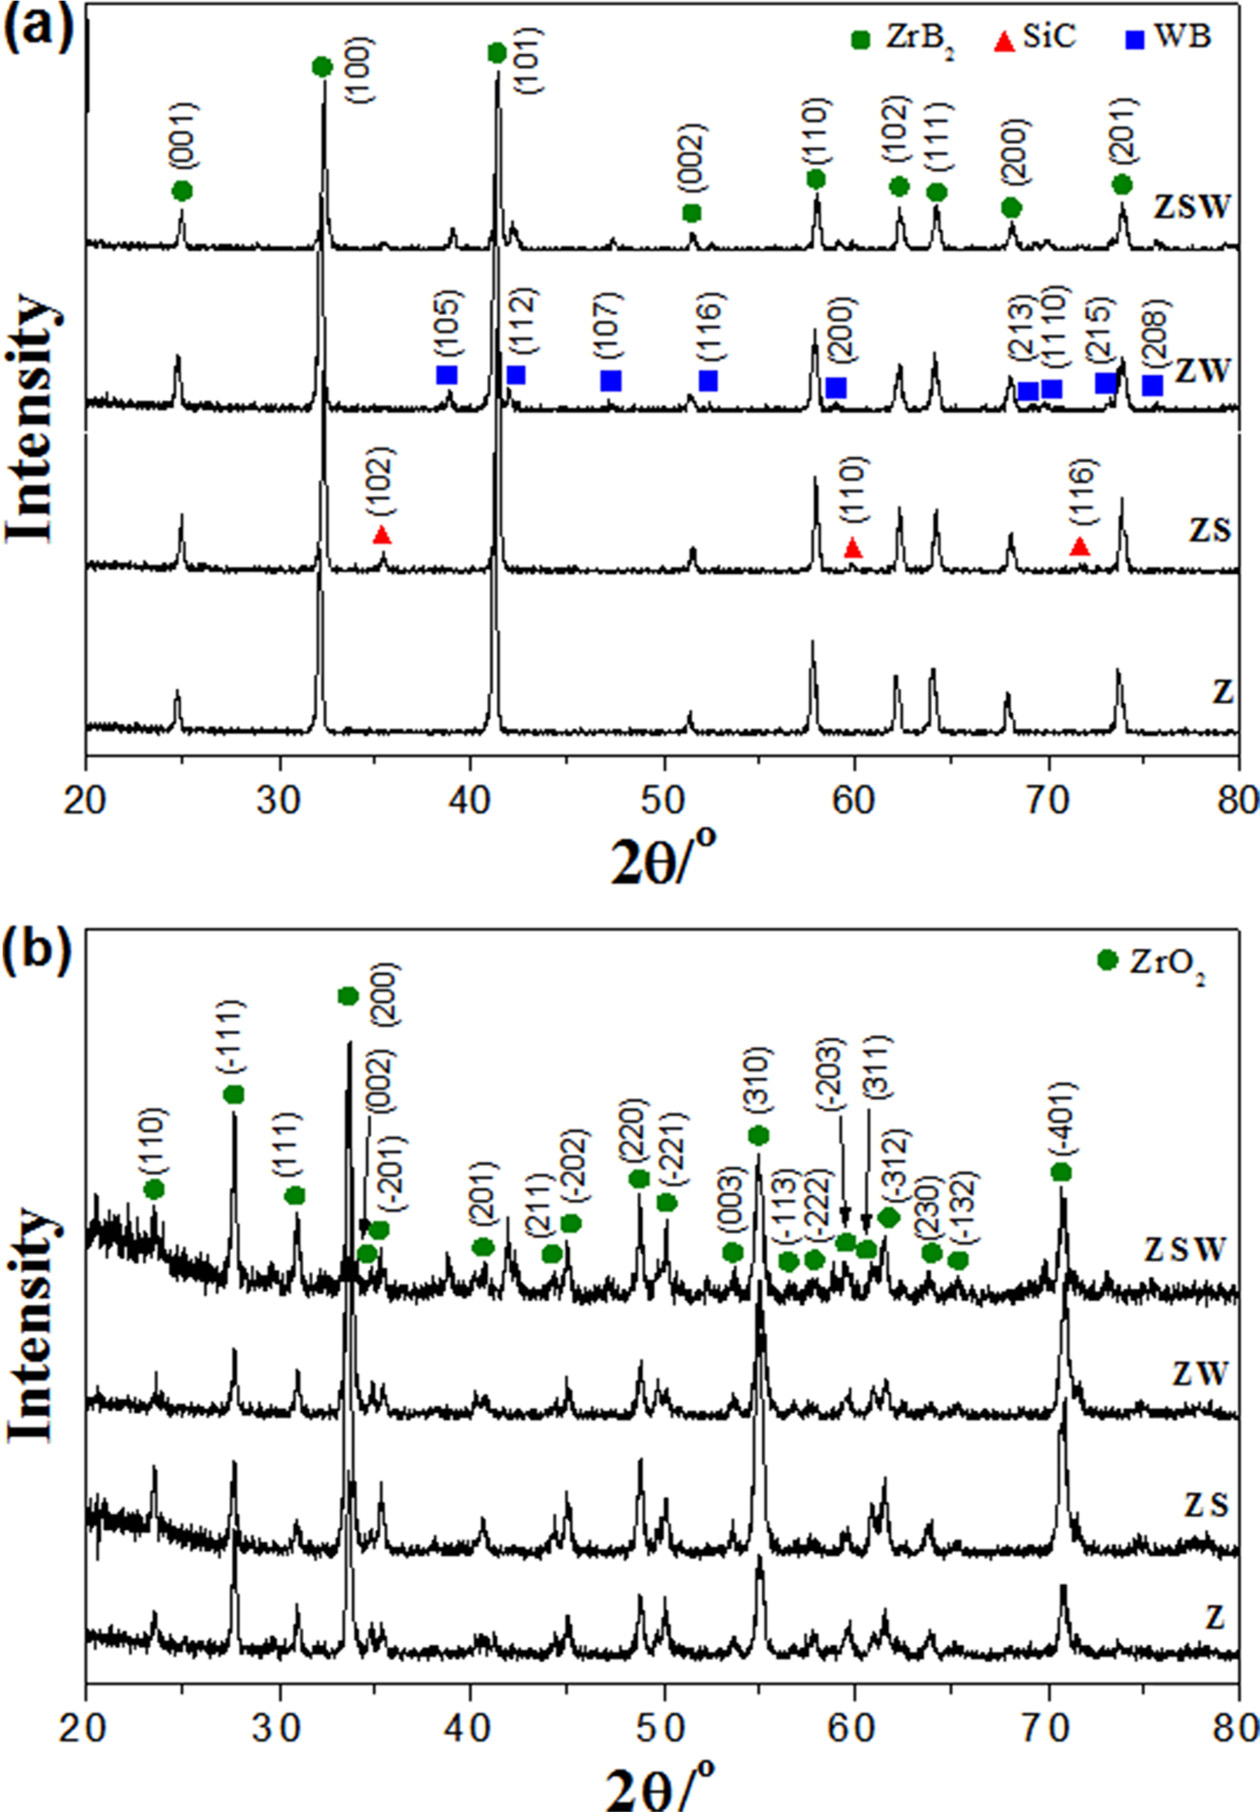
Fig. 3 shows XRD patterns of Z, ZS, ZW, and ZSW composites
before and after the torch oxidation experiment. In the XRD
patterns in Fig. 3(a), ZrB2, SiC, and WB peaks are marked with
circles, triangles, and squares, respectively. In all four XRD patterns, the
phases of ZrB2 can be determined. The composites share main ZrB2
peaks at 25.2, 32.6, 41.6, 51.7, 58.2, 62.5, 64.4,
68.3, and 74.0°, with each peak corresponding to (001),
(100), (101), (002), (110), (102), (111), (200), and (201) planes (JCPDS
#34-0423). The composites containing SiC had main peaks of 35.7, 60.1, and
72.0° corresponding to (102), (110), and (116) planes (JCPDS
#29-1131). The composites containing WC showed patterns of WB phase with peaks
at 39.3, 42.3, and 47.5° corresponding to (105), (112), and (107) planes (JCPDS
#35-0738). For the ZrB2-WC composite, a solid solution was formed
during sintering, and the excess WC reacted with ZrB2 to form WB
[19]. Fig. 3(b) shows the XRD patterns of four composites after the torch
oxidation experiment. ZrB2 was oxidised into ZrO2, and
peaks of ZrO2 crystal growth can be seen at 24.0, 28.1,
31.4, 34.2, 49.3, and 50.6°, which correspond to (110),
(-111), (111), (200), (220), and (-221) planes (JCPDS #37-1484). Since there
are many ZrO2 phases, i.e. not only for Z but also for ZS, ZW, and
ZSW, overlapping makes it difficult to detect peaks of the WO3 phase
at 23.2 and 33.0°.
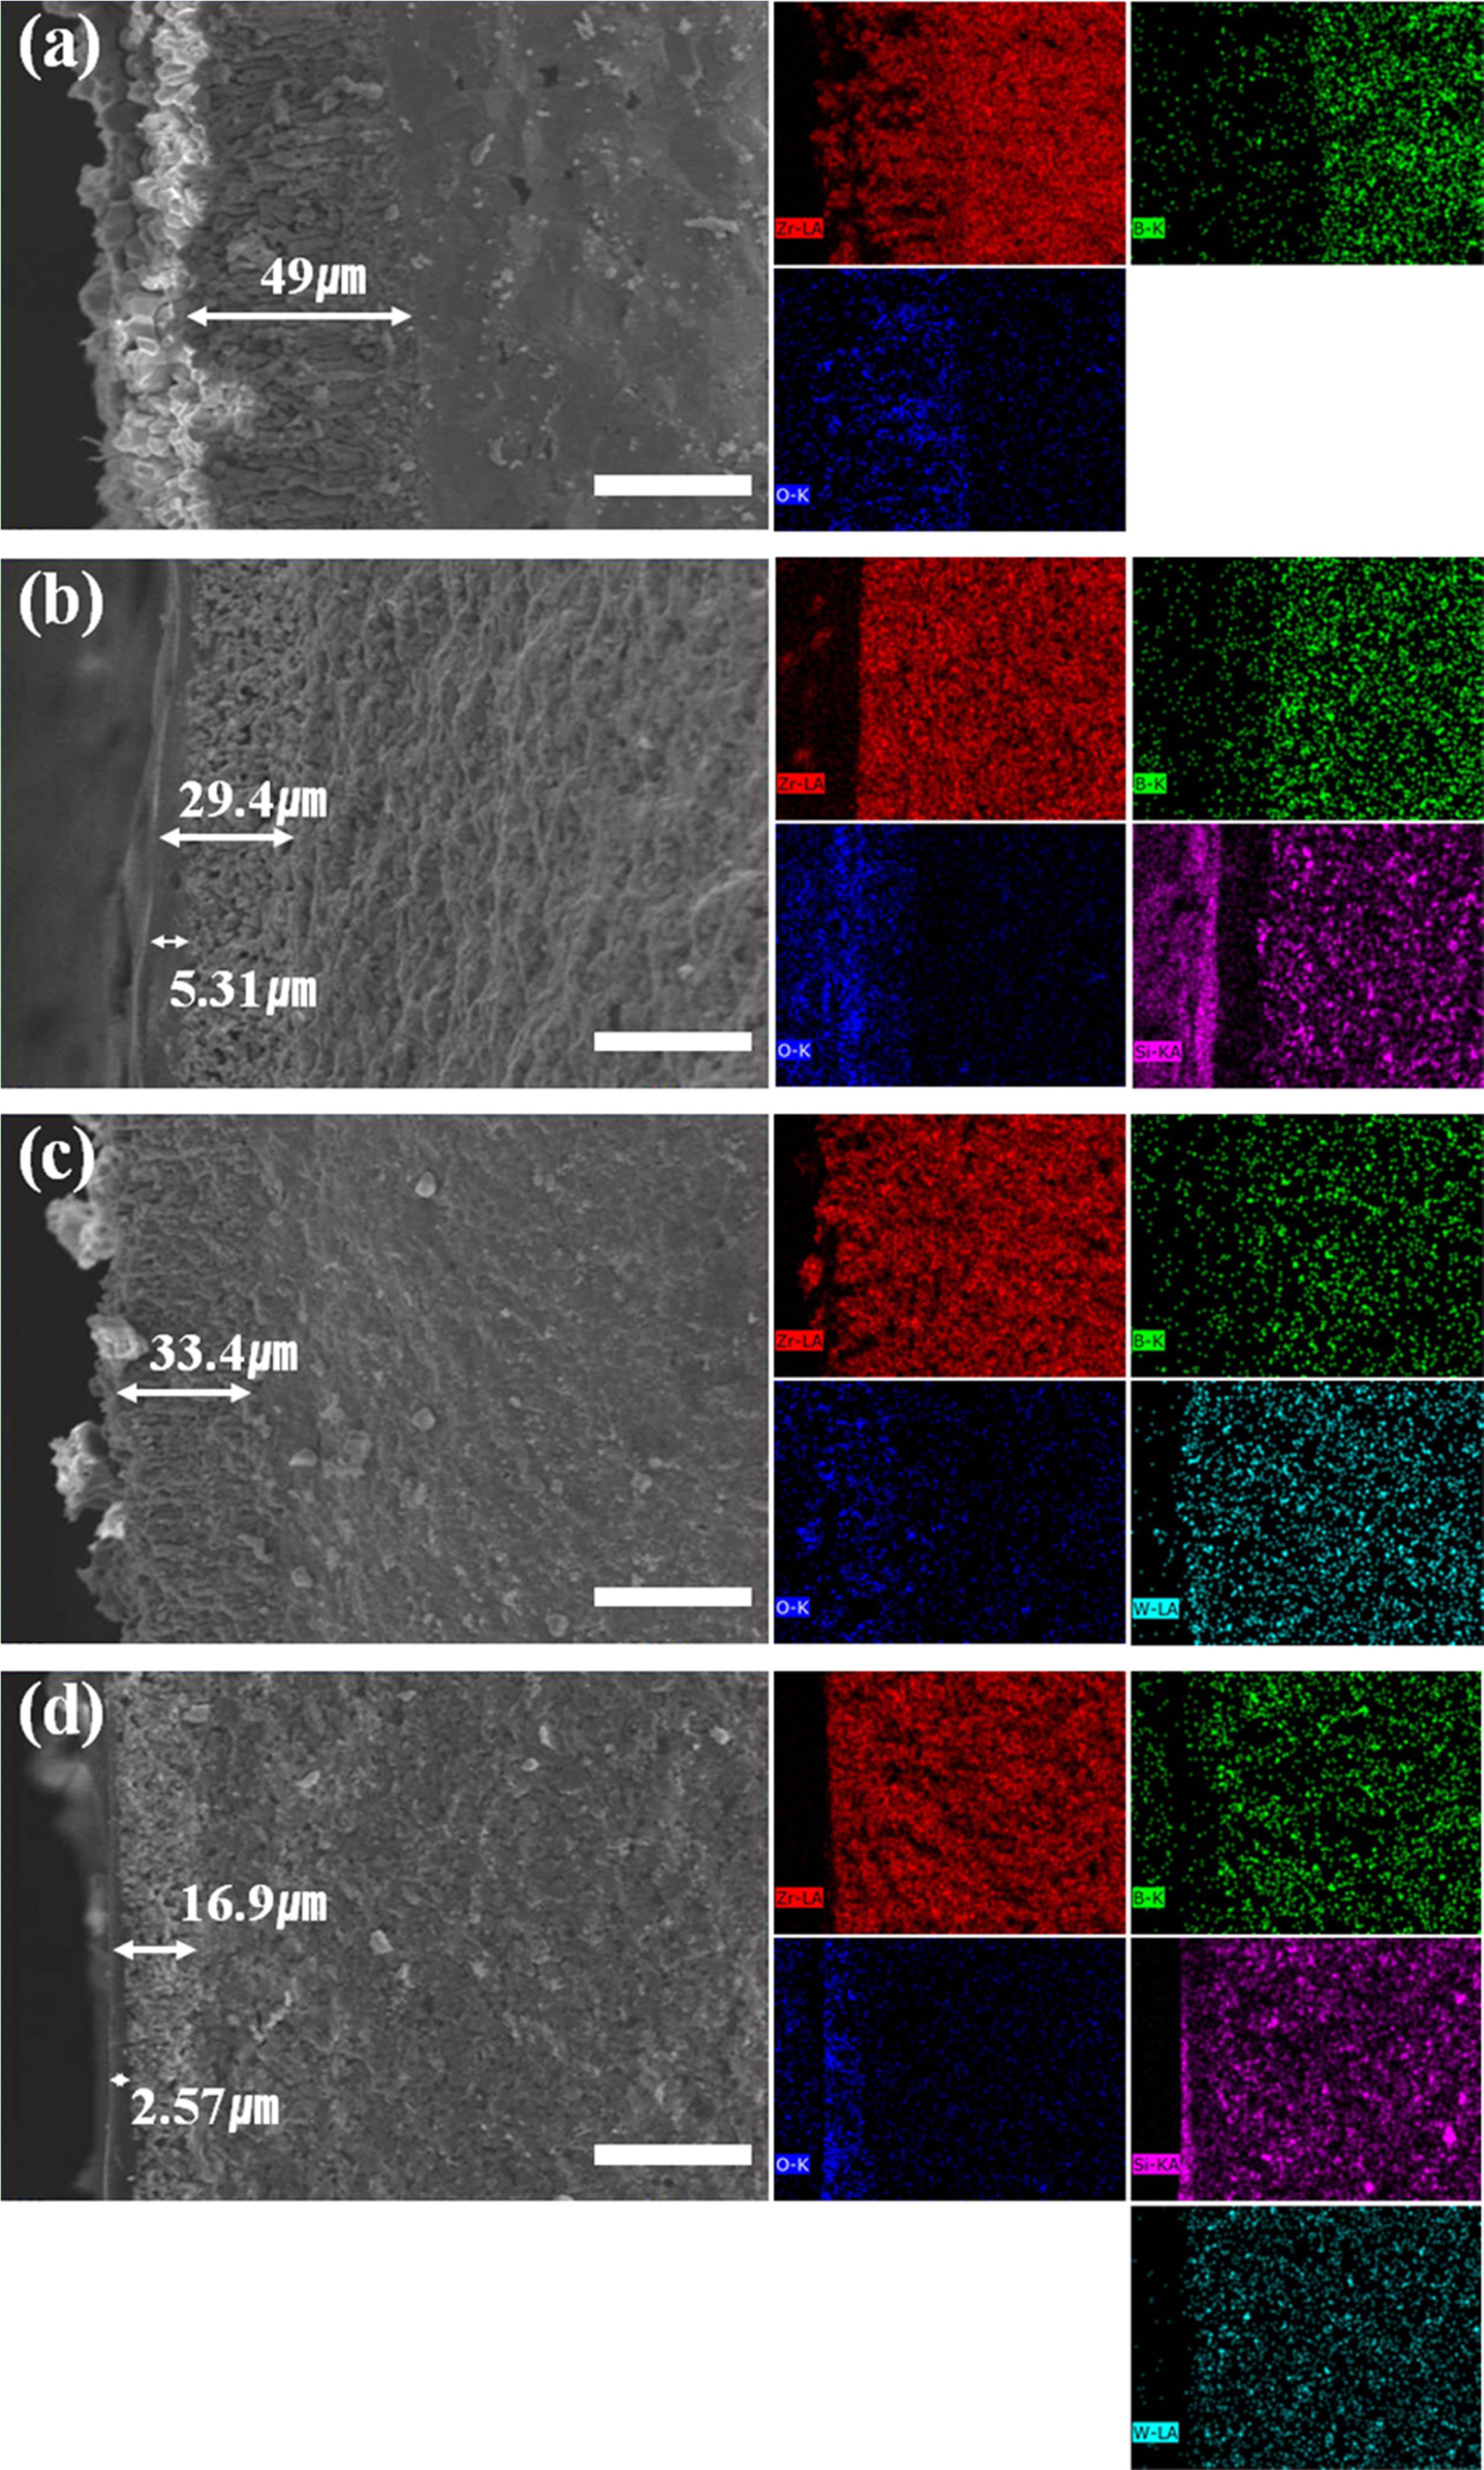
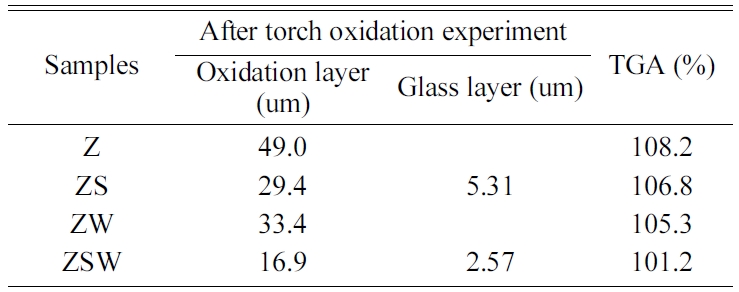
Cross-sections of the ZrB2 composites after the
torch oxidation experiment were examined through FE-SEM and EDS analysis (Fig.
4, Table 3). The oxidation layer thickness of the cross-section of ZrB2
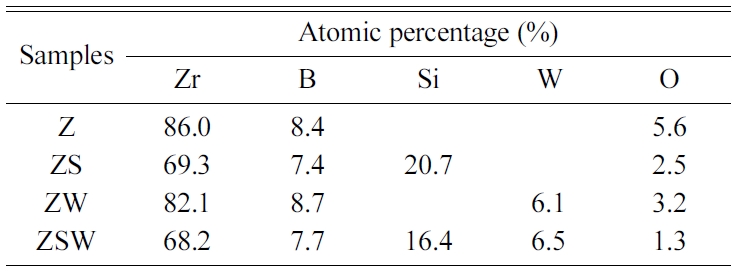
composites (Fig. 4(a)) was approximately 49 µm. EDS analysis revealed that the
oxidation of ZrB2 produced a porous ZrO2 scale
on the surface. The structure of the ZrB2 oxidation
layer was columnar, which facilitates the penetration of oxygen and accelerates
the oxidation of composites [4-7].
Fig. 4(b) shows the ZrB2-SiC composites after
the torch oxidation experiment. Based on EDS analysis, we can see that the SiO2
layer is distributed on the surface, and a ZrO2 layer with hardly
any Si is also present. The SiO2 glass layer appears dense, while
the ZrO2 layer is porous. In fact, composites
containing SiC were observed to have shiny surfaces after the
oxidation experiment (Fig. 2(b)), which indicates that SiO2 produced
from the oxidation of SiC shifted to the surface. In the cross-section of
Sample ZS, the oxidation layer was 29.4 µm thick, among which the borosilicate
layer was found to make up 5.31 µm.
The porous layer of the ZrB2-WC composite shown
by FE-SEM was expected to be found, through EDS analysis, to contain ZrO2
and WO3. Unlike the ZrB2-SiC composite, it has a porous
oxidation layer but no dense glass layer. However, it is denser than the porous
layers shown in Fig. 4(a) and (b). This can be attributed to the blocking of the
oxygen path by the porous layer, with volumetric expansion due to the oxidation
of WC into WO3. The oxidation layer thickness was approximately 33.4 µm, lower than that of Sample
ZrB2 but with similar columnar form.
FE-SEM images and EDS analysis of the ZrB2-SiC-WC composite are shown in
Fig. 4(d). SiC formed a dense SiO2 layer on the surface, while WC
was oxidised into WO3 and caused the middle porous layer to be relatively dense. The XRD results in Fig. 3 show
that ZS and ZSW after the torch oxidation experiment had amorphous shapes at approximately 20°.
Previously, in the photographs of
samples after the torch oxidation experiment in Fig. 2, it was mentioned that
borosilicate formed on the surface, which is also consistent with the FE-SEM
images. The borosilicate layer was 2.57 µm thick, and the total oxidation layer
thickness was 16.9 µm, the thinnest among the four composites. SiC and WC
prevented oxidation from accelerating by blocking the path of oxygen.
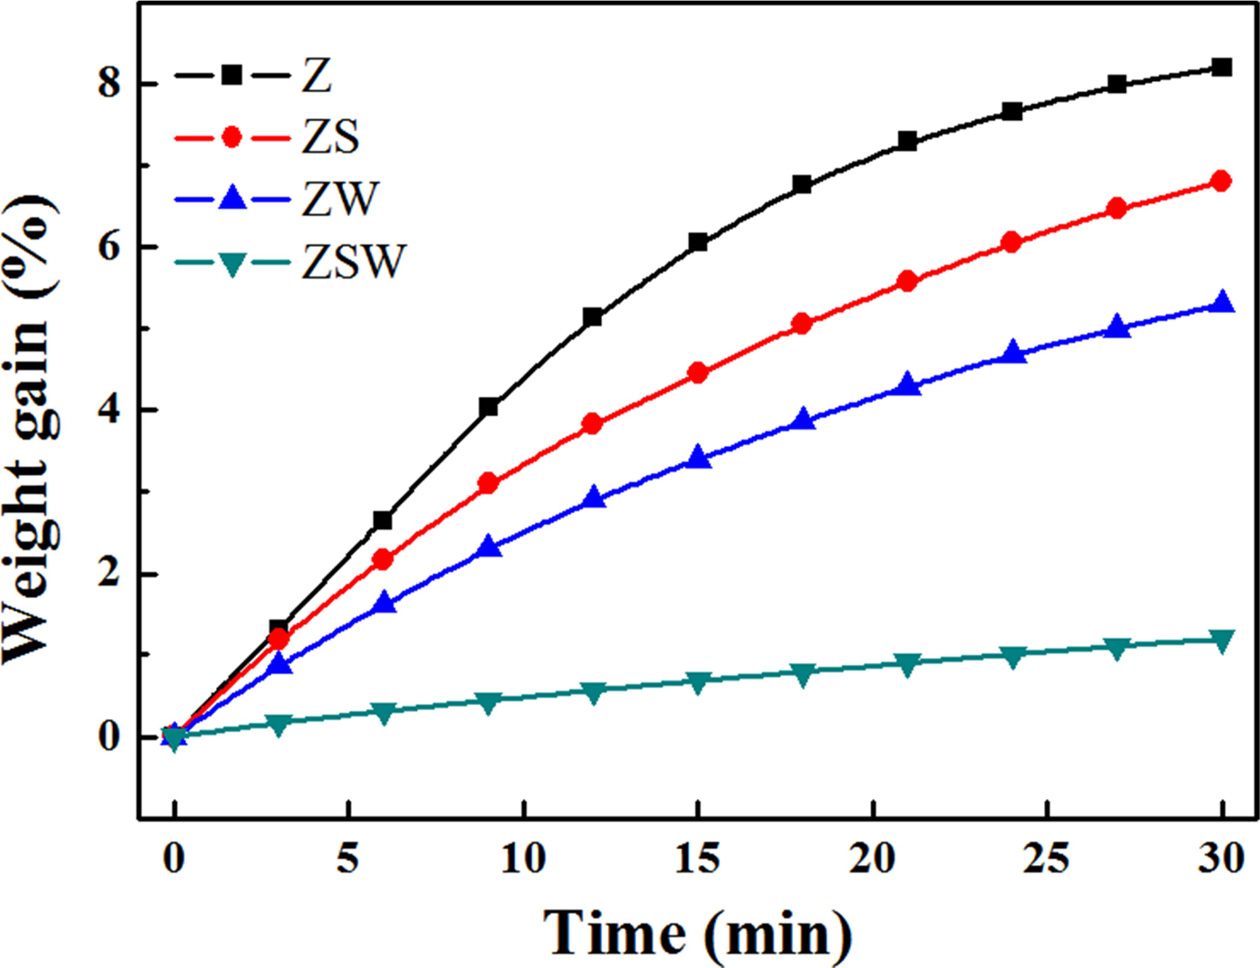
Fig. 5 shows thermal gravimetric analysis results of ZrB2,
ZrB2-SiC, ZrB2-WC, and ZrB2-SiC-WC composites.
Changes in mass were measured while maintaining the temperature at
1,500 °C under atmospheric pressure for 30 min. As can be seen in the TGA
graphs, the weight gains of Z, ZS, ZW, and ZSW are 8.2%, 6.8%, 5.3%, and 1.2%,
respectively. Oxidation occurred when the samples reacted with oxygen in air,
and smaller weight gain indicates lower reactivity. Similar to the results for oxidation
layer thickness in the torch oxidation experiment, the weight gain was smallest for the thinnest
sample, Sample ZSW. The weight gain of ZS and ZW was 1.4% and 2.9% smaller than
that of Z, respectively. This shows that WO3 oxidised from WC is
more effective in blocking the path of oxygen compared with borosilicate
obtained from the oxidation of ZrB2 and SiC. The glass layer of ZSW
was 2.57 µm thick, about half that of ZS at 5.31 µm. For Sample ZSW,
borosilicate first formed on the surface where oxidation began, and the glass layer blocked the oxygen from entering. The formation of WO3
helped block the path of oxygen below the surface; SiO2, which can exist
in liquid phase, blocked the path leading out to the surface. Sample ZSW had a
weight gain of 1.2%, comparable to that of Sample Z at 8.2%. TGA analysis shows
that oxidation resistance improved significantly. The results are presented in
Table 4.
|
Fig. 2 Photographs of samples: (a) Z, (b) ZS, (c) ZW, and (d) ZSW; before (left) and after (right) torch oxidation. |
|
Fig. 3 XRD patterns of samples: (a) before oxidation and (b) after oxidation. |
|
Fig. 4 FE-SEM images and their corresponding EDX elementary images after torch oxidation of samples: (a) Z, (b) ZS, (c) ZW, and (d) ZSW (red: Zr; green: B; blue: O; purple: Si; cyan: W). Scale bar size is 40 μm. |
|
Fig. 5 Weight increases of samples with reaction time at 1,500 °C in ambient atmosphere. |
This study sintered ZrB2-based composites.
Spark plasma sintering was employed to sinter poorly-sinterable
ZrB2 composites into composites having a relative density of 98%.
SiC and WC are expected to prevent oxidation when sintered with ZrB2.
When the ZrB2-SiC composite was oxidised, a borosilicate layer
developed on the surface, which blocked the path of oxygen and stopped the
progress of oxidation. When the ZrB2-WC composite was oxidised, WC
was oxidised into WO3, leading to an increase in volume. This
volumetric expansion was presumed to have further interfered with oxidation by
blocking the path of oxygen. Based on the TGA results, the weight gains were
8.2%, 6.8%, 5.3%, and 1.2% for ZrB2, ZrB2-SiC, ZrB2-WC,
and ZrB2-SiC-WC, respectively. In sum, the ZrB2-SiC-WC
composite developed a glass layer on the surface that prevented oxygen from
infiltrating, and the oxidised WO3 prevented SiO2 leakage
while simultaneously blocking the path of oxygen. These factors contributed to
significantly enhancing the oxidation resistance of the composites.
This work was supported by grants (NRF-2018R1A5 A6075959) from the National Research
Foundation of Korea (NRF) funded by the Korean Government and project for ‘New
business R&D Voucher’ between Industry, Academy, and
Research Institute funded Korea Ministry of SMEs and Startups in
2019. (project No. S2778019).
- 1. S.R. Levine, E.J. Opila, M.C. Halbig, J.D. Kiser, M. Singh, and J. A. Salem, J. Eur. Ceram. Soc. 22[14-15] (2002) 2757-2767.
-

- 2. E. Wuchina, E. Opila, M. Opeka, W. Fahrenholtz, and I. Talmy, Electrochem.Soc. Interface, 16 (2007) 30-36.
- 3. W. G. Fahrenholtz and G. E. Hilmas, NSF-AFOSR joint workshop on future ultra-high temperature materials NSF-AFOSR Draft Workshop Report, National Science Foundation (2004).
- 4. A.L. Chamberlain, W.G. Fahrenholtz, and Gregory E., J. Am. Ceram. Soc. 89[2] (2006) 450-456.
-
- 5. S. Zhu, W.G. Fahrenholtz, G.E. Hilmas, and S. C. Zhang, J. Am. Ceram. Soc. 90[11] (2007) 3660-3663.
-
- 6. T.A. Parthasarathy, R.A. Rapp, M. Opeka, and R.J. Kerans, Acta Mater. 55 (2007) 5999-6010.
-
- 7. C.R. Wang, J.-M. Yang, and W. Hoffman, Mater. Chem. Phys. 74 (2002) 272-281.
-
- 8. F. Monteverde and A. Bellosi, J. Electrochem. Soc. 150[11] (2003) B552-B559.
-
- 9. W. C. Tripp and H. C. Graham, J. Electrochem. Soc. 118[7] (1971) 1195-1199.
-
- 10. A. Rezaie, W.G. Fahrenholtz, and G. E. Hilmas, J. Eur. Ceram. Soc. 27[6] (2007) 2495-2501.
-
- 11. G.-J. Zhang, Z.-Y. Deng, N. Kondo, J.-F. Yang, and T. Ohji, J. Am. Ceram. Soc. 83[9] (2000) 2330-2332.
-
- 12. S.S. Hwang, A.L. Vasiliev, and N.P. Padture, Mater. Sci. Eng. A. 464[1-2] (2007) 216-224.
-
- 13. J. Han, P. Hu, X. Zhang, and S. Meng, Scr. Mater. 57[9] (2007) 825-828.
-
- 14. S. N. Karlsdottir and J.W. Halloran, J. Am. Ceram. Soc. 92[2] (2009) 481-486.
-
- 15. W.-M. Guo and G.-J. Zhang, J. Eur. Ceram. Soc. 30[11] (2010) 2387-2395.
-
- 16. W.G. Fahrenholtz, J. Am. Ceram. Soc. 90[1] (2007) 143-148.
-
- 17. M. Mallik, K.K. Ray, and R. Mitra, J. Eur. Ceram. Soc. 31[1-2] (2011) 199-215.
-
- 18. S.C. Zhang, G.E. Hilmas, and W.G. Fahrenholtz, J. Am. Ceram. Soc. 91[11] (2008) 3530-3535.
-
- 19. S.K. Choi, S.W. Ui, I.S. Choi, and S.C. Choi, J. Ceram. Soc. Jpn. 122[3] (2014) 198-203.
-
- 20. S.C. Zhang, G.E. Hilmas, and W.G. Fahrenholtz, J. Am. Ceram. Soc. 94[4] (2011) 1198-1205.
-
- 21. J. Zou, S.-K. Sun, G.-J. Zhang, Y.-. Kan, P.-L. Wang, and T. Ohji, J. Am. Ceram. Soc. 94[5] (2011) 1575-1583.
-
- 22. J. Zou, G.-J. Zhang, C.-F. Hu, T. Nishimura, Y. Sakka, J. Vleugels, and O. Van der Biest, J. Am. Ceram. Soc. 95[3] (2012) 874-878.
-
 This Article
-
2020; 21(3): 351-357
Published on Jun 30, 2020
- 10.36410/jcpr.2020.21.3.351
- Received on Dec 5, 2019
- Revised on Mar 6, 2020
- Accepted on Mar 9, 2020
Services
Shared
Correspondence to
- Gye-Seok An
-
Division of Materials Science and Engineering, Hanyang University, 222 Wangsimni-ro, Seongdong-gu, Seoul 04763, Korea
Tel : +82-2220-0505
Fax: +82-2290-6767
**These arthurs were contributed equally to this work. - E-mail: faustmaro@hanyang.ac.kr
Clean-Energy Research Institute(CRI), Hanyang University, 222, Wangsimni-ro, Seongdong-gu, Seoul, 04763, Korea
E-mail: jcpr@hanyang.ac.kr