- The electrical insulation characteristics of a glass adhesive process for the silicon MEMS element of a pressure sensor
Gon-Jae Leea,b,* and Duck-Kyun Choia
aDepartment of Materials Science and Engineering, Hanyang University, Seoul, Korea
bR&D Center, Mando corporation, Sungnam, Korea
Recently, the electrical
performance requirements of the sensor elements used in electric vehicles have
been strengthened. Automotive pressure sensors are manufactured by bonding
metal diaphragms and MEMS sensing elements. The withstand voltage of the
pressure sensor is greatly affected by the electrical characteristics of the
adhesive material between the metal diaphragm and the MEMS sensing element
connected to the vehicle body. In this study, the withstand voltage of the
sensor element was analyzed using glass paste as the bonding material for the
glass paste process. As a result, it was found that this voltage was greatly
influenced by the remaining glass paste porosity remaining following the glass
paste process, and also by the area and thickness of the glass paste.
Therefore, it was found that the thickness and area of the glass paste should
be optimized and that the internal porosity should be minimized to obtain
excellent withstand voltage characteristics in the sensing device.
Keywords: Insulation, Glass paste, Bonding, Process, MEMS
In a car, pressure sensors are the most frequently used
sensors for monitoring engine intakes, air conditioner
refrigerant pressure, injection pressure, and brake oil pressure [1]. With the
recent advances in eco-friendly cars and car performances in general, pressure
sensors are required to cover a wider range of pressures across diverse
applications such as gauging fuel pressure in the engine while showing
reliability even in diverse environments [2-4, 14-16].
Depending on the pressure range and the media which
transfers the pressure, a variety of pressure-sensing devices and packages may
be used. Recently, silicon MEMS (Micro Electro Mechanical System) devices have
been used to cover a wide range of pressure [5-8].
Since the media which transfer pressures in sensors for
air, gas, water, oil, and refrigerant are chemically reactive, sensing devices
that use metal diaphragms are used for their reliability [5-8].
When metal diaphragms are used to make detection devices,
a metal strain gauge thin-film resistor will be formed in the upper region of
the diaphragm. The thin-film resistor of a metal strain gauge has a lower
sensitivity and limits the output noise when compared to the silicon MEMS-type
piezoresistor. Also, the production cost for metal resistors is high because
thin-film resistor deposition needs to be performed for every diaphragm
using a customized semiconductor fabrication process. On
the other hand, MEMS elements have the
advantage of lower production cost because the sensors may be mass-produced
using a single silicon wafer production process [9-13, 16].
However, to take advantage of the high
sensitivity of metal diaphragms and low costs of MEMS elements, the two parts
need to be bonded using glass paste. The joint is where metal diaphragms
and MEMS element are connected, and the insulation between these two parts determine
the insulation of the sensor module and the withstand voltage.
In this paper, to test the insulation characteristics of a
high-reliability pressure sensor that uses a metal
diaphragm and silicon MEMS
element, glass paste was used in the bonding process between the two parts, and
the bonding process condition and the insulation and voltage of the formation
were measured.
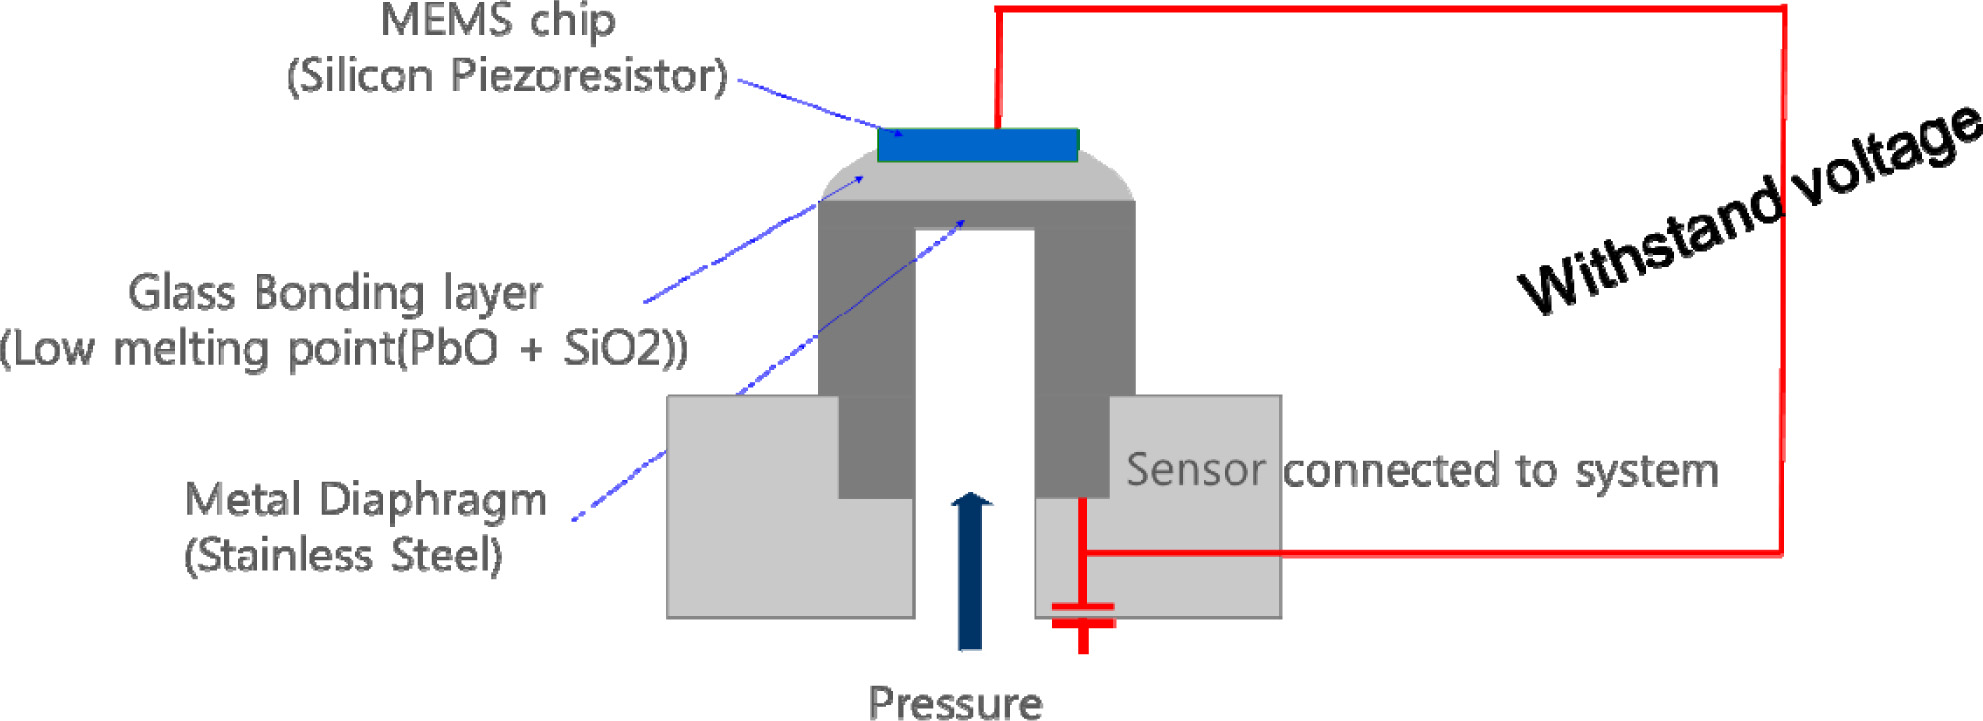
Fig. 1 shows how the MEMS element was added on top of the
metal diaphragm and why the structure requires an insulating property. The MEMS
element was produced using the semiconductor manufacturing process and MEMS
Process. For the metal diaphragm, SUS630 (stainless steel) was used and glass
paste was used to bind the silicon MEMS element.
To a prevent reduction in the performance and maintain the
melting point of the glass paste under 500 o
C, the glass powder primarily composed of PbO and a
binding agent that helps to control the viscosity of the paste during printing
process was also used.
To obtain the target viscosity, a ball mill was used for mixing,
by increasing the rpm from 3 to 5 over a 60 min period. A screen printing
process was used to apply glass paste on the metal diaphragm. When printing,
the surface area and thickness were varied. The MEMS element was placed in the
center of the glass paste, and for firing the glass paste, the temperature was
increased at a rate of 6 oC/min until the temperature reached
420 oC
and the temperature
was then maintained for 10 minutes. To evaluate the withstand
voltage of the sample processed using the glass paste, the
silicon MEMS element was connected by wire bonding to a probe. Insulation
resistance meters were used to measure the insulation voltage, which is reduced
from the leakage current at 10 MWohm. The cross section of the
bonding surface was analyzed to study the correlation between the
insulation voltage and bonding structure. Further, to measure the withstand
voltage of the sensor modules that use sensing elements, the withstand voltage
was measured after the wire bonding of the sensing element and joints were
potted with silicon gel in the protective process. The
cross sections of the junctions were studied using an SEM
(Scanning Electronic Microscope). To measure insulation voltage, an insulation
voltage meter was used, and to measure the withstand voltage of the assembly of
the sensor element, a withstand voltage meter was used.
|
Fig. 1 A MEMS element bonding structure and electrical insulation structure on a metal diaphragm. |
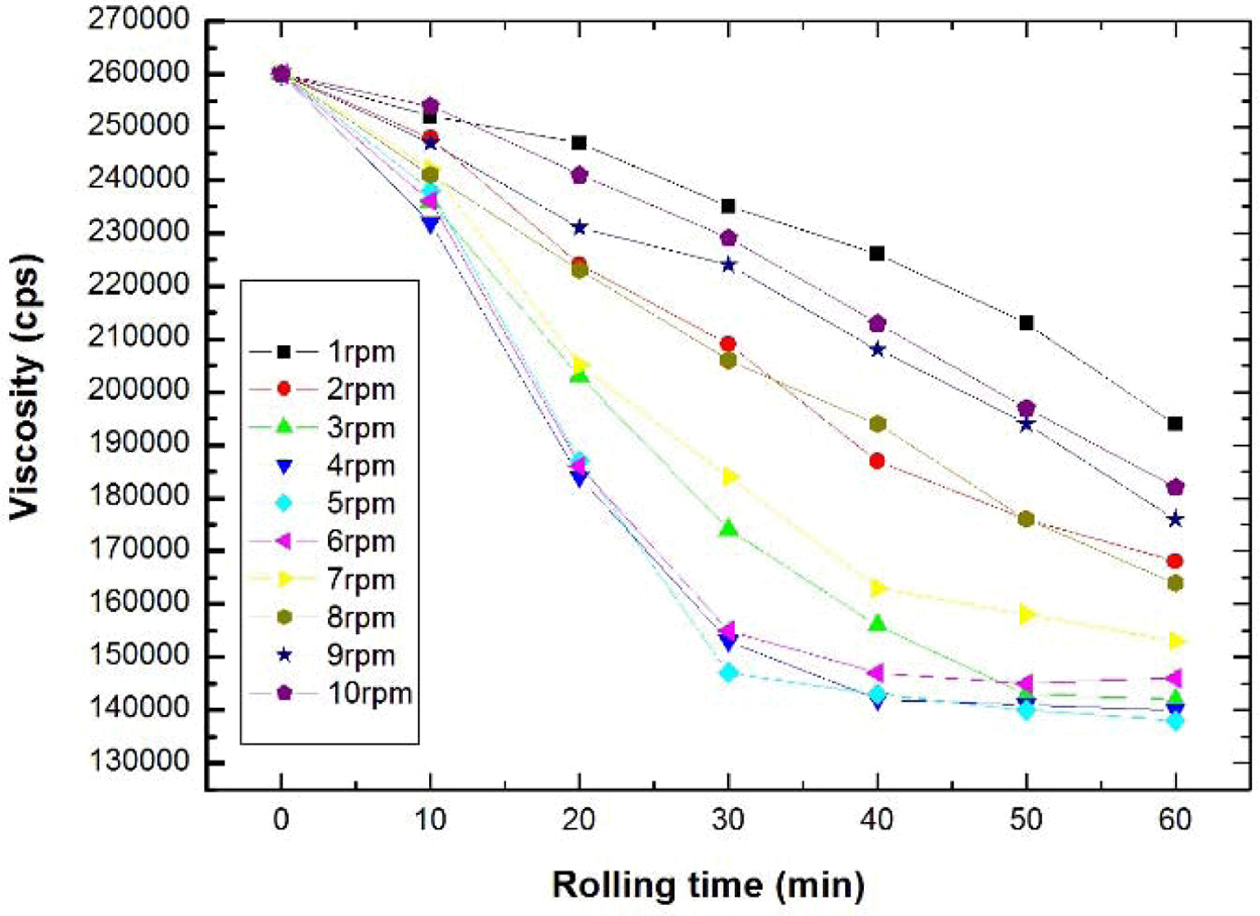
Fig. 2 is a graph that plots viscosity as a function of the rolling speed and
time, which are the process variables in the
mixing process that are used to maintain a target viscosity before the glass
paste undergoes the
screen printing process. As shown in the graph, the viscosity is stabilized
most quickly in the rolling speed range of 3-5 rpm. After a rolling time of 30
min, the viscosity was stabilized and no decrease in viscosity was observed.
After fixing the rolling speed at 5 rpm, the rolling time
was increased from 0 to 60 min with a 10 min increment.
Using the screen printing process, glass pastes made with varying conditions
were applied to the top of the metal diaphragm. After the silicon MEMS element was bonded on
the applied glass paste, the glass paste underwent a firing process. Then, the
insulation voltage was measured at the junction of the MEMS element of the sensing element and the metal diaphragm.
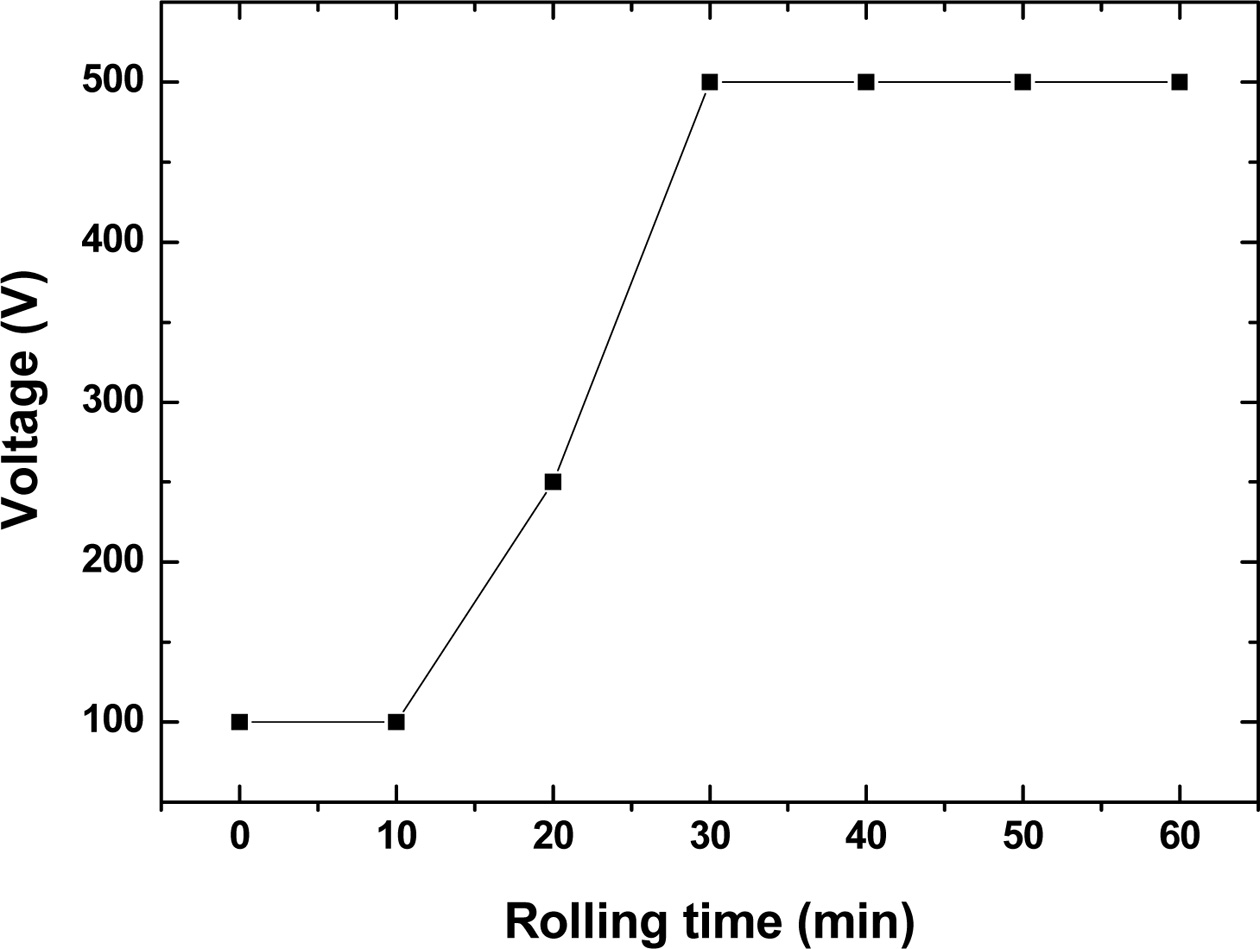
As shown in Fig. 3, the voltage saturates at 500 V when
the rolling time reaches 30 min during the mixing process of the glass paste.
This is also the point at which the viscosity is sufficiently stabilized.
To analyze the correlation between the glass paste thickness
and insulation voltage, the glass paste thickness was
controlled by controlling the mask thickness. To eliminate variables other than
the thickness, the glass paste viscosity was fixed by fixing the rolling speed
and time at 5 rpm and 40 min, respectively, as shown in Fig. 2, while the other
process conditions were kept constant.
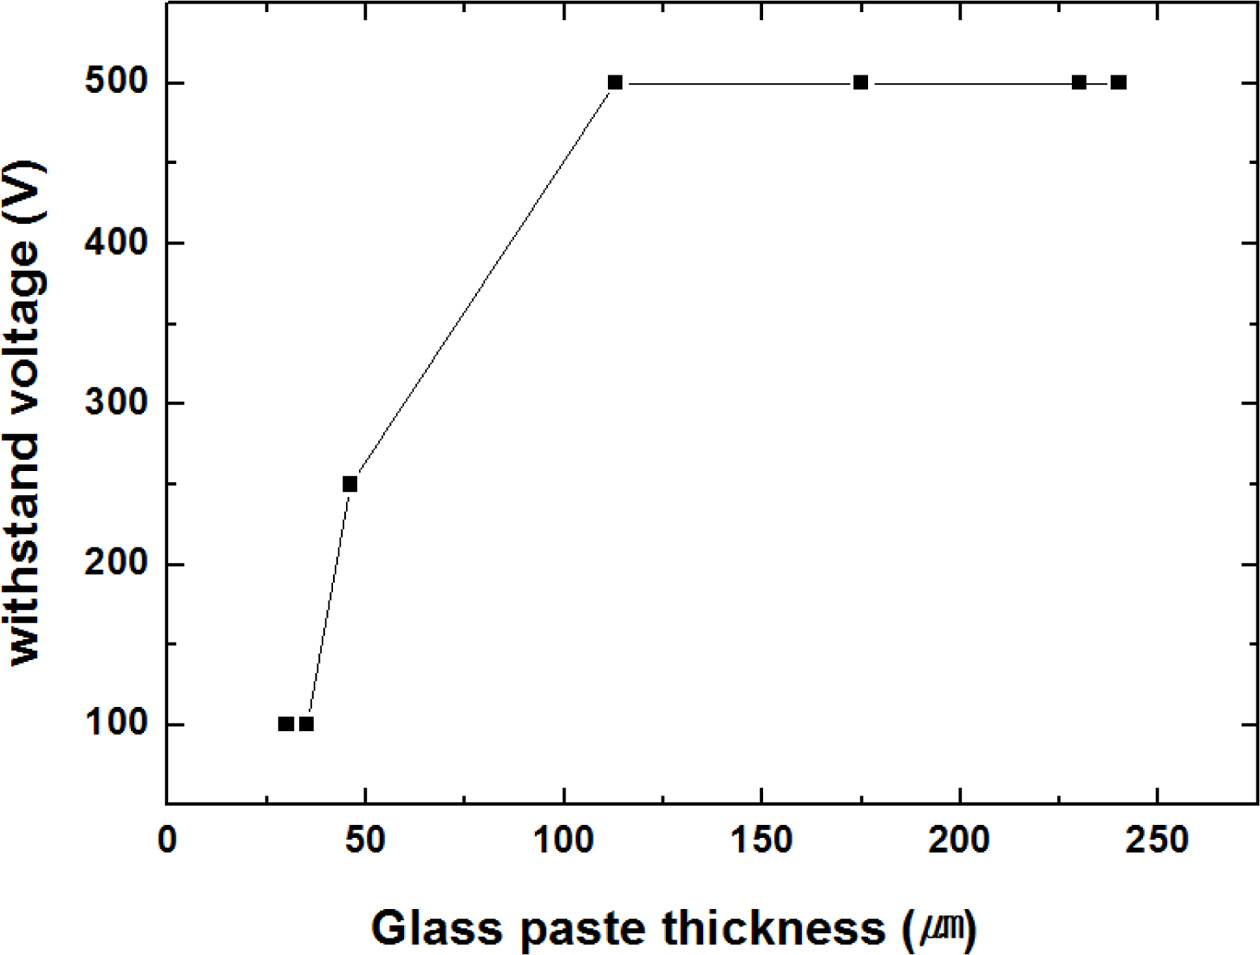
As shown in Fig. 4, which plots the insulation voltage as
a function of the glass layer thickness, the insulation voltage was below 500 V
when the thickness was less than 100 mm.
At a thickness greater than 100 mm,
the insulation voltage saturated at 500 V. This trend shows that increasing the
glass layer thickness is positively correlated with the insulation voltage but above
a certain thickness, the insulation voltage saturates.
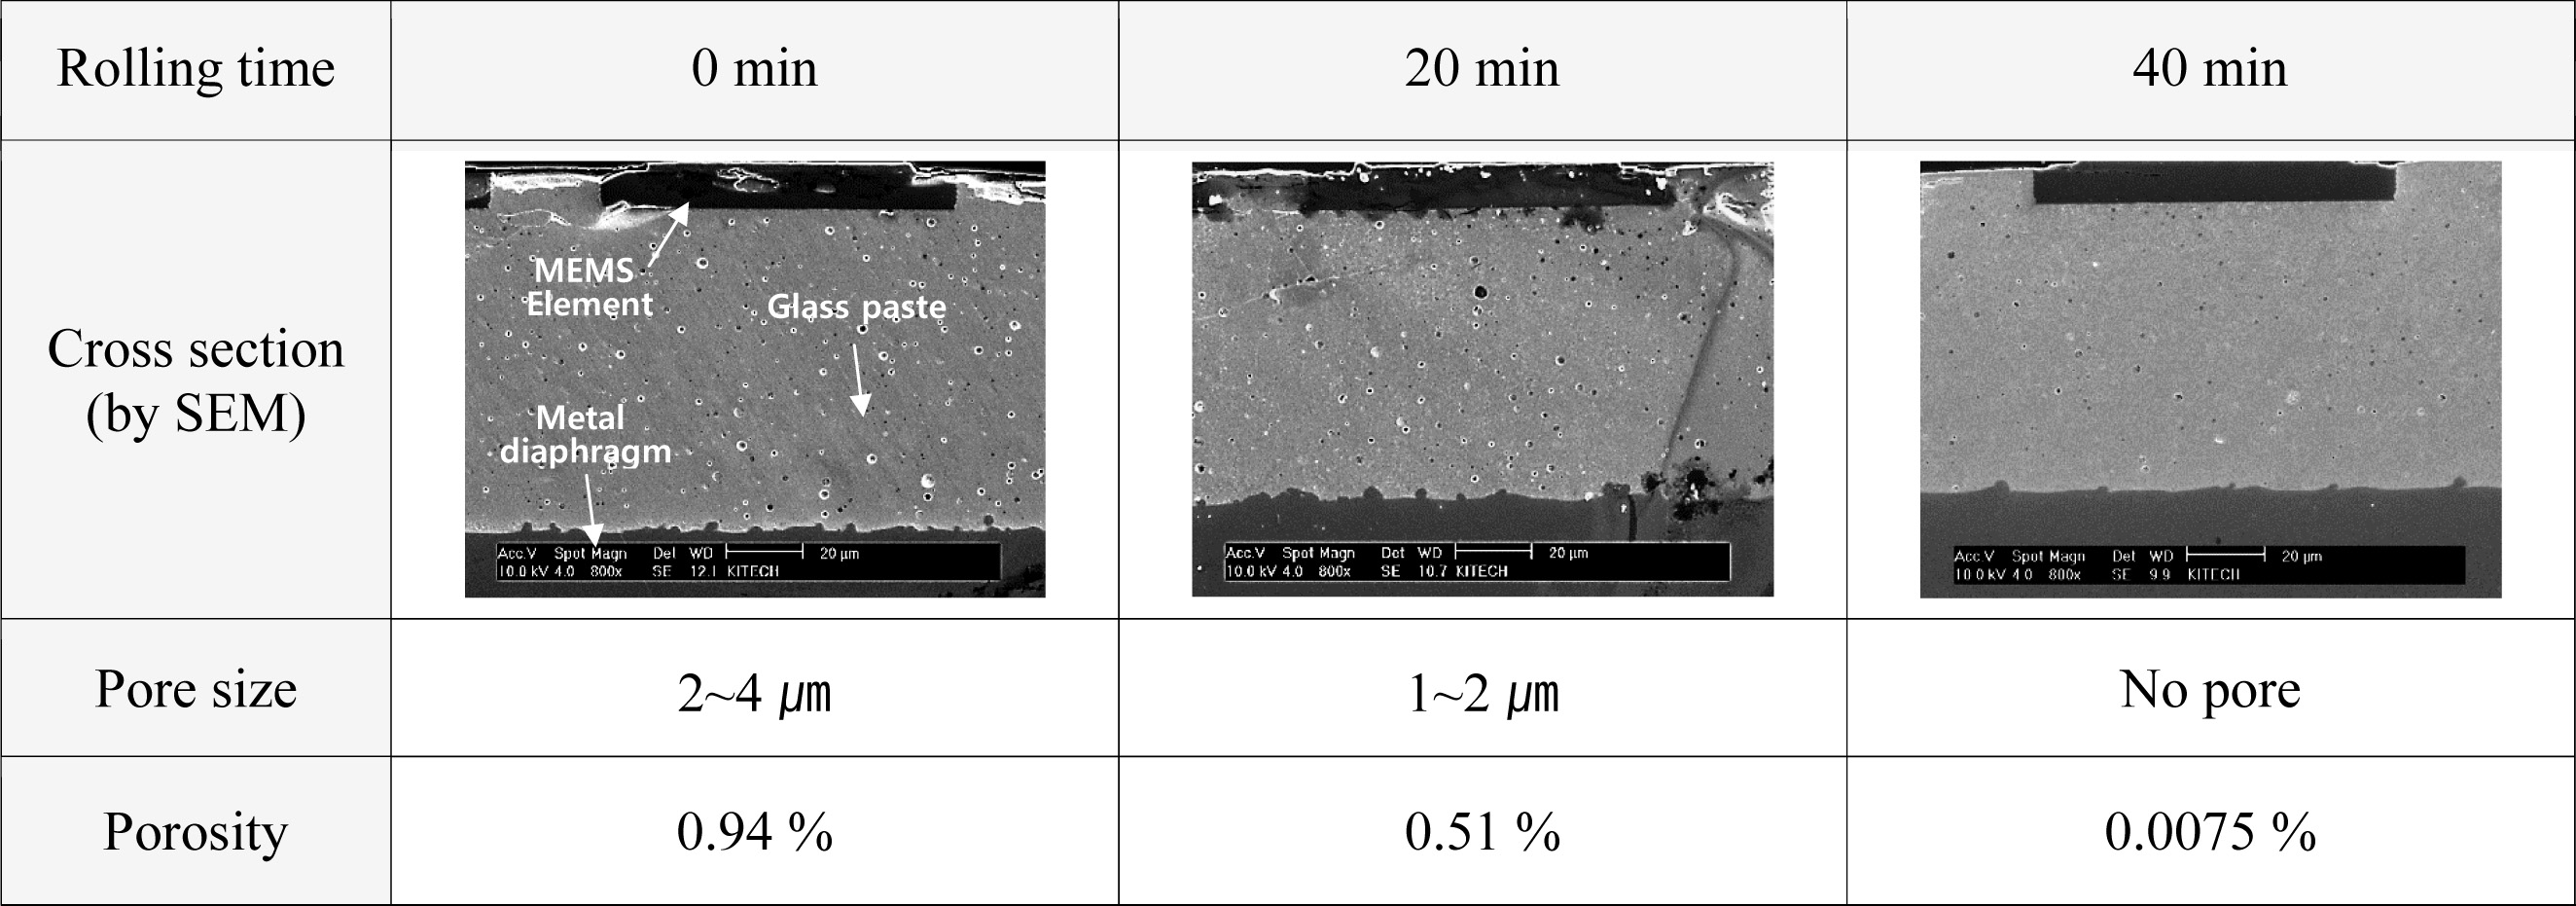
Fig. 5 shows the cross sections of the glass layers, which
were processed at a rolling speed of 5 rpm, which is the point at which the
viscosity is stabilized, as shown in Fig. 3, with multiple rolling times. As
shown in the cross section, there are pores. The size of the pores and the
porosity decreased as the rolling time increased from 0 to 40 minutes. Here,
the porosity is defined as the ratio of the area of the pores per unit surface
area of the glass layer in the observed picture: Porosity(%) = pore surface
area/glass surface area (100 mm ´ 100 mm)*100%. The inverse relationship
between the rolling time and porosity may be attributed to the
fact that the glass powder and binder, which make up the glass paste, became
homogeneous over time.
Fig. 6 is a schematic representation of the
structure of Fig. 5. This schematic
shows the difference in porosity inside the glass paste when the rolling
process time is insufficient and sufficient.
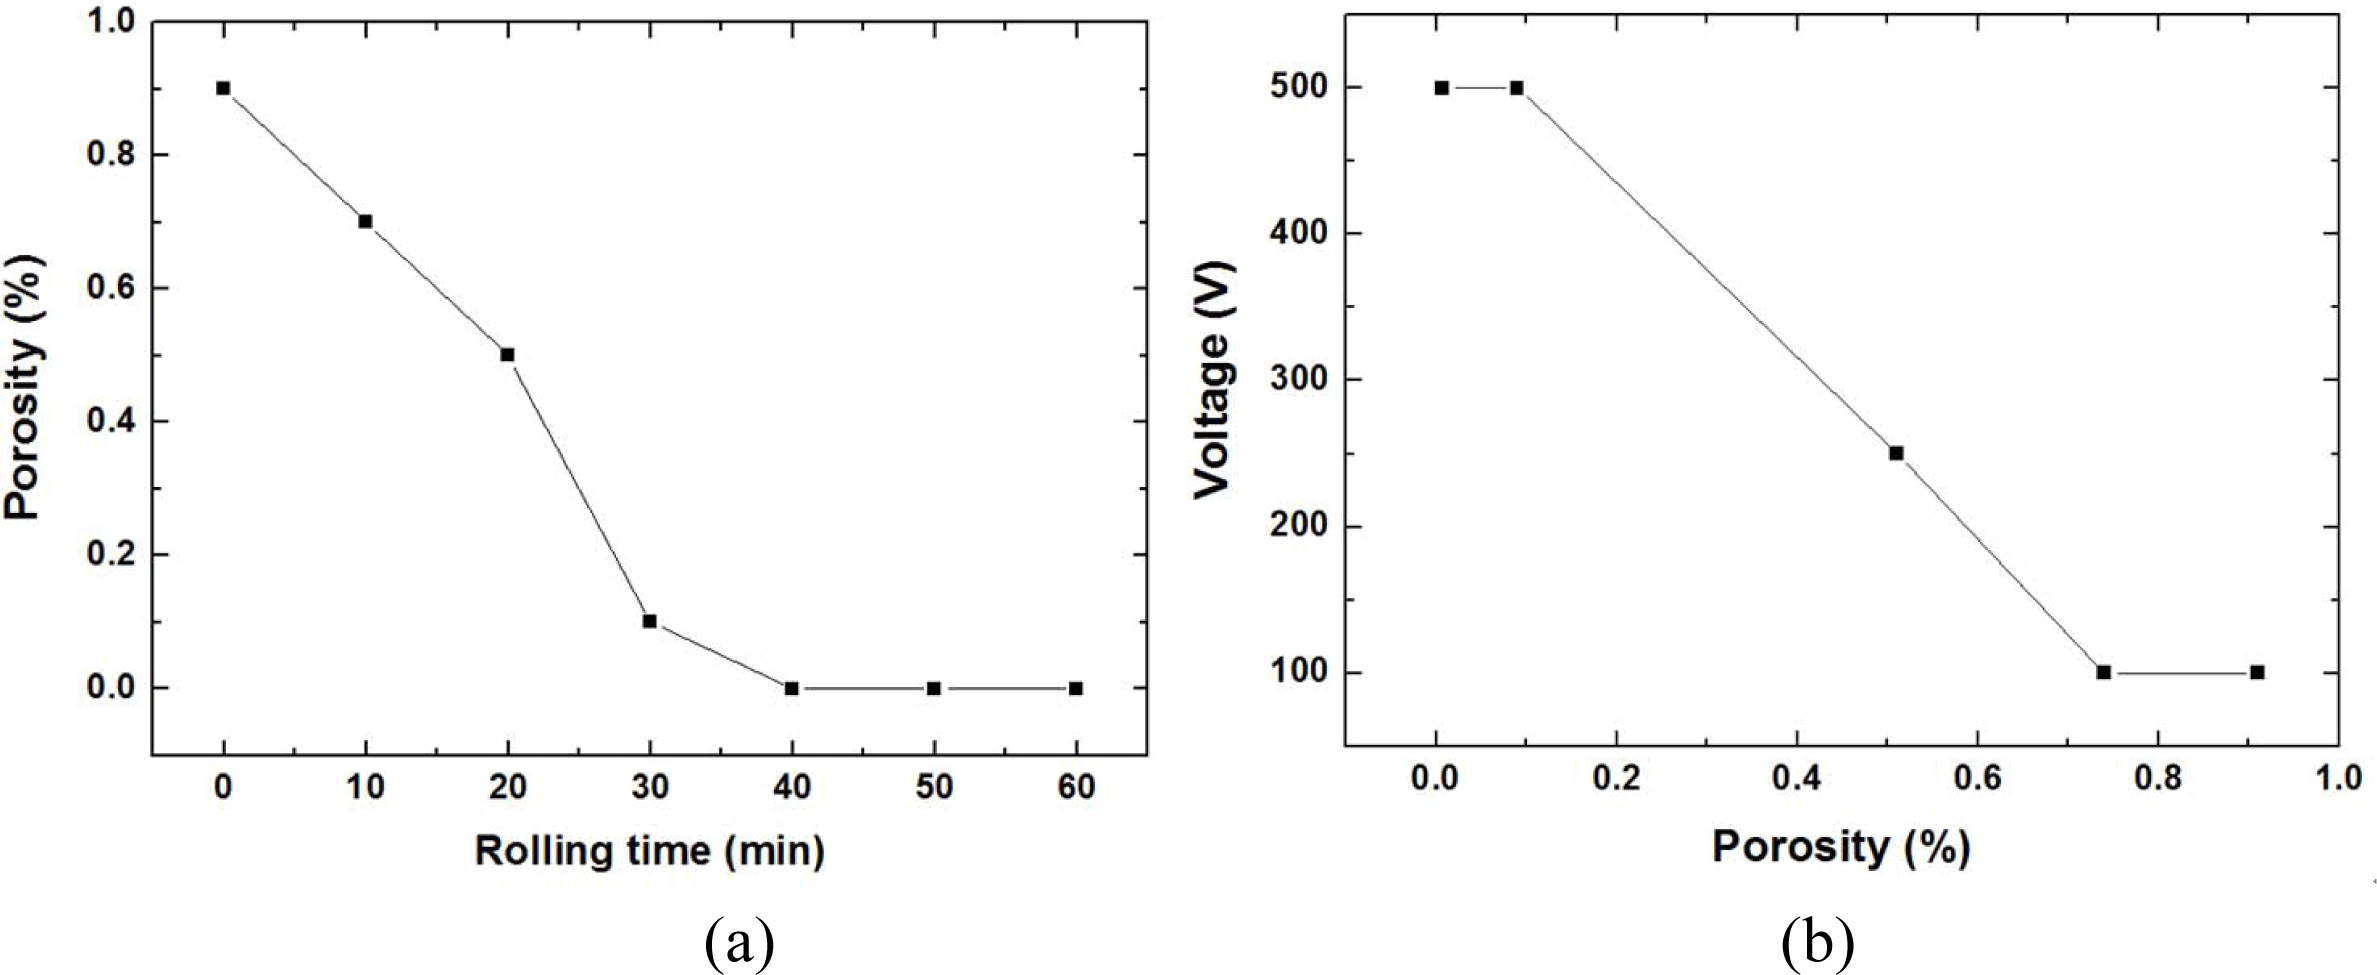
Fig. 7 shows the correlation between the withstand voltage
performance, which depends on the rolling time of the glass
paste past from Fig. 3, and the porosity from Fig. 5.
As rolling time increases up to 30 min, the porosity
drops drastically and above 30 min, the porosity
drops to about 0%. When the withstand voltage performance
is viewed with respect to porosity, the withstand voltage increases as the
porosity approaches 0%.
Additionally, when Fig. 5 was examined to identify the
correlation between the porosity and thickness of the glass layer, which both
affect the withstand voltage, for 3 different rolling times (0 min, 20 min, and
40 min) the thicknesses of the respective layers were 120 mm, 110 mm
and 100 mm. Regardless
of the thickness of the layer in Fig. 5, the porosity was high. High porosity
has the effect of reducing the effective thickness and
forming electrical paths, thereby lowering the withstand voltage. The correlation between the porosity and the thickness of the glass layer,
which affects the withstand voltages in Figs. 4 and 5, is then explored. Regardless of the thickness, the higher the
porosity, the lower the withstand voltage. It is considered that this is because when the porosity is high, the
effective thickness is reduced and an electrical path of shorter distance is
formed. Overall, it is concluded that the withstand voltage is
determined by the thickness when the viscosity of the glass layer is stable.
Up to this point, the effect of the glass layer thickness
on the withstand voltage was studied. Next, the study would like to shift the
focus to the surface area on which glass paste is applied. To ensure good
adhesion between the MEMS element and metal diaphragm,
both the surface area and thickness, play an important role. Since the side
length of the MEMS element and
diaphragm may vary depending on the surface area, the effect of the surface
area on the withstand voltage was analyzed.
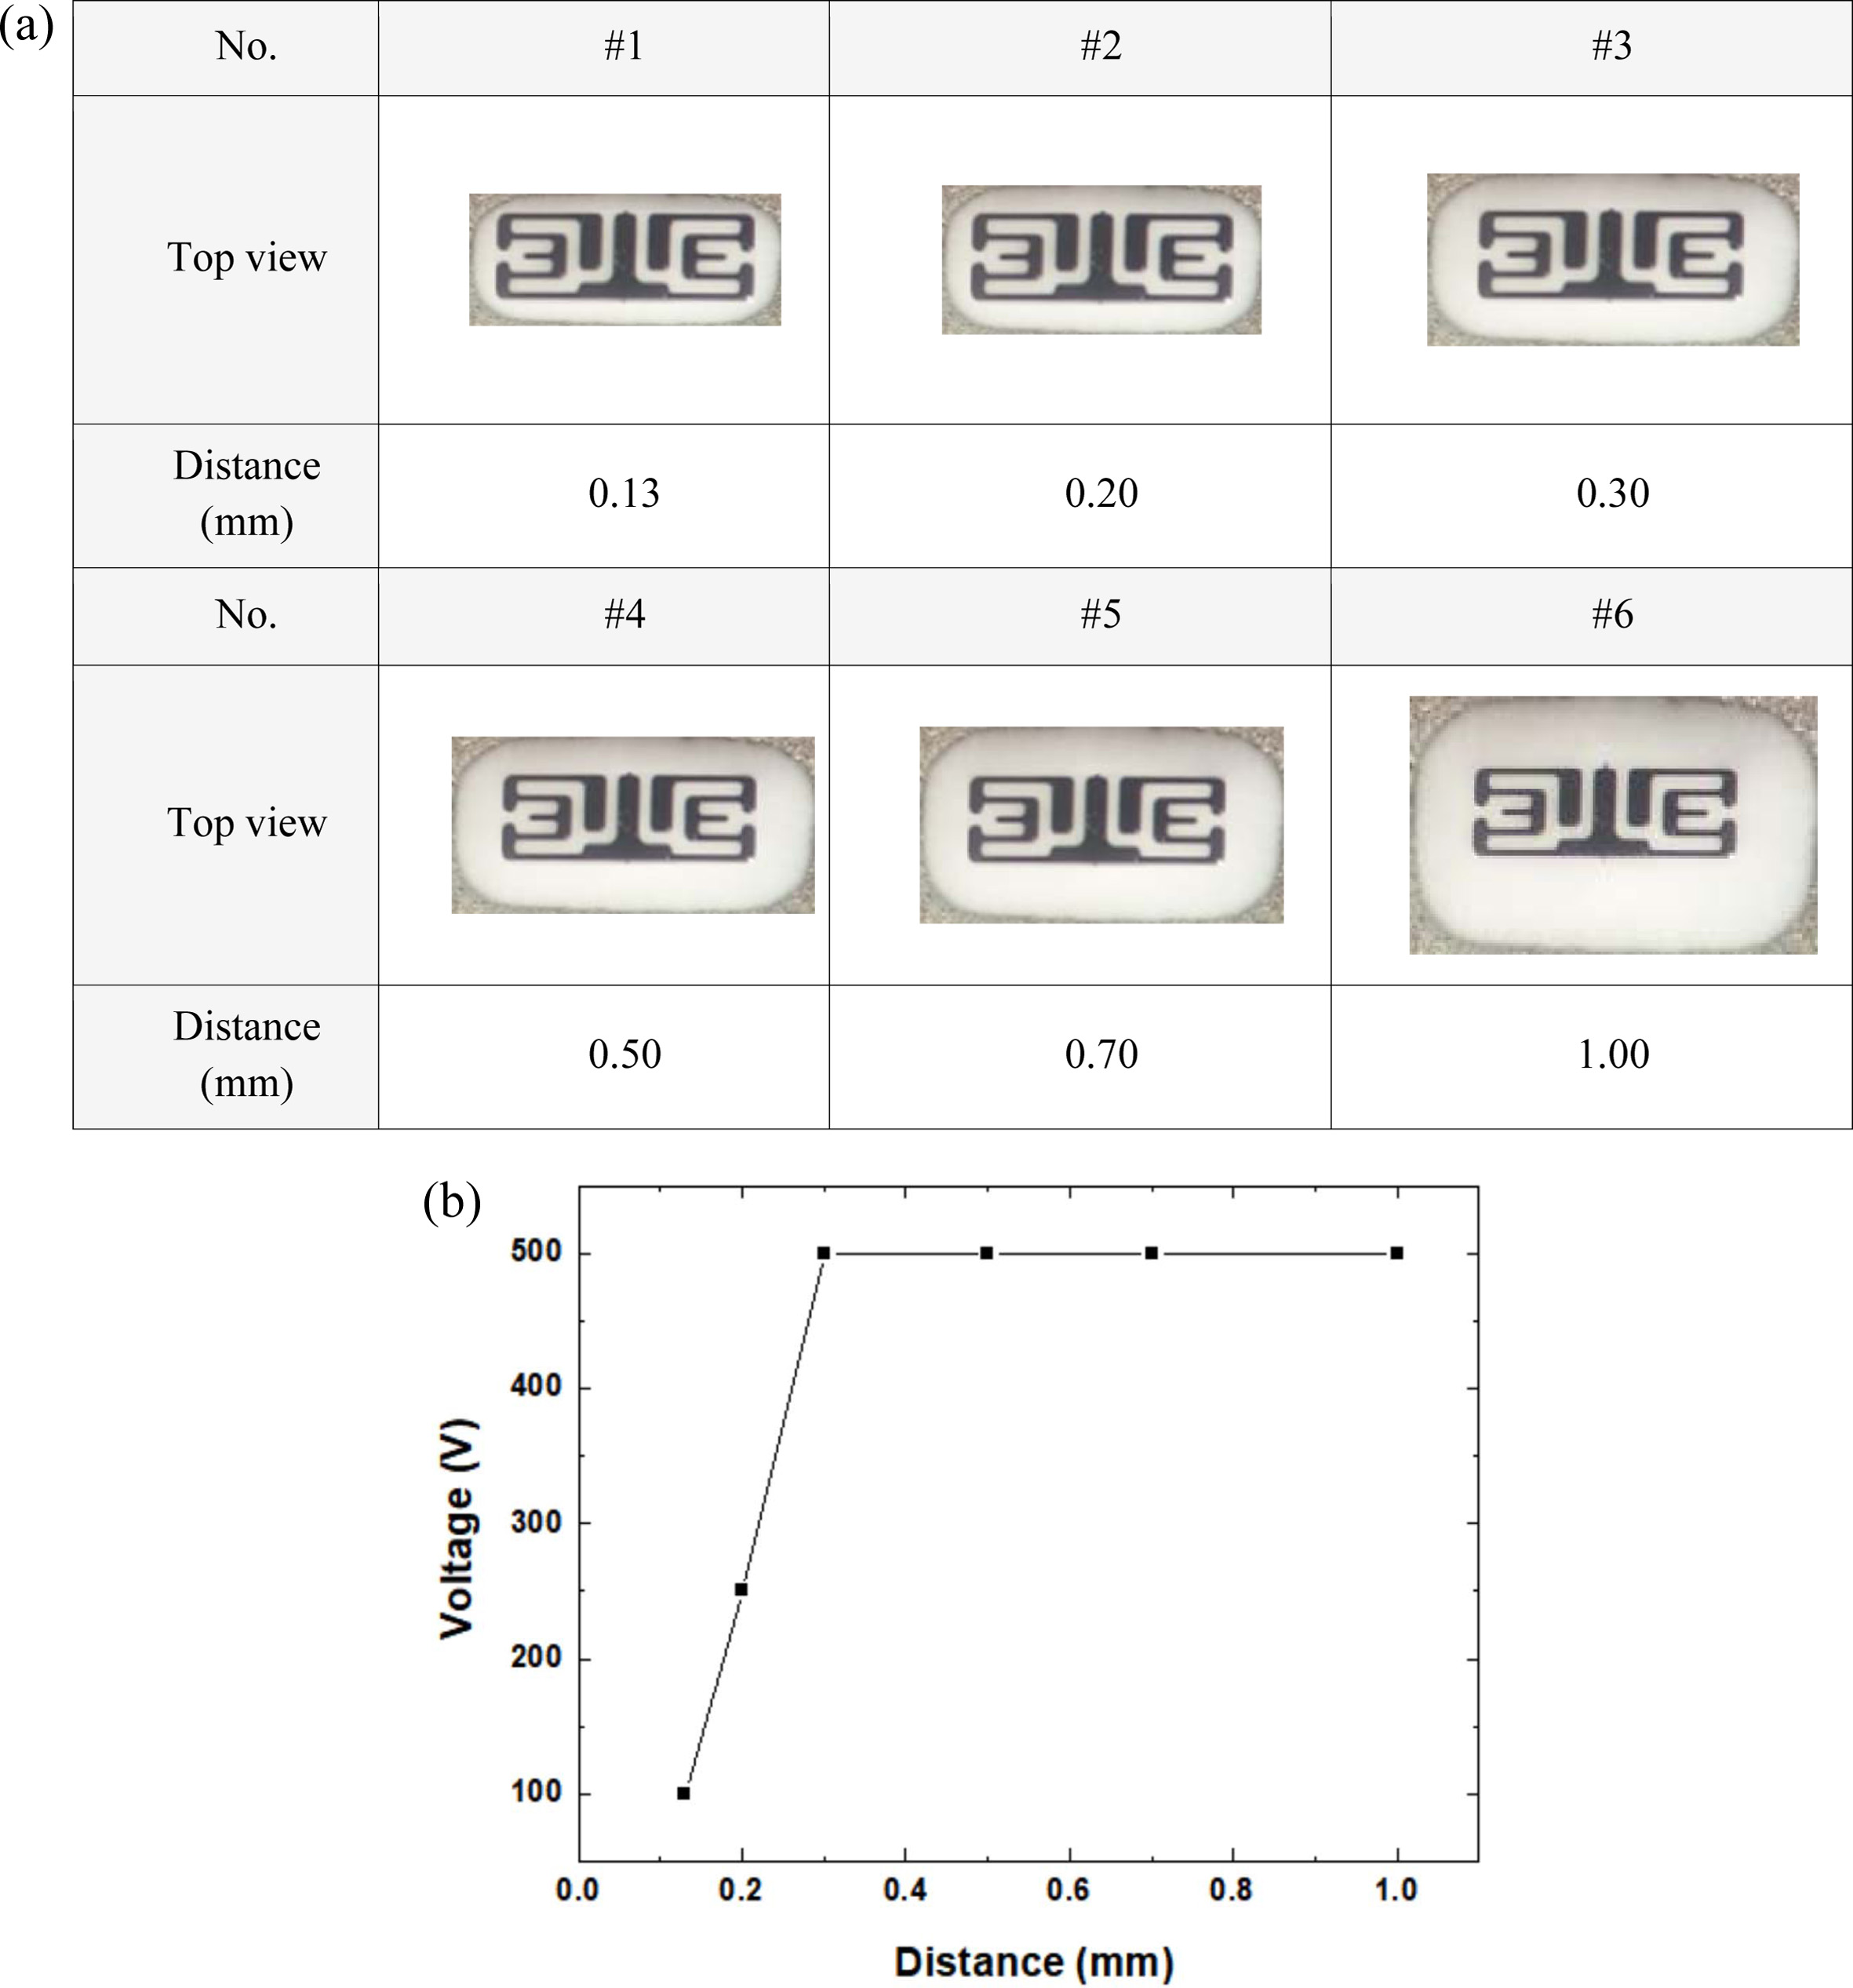
From Fig. 8(a), we can see the top view of the MEMS element bonded on top of the glass paste printing on the
diaphragm. To study the effect of the glass paste surface area, the size of the
window for the metal mask used by the screen printing process was varied.
To distinguish the effect of the applied surface, we used
the distance to the diaphragm when from the corner where the distance between
the diaphragm and MEMS element was
closest. When conducting this experiment, the viscosity of the glass paste was
set to minimize the porosity by using a rolling speed of 5 rpm and a mixing
time of 40 min.
The distance of the corner
where glass paste was printed in between MEMS element and diaphragm was increased
from 0.13~1.0 mm in 6 levels. Based on Fig. 8(b), which shows the insulation
property as a function of the distance to the corner, the withstand voltage
increases with the increase in the distance to the corner, until the distance
reaches 0.3 mm, at which point interval voltage saturates at 500 V. In this observation, we can conclude that the
withstand voltage performance is
greater than or equal to 500 V above a 0.3 mm distance. We can see that to achieve the desired withstand voltage performance, there are
correlations among the viscosity,
thickness, and surface area of glass
paste, which is used as the bonding agent between the Silicon MEMS element and metal diaphragm.
|
Fig. 2 The viscosity change according to the mixing process of the glass paste (rolling time and speed ball mill process). |
|
Fig. 3 The insulation voltage according to the rolling time during the mixing process of the glass paste. |
|
Fig. 4 The insulation performance with respect to glass layer thickness. |
|
Fig. 5 The cross-sectional observations (SEM) of glass pastes according to the rolling time (rolling speed: 5 rpm). |

|
Fig. 6 Structural correlation of the glass paste between the rolling time and porosity a structure with insufficient rolling time and structure of the glass paste with sufficient rolling time. |
|
Fig. 7 The insulation performance with respect to porosity. (a) Porosity with respect to rolling time (rolling speed fixed at 5rpm) (b) insulation characteristics with respect to porosity.. |
|
Fig. 8 (a) The top view of a Silicon MEMS element joined to the diaphragm surface along the surface on which the glass paste is applied. (b) The insulation voltage based on the length from the chip to the edge bonded from the glass paste. |
The primary factors affecting the withstand voltage
performance are the glass paste pore and thickness. Ball milling is the most
important process for the pore control of the glass paste. With sufficient
rolling time, the thickness of the glass bonding layer also must be more than a
certain critical thickness of around 100 mm to satisfy the withstand voltage performance requirements. Additionally, it was found that a certain amount of surface area is required to achieve the desired withstand voltage when a
MEMS element is bonded with glass paste. Therefore, it was found that the thickness and area of the glass bonding layer should be
optimized and the withstand porosity should be minimized or
removed to obtain excellent withstand
voltage characteristics in the pressure sensor bonding of the MEMS element.
- 1. W.J. Fleming, Sens. J. IEEE 1[4] (2001) 296-308.
- 2. L. Boon-Brett, J. Bousek, and P. Moretto, Int. J. Hydrogen Energy. 34[1] (2009) 562-571.
-

- 3. L. Boon-Brett, J. Bousek, G. Black, P. Moretto, P. Castello, T. Hübert, and U. Banach, Int. J. Hydrogen Energy. 35[1] (2010) 373-384.
-

- 4. W. J. Buttner, M. B. Post, R. Burgess, and C. Rivkin, Int. J. Hydrogen Energy. 36[3] (2011) 2462-2470.
-

- 5. R. Singh, Low Lee Ngo, Ho Soon Seng, and F.N.C. Mok, in Proceeding of the First IEEE International Workshop on Electronic Design Test and Applications, January 2002, edited by IEEE (IEEE, 2002) p. 181.
- 6. S.M. Sze, in “Semiconductor Sensors” (John Willey & Sons, 1994) p. 160-189.
- 7. K. N. Bhat and M. M. Nayak, J. ISSS. 2[1] (2013) 39-71.
- 8. L. Lin and W. Yun, in proceeding of Aerospace conference, March 1998, edited by IEEE (IEEE, 1998) p. 429-436.
- 9. D. S. Eddy and D. R. Sparks, in Proceeding of the IEEE, August 1998, edited by IEEE (IEEE, 1998) p. 1747.
-

- 10. S. Meti, K. B. Balavald, and B. G. Sheeparmatti, Int. J. Eng. Rese. Ind. Appl. 6[4] (2016) 23-31.
- 11. A. Hussain, M. Hannan, H. Sanusi, A. Mohamed, and B. Y. Majlis, J. Appl. Sci. 6[4] (2006) 810-815.
- 12. W. P. Eaton, J. H. Smith, D. J. Monk, G. O’Brien, and T. F. Miller, in Proceeding of SPIE, edited by SPIE (SPIE, 2007) p. 431-438.
-

- 13. M. Goel and S. Sharma, J. Electroceram. 12 (2004) 175-179.
-

- 14. H.-B. Jeon, I.-H. Lee, G. S. An, and Y.-S. Oha, J. Ceram. Process. Res. 19[6] (2018) 450-454.
- 15. K.-B. Kim, H.-K. Seok, Y.-S. Kim, J.-C. Yoon, D.-Y. Lee, C.-R. Chung, and D.-S. Han, J. Ceram. Process. Res. 7[3] (2006) 266-270.
- 16. G.-J. Lee and D.-K. Choi, J. Electroceram 41 (2018) 9-15.
-

 This Article
-
2020; 21(S1): 81-86
Published on May 31, 2020
- 10.36410/jcpr.2020.21.S1.s81
- Received on Dec 24, 2019
- Revised on Mar 30, 2020
- Accepted on Apr 2, 2020
 Services
Shared
 Correspondence to
- Gon-Jae Lee
-
aDepartment of Materials Science and Engineering, Hanyang University, Seoul, Korea
bR&D Center, Mando corporation, Sungnam, Korea
Tel : +82-2-6188-3343
Fax: +82-2-6188-3990 - E-mail: gonjae.lee@halla.com, gondolee@gmail.com


 Copyright 2019 International Orgranization for Ceramic Processing. All rights reserved.