


- Enhanced ionic conductivity and suppressed electronic conductivity of an Al- and Mn-added ceria solid electrolyte
Ji Young Park*
Department of Materials Science and Engineering, University of Seoul, Seoul 02504, Korea
Gd-doped ceria (GDC) is a
promising solid electrolyte for intermediate temperature solid oxide fuel cells
(IT-SOFCs) due to its high oxygen-ion conductivity. However, commercialization
is limited due to high grain boundary resistance and electronic conduction in
reduced conditions. In this work, Al- and Mn-added GDCs were designed to
overcome their weaknesses. GDC and Al- and Mn-added GDC powders were prepared
using spray pyrolysis and then sintered using spark plasma sintering technique
to obtain dense ceramic pellets. Additives enhanced the sinterability of the
ceria leading to an increase in ionic conduction. More importantly, electronic
conduction in GDC with the additives was suppressed under reduced conditions.
This demonstrates that Al- and Mn-added GDC is a possible candidate as a solid
electrolyte for IT-SOFCs.
Keywords: GDC, Additives, Ionic conduction, Electronic conduction
SOFCs (Solid oxide fuel cells) electrochemically generate
power in an environmentally friendly and efficient way by
directly converting the chemical energy of fuel gas into electric energy [1-3].
Compared to other types of fuel cells, SOFCs use relatively
inexpensive materials, have a
relatively high tolerance to fuel impurities, enable hybrid
operation, and have high efficiency. However, SOFCs operate at a high
temperature (> 700 oC), and therefore high temperature
alloys or expensive ceramic materials that can withstand high
temperature conditions are used in SOFCs [4-6].
Additionally, due to high temperature operation, the durability of materials
used in the manufacture of SOFCs degrades; therefore, many
studies have been conducted on fuel cells that operate at low temperatures. The
operating temperature of a SOFC depends greatly on the properties of the solid
electrolyte used [7-10].
Doped ceria, which has higher oxygen-ion conductivity
than that of doped zirconia has been intensively studied to replace doped
zirconia, a popular solid electrolyte [8-11]. However, it is known that the
reduction reaction is caused under low oxygen partial pressure (Po2)
condition (fuel condition in fuel cells) and causes the problem
of electron conduction [12, 13]. An equilibrium potential
(open circuit voltage, OCV) associated with power output, is a function of the
ionic transference number (ti = sion/(sion + selectron),
OCV = tiCln(P1/P2)
where C is a temperature-dependent constant, and P1
and P2 oxygen partial pressure on cathode and anode sides). When the
electronic conductivity is substantially lower than the ionic conductivity, ti
is 1; while high electronic conductivity leads to ti < 1,
and OCV decreases; this reduction in OCV degrades the power output of the fuel cell. In addition
to electronic conduction in a reducing environment, many cracks are generated
due to lattice expansion by Ce4+ ® Ce3+ [14].
Such a mechanical weakness in reducing
conditions has also prevented its commercialization as a solid electrolyte for
SOFCs. Therefore, it is necessary to develop doped ceria with high ti
and mechanical stability (note that electronic
conduction is related to mechanical properties in reduced conditions because the electronic charge carrier is produced
by Ce4+ ® Ce3+).
In this study, we have produced Al- and Mn-added ceria
with high ti. Ceria powders were synthesized using
ultrasonic spray pyrolysis (USP), a simple method for synthesizing
multi-component materials, and the samples were
quickly sintered using spark plasma sintering (SPS).
The preparation of a starting precursor solution to
synthesize Gd0.8Ce0.2O2 (GDC) powders was
carried out by mixing gadolinium nitrate (Gd(NO3)3 × 9H2O,
Aldrich, 99.9%), cerium nitrate (Ce(NO3)2 × 6H2O,
99%, Aldrich), ethylene glycol (Reagent
plus, > 99%, Aldrich) and citric
acid (Citric acid monohydrate, 99.5%, Daejung Chemical.
Co.) in pure water. The concentration was fixed at 0.1 M. The solution for
GDC-Al2O3-Mn2O3 (GDCAM,
GDC : Al2O3 : Mn2O3 = 97 vol % : 2
vol % : 1 vol %) nano-powder was mixed in the same manner.
Aluminum nitrate (Al(NO3)3×9H2O, Alfa, 98%)
and manganese nitrate (Mn(NO3)2×6H2O, Kanto,
98%) were added to the starting solution for GDC to prepare GDCAM. The solution
mists were generated at a frequency of 1.6 MHz in an ultrasonic atomizer with
transducer operation and were carried into a furnace preheated at a given
temperature (900 oC). After the powder was collected, the spark
plasma sintering technique was carried out to make high-density pellets of GDC
and GDCAM. Each powder was filled with a cylindrical graphite die of 5 mm
radius, heated to 1400 oC at a rate of 100 oC/min
while a pressure of 80 MPa was applied, and sintered for 5 min.
The
crystal structure of the as-synthesized powders and sintered pellets was
characterized by X-ray diffractometer (XRD,
Rigaku, D-2500). The morphology and microstructures of nanopowders were characterized by field
emission scanning electron microscopy (FE-SEM, Hitachi S-4800). The
distribution of elements was detected using energy dispersive X-ray analysis
spectroscopy (EDS).
The relative density of the sintered samples was determined
by the Archimedes method. Bending strength tests for
the sintered samples were also conducted. For electrical measurements, platinum
ink was painted on either side of the pellet and heated at 800 °C for 2 h
to act as an electrode as well as an electric current
collector. The electrical resistance was measured using two-probe
ac techniques as a function of temperature under air and reducing atmosphere (5
% H2/N2-balance). In order to ensure sufficiently fast
oxygen exchange at the interface of the sample, resistance was measured twice
with increasing and decreasing temperature in the temperature range of
230-550 °C at a fixed Po2. For the reducing environment test,
the temperature was swept two times in a range of
230-550 °C. The first experiment was conducted within 12 h
under reducing condition (short-term test where the swept temperature was 230 oC ® 550 oC ® 230 oC). In the
second-time experiment, the resistance of the specimen
already exposed under the reducing environment for 12 h was measured again in
the same environment for 12 h (long-term test where the swept temperature was
230 oC ®
550 oC ®
230 oC). As another test, resistance was examined as a function of
time under the reducing condition (5 % H2/N2-balance gas
was used) to determine whether the Al- and Mn- added sample prevents electronic
conduction in a reduced atmosphere.
AC impedance spectra were obtained in the frequency
range of 1 Hz to 10 MHz using an impedance analyzer (Material
Mates 7260), and the Z-view program (Scribner Associates)
was used for the fitting of data.
The solid state reaction, precipitation and sol-gel methods
are representative ceramic processing techniques used for the
synthesis of solid electrolytes of SOFCs [15, 16]. However, it is difficult to
achieve optimal powder characteristics for multi-component materials with these
methods, because the materials must be subjected to subsequent calcination and
mixing steps. Moreover, the multi-component materials obtained by such methods
can be unintentionally agglomerated without even distribution; these phenomena
deteriorate as particle sizes decrease to nanoscale. By
implementing USP, a simple and versatile synthetic method, GDC
powders were obtained.
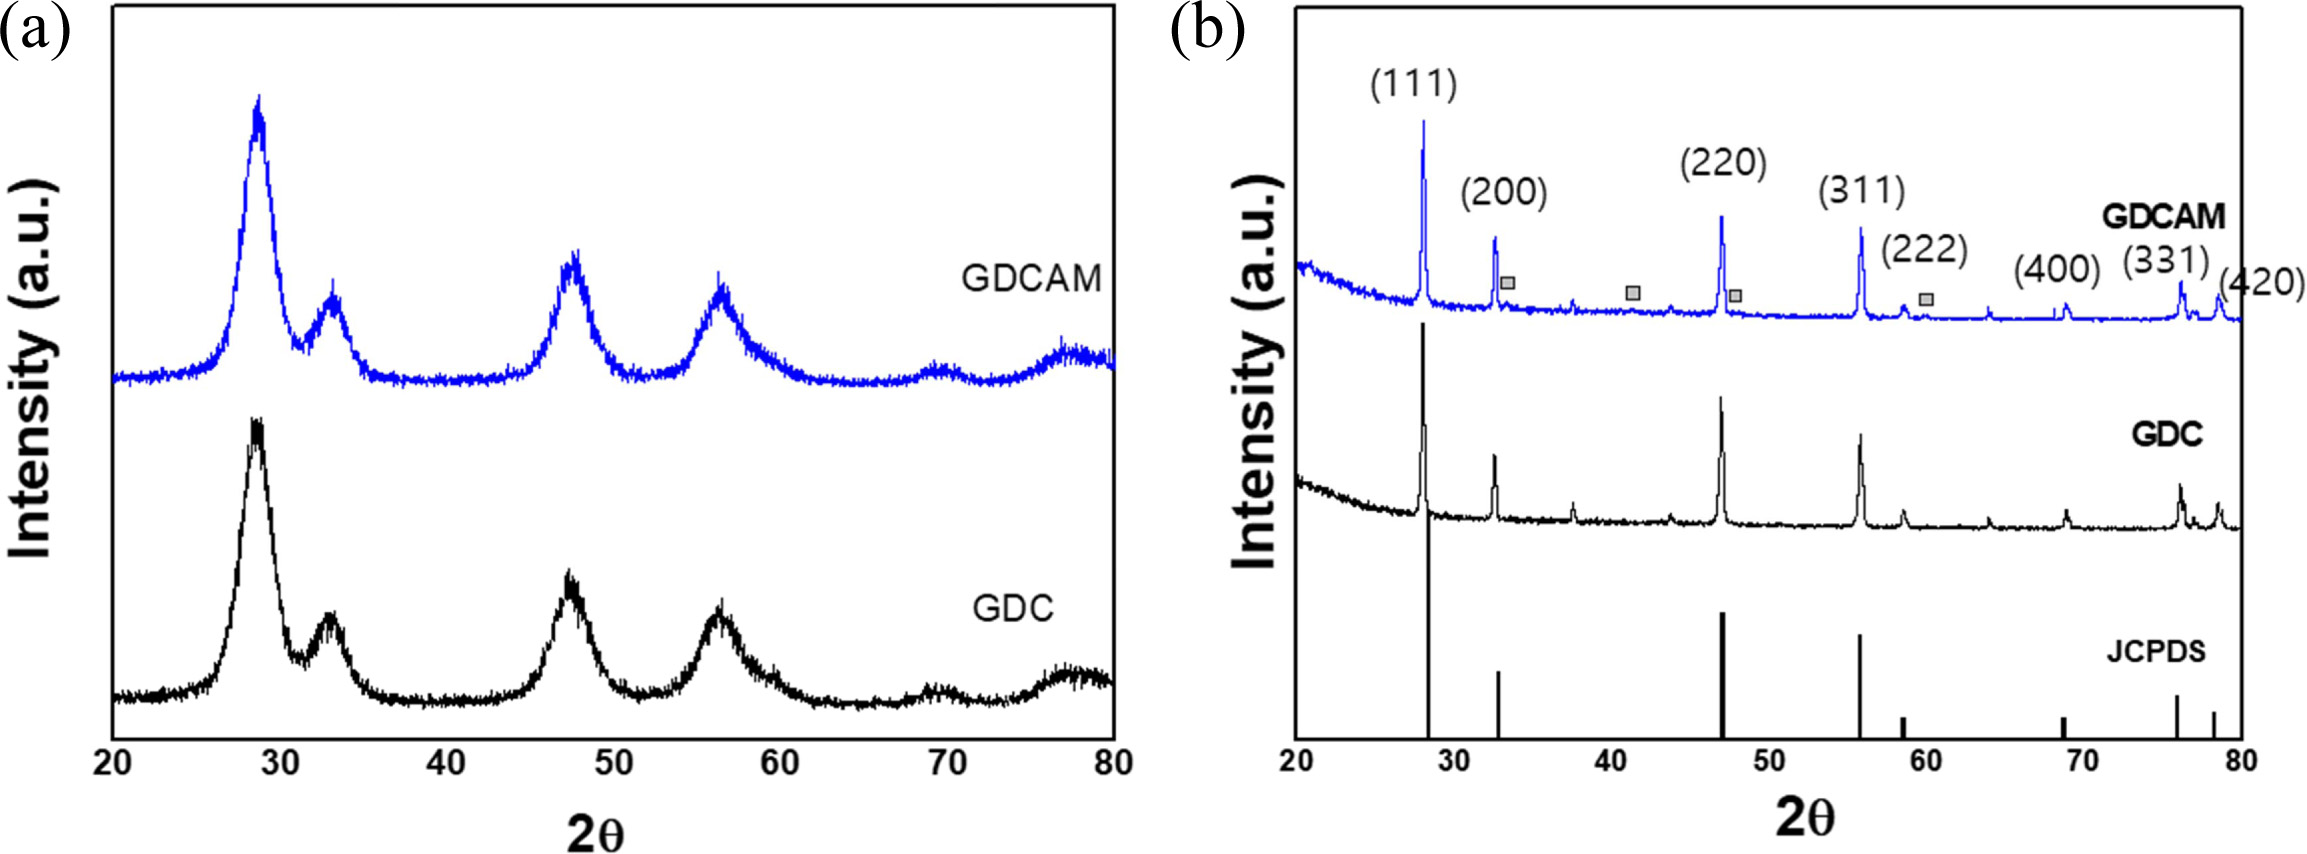
Fig. 1 shows the XRD patterns of (a) as-synthesized
powders and (b) sintered pellets of GDC and GDCAM. As seen, the
detected peaks for both cases were matched with JCPDS
peaks of CeO2, indicating that the desired fluorite cubic-crystal
structure (space group : Fm3 ̅m) was well formed. However, the peaks of
as-synthesized powders are not sharp but broad. This peak broadening is
attributed to the nano crystal size of the powder, ~ 10 nm, which was
calculated from Sherrer’s equation with the
broadening. Additional peaks detected in the sintered pellet
of GDCAM were GdAlO3, which is a well-known secondary
phase formed in ceria and alumina composites [17].
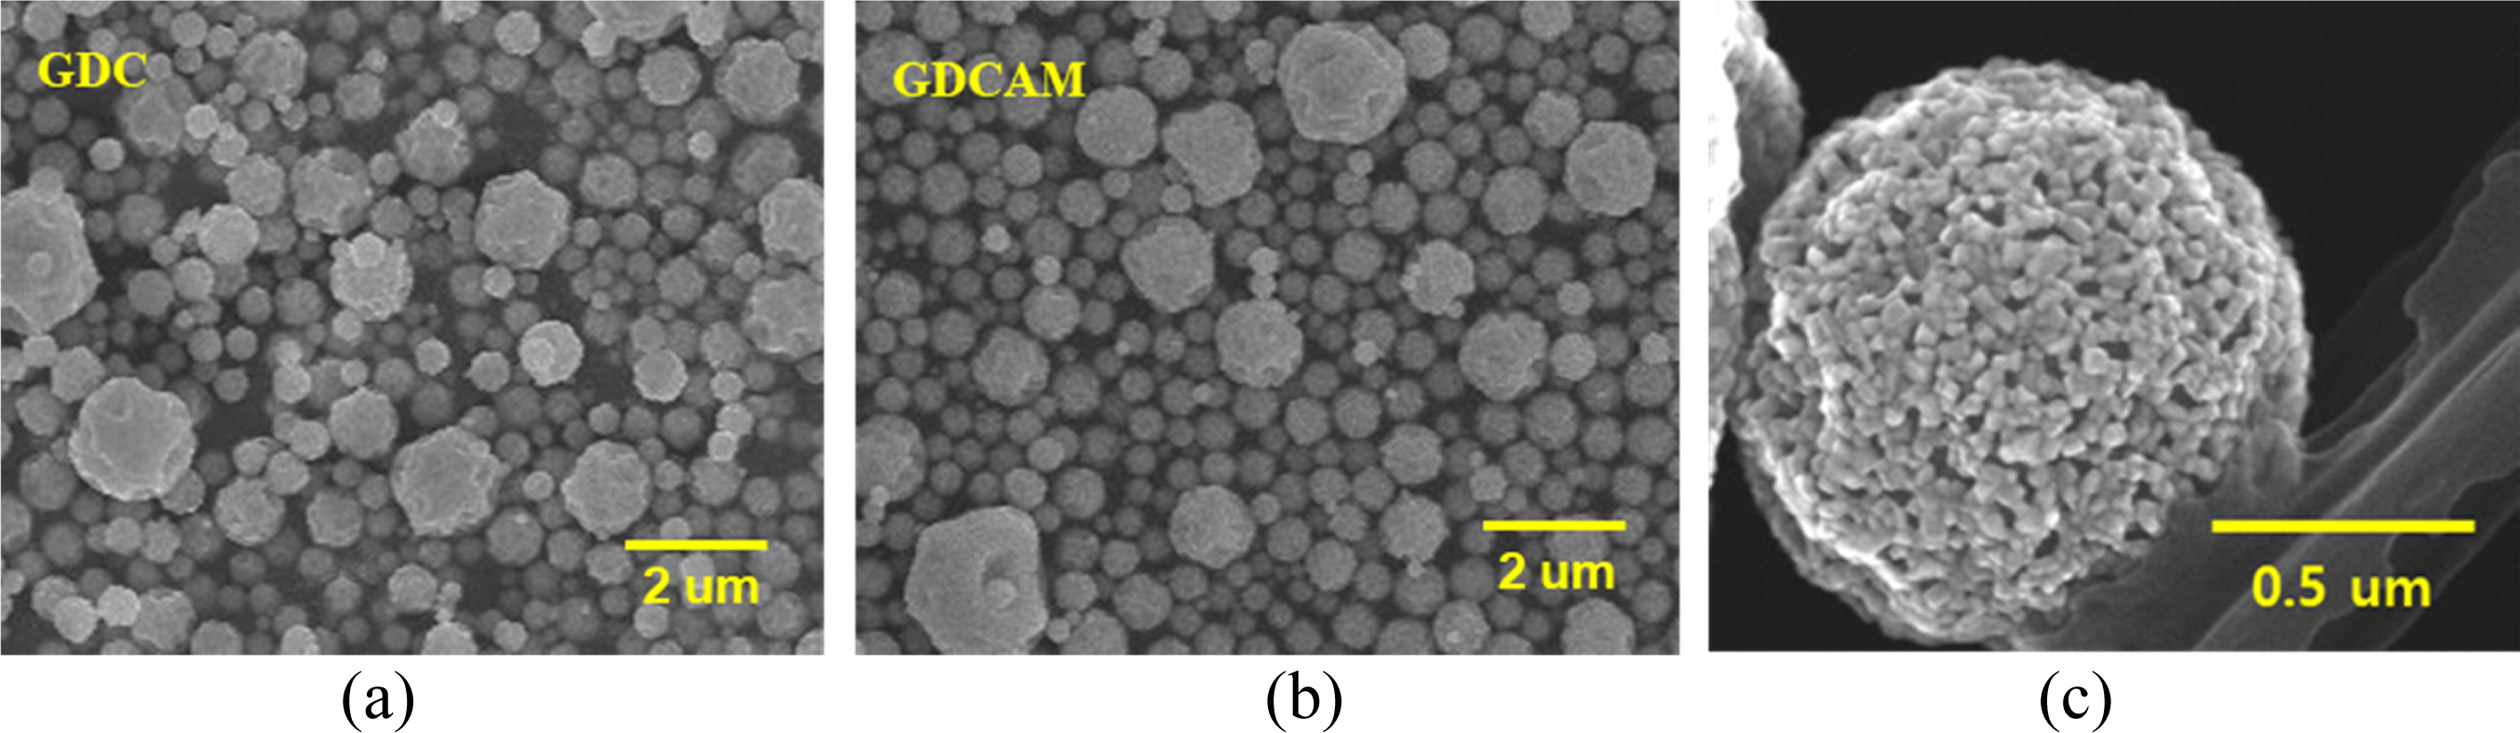
The microstructures of the ceria powders were investigated
using SEM, as seen in Fig. 2. As-prepared powders had near-spherical
morphologies with an average size of
~ 0.95 mm. The spherical powders are the secondary particles consisting of primary nanoparticles. They were pelletized and then quickly sintered
at 1,400 oC using SPS (the relative densities of the green
samples were in the range of 45~50%).
After sintering, the relative
densities of GDC and GDCAM, measured by the Archimedean method, were ~ 94% and 96%, respectively. The obtained densities were
relatively high compared with the reported results prepared by
conventional solid-state reaction
[9]. In particular, GDCAM was highly
sintered (note that this high density
is reported to be achieved above 1,500 oC) [9]. The
microstructure and element distribution of the sintered body of GDC and GDCAM
were also investigated by SEM and EDS (the atomic percentages of Ce, Gd, Al and
Mn were 78.4, 18.3, 1.9 and 1.4, respectively), and high density and homogeneous element distribution
were shown. Furthermore, the presence
of this high density and secondary
phase in GDCAM enhances the mechanical
properties of ceria. The measured bending strength of GDC and GDCAM were
~ 90 MPa and ~ 115 MPa, respectively.
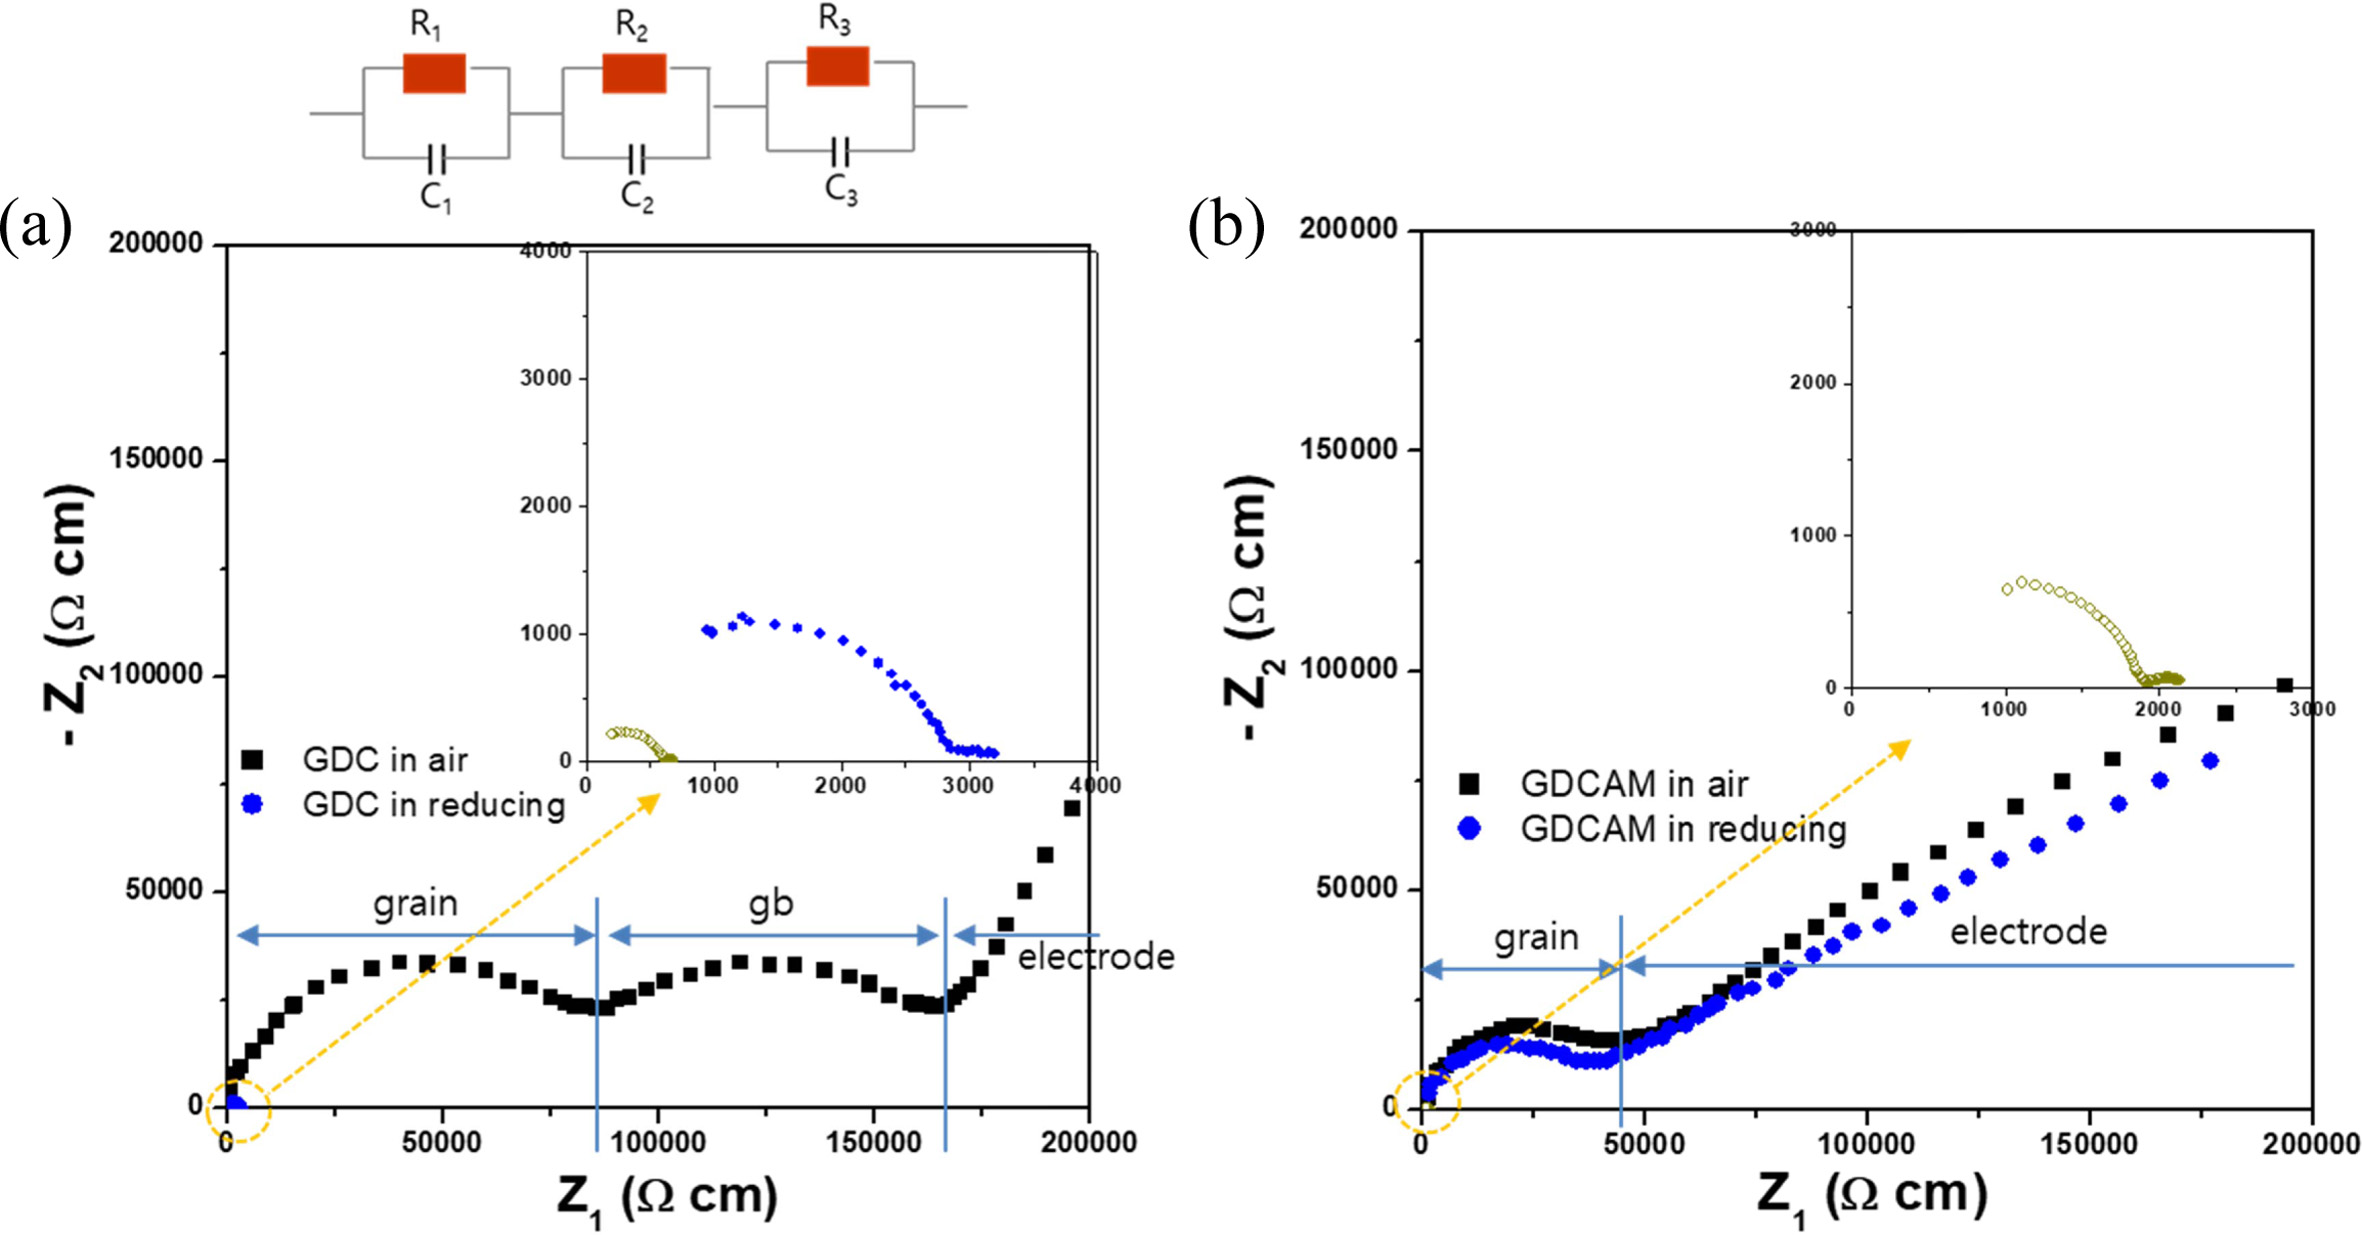
Electrical characteristics of GDC and GDCAM were investigated
as follows. Fig. 3 shows their representative impedance
data measured in air and reduced conditions (short term and long term),
respectively. As seen in the figure, typical impedance spectra of
conducting ceramics were observed. In Fig. 3(a), the spectrum consists
of three parts corresponding to the grain, grain boundary (gb), and electrode,
in that order, as indicated (note that the arcs corresponding to the grain and
gb are almost semicircular, and the signals corresponding to the electrode are
also imperfect arcs, but partially shown). Those parts are generated from the
three respective resistances and capacitances (R1C1-R2C2-R3C3,
series equivalent circuit) of grain, gb and electrode. From the impedance
patterns and equivalent circuits, the grain and gb resistances (Rgrain,
Rgb) were obtained (R1C1 and R2C2
were estimated for the grain and the gb by fitting the impedance
spectrum using a corresponding equivalent circuit
based on a bricklayer model: R1 = Rgrain, R2
= Rgb). The total resistance of GDC, the summation of the
grain and gb resistances, was also calculated. A notable point is that the arcs
of the grain and gb of GDC became small in reduced condition, showing that the
resistances of the grain and gb greatly decreased. When the sample was exposed
in reduced condition for a long time, the arcs shrank further (the inset figure
shows the pattern of GDC in reduced conditions). On the other
hand, the pattern of GDCAM remained almost unchanged
for a while, as shown in Fig. 3(b), even though it eventually shrank after long-time
exposure (inset figure). Decreasing the size of the arc means less resistance,
which is attributed to the generation of electronic conduction by Ce4+
® Ce3+ under a
reducing environment in ceria.
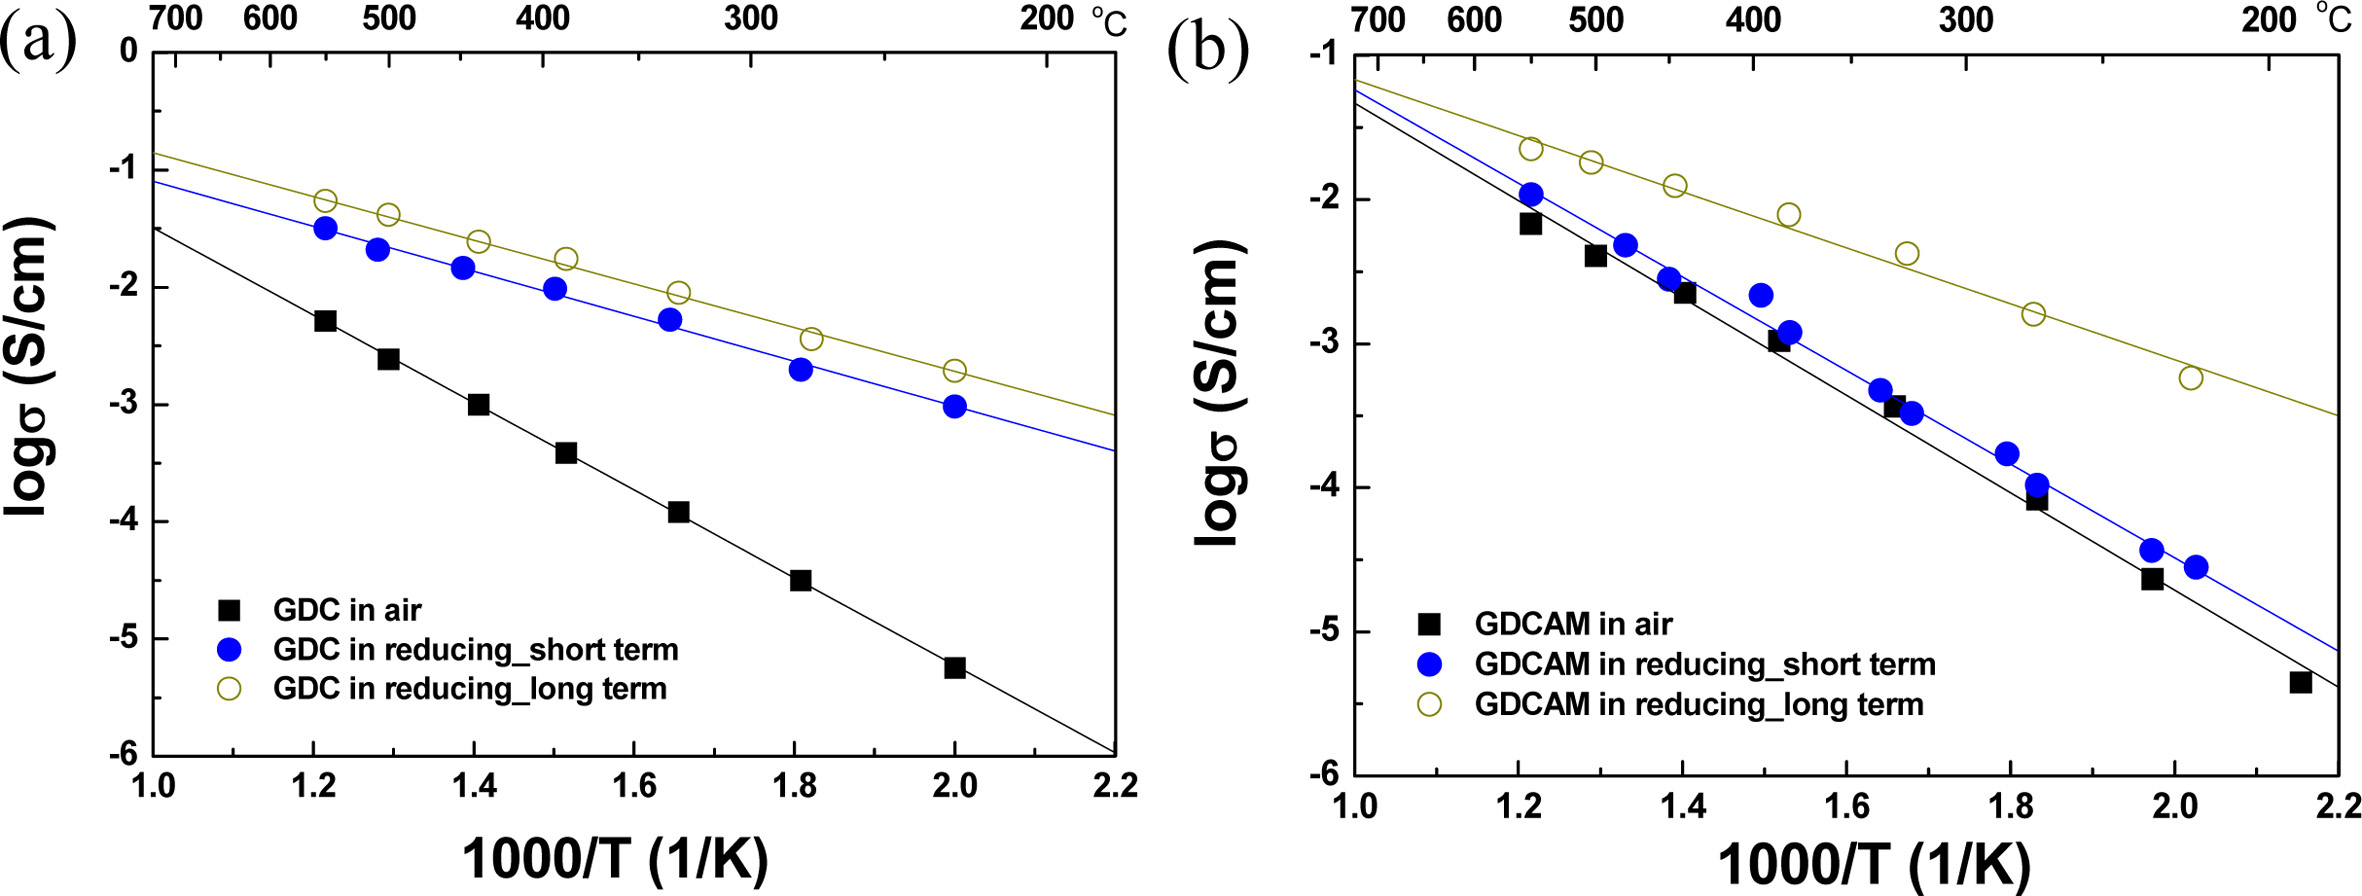
The temperature dependences of the
total conductivities (stotal =1/( Rgrain + Rgb)¡¿L/A,
L and A being the length and area of the specimen) computed from the resistances are exhibited in Fig. 4(a) and (b). In this figure,
the solid rectangular symbol represents the stotal of GDC in air. The activation energy (Ea)
is about 0.74 eV, indicating that the main charge carrier is the oxygen ion
[18]. As expected from the impedance patterns, the stotal of GDC greatly increased in reduced conditions (solid blue
symbol). After long-time exposure (open circle symbol), it increased further;
on the other hand, in the short term, stotal (GDCAM) in the reducing environment was very similar to that in an air atmosphere (see Fig.
4b). This means that even in a reducing environment, ionic conduction is still a dominant charge
carrier for the short term, and thus even in a reducing environment, the ionic
transference number (ti) is near 1. However, stotal eventually greatly changed after long-time exposure in reducing conditions, showing that GDCAM can suppress the electronic conduction
generated by cerium reduction (Ce4+ ® Ce3+) for a limited time. One
interesting thing is that the stotal of
GDCAM is still lower than the stotal of
GDC, even though it is greatly changed after
the long-term exposure. This
means that the additives (Mn or Al) play a role in preventing cerium reduction.
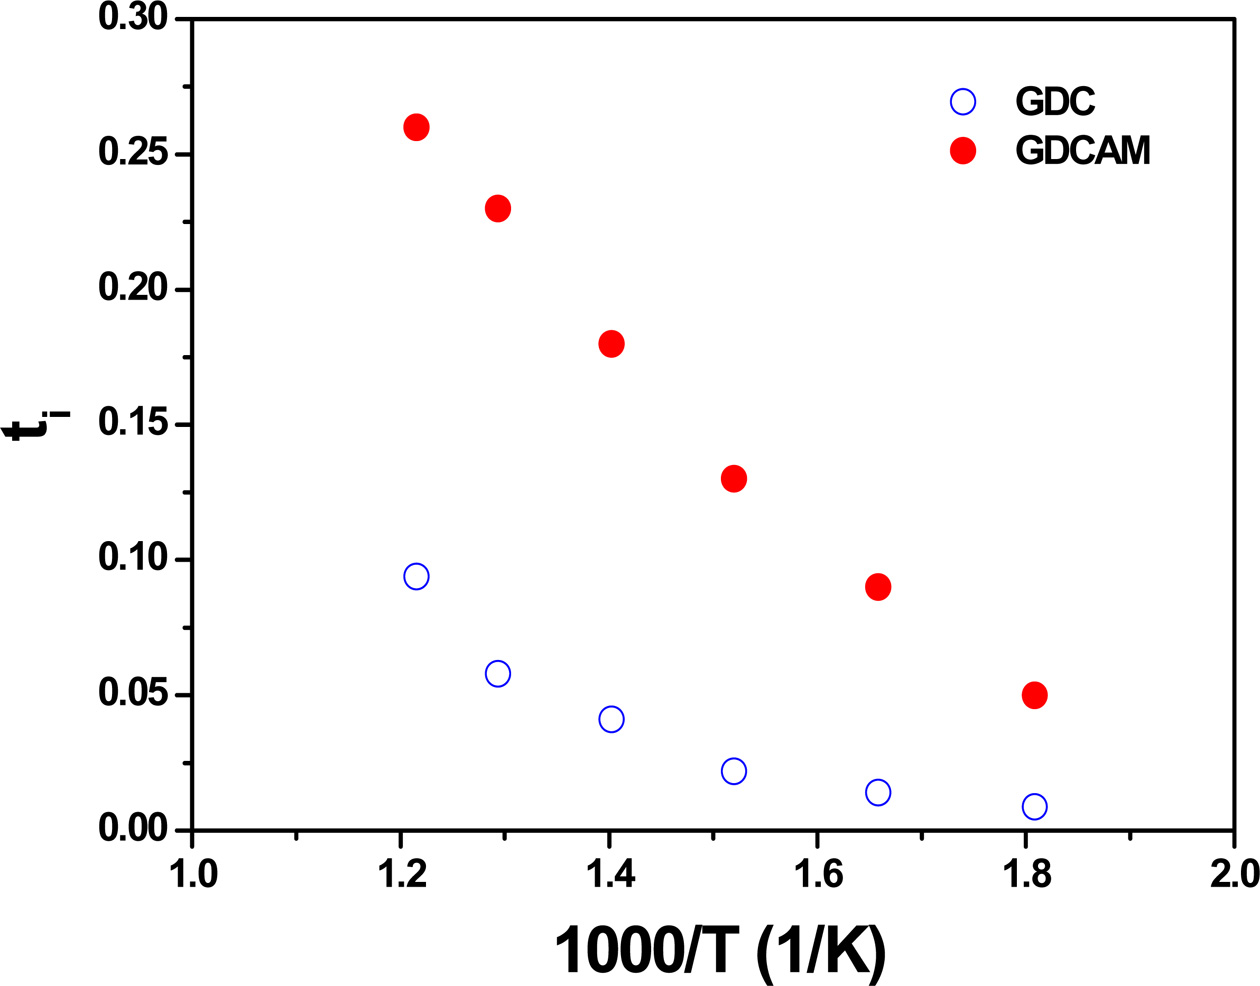
Based on conductivity in air and in reducing atmosphere
(long-time exposure), ti was calculated and is shown in Fig.
5. As seen in the figure, ti of GDCAM is higher than that of
GDC, showing that GDCAM suppresses electron conduction in reducing conditions.
This result demonstrates again that Al and Mn additions are
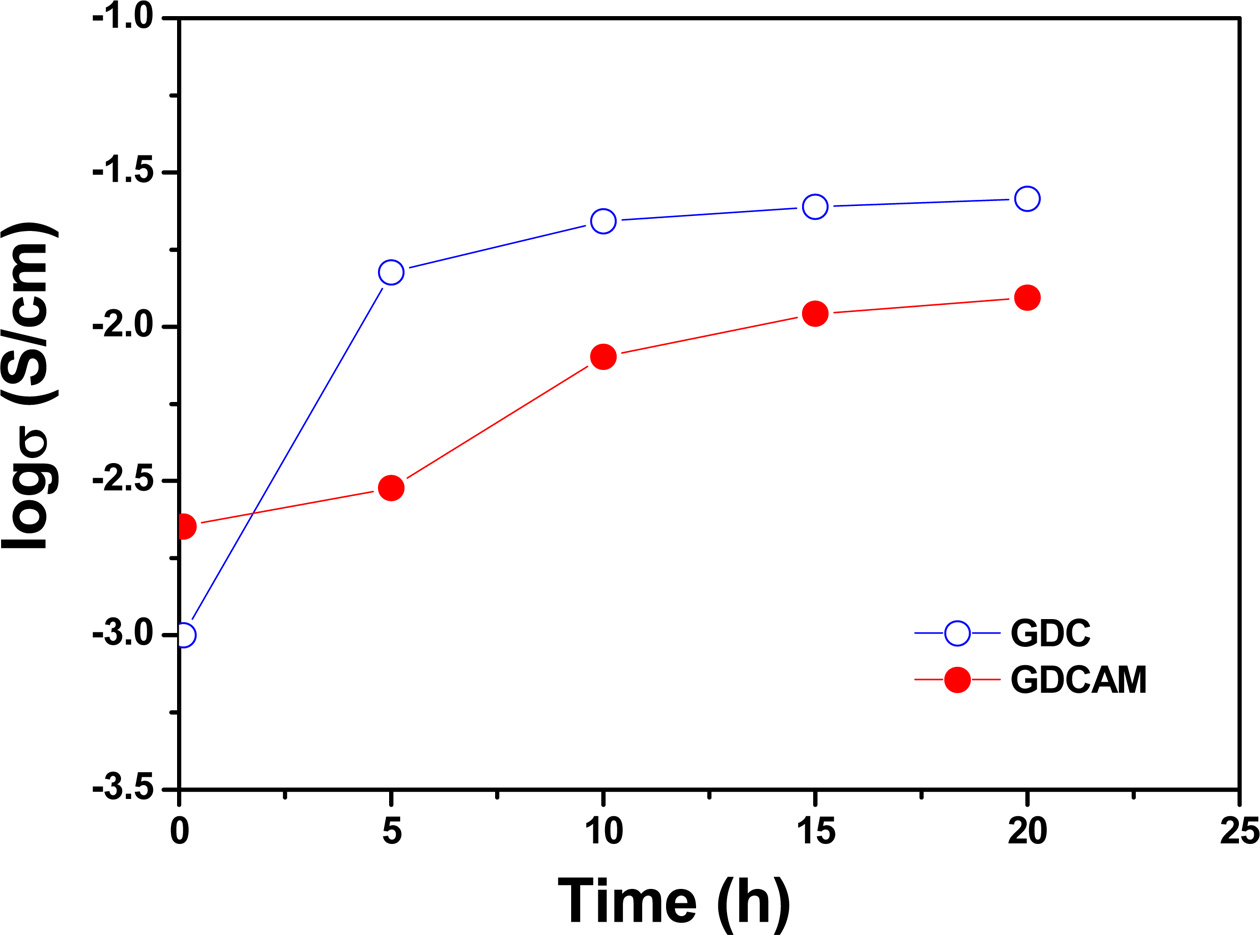
effective in reducing Ce-reduction. Fig. 6 shows the time
dependence of tis in GDC and GDCAM. The results confirm the
suppression of the electronic conduction of GDCAM in reducing conditions.
As another effect of adding Al and Mn
elements, stotal in
air is increased compared to purely that of GDC, showing improved oxygen ionic
conductivity (compare with totals of GDC (Fig. 4a) and GDCAM
(Fig. 4b)). The stotal of GDCAM in air is also competitive or higher than the reported ionic
conductivities. For example, the stotal of GDCAM at 500 oC is 0.004 S/cm and the reported values by S. Dikment et al. and H. Kim et
al. are ~ 0.0009 S/cm and 0.002 S/cm
at the same temperature and oxygen partial pressure [9, 11]. It is believed
that successfully synthesized nanoparticles using USP and multi-components (Al
and Mn) increase the sinterability of ceria. The sample fabricated using
conventional ceramic processing (solid-state reaction) shows a relative density
below 95 % [9]. In this study, it was observed that increasing sinterability
decreases grain and gb resistance (compare the gb resistances between Fig. 3a
and b). The relative densities of GDC and GDCAM are ~ 94% and 96%,
respectively.
Conclusively, the addition of Al and Mn to ceria decreases
total resistance, the summation of the grain and gb resistance, and more
importantly, suppresses the electronic conduction in reducing atmosphere in
ceria, demonstrating that it can be a viable solid electrolyte for IT-SOFC.
|
Fig. 1 X-ray diffraction patterns of GDC and GDCAM (a) powders and (b) sintered pellets. In Fig. 1b, the square marks indicate the secondary phase (GdAlO3). |
|
Fig. 2 FE-SEM images of as-prepared powders of (a) GDC and (b), (c) GDCAM. |
|
Fig. 3 The complex impedance plots of (a) GDC and (b) GDCAM at 230 oC. Solid square symbols indicate the impedance patterns of GDC and GDCAM in air, and solid and open circles in the inset correspond those of GDC and GDCAM in reducing condition for short and long terms, respectively. |
|
Fig. 4 Arrhenius plots of the total conductivities of (a) GDC and (b) GDCAM in various atmospheres. |
|
Fig. 5 Ionic transference numbers of GDC and GDCAM as a function of temperature. |
|
Fig. 6 The total conductivities of GDC and GDCAM at 440 oC and in reducing condition as a function of time. |
In this study, Al- and Mn-added GDC was designed to
overcome some weakness of a ceria solid electrolyte such as low sinterability
and electronic conduction generation. GDC and Al- and Mn-added GDC powders were
synthesized using USP and then sintered using spark plasma sintering technique.
As a result, the successfully dense pellets were obtained. The addition of Al
and Mn components enhanced the relative density of the ceria leading to an
increase of the ionic conduction and mechanical strength. More importantly,
this addition suppressed the electronic conduction of ceria in
reducing atmosphere, which is a major problem in the
commercialization of ceria as a solid electrolyte for IT-SOFCs.
I am very grateful to Prof. Y. Choa and Prof. H. Park for
helping me synthesize powder and some experiments.
- 1. B.C.H. Steele and A. Heinzel, Nature 414 (2001) 345-352.
-

- 2. N.Q. Minh, J. Am. Ceram. Soc. 76 (1993) 563-588.
-
- 3. T. Suzuki, Z. Hasan, Y. Funahashi, T. Yamaguchi, Y. Fujishiro and M. Awano, Science 325 (2009) 852-855.
-
- 4. Z. Shao and S.M. Haile, Nature 431 (2004) 170-173.
-
- 5. W. Zhou, R. Ran and Z. Shao, J. Power Sources 192 (2009) 231-246.
-
- 6. H.J. Park, T.G. Kim, C. Kwak, D.W. Jung, S.M. Lee and K.H. Lee, J. Power Sources 275 (2015) 884-887.
-
- 7. Z. Tianshu, P. Hing, H. Huang and J. Kilner, Solid State Ionics 148 (2002) 567-573.
-
- 8. J.G. Cheng, S.W. Zha, J. Huang, X.Q. Liu and G.Y. Meng, Mater. Chem. and Phys. 78 (2003) 791-795.
-
- 9. H.N. Kim, H.J. Park and G.M. Choi, J. Electroceram. 17 (2006) 793-795.
-
- 10. L. Ge, R. Li, S. He, H. Chen and L. Guo, J. Power Sources 230 (2013) 161-168.
-
- 11. S. Dikmen, P. Shuk, M. Greenblatt and H. Gocmez, Solid State Sciences 4 (2002) 585-590.
-
- 12. R.T. Leah, N.P. Brandon and P. Aguiar, J. Power Sources 145 (2005) 336-352.
-
- 13. S. Wang, T. Kobayashi, M. Dokiya and T. Hashimoto, J. Electrochem. Soc. 147 (2000) 3606-3609.
-
- 14. B. Wang, B. Zhu, S. Yun, W. Zhang, C. Xia, M. Afzal, Y. Cai, Y. Liu, Y. Wang and H. Wang, NPG Asia Materials 11 (2019) 51.
-
- 15. A. Arabaci and M.F. Oksuzomer, Ceramics International 38 (2012) 6509-6515.
-
- 16. D. Kashyap, P. K. Patro, R. K. Lenka, T. Mahata and P.K. Sinha, Ceramics International 40 (2014) 11869-11875.
-
- 17. H. J. Park and G.M. Choi, Solid State Ionics 178 (2008) 1746-1755.
-
- 18. J.D. Nicholas and L.C. De Jonghe, Solid State Ionics 178 (2007) 1187-1194.
-
- 19. Y.J. Kang and G.M. Choi, Solid State Ionics 180 (2009) 886-890.
-
- 20. Y.J. Kang, H.J. Park and G.M. Choi, Solid State Ionics 179 (2008) 1602-1605.
-
 This Article
-
2020; 21(S1): 63-67
Published on May 31, 2020
- 10.36410/jcpr.2020.21.S1.s63
- Received on Jan 28, 2020
- Revised on Apr 6, 2020
- Accepted on Apr 14, 2020
Services
- Abstract
introduction
experimental
results and discussion
conclusions
- Acknowledgements
- References
- Full Text PDF
Shared
Correspondence to
- Ji Young Park
-
Department of Materials Science and Engineering, University of Seoul, Seoul 02504, Korea
Tel : +82-2-6490-2400
Fax: +82-2-6490-2404 - E-mail: tojyp19@uos.ac.kr
Clean-Energy Research Institute(CRI), Hanyang University, 222, Wangsimni-ro, Seongdong-gu, Seoul, 04763, Korea
E-mail: jcpr@hanyang.ac.kr