


- Citric acid stabilized iron oxide nanoparticles for battery-type supercapacitor electrode
Seungil Parka, C. Justin Raja, Ramu Manikandanb, Byung Chul Kimb and Kook Hyun Yua,*
aDepartment of Chemistry, Dongguk University, Jung-gu, Seoul-04620, Republic of Korea
bDepartment of Printed Electronics Engineering, Sunchon National University, 255, Jungang-ro, Suncheon-si, Jellanamdo 57922, Republic of Korea
We report the synthesis of citrate
stabilized iron oxide (C-Fe3O4) spherical nanoparticles
for supercapacitor electrodes. The citrate functional group present in the
surface of the Fe3O4 nanoparticles effectively controls
the morphology and the surface area of the nanostructures. The C-Fe3O4
electrodes exhibited a battery-like energy storage properties with a
maximum specific capacity of 146 Cg-1 (242 Fg-1) which is much higher than the specific capacity of
citrate free Fe3O4 electrode (62 Cg-1; 112 Fg-1). Moreover, the C-Fe3O4
electrode showed better cyclic stability (75%) than the citrate free Fe3O4
electrode (~35%) after 1000 charge/discharge cycles.
Keywords: Ion oxide, Nanoparticle, Supercapacitor
Transitional metal oxides (TMOs) are the potential pseudocapacitive
electrode materials as they have multiple valence
states of the metal ions that could enable a fast-faradaic redox reaction near
to the surface region. In the recent past, a variety of TMOs
such as RuO2, MnO2, Co3O4,
NiO, Fe3O4 was studied for their capacitive performance
[1-3]. Among all these transition metal oxides, iron oxides exhibit considerable
attractions due to their low toxicity, natural
abundance, low cost, environmental friendliness and rich redox
chemistry and having multiple applications due to their unique structural, electrical
and magnetic properties [4, 5]. Generally, iron oxides are
promising negative electrode materials for supercapacitors owing to its
excellent electrochemical performance in the negative potential window
with a high theoretical capacitance [6]. However, few researchers have
been reported Fe3O4 as a positive electrode material and
displayed considerable electrochemical performances which are
even comparable or higher than the well-known TMOs like Co3O4,
MnO2, CuO etc., [7, 9].
In general, the metal oxides nanoparticle synthesized
through conventional chemical techniques suffers from the agglomeration of
nanoparticles, which significantly leads to the formation of large-sized
particles with poor surface area and porosity [10]. In order to overcome this
issue, the Fe3O4 surface should be stabilized with citric
acid via the coordination bond which can be acted as a promising catalyst for
the formation of pyrimidine derivative compound. Further, high surface area of
CA anchored Fe3O4 also plays a significant role to determine their
catalytic performance [11]. As the electrochemical
performance of the supercapacitor electrode
highly depends upon the surface area and porous nature of the electroactive materials, it is important
to control the size and modifying the porosity of the nanoparticles to provide
large electroactive surface area for the effective charge-storage process.
Considering these crucial electrochemical factors, we
synthesized water dispersible, citrate stabilized Fe3O4
nanoparticles and utilized for the fabrication of supercapacitor
electrode. The citrate stabilization considerably controls the
particle size, surface area and porosity of the Fe3O4
nanoparticles and the fabricated electrode exhibited an
excellent battery-like charge storage property in the
positive potential window.
The water-dispersible citrate capped iron oxide (C-Fe3O4)
was prepared according to the synthesis procedure reported in our previous work
[12]. In brief, FeCl3·6H2O (0.016 mol) and
FeCl2·4H2O (0.008 mol) were dissolved in 80 ml deionized
(DI) water and reflexed for 30 min at 70 °C under argon atmosphere. Subsequently,
the 20 mL of 28% ammonia solution was added slowly to the mixture until the
formation of a black turbid solution. Then, 4 mL of 2.6 M citric acid solution
was added to the reaction mixture and the temperature was raised to 90 °C under refluxing condition and maintained for 60 min. Finally, the mixture
was cool down to the room temperature and the C-Fe3O4
nanoparticles were centrifuged, washed repeatedly and dispersed in DI water. The citrate free Fe3O4
nanoparticles were synthesized by the
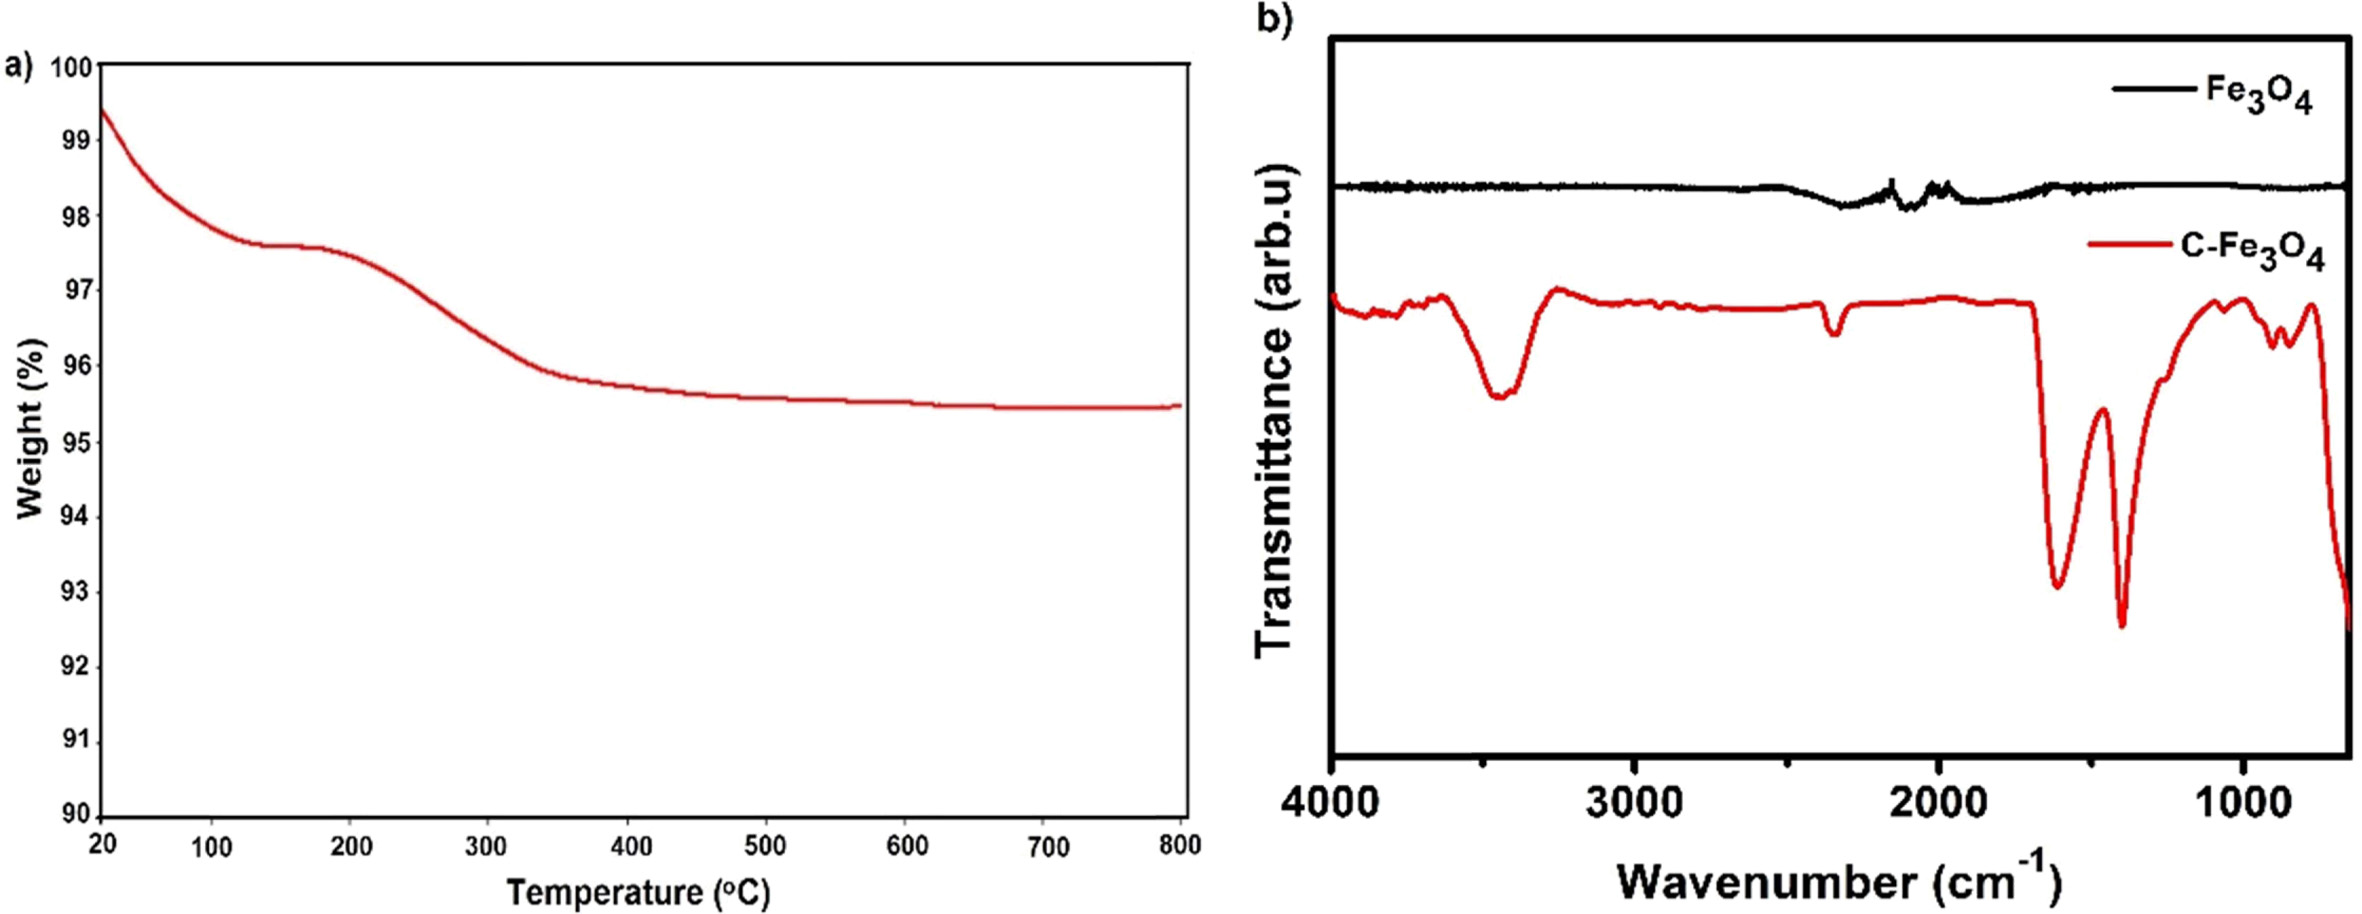
heat treatment of the C-Fe3O4 samples at 300 °C for 30 min per the TG curve
(Fig. 1(a)). The FTIR spectra of the samples confirm the
successful removal of citrate functional groups such as OH
stretching (3,439 cm-1),
C=O stretching (1,602 cm-1),
symmetric stretching of COO-
(1,400 cm-1)
groups from the surface of the C-Fe3O4 nanoparticles
[13, 14] (Fig. 1(b)).
The structural properties of the synthesized samples were
identified by powder X-ray diffraction (XRD, Rigaku, Ultima IV) using Ni
filtered Cu Kα radiation (λ = 1.5418 Å) operated at 40 kV and 30
mA in the 2θ range 20°- 80°. Morphological study of the sample was performed
utilizing transmission electron microscopy (TEM) (JEOL
(Japan) model JEM-2100F). The nitrogen adsorption/desorption
measurement was carried out using a Microtrac, BELsorp-mini II surface analyzer
employing the volumetric method. The specific surface area was calculated by
the Brunauer-Emmett-Teller (BET) technique and the pore size distribution was
estimated from the desorption branch of the isotherm by the
Barrett-Joyner-Halenda (BJH) method. Attenuated total
reflectance - Fourier transform Infrared Spectroscopy (ATR-FTIR) measurement was
performed using ATR-FTIR spectrometer (Smiths Detection).
The supercapacitor electrodes were fabricated by mixing the active
materials (C-Fe3O4 or Fe3O4) (75
wt%), acetylene black (20 wt%) and polyvinylidene fluoride (5 wt%) in N-methyl-2-pyrrolidone. The obtained paste was coated over a nickel foam
substrate of exposed geometric area 1×1 cm2 and dried at 100 °C
for 12 h in a vacuum oven. The mass of the active material present in the
electrodes was determined ~3.5 mg.
Electrochemical measurements such as cyclic voltammetry, galvanostatic charge/discharge test and impedance spectroscopy were performed at room
temperature (~25 °C) using a ZIVE-SP2 (Korea) electrochemical workstation. The measurements were
carried out in a three-electrode setup consisting of a working electrode of Ni
foam coated with the active material, a platinum counter electrode and a Hg/HgO
reference electrode in 6M KOH aqueous electrolyte. The electrochemical
impedance spectra (EIS) of the electrodes were measured in the frequency range
of 10 mHz - 100 kHz at equilibrium
open circuit potential 0 V with an AC
perturbation of 5 mV in 6 M KOH electrolyte.
The specific capacity (Qs) value of the
electrodes was calculated using eq. (1).
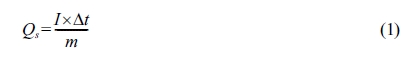
where, I is the constant
discharge current (A), Dt
is the discharge time (s) and m is the mass of the active material (g)
in the electrodes.
|
Fig. 1 (a) TGA curve of C-Fe3O4 and (b) FTIR spectrum of C-Fe3O4 and Fe3O4 samples. |
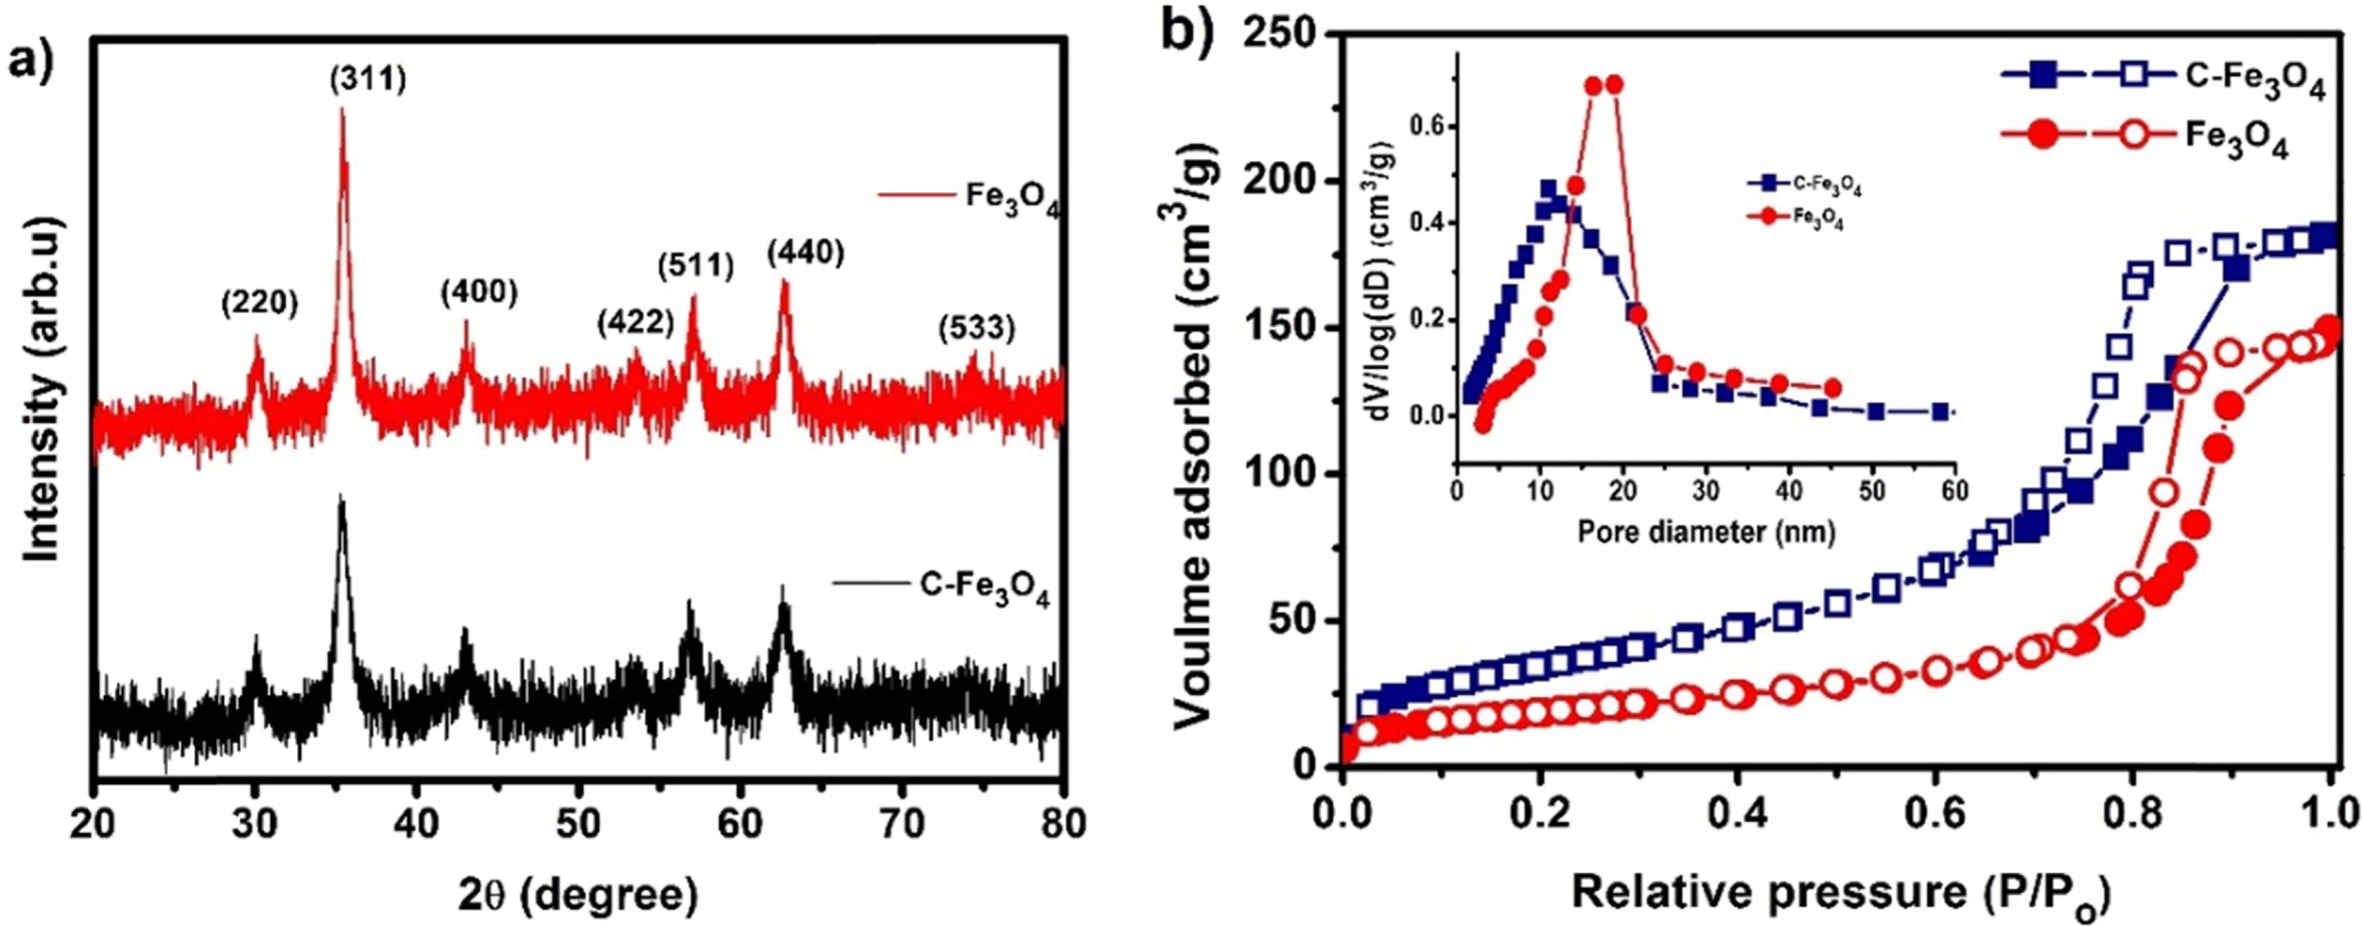
The crystal structures of synthesized samples were studied using XRD
analysis as shown in Fig. 2(a). The XRD patterns show strong and broad
diffraction peaks representing the formation of crystalline Fe3O4
nanostructures and the corresponding peaks
are indexed to a face-centered cubic
lattice of Fe3O4 (JCPDS Card No. 19-0629). From the
diffraction patterns citrate free Fe3O4 exhibited
slightly high intensity than the C-Fe3O4 representing the
crystallinity of the sample increased on heat-treatment. The nitrogen
adsorption/desorption isotherms of the samples are shown in Fig. 2(b) and the
inset show the pore size distribution of the samples. The adsorption/desorption
shows the samples exhibit type-IV
hysteresis loop, that is characteristic of mesoporous materials. The BET surface area of the C-Fe3O4
sample is calculated to be 131.07 m2g-1
and it decreased to 67.39 m2g-1
after the heat-treatment of the sample. These
decrease in BET surface area is mainly attributed to the
removal of surface functionalities to form more agglomerated nanostructure.
Similarly, the total pore volume of the sample also decreases from 0.281 to
0.224 cm3 g-1
for Fe3O4 sample and the estimated average pore diameter
of C-Fe3O4 and Fe3O4 samples are 9
nm and 13 nm respectively, which confirms the mesoporous
distribution of the synthesized nanostructures. Thus, these
samples can offer considerable attaching area between active materials and the
electrolyte for better electrochemical performance [15, 16].
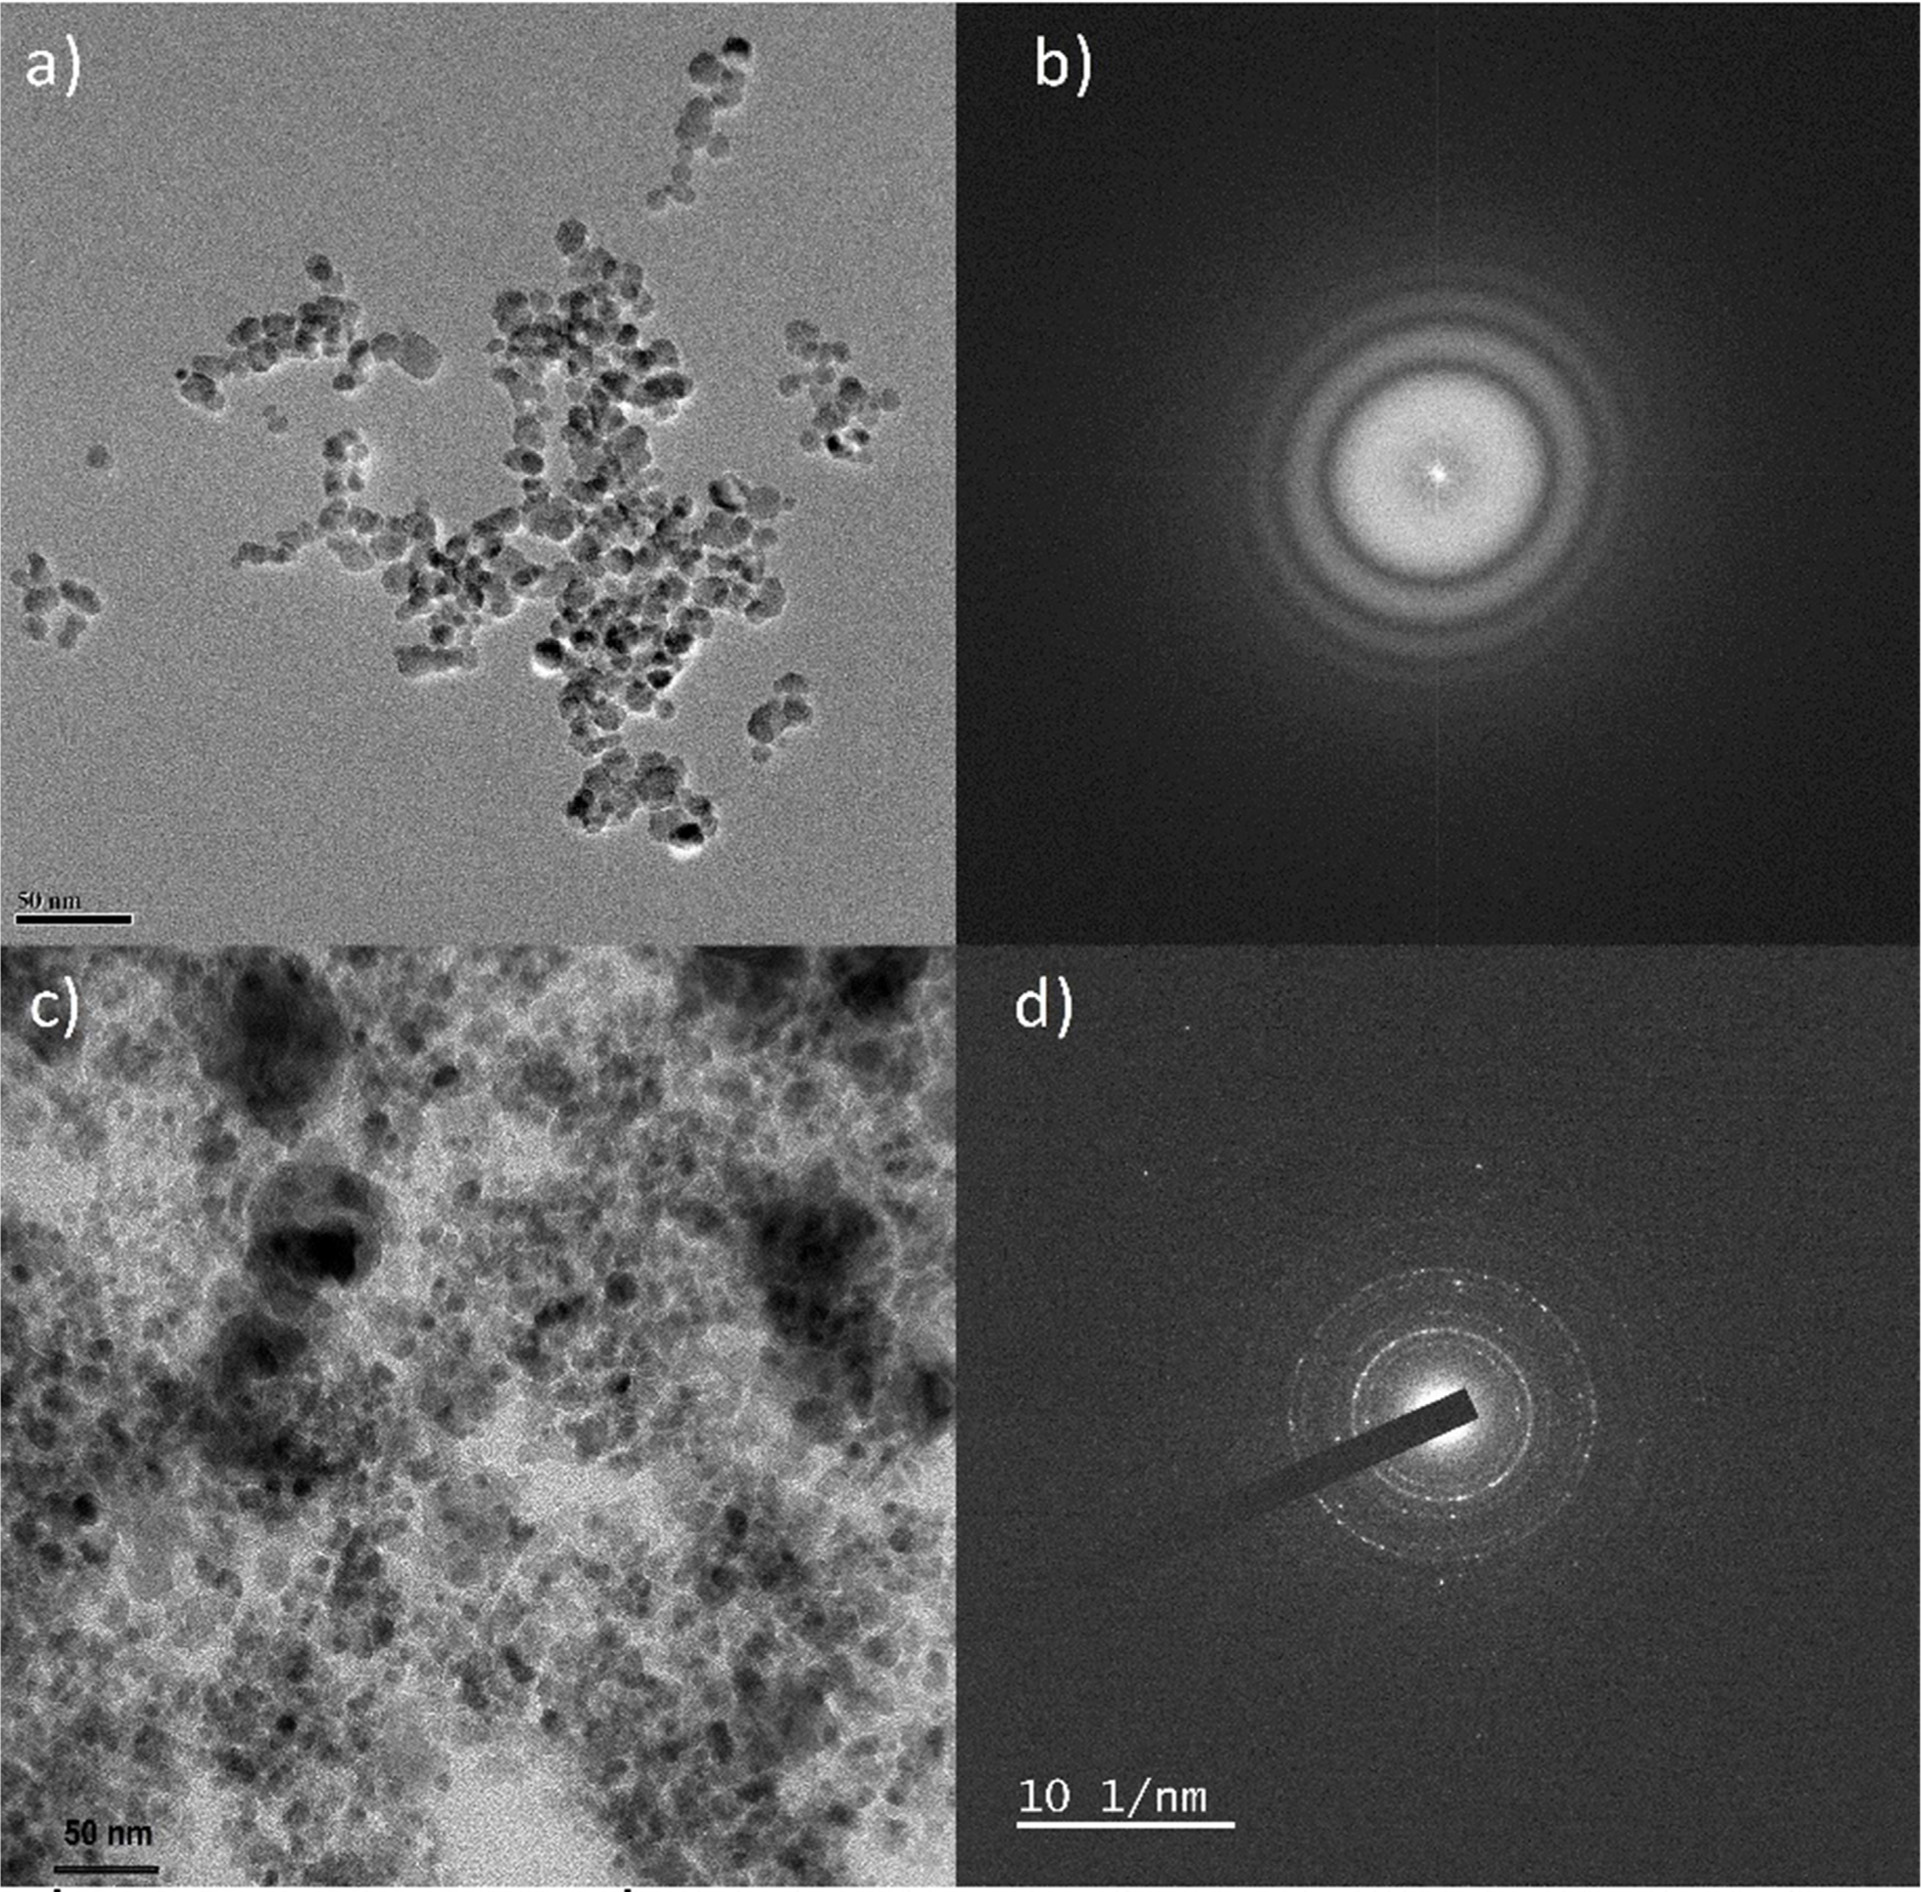
The surface morphology of the C-Fe3O4 and
Fe3O4 samples were examined by TEM analysis. Fig. 3(a)
shows the TEM image of C-Fe3O4 and it displays well-defined
spherical morphology with slightly interconnected nanoparticles
of size ranges from 10-20 nm. Moreover, the sample depicts well-dispersed
nature without much agglomerations of the nanoparticles. But the TEM image (Fig. 3(c)) of the
heat-treated sample (Fe3O4) displays highly agglomerated spherical nanoparticles with few slightly
big sized nanoparticles. Thus, the subsequent heat treatment and removal of
surface citrate groups from the sample highly influence the size of nanoparticles. The corresponding selected area electron
diffraction (SAED) pattern of C-Fe3O4 and Fe3O4
samples are shown in Fig. 3(b) and (d) respectively.
As absorbed in XRD, the SAED pattern of the heat-treated sample is more
crystalline than the citrate stabilized Fe3O4 sample.
Electrochemical capacitance performances of the C-Fe3O4
and Fe3O4 electrodes were investigated by cyclic voltammetry
(CV), galvanostatic charge/discharge (GCD) test and
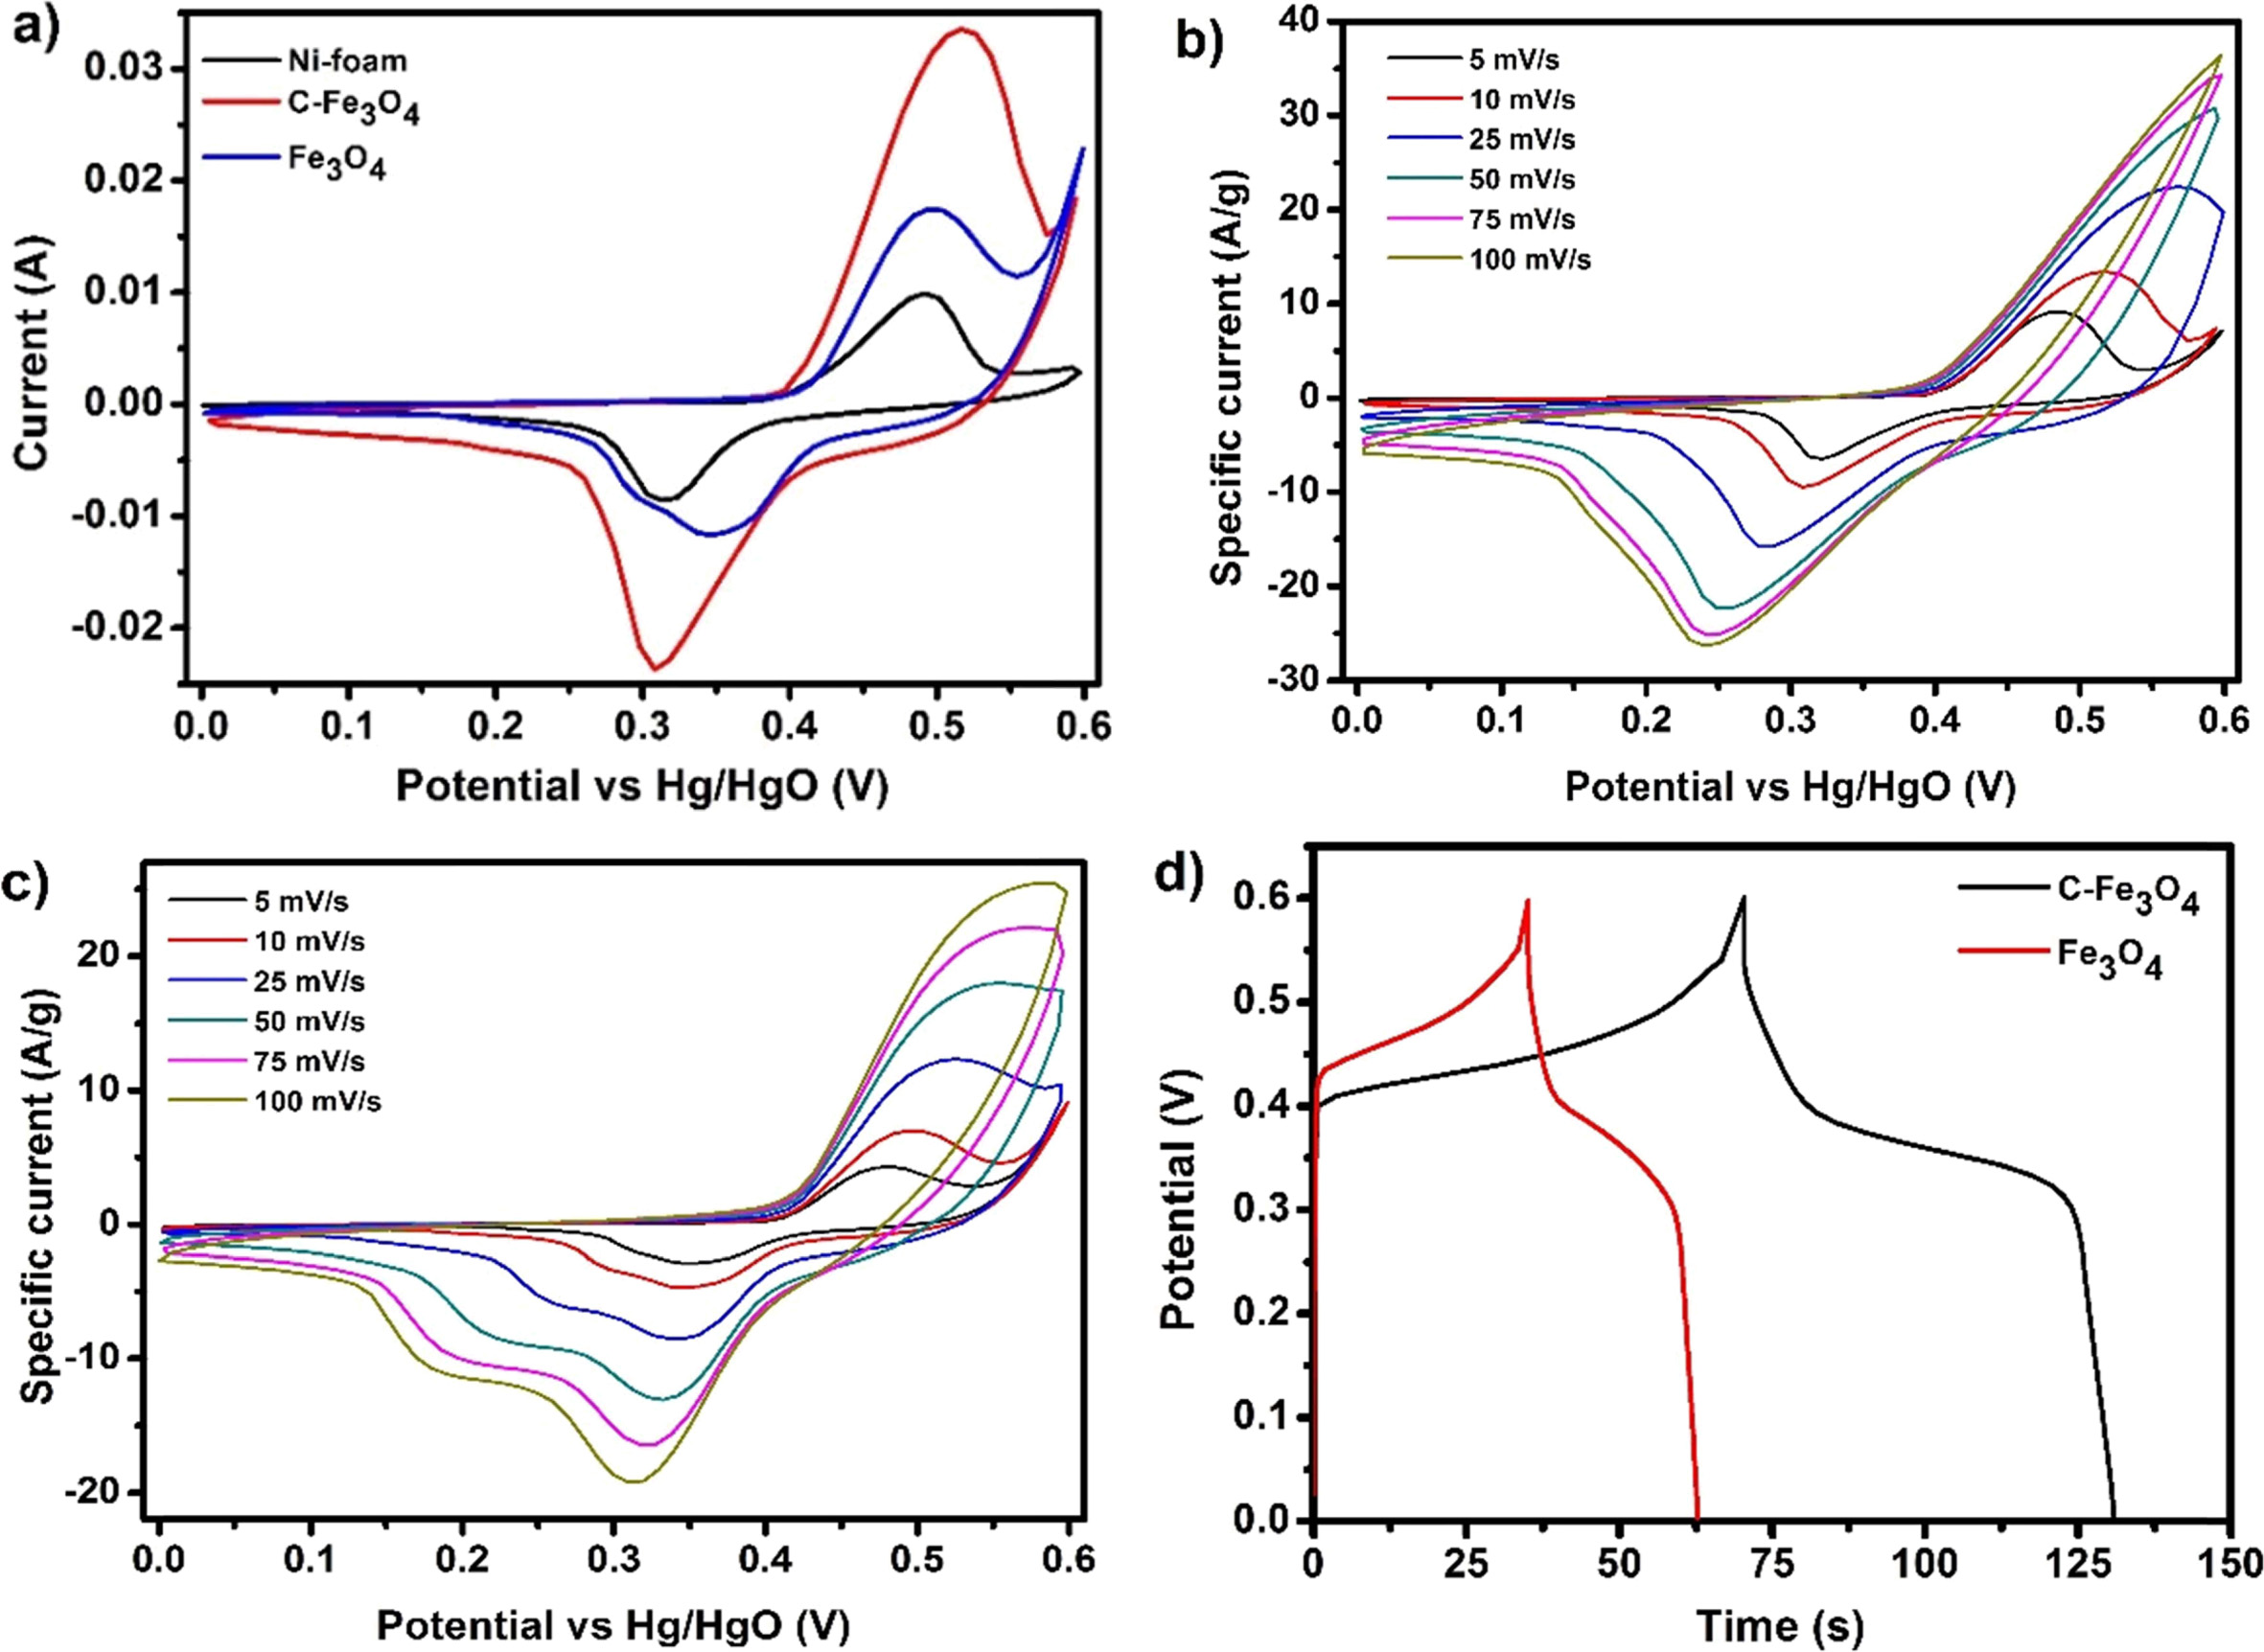
electrochemical impedance spectroscopy (EIS) in 6M KOH electrolyte. Fig. 4(a)
shows the CVs of the bare Ni-foam, C-Fe3O4 and Fe3O4
electrodes (~3.5 mg) measured at 10 mVs-1
scan rates. The CV of bare Ni-foam exhibited distinct pair of redox peaks
originated from the Faradaic redox reaction of Ni elemental species
in an alkaline electrolyte and the similar pair of redox peaks
are exhibited in the C-Fe3O4 and Fe3O4
electrodes. However, the citrate free Fe3O4
electrode displays a secondary reduction peak with comparatively broad
oxidation peak than the Ni-foam, which corresponds to the redox
reaction of Fe(II)/Fe(III) redox couple of the electrode
material. The C-Fe3O4 electrode shows a significantly
larger redox peak area represents the overlapping the two peaks observed in Fe3O4
electrode, moreover, the electrode exhibited high background current revealing
superior capacitive performance than the other two electrodes. Moreover, these irregular
shape of the CVs with redox peaks correspond
the non-capacitive faradic or battery-like redox characteristic of the
electrodes [17, 18]. This enhancement in C-Fe3O4 electrode
over Fe3O4 is mainly due to the improved surface area and
pore density of the sample due to the stabilization of citrate functional
groups on the surface. Further, the CVs of the electrodes measured for various
scan rates are displayed in Fig. 4(b) and (c). From these CVs, C-Fe3O4
electrode possesses higher background current and redox peak intensity for all
the measured scan rates. Moreover, the electrodes nearly retain its shapes even
at higher scan rates representing better supercapacitor electrode materials.
The GCD curves of the C-Fe3O4 and Fe3O4
electrodes at 1 Ag-1
specific current is shown in Fig. 4(d) and the curves display a nonlinear
shape, which reveals the non-capacitive faradic reaction that typically
exhibited in the supercapattery electrode materials due to the battery-type
charge storage mechanism [19, 20]. Similar to CVs, the
GCD curve shows a prolonged charge/discharge time for C-Fe3O4
electrode than Fe3O4 electrode representing
better capacitive performance. The specific capacity (Qs)
values of the electrodes were calculated and the C-Fe3O4 electrode
shows maximum specific capacity 146 Cg-1
(242 Fg-1)
at a specific current 1 A g-1,
which is much higher than the Fe3O4 electrode (62 Cg-1;
112 Fg-1).
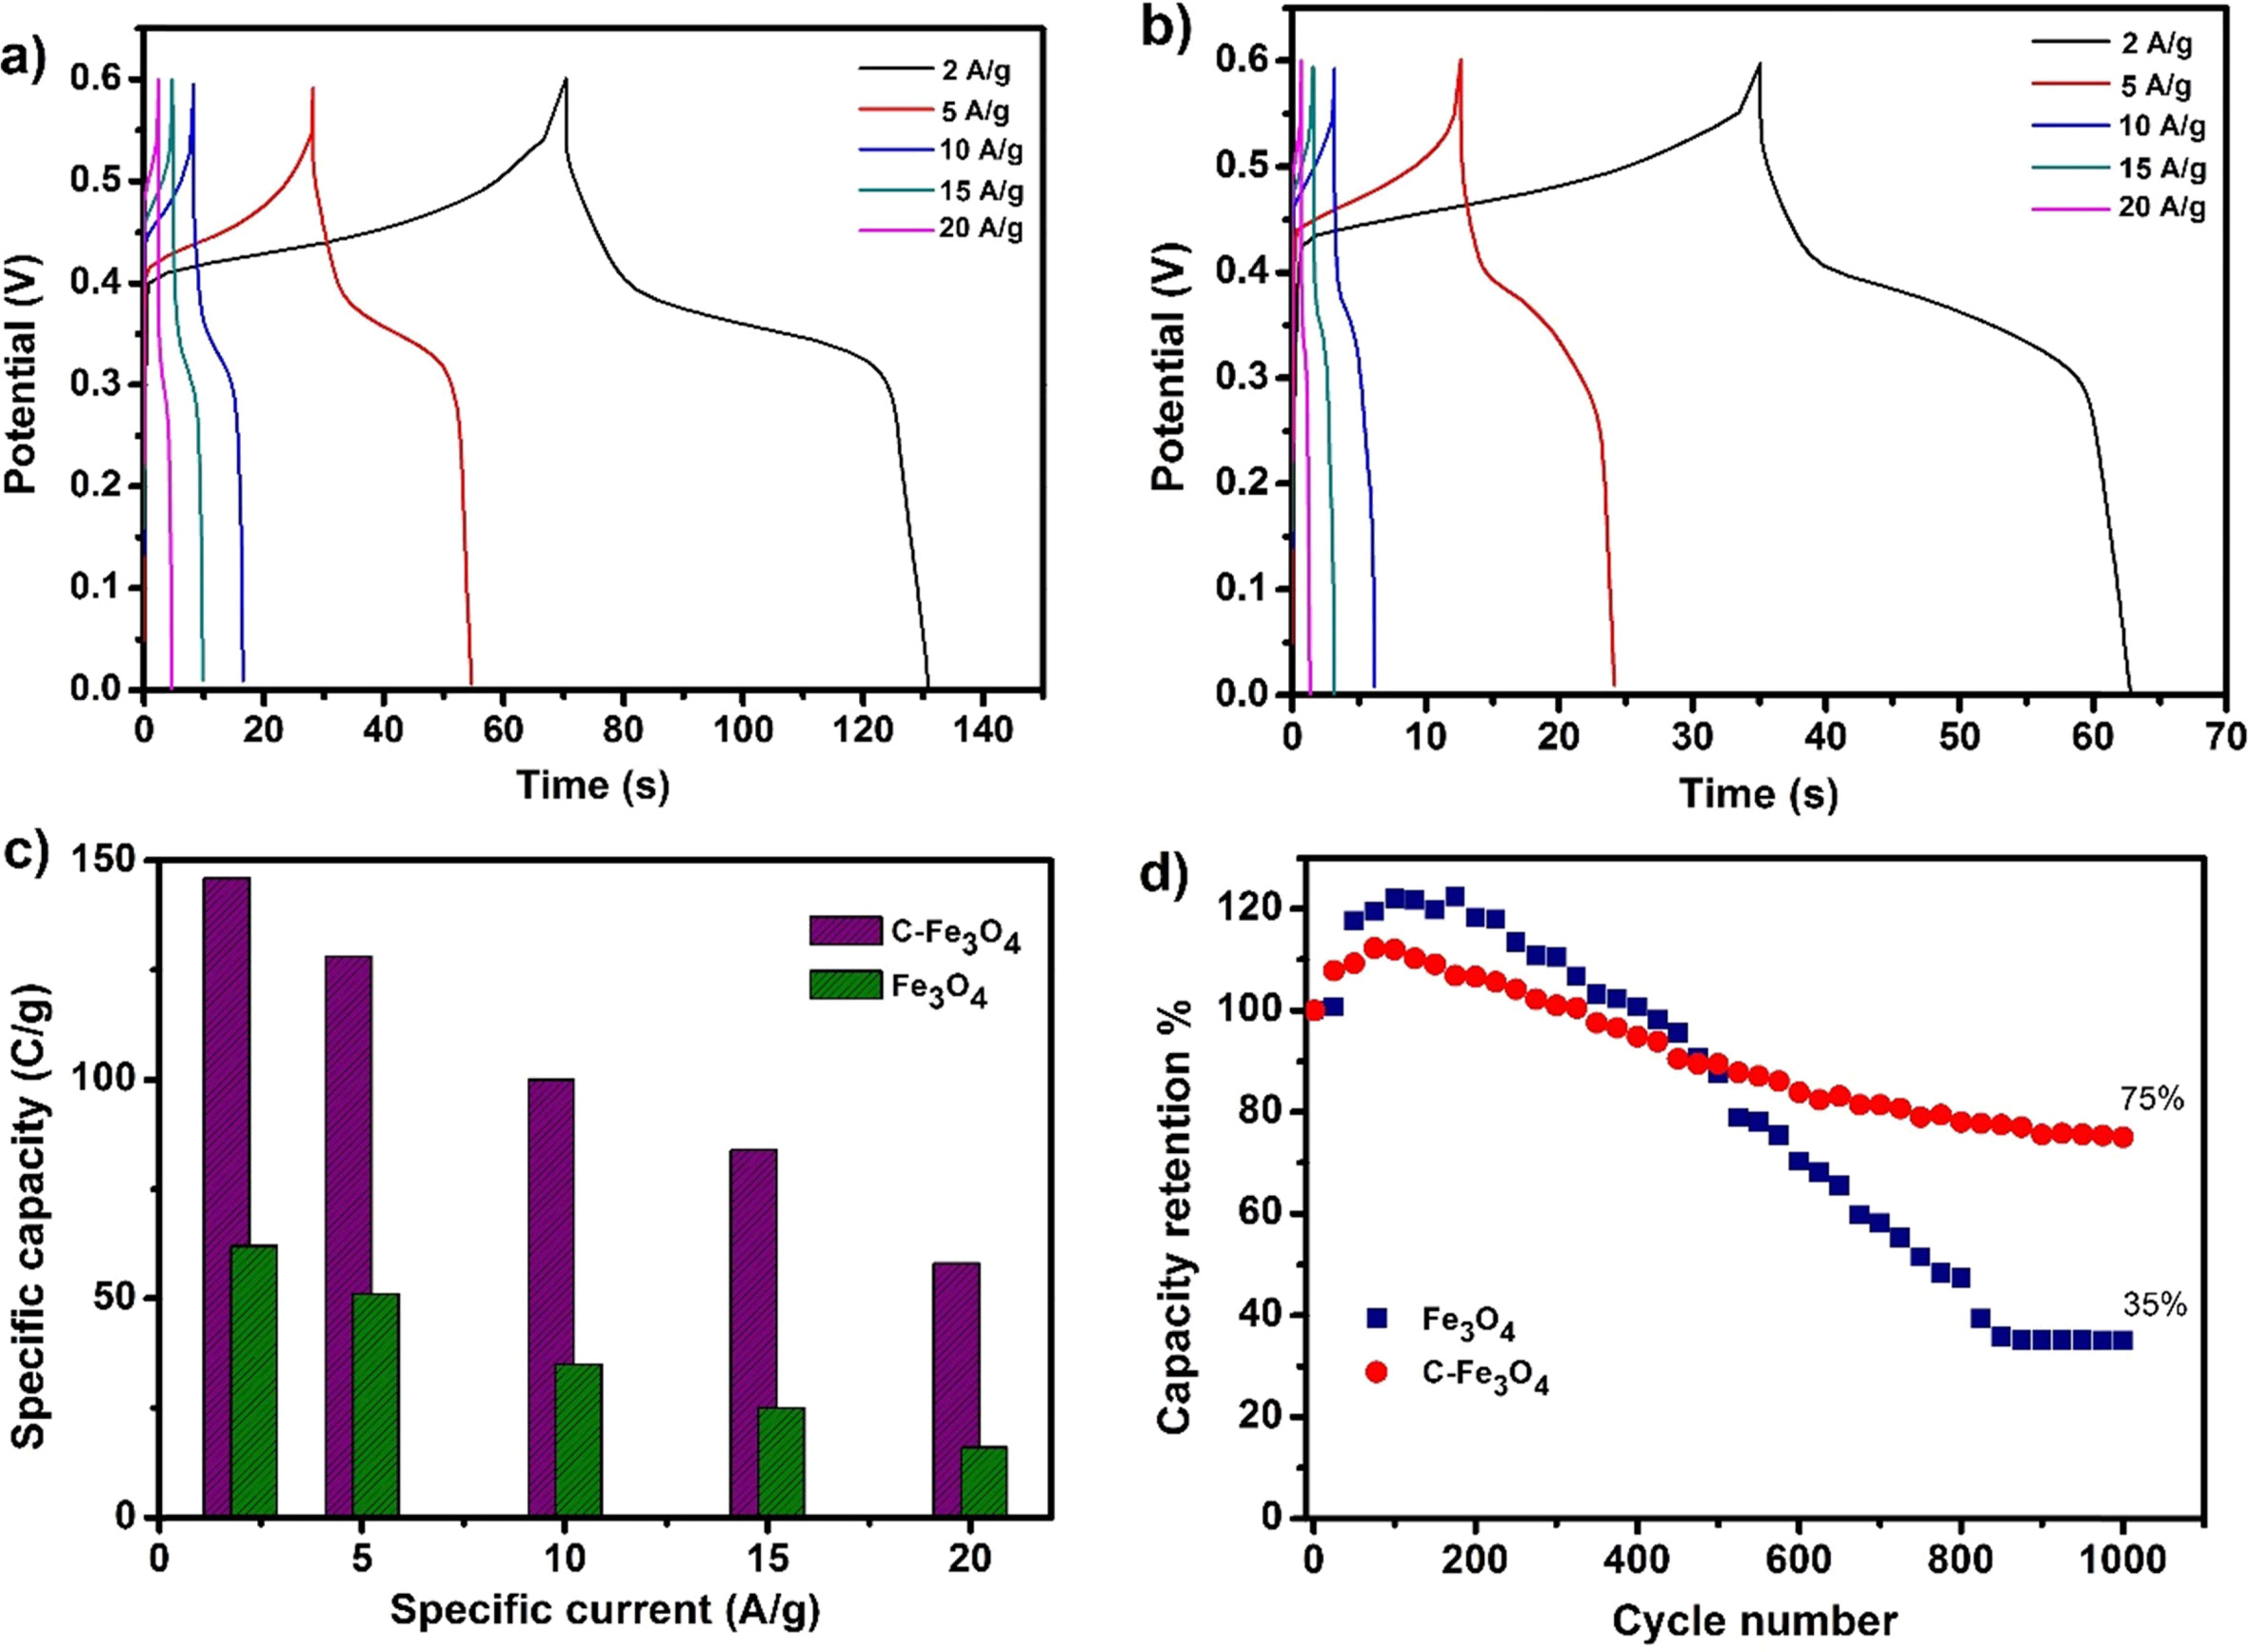
Fig. 5(a) and (b) shows the GCD curves of C-Fe3O4
and Fe3O4 electrodes measured for various specific
currents and Fig. 5(c) displays the variation of specific capacity of the
electrodes for various specific currents. From this, the C-Fe3O4
electrode demonstrates higher specific capacity values for all the
measured specific currents with relatively higher discharge time than the Fe3O4
electrode. Moreover, the specific capacity of the electrodes decreases with the
increase in specific currents due to the increasing IR-drop and the limited
involvement of active material in a redox reaction concerning the increase in
specific currents [21]. Fig. 5(d) shows the cyclic stability of the C-Fe3O4
and Fe3O4 electrodes for 1,000 charge/discharge
cycles at 10 Ag-1.
The C-Fe3O4 electrode shows comparable cyclic stability
with ~75% of the specific capacity retention after 1,000 cycles.
But, the Fe3O4 electrode displays only ~35% specific
capacity retention representing nearly poor stability of the electrode.
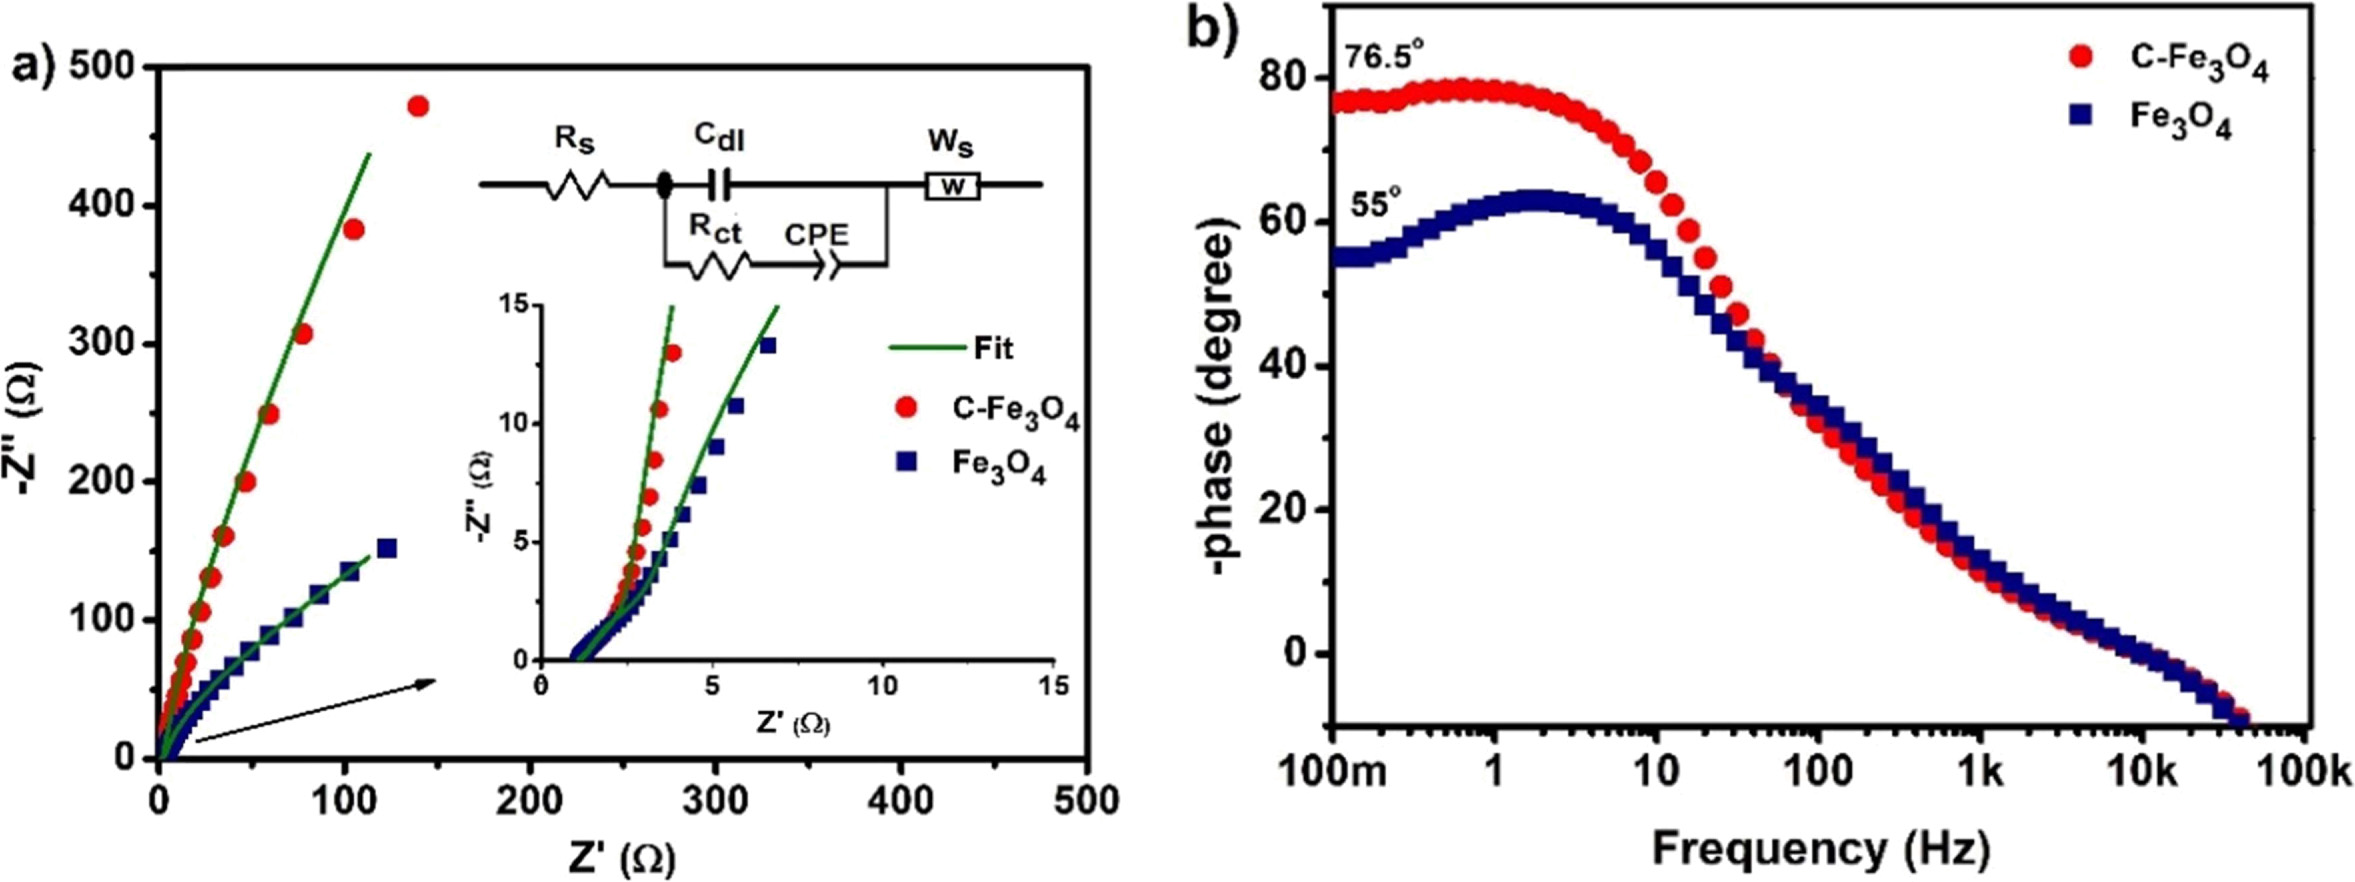
The Nyquist plots of the electrodes are shown in Fig. 6(a)
and the inset shows the magnified portion of the high-frequency region of the
plots. The Nyquist plots were fitted using Zview software with an equivalent
circuit (inset of Fig. 6(a). The circuit consists of a bulk resistance (Rs)
[11, 22, 23] and a parallel combination of resistance Rct and
capacitance (Cdl) represents the charge-transfer resistance
and electric double layer capacitance contribution of the electrodes. The
slight inclined low-frequency slope was fitted with the Warburg element
(Ws) corresponding the diffusion control process
of the electrodes. Additional constant phase elements CPE1 included
in the circuit due to the non-ideal capacitive behavior of the electrodes and
it represents the energy storage process originated from the redox reaction
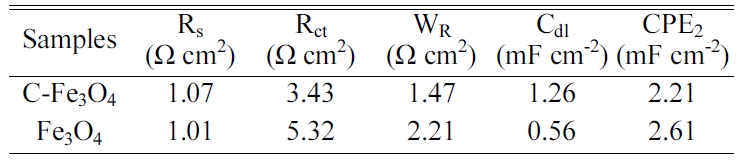
[24]. The best-fitted results of the electrodes are presented in Table.1. From
these, the Rs value of the electrodes found to be nearly similar,
but the charge transfers resistance Rct value of
C-Fe3O4 electrode lower than the Fe3O4
electrode. This is mainly attributed to high mesoporosity of the
electrode materials may account these better charge-transfer process than the
Fe3O4 electrode [25]. Fig. 6(b) shows the corresponding
Bode phase plots of electrodes with low frequency (100 mHz) phase angle of
-76.5 and 55°. The existence of high phase angle at low frequency (approaches
slightly close to the ideal capacitor, -90°) for C-Fe3O4
electrode denotes the better charge storage properties of the electrode than
the citrate free Fe3O4 electrodes [26]. Table 1
|
Fig. 2 (a) XRD patterns of C-Fe3O4 and Fe3O4 samples, (b) N2 adsorption/desorption isotherms of the C-Fe3O4 and Fe3O4 and the inset pore size distribution of the samples. |
|
Fig. 3 (a) TEM image of C-Fe3O4 nanoparticles, (b) SAED pattern of the C-Fe3O4 nanoparticles, (c) TEM image of Fe3O4 nanoparticles and (d) SAED pattern of the Fe3O4 nanoparticles. |
|
Fig. 4 (a) CVs of bare Ni-foam, C-Fe3O4 and Fe3O4 electrode at 10 mV s−1 scan rate, CVs of bare, (b) C-Fe3O4 and (c) Fe3O4 electrodes measured at various scan rates, and d) the GCD curves of C-Fe3O4 and Fe3O4 electrodes at 1 A g−1. |
|
Fig. 5 Charge/discharge curves of (a) C-Fe3O4 and (b) Fe3O4 electrodes for different specific currents, (c) Variation of specific capacity with various specific currents and (e) Cyclic stability of the electrodes for 1,000 cycles at 10 Ag−1. |
|
Fig. 6 (a) Nyquist plots (the inset shows a magnified part and equivalent circuit) and b) Bode plots of the C-Fe3O4 and Fe3O4 electrodes |
In summary, the synthesized citrate stabilized iron oxide
nanoparticles possess a controlled size, mesoporosity and high
surface area than the citrate free Fe3O4 nanoparticles.
These improved properties demonstrate the C-Fe3O4 nanoparticles
as a promising supercapacitor electrode material with a battery like a charge
storage behavior and excellent electrochemical performances.
The authors R. Manikandan and B.C. Kim acknowledges the Creative Materials
Discovery Program through the National Research Foundation of Korea funded by
the Ministry of Science, ICT and Future (NRF-2015M3D1A1069710); and the Basic
Science Research Program through the National Research Foundation of
Korea funded by the Ministry of Education
(NRF-2014R1A6A1030419), Republic of Korea.
- 1. W. Deng, X. Ji, Q. Chen, C.E. Banks, RSC Adv. 1 (2011) 1171-1178.
-

- 2. M.Y. Cho, S.M. Park, B. H. Choi, J.-W. Lee, K. C. Roh, J. Ceram. Process. Res. 13(S2) (2012) 166-169.
- 3. D. Qiu, X. Ma, J. Zhang, B. Zhao, Z. Lin, Chem. Phys. Lett. 710 (2018) 188-192.
-
- 4. M.P. Kumar, L.M. Lathika, A.P. Mohanachandran, R.B. Rakhi, ChemistrySelect 3 (2018) 3234-3240.
-
- 5. G.V.M. Williams, T. Prakash, J. Kennedy, S.V. Chong, S. Rubanov, J. Magn. Magn. Mater. 460 (2018) 229-233.
-
- 6. V.D. Nithya, N. Sabari Arul, J. Mater. Chem. A 4 (2016) 10767-10778.
-
- 7. S. Mallick, P.P. Jana, C.R. Raj, Chem. Electro. Chem. 5 (2018) 2348-2356.
-
- 8. L. Song, Y. Han, F. Guo, Y. Jiao, Y. Li, Y. Liu, F. Gao, J. Nanomater. 2018 (2018) 1-13.
-
- 9. F. Yang, X. Zhang, Y. Yang, S. Hao, L. Cui, Chem. Phys. Lett. 691 (2018) 366-372.
-
- 10. M. Aghazadeh, I. Karimzadeh, M. Reza Ganjali, Mater. Lett. 209 (2017) 450-454.
-
- 11. L. Li, C. Polanco, A. Ghahreman, J. Electroanal. Chem. 774 (2016) 66-75.
-
- 12. B.-B. Cho, J.H. Park, S.J. Jung, J. Lee, J.H. Lee, M.G. Hur, C. J. Raj, K.-H. Yu, J. Radioanal. Nucl. Chem. 305 (2015) 169-178.
-
- 13. C. Hui, C. Shen, T. Yang, L. Bao, J. Tian, H. Ding, C. Li, H.-J. Gao, J. Phys. Chem. C 112 (2008) 11336-11339.
-
- 14. S. Nigam, K.C. Barick, D. Bahadur, J. Magn. Magn. Mater. 323 (2011) 237-243.
-
- 15. J. Yao, Y. Gong, S. Yang, P. Xiao, Y. Zhang, K. Keyshar, G. Ye, S. Ozden, R. Vajtai, P.M. Ajayan, ACS Appl. Mater. Interfaces 6 (2014) 20414-20422.
-
- 16. Z. Gu, H. Nan, B. Geng, X. Zhang, J. Mater. Chem. A 3 (2015) 12069-12075.
-
- 17. N. Padmanathan, H. Shao, D. McNulty, C. O'Dwyer, K.M. Razeeb, J. Mater. Chem. A 4 (2016) 4820-4830.
-
- 18. B.C. Kim, R. Manikandan, K.H. Yu, M.-S. Park, D.-W. Kim, S.Y. Park, C. J. Raj, J. Alloys Compnd. 789 (2019) 256-265.
-
- 19. H. Chen, S. Chen, Y. Zhu, C. Li, M. Fan, D. Chen, C. Tian, K. Shu, Electrochim. Acta 190 (2016) 57-63.
-
- 20. N. Tang, H. You, M. Li, G.Z. Chen, L. Zhang, Nanoscale 10 (2018) 20526-20532.
-
- 21. R. Manikandan, C. J. Raj, M. Rajesh, B.C. Kim, G. Nagaraju, W.-G. Lee, K.H. Yu, J. Mater. Chem. A 6 (2018) 11390-11404.
-
- 22. S.H. Lee, J.M. Kim, J.R. Yoon, J. Ceram. Process. Res. 18 (2017) 51-54.
- 23. C.J. Raj, M. Rajesh, R. Manikandan, J.Y. Sim, K.H. Yu, S.Y. Park, J.H. Song, B.C. Kim, Electrochim. Acta 247 (2017) 949-957.
-
- 24. F.B. Ajdari, E. Kowsari, A. Ehsani, M. Schorowski, T. Ameri, Electrochim. Acta 292 (2018) 789-804.
-
- 25. H. Liu, P. He, Z. Li, Y. Liu, J. Li, Electrochimica Acta 51 (2006) 1925-1931.
-
- 26. X. Pan, G. Ren, M.N.F. Hoque, S. Bayne, K. Zhu, Z. Fan, Adv. Mater. Interfaces 1 (2014) 1400398.
-
 This Article
-
2020; 21(2): 278-283
Published on Apr 30, 2020
- 10.36410/jcpr.2020.21.2.278
- Received on Dec 23, 2019
- Revised on Jan 23, 2020
- Accepted on Feb 7, 2020
Services
- Abstract
introduction
experimental
results and discussion
conclusion
- Acknowledgements
- References
- Full Text PDF
Shared
Correspondence to
- Kook Hyun Yu
-
Department of Chemistry, Dongguk University, Jung-gu, Seoul-04620, Republic of Korea
Tel : +82 2 2260 3709 Fax: +82 2 2268 8204 - E-mail: yukook@dongguk.edu
Clean-Energy Research Institute(CRI), Hanyang University, 222, Wangsimni-ro, Seongdong-gu, Seoul, 04763, Korea
E-mail: jcpr@hanyang.ac.kr