


- Piezoelectric parameters and impedance analysis of sol gel processed Ce-doped BaTi0.97Y0.03O3 ceramics
Aziz Nfissia, Yahya Ababoua, Salaheddine Sayouria,*, Lamiae Mrharraba,b, Fouzia Saadaouia, Elmaati Ech-chamikhc and Taj-dine Lamcharfid
aLPTA, Faculty of Sciences-DM, USMBA, B.P. 1796, Fez-Atlas, Morocco
bERMAM, FP, Ouarzazate, Morocco
cLNEE, Faculty of Sciences Semlalia, Cadi Ayad University, BP. 2390, Marrakesh, Morocco
dLSSC, FST-Fès, Route d’Imouzzer, B.P. 2202, Fès, Morocco
A series of Ce-doped BaTi0.97Y0.03O3
powder samples with the composition (Ba1-xCex)(Ti(0.97-x/4)Y0.03)O3
(x = 0.00, 0.01, 0.03, 0.05, 0.07 and 0.09) were prepared using the sol
gel process and calcined at a relatively low temperature (950°C/4h) and their
structural and piezoelectric properties investigated. From structural
investigations, it was observed that the samples crystallize in the pseudo
cubic phase with the presence of secondary phases for concentrations such as x
> 0.03. Piezoelectric parameters were determined and their thermal behavior
investigated. The impedance study indicated the dominance of the resistance of
the grain boundaries compared to that of grains in BaTi0.97Y0.03O3
sample.
Keywords: Sol gel process, Ce-doped BaTi0.97Y0.03O3, Piezoelectric properties, Complex impedance
Barium Titanate (BaTiO3), with a perovskite
structure of a general formula ABO3, is one of the
ceramic materials that exhibit interesting ferroelectric, dielectric and
piezoelectric properties with wide technological applications such as
ultrasonic transducers, Multilayer Ceramic (MLCCs), detection of gaseous
pollutants like CO, ferroelectric random access memories (FRAM's), Positive
temperature coefficient resistors (PTCR), pyroelectric security surveillance
systems, IR detectors, etc. [1-5]. Ferroelectric materials form a sub-group of
piezoelectric materials. In ABO3 perovskite materials, piezoelectric
properties have been shown to be improved under
particular conditions such as near phase transitions [6] or with
compositions of ceramics close to the morphotropic phase
boundary [7]. Attempts have also been made to enhance these
properties through doping [8-14]. Doping BaTiO3 with rare earth
elements was shown to improve its permittivity and to give rise to excellent
electrical properties [15]. In particular, it was observed that incorporation
of most of RE elements in BaTiO3 matrix lowered the temperature of
the ferro-to-paraelctric phase transition (Curie point) [16], and that these RE elements may
occupy Ba or/ and Ti sites depending on
their ionic radii. However, the procedure of synthesis has a great influence on this sites occupation property [17,
18]. In ABO3 structured compounds, A ion is twelve fold
coordinated by oxygen ions and B ion is octahedrally coordinated by oxygen
ions. The origin of ferroelectricity in BaTiO3 derives from the
displacement of ions relative to each other. BaTiO3 is a
ferroelectric material of which dielectric properties can be modified by
chemical substitution of barium and/or titanium by a wide variety of isovalent
and aliovalent dopants. In addition to the sintering process, these properties are however greatly influenced by
impurities, especially by a donor or
an acceptor dopant. It is also known that cerium, which is a donor dopant,
occupies the Ba sites in the crystal lattice of BaTiO3.
On the other
hand, substitution of Ce3+ on Ba2+ sites creates charge
defects. Doping with Ce have been reported to influence the piezoelectric
response of the doped material (BaTiO3). Brajesh et al. [19]
elaborated Ba(Ti, Ce)O3 samples (Ce3+ substitutes Ti4+
ions in BaTiO3 matrix) and have observed that the (longitudinal)
piezoelectric charge coefficient (d33) increased first, reached its
maximum value at 2% in Ce before it decreased.
The aim of the present work is the synthesis, by the sol
gel process, and the characterization of BaTi0.97Y0.03O3 and
cerium doped BaTi0.97Y0.03O3 materials, in
view of investigation of the influence of doping BaTiO3
material with Ce3+ ions at Ba sites on their
piezoelectric properties.
The following precursors were needed to synthesize the
series of samples (Ba1-xCex)(Ti(0.97-x/4)Y0.03)O3
(BCYTx): barium acetate trihydrate (Ba(CH3COO)2,
3H2O), titanium isopropropoxide Ti[OCH(CH3)2]4,
yttrium (III) acetate hydrate (Y(C6H9O6),H2O)
and Cerium(III) acetate hydrate (Ce(CH3COO)3,H2O).
During the preparation process, lactic acid (C3H6O3)
was used as peptizing agent. Calcination in air of the raw powders was done in
a programmable oven at the temperature of 950 °C for 4 h. For dielectric
measurements, uniaxially pressed pellets (of around 1.2 mm thickness and a
diameter of around 12 mm) were sintered at 1200 °C for 6 h in a
programmable oven. The structural properties of the samples were investigated
using an X-ray diffraction diffractometer (XPERT-PRO) with Cu-Kα radiation (λ =
1.54059 Å). The dielectric measurements were carried out in the frequency range
1 kHz to 2 MHz and temperature from ambient to 380 °C using an Agilent 4284A
precision impedance analyzer (Hewlett-Packard, Palo Alto,
CA).
Structural
analysis
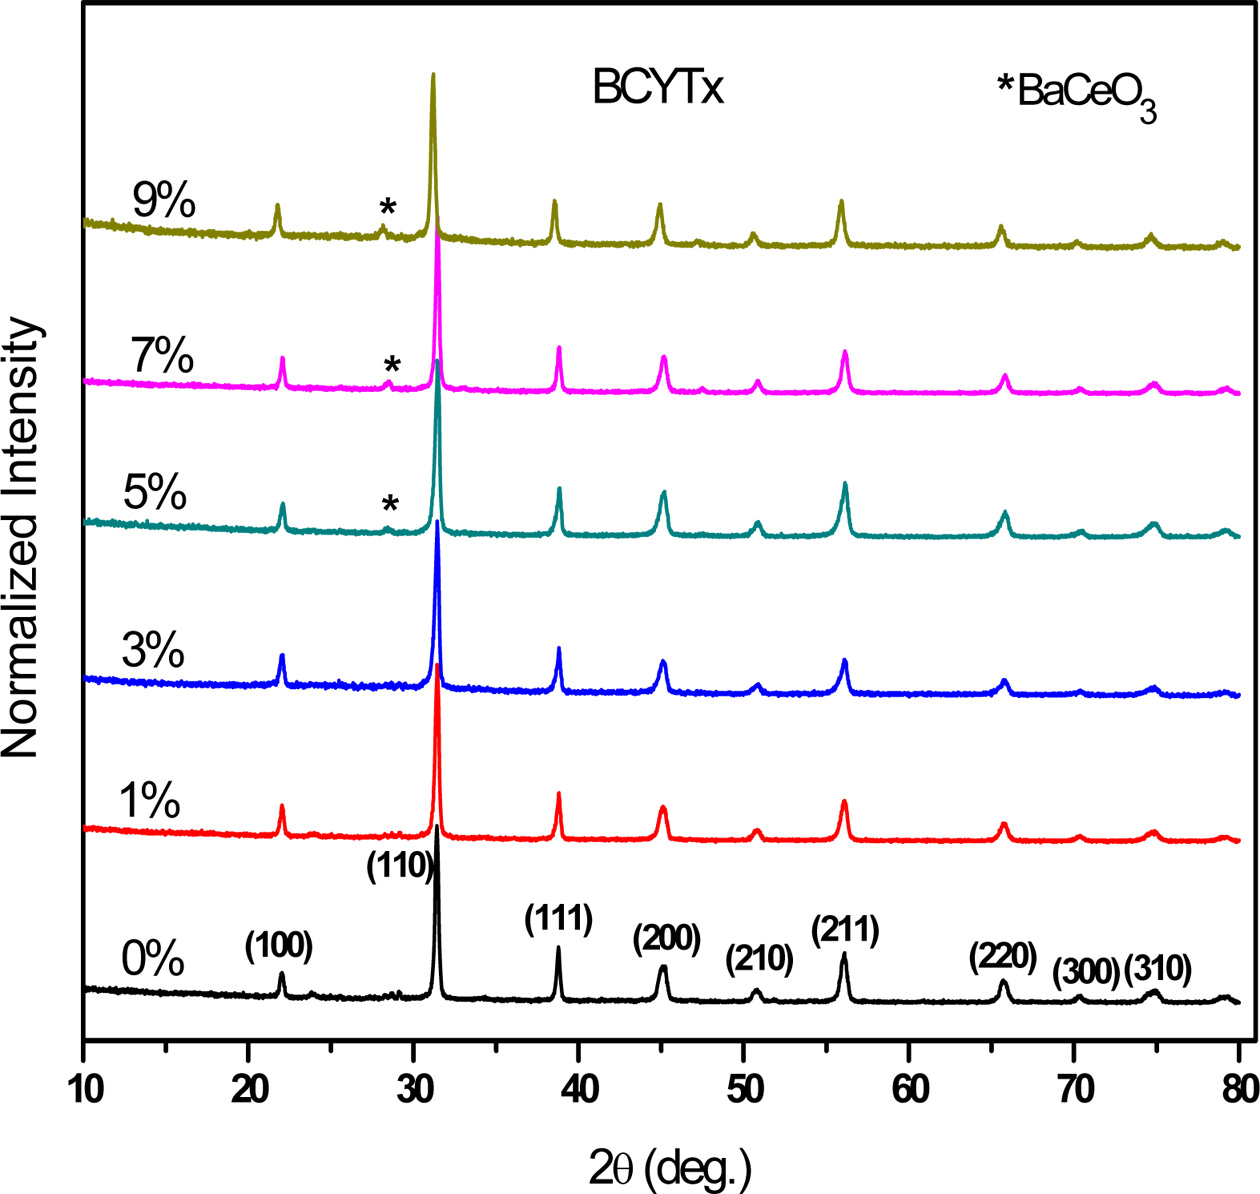
The room temperature X-ray diffraction (XRD) patterns of
the as-prepared (Ba1-xCex)(Ti(0.97-x/4)Y0.03)O3
samples (BCYTx, x = 0; 1; 3; 5; 7 and 9%), calcined at 950 ºC-4 h
(Fig. 1), revealed well resolved peaks corresponding to the pseudo cubic
structure with the presence of BaCeO3 secondary phase (detected at
28.5°) at concentrations in Ce such as x > 0.03.
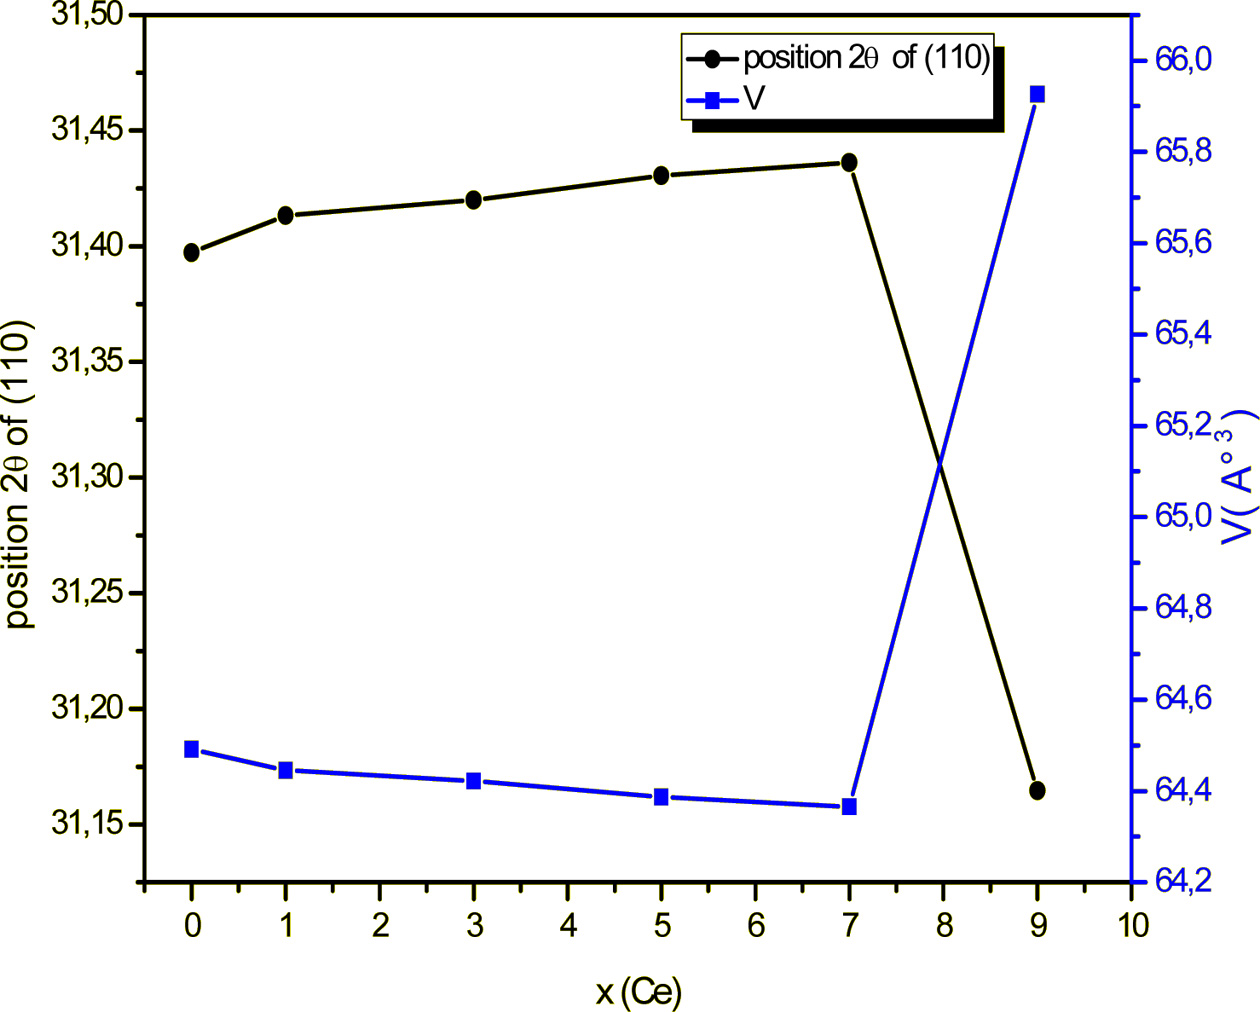
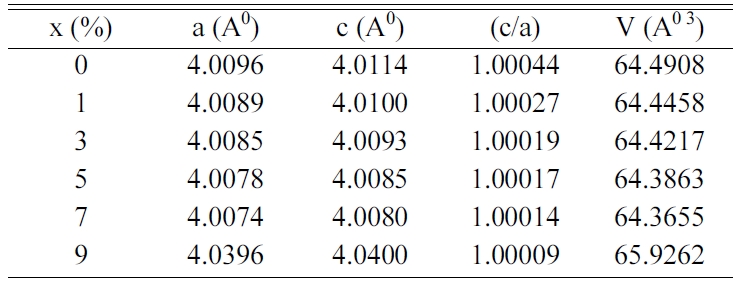
Table 1 gathers the values of the lattice parameters (a,
c), the tetragonality (c/a) and the unit cell volume (V) of BCYTx. A
substitution of Ba2+ ions by Ce3+ ones in BaTi0.97Y0.03O3
matrix results in a shrinkage of the volume of the unit cell until 7% in Ce3+,
because the ionic radius of Ce3+(r(Ce3+) = 1.34 Å,
coordination number (CN) = 12) is smaller than that of Ba2+(r(Ba2+)
= 1.61 Å, CN = 12). Therefore, an expansion of this volume for the
concentration x > 0.07 can be ascribed to the occupation of Ce3+
ions of Ti-sites as the ionic radius of Ce3+(r(Ce3+) =
1.01 Å, CN = 6) is larger than that of Ti4+(r(Ti4+) =
0.605 Å, CN = 6).
Moreover, doping with Ce gave rise to a shift of the
position of the XRD peaks to high values (x < 0.07) (Fig. 1), which reveals
a shrinkage of the unit cell (as indicated by the Bragg relation 2d sin(θ) = nλ),
and, consequently, a reduction of its volume as illustrated on Fig. 2
displaying the evolutions of the position of the peak (110)
and the volume of the unit cell, in conformity with the
discussion of the site occupation of Ba given above.
Piezoelectric
studies
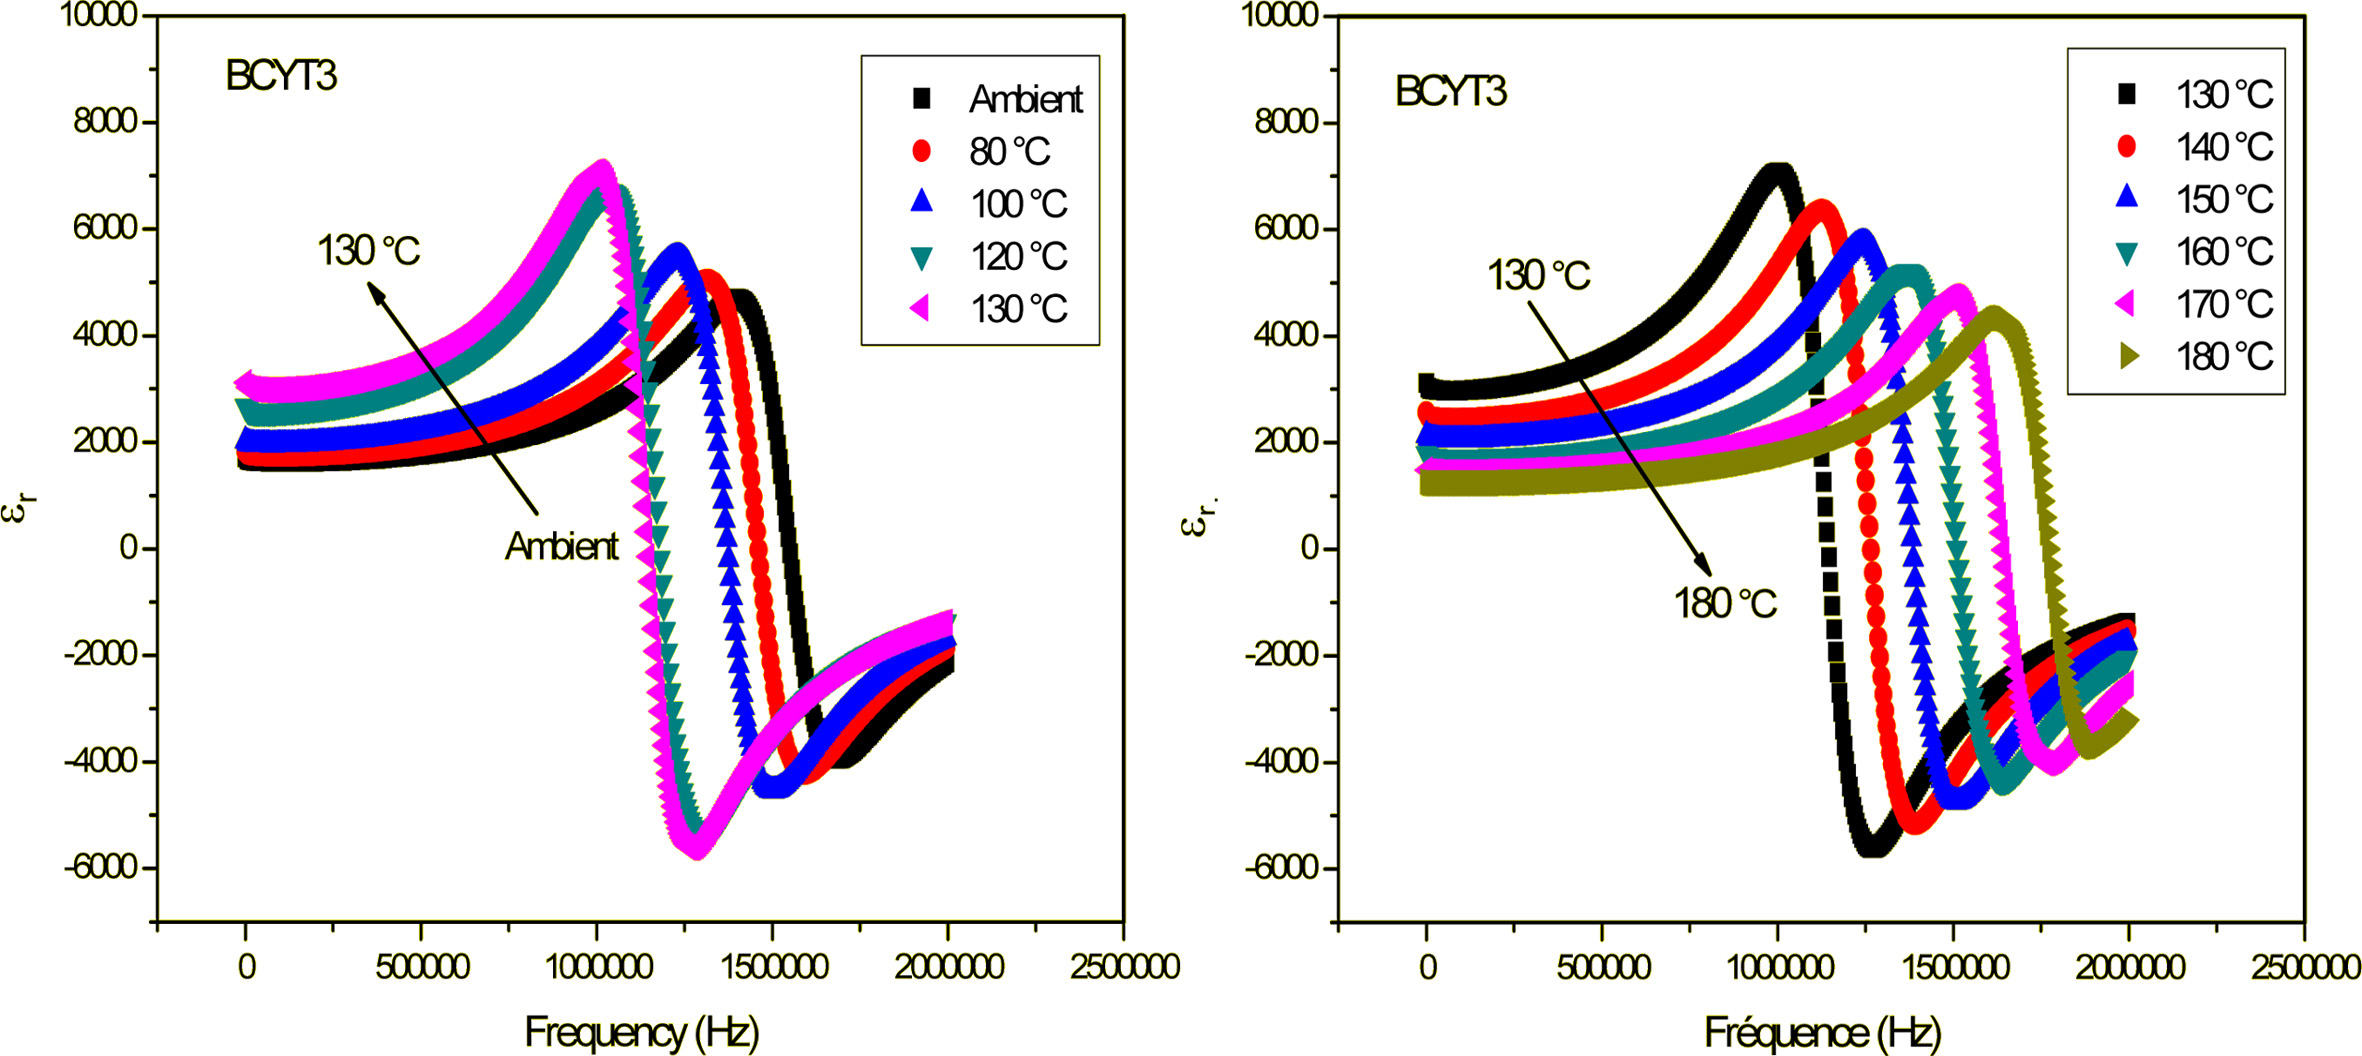
The piezoelectric coefficients were determined using the
resonance and anti-resonance frequencies obtained from the variation of the
dielectric permittivity with frequency, for each temperature [20], of the BCYTx
samples (x = 0; 3; 7 and 9%). Fig. 3 shows as
illustration the variation of the dielectric permittivity (εr)
with frequency of the BCYT3 sample at different temperatures.
The different piezoelectric constants can be expressed
as follows.
The planar electromechanical coupling factor Kp: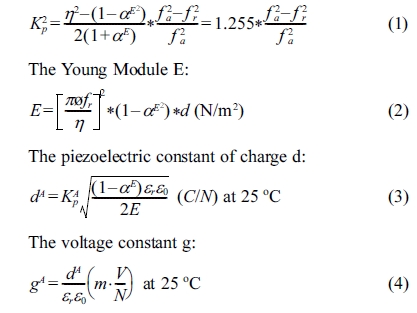
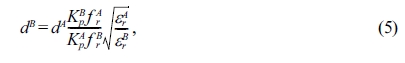
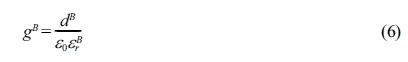
The calculation of the piezoelectric charge constant dB
and the voltage constant gB at high temperatures was done using the
following relations:
With:
Φ: Diameter of the sample (m)
αE: The poisson
coefficient (0.31 for ceramics)
η: The root of the Bessel equation (η
= 2.05)
d: Density (Kg /m3)
ε0: is the
permittivity of free space (8.854*10-12 F/m)
εr: The relative
permittivity
fr : Resonance Frequency
(Hz)
fa : Anti-resonance
frequency (Hz)
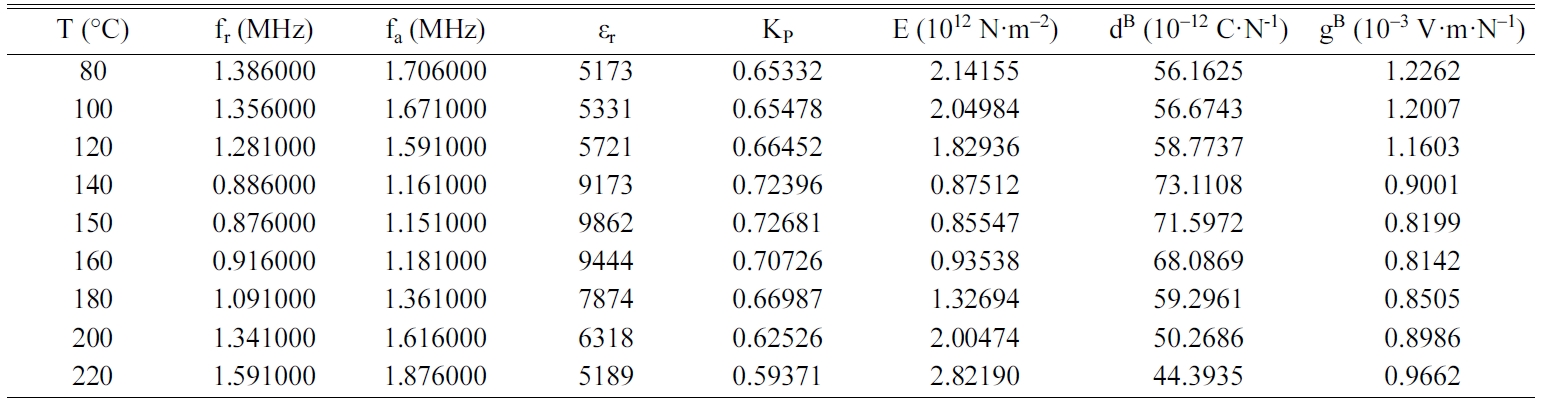
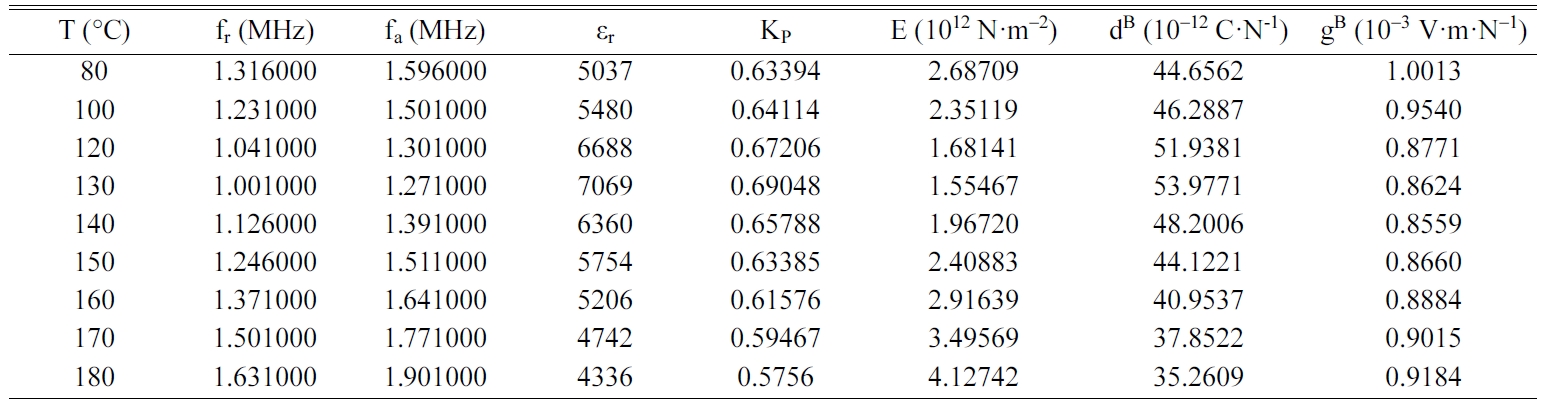
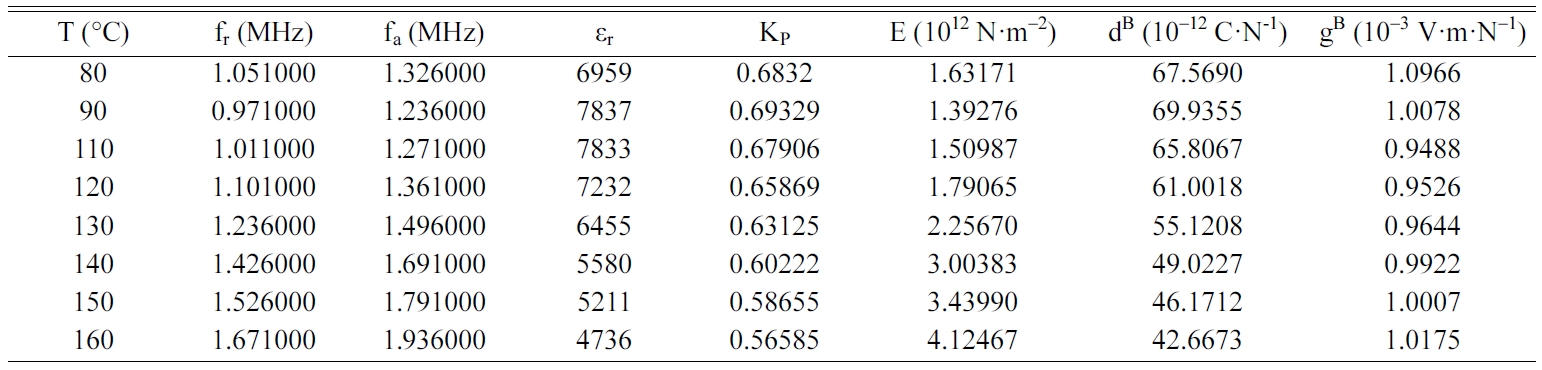
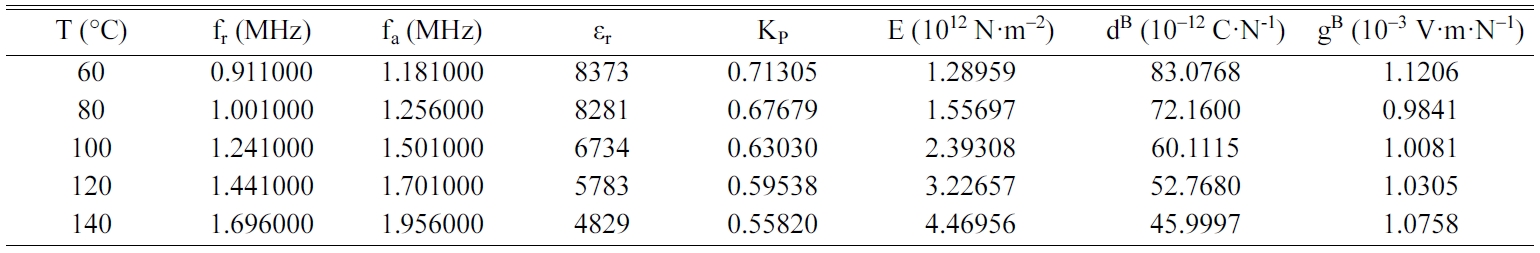
Tables 2, 3, 4 and 5 gather the values of the parameters fr,
fa, εr, Kp, E, dB and gB
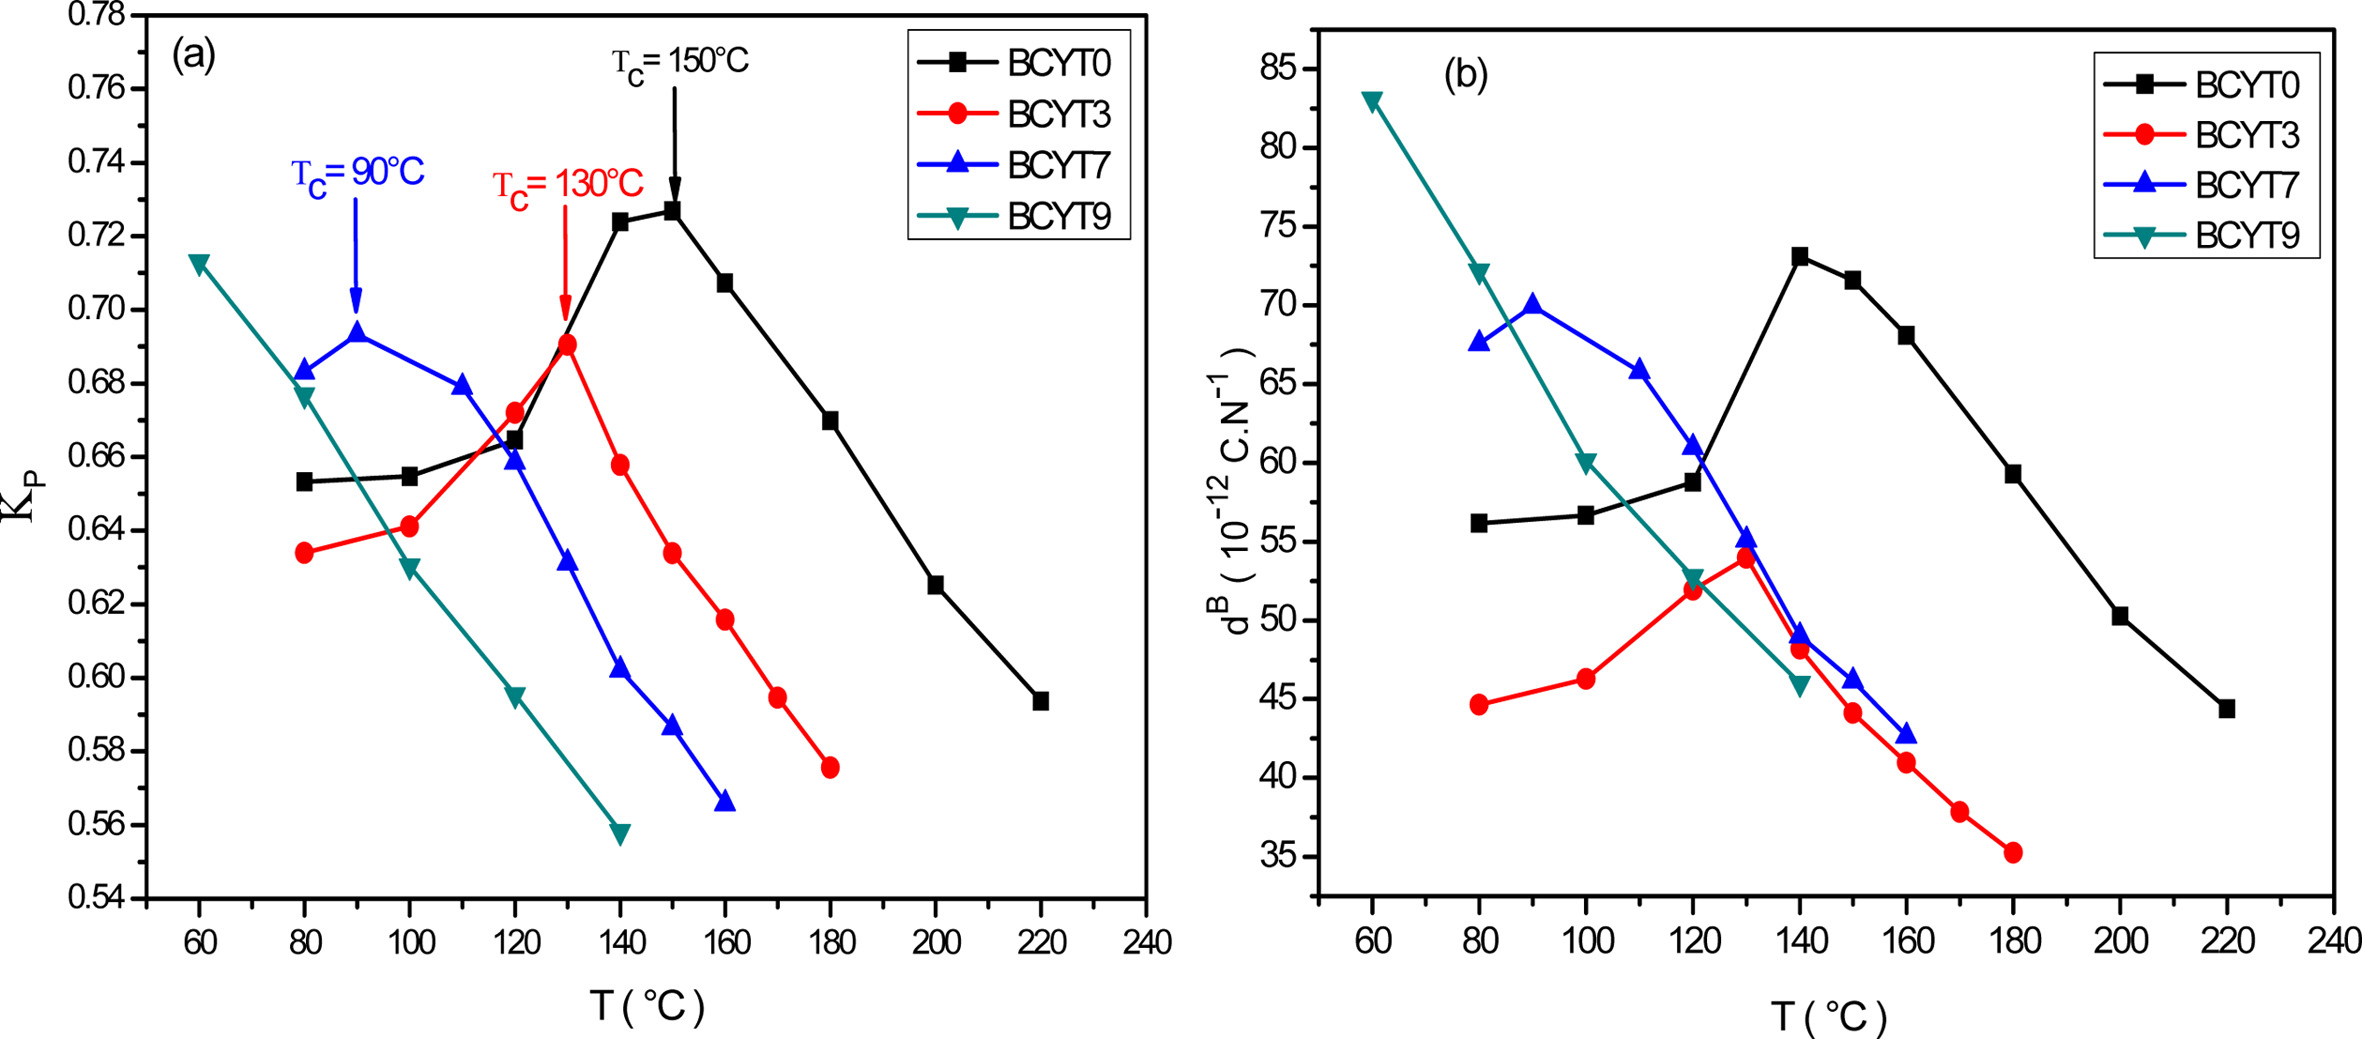
for each temperature of the BCYTx samples (x = 0; 3; 7 and 9%). The planar
electromechanical coupling factor, Kp, represents
the ability of a ceramic to transform electrical energy into
mechanical energy. The values that appear in Tables 2, 3 and 4 show an
increasing behavior of this factor with temperature until a maximum around the
temperature of the ferro-to-paraelectric transition, Tc,
before it decreased (Fig. 4a). It was observed that incorporation of Ce3+
led to a decrease of Tc of the sample BaTi0.97Y0.03O3.
Sabina et al. [16] prepared Ba1-xCexTiO3
(0 ≤ x ≤ 0.04) using the conventional solid state reaction method and has found
that the Tc was decreased with increasing Ce content.
The piezoelectric charge coefficient dB (Fig.
4b), has the same variation as Kp; this coefficient reached its
maximum value around Tc and then decreased. This decrease may be due
to thermal agitation which is responsible of a disorder in the material.
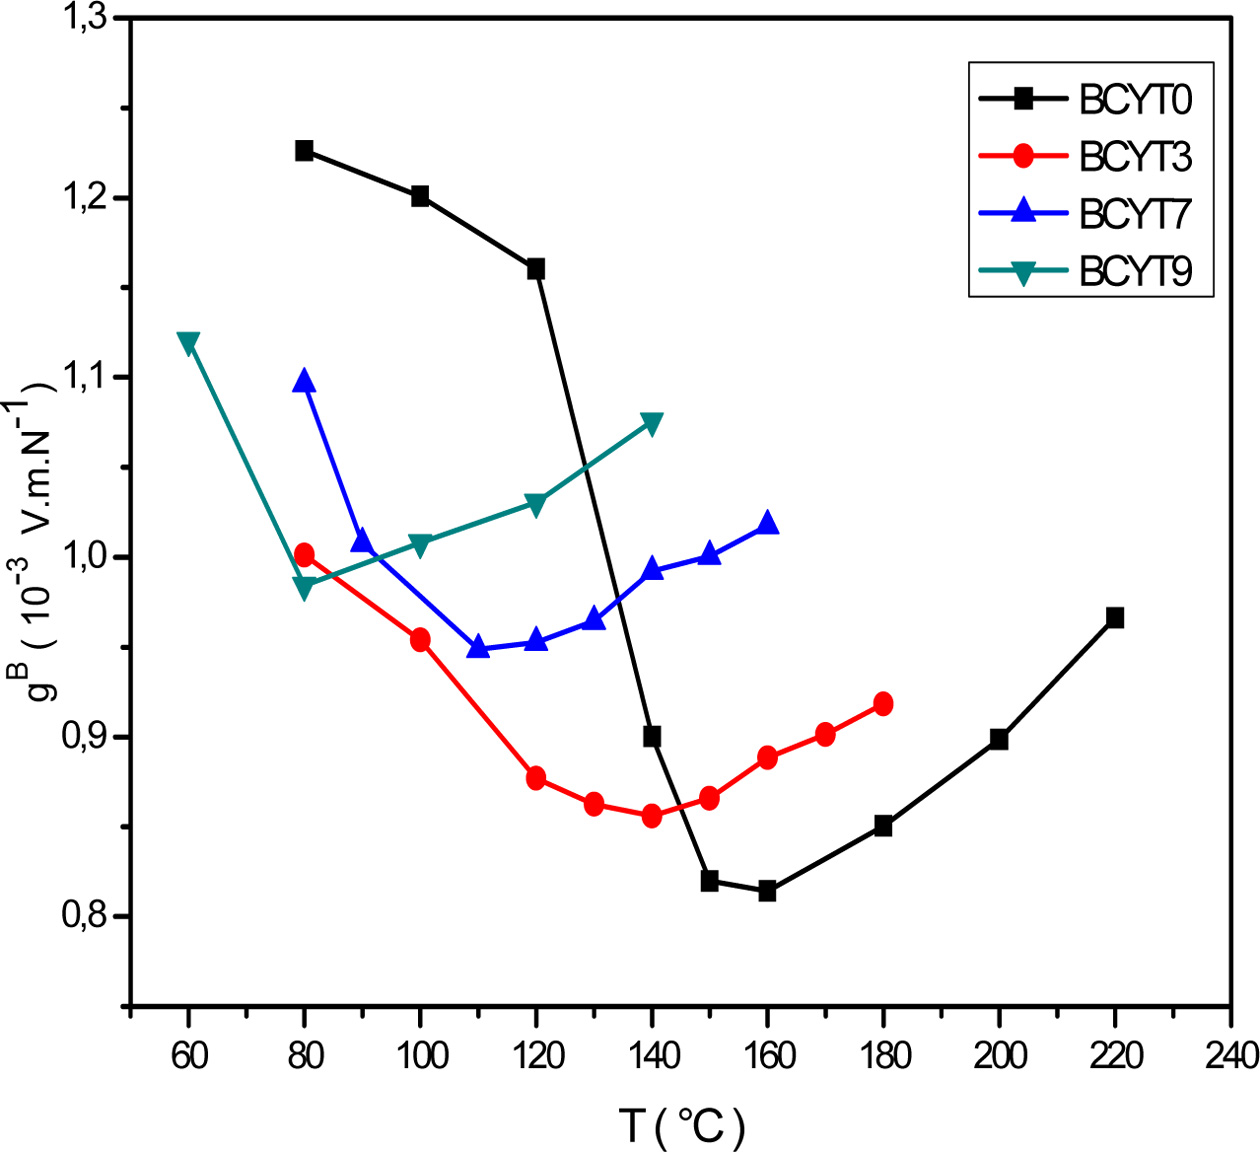
We noticed that the piezoelectric voltage coefficient, gB,
decreased first with increasing temperature and reached its
minimum value around Tc and then increased (Fig.
5). It is clear that optimum values of the piezoelectric
coefficients are all observed around Tc.
Table 6 compares the obtained values of the piezoelectric
parameters for BCYTx samples with some of these constants collected from the
literature. Incorporation of Ce did not improve the piezoelectric constants, in
particular the piezoelectric charge coefficient. Moreover,
lower values of this parameter were recorded compared with those of Brajesh et
al. [19] due probably to the presence of Yttrium in our samples.
Complex
impedance and electrical modulus studies
The electrical properties of a material are normally
determined from the dielectric data with the help of the following relations: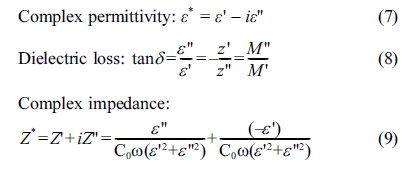
Where ω = 2πf is the angular frequency, C0
is the capacitance of the cell in vacuum, (ε', Z') and (ε'', Z'') are
the real and imaginary components of permittivity and impedance, respectively.
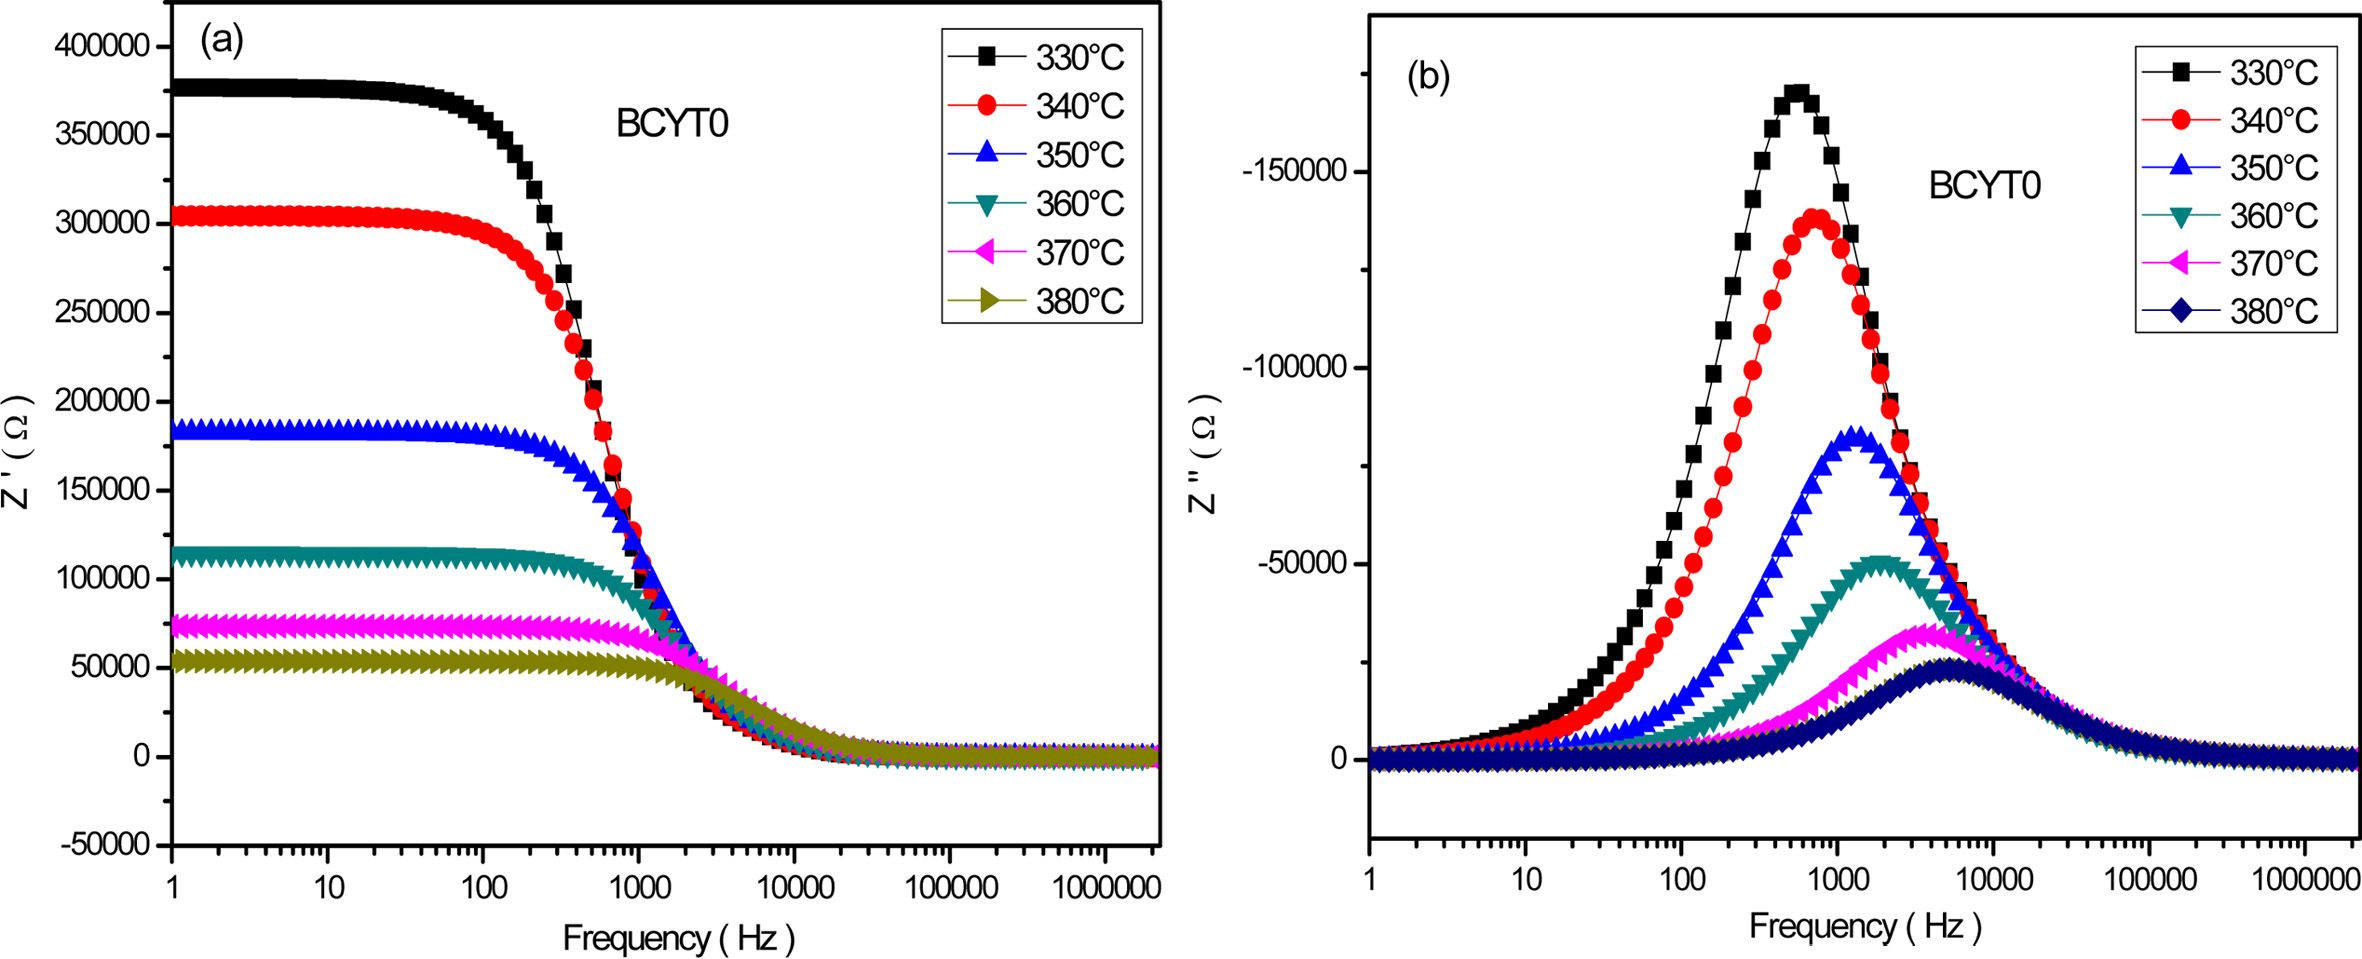
Fig.
6(a) shows the frequency dependence of the real part Z' at different temperatures of the sample BaTi0.97Y0.03O3.
This figure shows a decrease of Z' in the low frequency interval with
increasing temperature followed by a saturation in the high frequency region.
This indicates the presence at low frequency of all types of polarisation
mechanisms in the sample. Fig. 6(b)
displays the frequency dependence of the imaginary part of Z'' at different tempertures of the
sample BCYT0, and shows first an increase of this parameter with frequency
before reaching a maximum that shifts to
the high frequency region with increasing temperature and then decreases to an almost quasi constant
value. The broadening of the peaks indicates a possible distribution of
relaxation times.
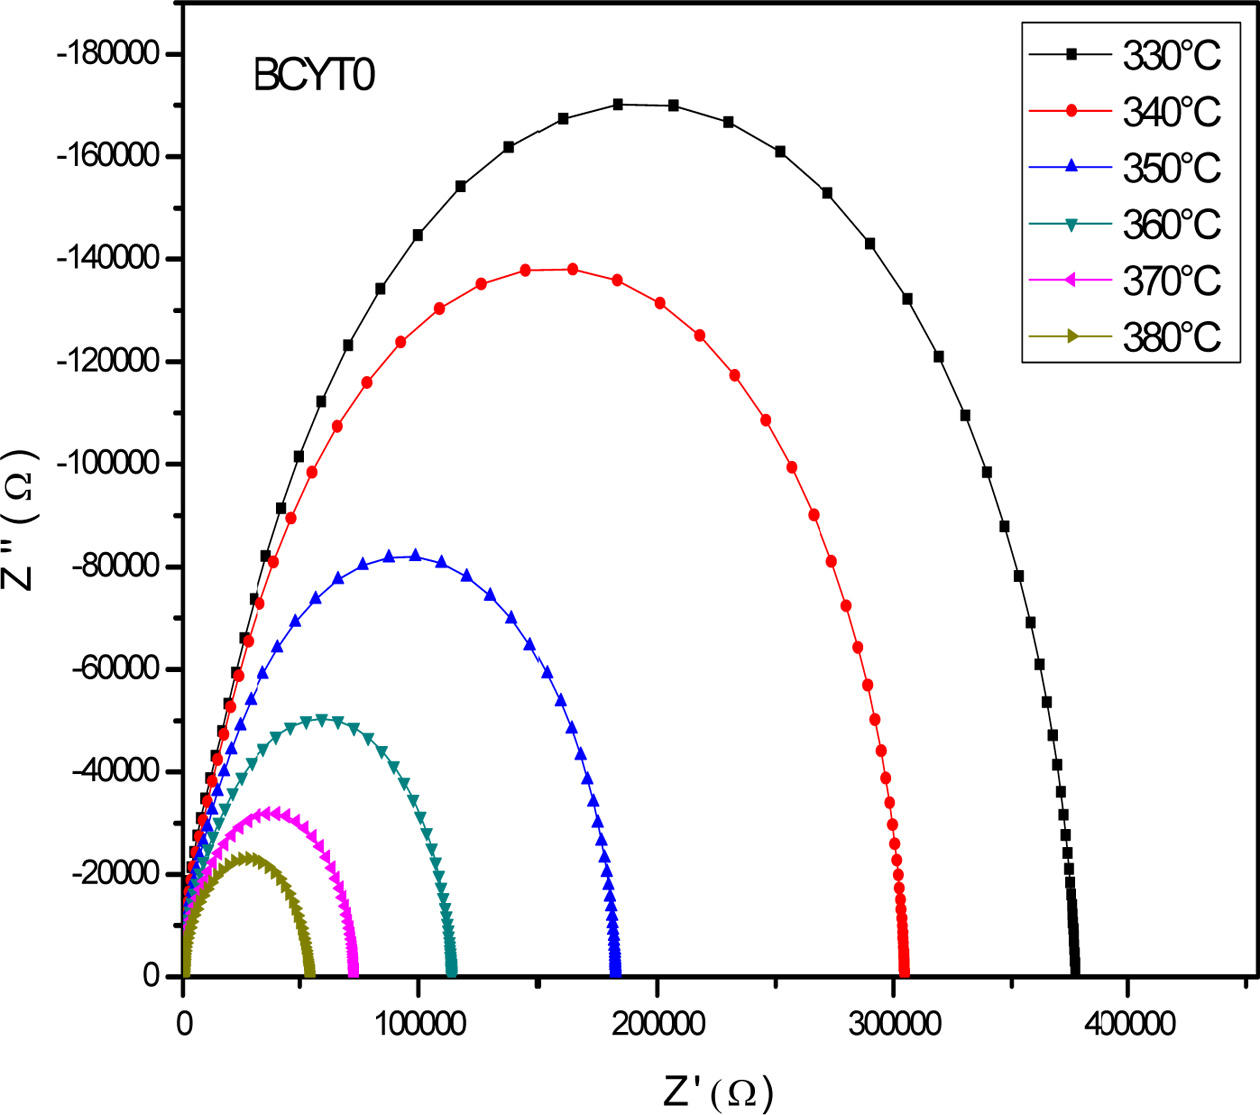
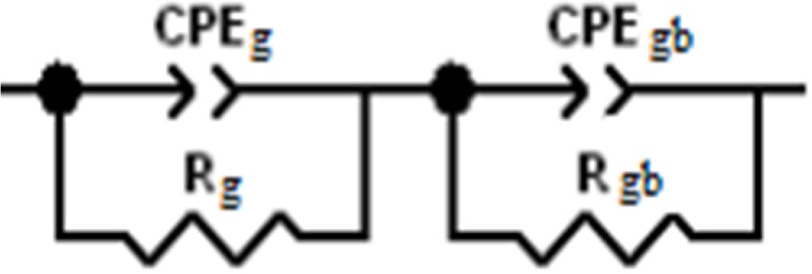
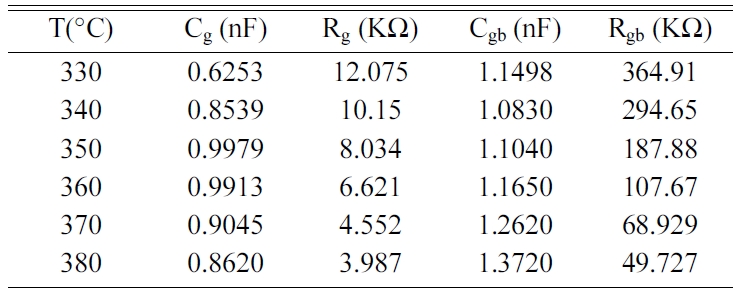
Fig. 7 displays the Nyquist diagram of BCYT0 at different
temperatures, which consisted in half circles that are dominated by the grain
boundaries resistance Rgb. Indeed, grain
resistance (Rg) is very weak compared to that of
the grain boundaries, as revealed by their values gathered in Table 7. The
grain boundaries and grains effects were each modeled by a constant phase
element parallel to a resistance.
El Ghandouri et al. [23] in their dielectric study of Ba1-xLaxTi(1-x/4)O3
(0 ≤ x ≤ 0.4) samples obtained similar results
pointing out the strong effect of grain boundaries on the
conduction mechanism in these compounds.
By adjusting our experimental data with the help of the
equivalent circuit of Fig. 8, values of the capacitance and
the resistance of grains (Cg, Rg) and grain boundaries
(Cgb, Rgb) were determined using Z view software and
given in Table 7.
The complex electrical modulus (M*) is defined as a
function of the complex dielectric permittivity (ε*) by the following relation:
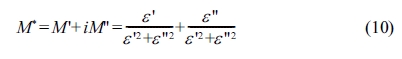
Where M' and M" are the real and imaginary parts of
the complex electric modulus M*, respectively.
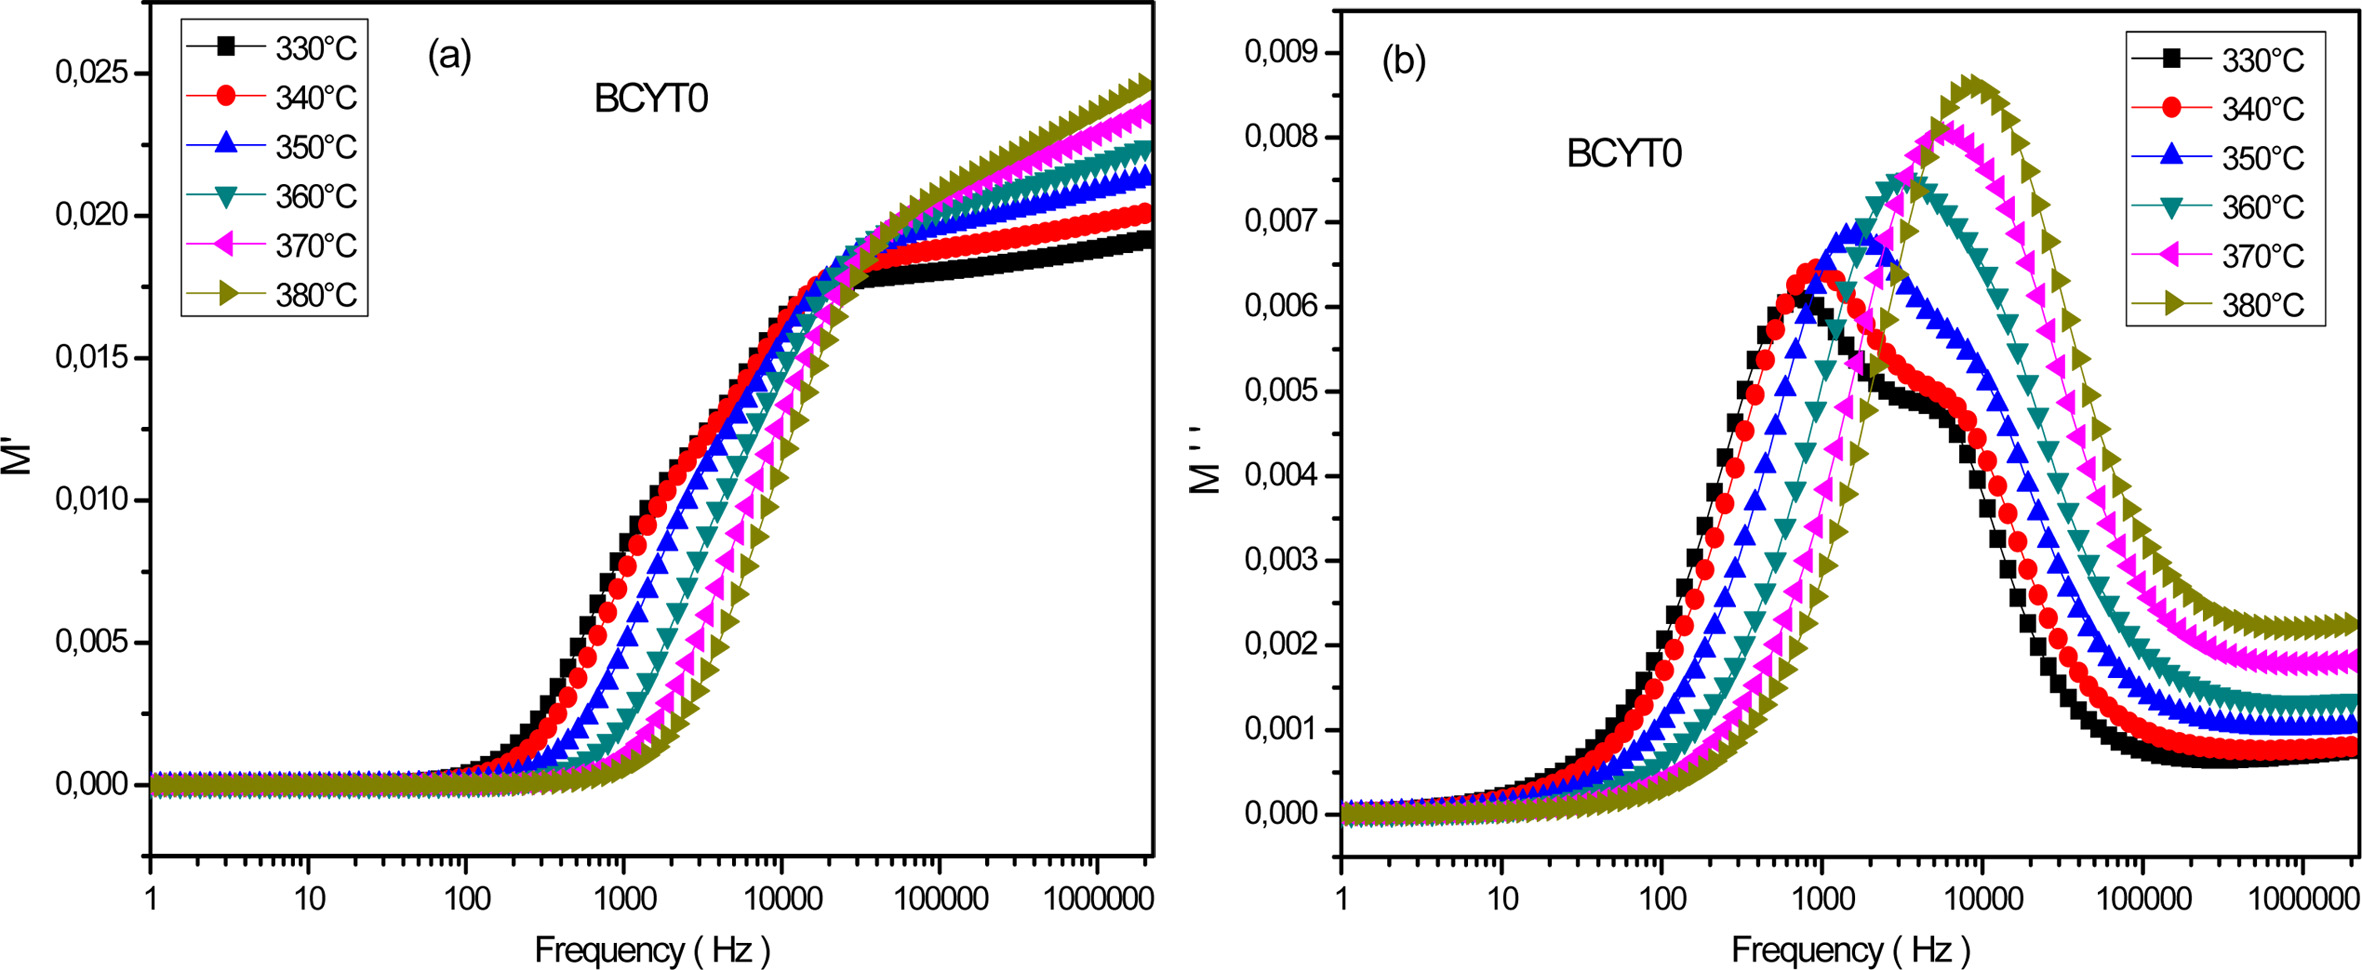
Fig. 9(a) displays the frequency dependence of the real
part of M' determined at different temperatures for the sample BCYT0. This
figure showed a very weak value of M' at low frequencies followed by a
dispersion with increasing frequency and reached a finite limit that increased
with increasing temperature. The latter behavior may be due to the mobility at
short distances of charge carriers [24]. Fig. 9(b) displays the frequency
dependence of the imaginary part M'' at different temperatures
of the sample BCYT0. This figure showed that M''
increased with increasing frequency, passed through a maximum which moved
towards high frequency region and which magnitude increased with temperature.
This behavior suggests a thermal activated relaxation process [24]. Table 2 Table 3 Table 4 Table 5
|
Fig. 1 XRD patterns of BCYTx samples. |
|
Fig. 2 Position of the peak (110) and unit cell volume of BCYTx samples as functions of x. |
|
Fig. 3 Variation of dielectric permittivity with frequency of BCYT3 sintered at 1200 °C for 6 h. |
|
Fig. 4 (a) Thermal variations of the planar electromechanical coupling factor of BCYTx samples, (b) Thermal variations of the piezoelectric charge constant of BCYTx samples. |
|
Fig. 5 Thermal variations of the voltage constant of BCYTx samples. |
|
Fig. 6 (a) Variation of Z' as a function of the frequency for BCYT0 at various temperatures, (b) Variation of Z'' as a function of the frequency for BCYT0 at various temperatures. |
|
Fig. 7 Impedance curves of the sample BCYT0 at various temperatures. |
|
Fig. 8 Equivalent circuits used for fitting the experimental data of the sample BCYT0. |
|
Fig. 9 (a) Variation of M' as a function of the frequency for BCYT0 at various temperatures, (b) Variation of M'' as a function of the frequency for BCYT0 at various temperatures. |
|
Table 2 Values of the piezoelectric parameters of the sample BCYT0 heat treated at 1200 °C |
|
Table 3 Values of the piezoelectric parameters of the sample BCYT3 heat treated at 1200 °C |
|
Table 4 Values of the piezoelectric parameters of the sample BCYT7 heat treated at 1200 °C |
|
Table 5 Values of the piezoelectric parameters of the sample BCYT9 heat treated at 1200 °C |

|
Table 7 The resistance and capacitance of grain and grain boundary at various temperatures of the sample BCYT0. |
Ce-doped BaTi0.97Y0.03O3 ceramics
were successfully prepared and their piezoelectric and impedance constants
determined from resonance and antiresonance values given by dielectric
measurements. Structural analysis showed that Ce3+ ions occupied Ba
sites until x = 0.07 and then incorporated Ti sites indicating that the
concentration 0.07 represents a solubility limit in BaTi0.97Y0.03O3.
It was also observed that in the presence of Yttrium
and in the range of concentrations in Ce studied, the
mechanism of conduction is strongly affected and
dominated by grain boundaries. Moreover, the incorporation of Ce did not
enhance the piezoelectric parameters compared to some published ones. More work
is needed to clarify the role of Y atoms and site occupation of Ce atoms in
inhibiting the piezoelectric constants.
- 1. L. H. Parker and A. F. Tasch, IEEE Circuits Devices Mag 6[1] (1990) 17-26.
-

- 2. K. K. Deb, Ferroelectrics 82[1] (1998) 45-53.
-
- 3. L.A. Thomas, Ferroelectrics 3[1] (1972) 231-238.
-
- 4. D.Y. Lu, Y. Yue, and X.Y. Sun, J. Alloys Compd. 586 (2014) 136-141.
-
- 5. E.P. Pevtsov, E.G. Elkin, and M.A. Pospelova, Int .Soc. Opt. Am. 3200 (1997) 179-182.
-
- 6. R. Guo, L.E. Cross, S.E. Park, B. Noheda, D.E. Cox, and G. Shirane, Phys. Rev. Lett. 84[23] (2000) 5423-5426.
-
- 7. W.F. Liu and X.B. Ren, Phys. Rev. Lett. 103[25] (2009) 257602.
-
- 8. Y. Feng, W.L. Li, D. Xu, Y.-.L. Qiao, Y. Yu, Y. Zhao, and W.-D. Fei, ACS Appl. Mater Interf. 8[14] (2016) 9231-9241.
-
- 9. S.J. Zhang, R.E. Eitel, C.A. Randall, T.R. Shrout, and E.F. Alberta, Appl. Phys. Lett. 86[26] (2005) 262904.
-
- 10. S. Lee, C.A. Randall, and Z.K. Liu, J. Am. Ceram Soc. 91[6] (2008) 1753-1761.
-
- 11. A.A. Yaremchenko, S. Populoh, S.G. Patricio, J. Macias, P. Thiel, D.P. Fagg, A. Weidenkaff, J.R. Frade, and A.V. Kovalevsky, Chem. Mat. 27[14] (2015) 4995-5006.
-
- 12. S.H. Ding, T.X. Song, and G.B. Liu, Ferroelectrics 445[1] (2013) 26-31.
-
- 13. D. Xu, W.L. Li, L.D. Wang, W. Wang, W.P. Cao, and W.D. Fei, Acta Mater 79 (Supplement C) (2014) 84-92.
-
- 14. Y. Feng, W.L. Li, D. Xu, and W.D. Fei, Ferroelectrics 489[1] (2015) 156-163.
-
- 15. F.A. Ismail, R.A.M. Osman, and M.S. Idris, AIP Conference Proceedings 1756 (2016) 090005.
-
- 16. S. Yasmim, S. Choudhury, M.A. Hakim, A.H. Bhuiyan, and M. J. Rahman, J. Mater. Sci. Technol. 27[8] (2011) 759-763.
-
- 17. F. Es-saddik, K. Limame, S. Sayouri, and T. Lamcharfi, J. Mater. Sci.: Mater. Electron. 30[2] (2019) 1821-1831.
-
- 18. Y. Tsur and C.A. Randall, Jpn. J. Appl. Phys. 40[1] (2001) 255-258.
-
- 19. K. Brajesh, A.K. Kalyani, and R. Ranjan. Appl. Phys. Lett. 106[1] (2015) 012907.
-
- 20. B. Jaffe, S. Roth, and S. Marzullo, J. Res. Natl. Bur. Stand. 55[5] (1955) 239-254.
-
- 21. A. El Ghandouri, S. Sayouri, T. Lamcharfi, and L. Hajji, J. Ceram. Process. Res. 19[2] (2018) 154-170.
- 22. L. Zhu, B. Zhang, and W. Yang, Mater. Res. Bull.52 (2014) 158-161.
-
- 23. A. El Ghandouri, S. Sayouri, T. Lamcharfi, and A. Elbasset, J. Adv. Dielect. 9[3] (2019) 1950026.
-
- 24. B.K. Singh and B. Kumar, Cryst. Res. Technol. 45[10] (2010) 1003-1011.
-
 This Article
-
2020; 21(2): 233-239
Published on Apr 30, 2020
- 10.36410/jcpr.2020.21.2.233
- Received on Dec 2, 2019
- Revised on Dec 28, 2019
- Accepted on Jan 2, 2020
Services
Shared
Correspondence to
- Salaheddine Sayouri
-
LPTA, Faculty of Sciences-DM, USMBA, B.P. 1796, Fez-Atlas, Morocco
Tel : +212 6 73 78 52 88 Fax: +212 535 73 33 49 - E-mail: ssayouri@gmail.com
Clean-Energy Research Institute(CRI), Hanyang University, 222, Wangsimni-ro, Seongdong-gu, Seoul, 04763, Korea
E-mail: jcpr@hanyang.ac.kr