


- Effects of nano aluminum nitride on the microstructure and mechanical properties of vitrified bond diamond tools
Kuan-Hong Lina,*, Yuo-Tern Tsaib and Ke-Lun Wanga
aDepartment of Mechanical Engineering, Tungnan University, New Taipei City 222, Taiwan, ROC
bDepartment of Mechanical Engineering, HungKuo Delin University of Technology, New Taipei City 236, Taiwan, ROC
This study investigated the
effects of nano aluminum nitride (AlN) on the microstructure and mechanical
properties of vitrified bond diamond tools. Raman spectra analysis indicated
that added nano AlN helped to protect the diamond crystal structure during
sintering. The diffraction peaks of diamond, AlN, Al2O3,
and a few of SiO2 crystal were observed in the X-ray diffraction
analysis. However, a lower sintering temperature of 690 oC in this
study decreased the formation of Al2O3 and α-SiO2
phases. Scanning electron microscope images showed that addition of 10 vol%
nano AlN into the specimen provided an appropriate wetting and bonding between
the diamond grits and the matrix, thus producing the highest grinding ratio
(24.1) of the tools and the best workpiece surface roughness. The added amount
of nano AlN higher than 20 vol% would trigger gas eruption from the matrix
during the sintering process, which produced a larger number of pores and
caused the vitrified matrix expansion. The deteriorated microstructure
decreased the mechanical properties of vitrified bond diamond tools.
Keywords: Nano AlN, Vitrified bond diamond tool, Microstructure, Grinding ratio
The pores of different sizes can be easily introduced into
the matrix structure; therefore vitrified bond diamond (VBD) tools
generally have an outstanding capacity for the chips removal and heat
dissipation. As a result, VBD tools possess an excellent grinding performance, and
the workpieces that can maintain a preferred surface roughness
[1-6]. However, the artificial diamonds usually contain some
active metal components that can cause the diamonds to be catalyzed easily, and
transformed from diamond structures into graphite during sintering process,
consequently decreasing the mechanical properties of the VBD
tools. Solutions aimed at addressing this phenomenon include the following:
sintering at low temperatures, decreasing the isothermal holding
duration, introducing a protective atmosphere, and the addition of
elements that provide protection for the diamond grits [7-14].
However, sintering at low temperatures or decreasing the
isothermal holding duration caused the insufficient bonding force between the
diamond grit and the vitrified matrix, thus increasing the likelihood of the
diamond grit being pulled off from the matrix when the given diamond is still
sharp. Consequently, decreasing the grinding efficiency of the VBD tool and
increasing the workpiece surface roughness [1-3, 15]. Previous studies have
indicated that the appropriate sintering parameters
for the diamond/borosilicate glass composites are a
sintering temperature of 710 oC and isothermal holding
duration of 90 min [2, 3]. In this study, we hoped to realize
whether the addition of nano aluminum nitride (nano AlN) to the specimen would
allow for a reduction of the sintering temperature and isothermal holding
duration, as well as promotion the grinding performance of VBD tools.
Previous studies have indicated that nano AlN has high
surface energy; thus adding it into glass matrix can assist in
reducing the sintering temperature required [12].
Researchers also noted that nano AlN sintered at 730 oC in the air
becomes oxidized and decomposed into Al2O3 and gas, as
well as result in the porosity increased in the matrix structure [11]. Those
studies also found that when nano AlN is sintered at 730 oC in argon
atmosphere, only a small quantity of Al2O3 is formed.
In addition, the nano AlN becomes a crystallization nucleus and
promotes the crystallization of α-SiO2, β-SiO2, and
tridymite during the sintering process, and refine the microstructure of the
crystal phase. The researchers involved further stated that the addition of
nano AlN to the glass matrix can increase the flexural strength and wear
resistance, with the optimal amount for addition being 6 wt% [10, 11].
In this study, a borosilicate glass was chosen as the
matrix of the VBD tools, and 0 to 60 vol% of nano AlN was added into the
matrix, after which sintering in the atmosphere was conducted. The sintered
specimens were examined using an X-ray diffraction analyzer (XRD), a Raman
spectrometer, and a scanning electron microscope (SEM) with an energy
dispersive spectrum analysis (EDS). The microstructure observation and the
measurement of sintered density, matrix hardness, and grinding ratio (G-ratio)
test of the sintered specimen were also executed. The effects of the added nano
AlN on the microstructure and mechanical properties of the VBD tools were
investigated. Finally, the optimal amount of nano AlN to add in VBD tools is
suggested based on the analytical results.
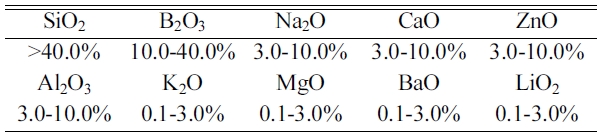
Table 1 shows the composition of the borosilicate glass
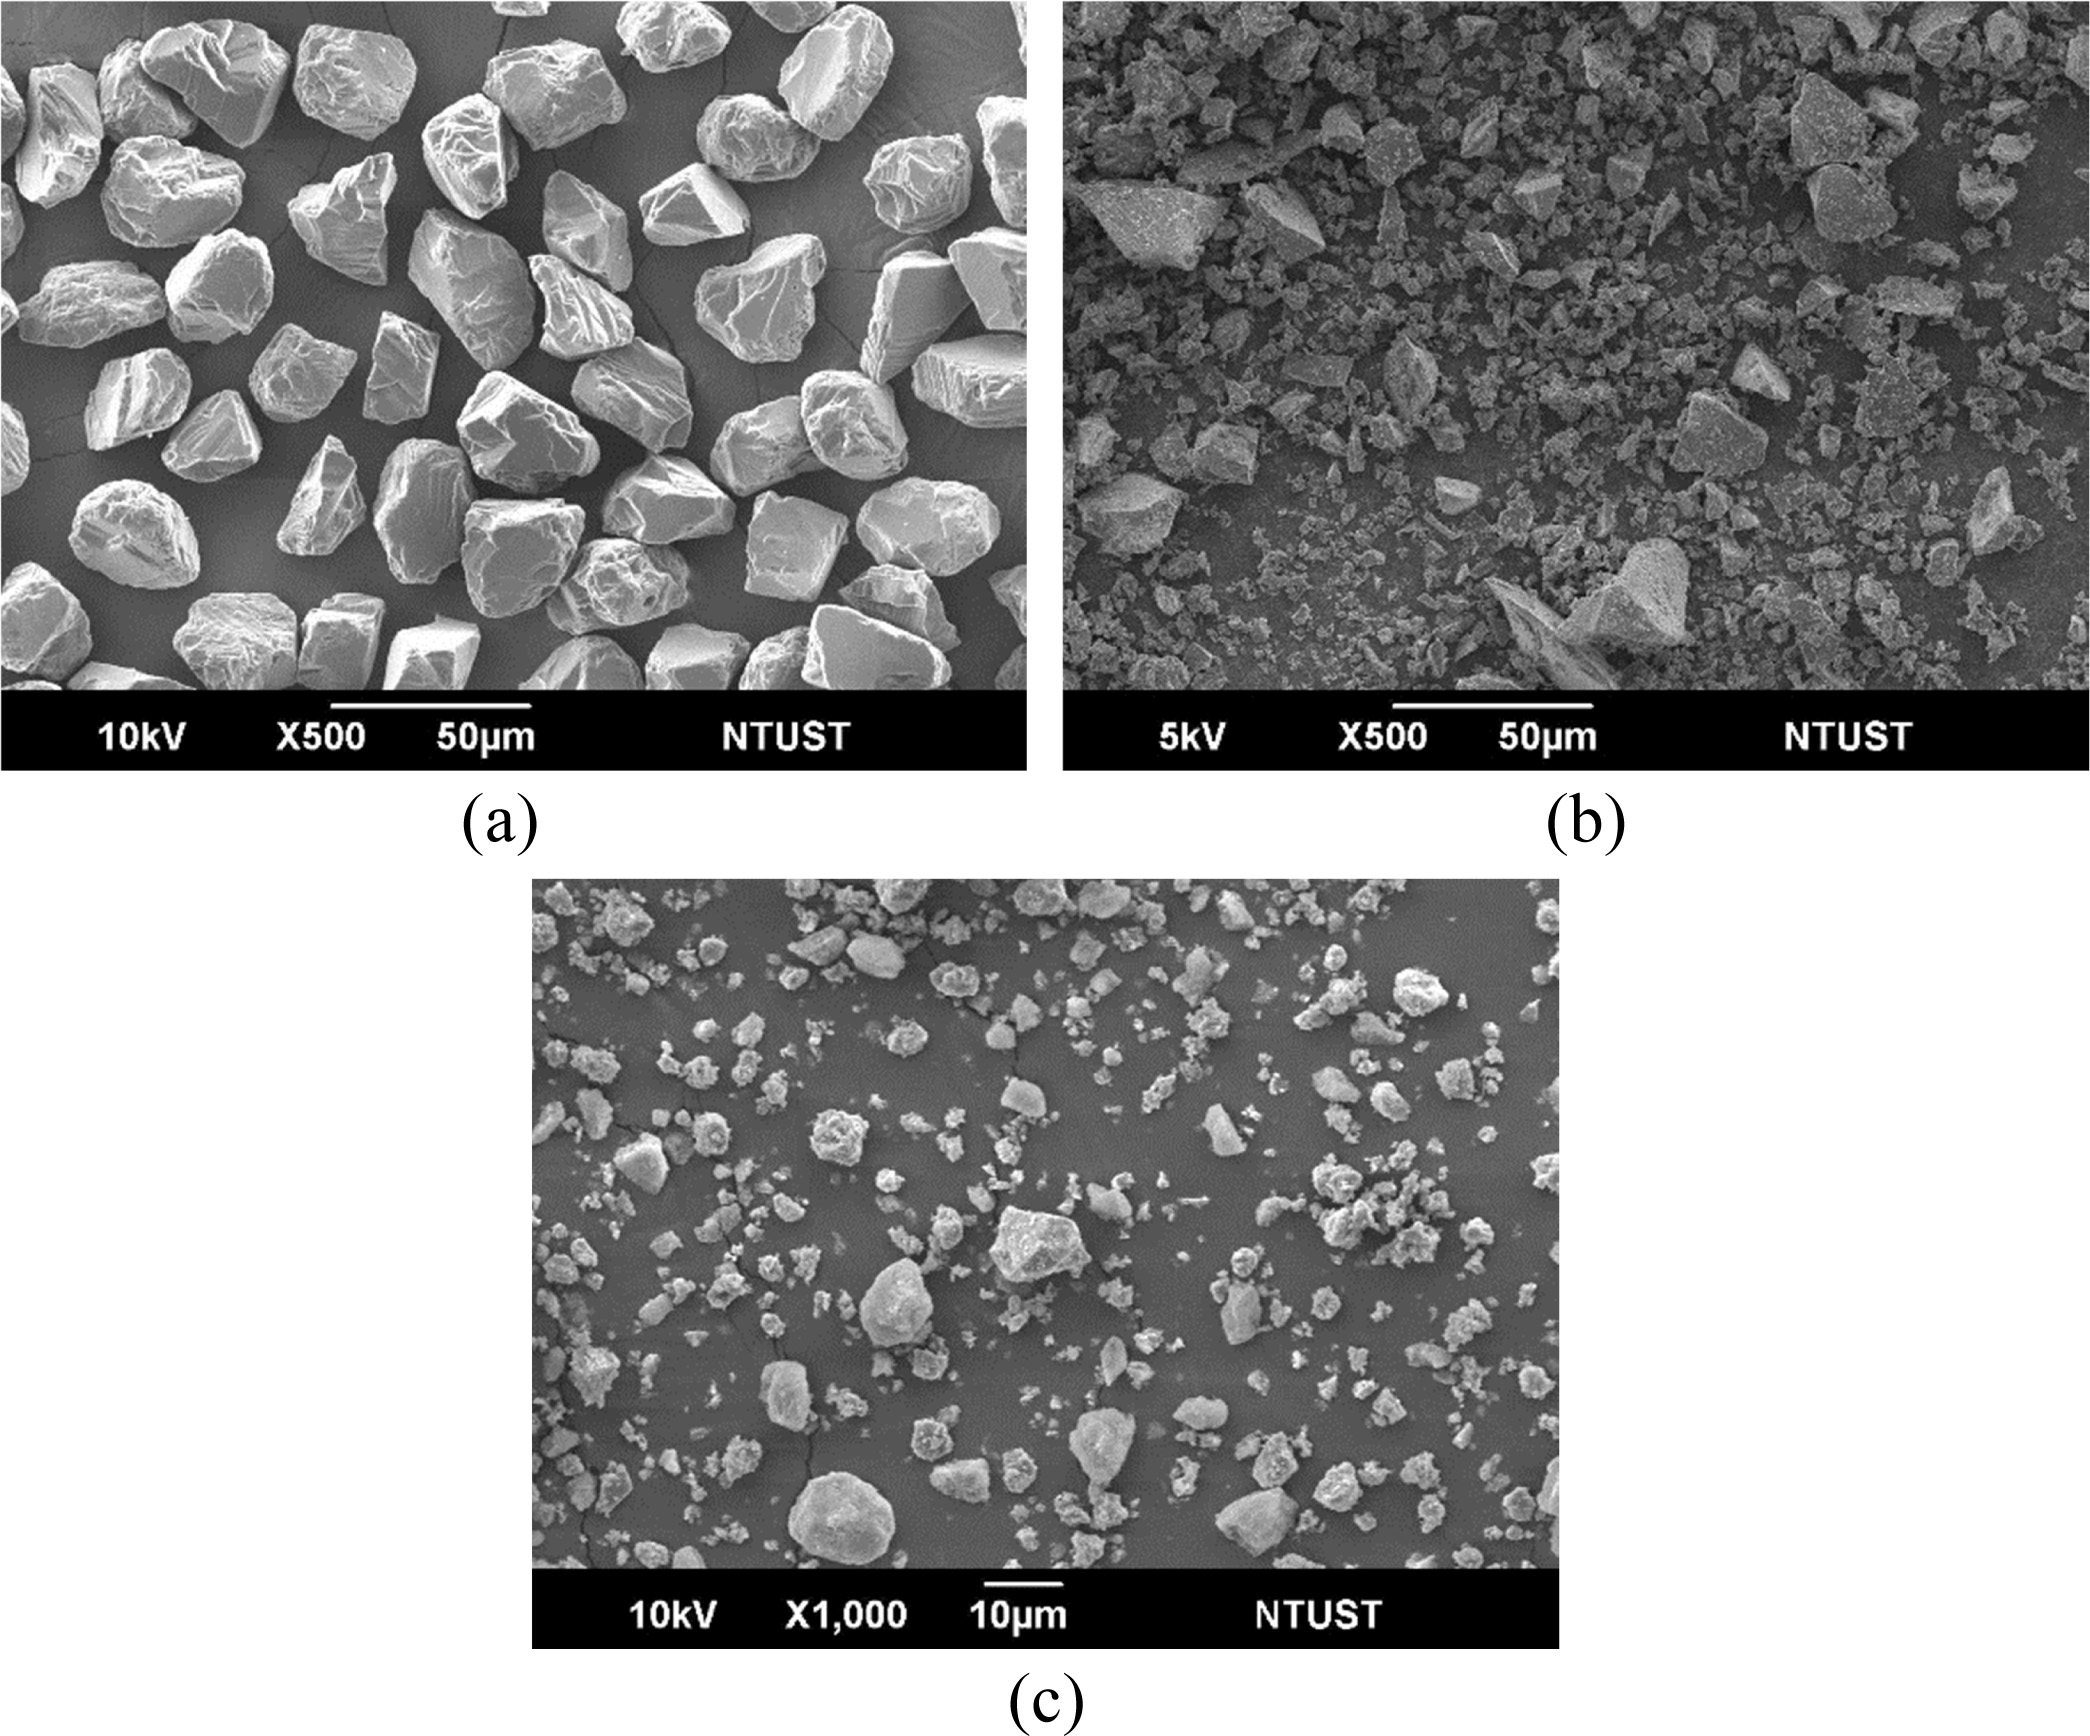
(China Glaze, CT-1124). The average particle sizes of the borosilicate glass
and synthetic diamond (GE, FM 30-40) were around 20.6 μm and 30.8 μm,
respectively. The nano AlN (Bojun, WU-AlN-001, density 0.15 g/cm3)
used in this study with a mean size around 50 nm. The
synthetic diamond grits, borosilicate glass powder, and nano AlN,
whose SEM micrographs are shown in Fig. 1. The specimens had a 1:3:1 volume
proportion of diamond grits, glass powder, and paraffin wax.
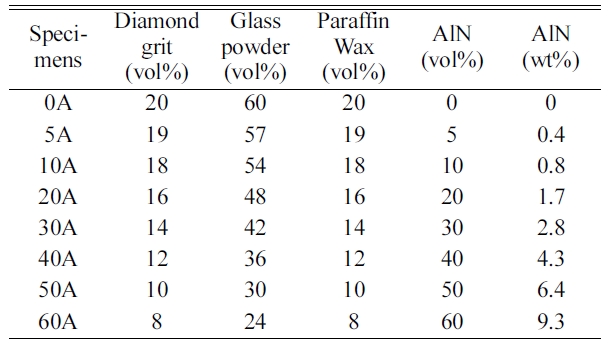
The designations and compositions of the specimens investigated
in this study are shown in Table 2, with the added amounts of nano AlN ranging
from 0 to 60 vol%.
The diamond grits and glass powder were mixed and blended
in a plastic jar for 12 h in the presence of heptane and paraffin wax, using
zirconia balls. The powder slurry was then dried at 60 oC for
90 min and the granules were sieved through a screen of 100 mesh. Nano AlN was
subsequently added and mixed with the dried granules according to the
experimental condition. The cylindrical specimens, with the dimensions of 30 mm
in diameter and 3 mm in height, were die-pressed with a pressure of 30 MPa. The
thermal profile was composed of heating at 5 oC/min to 250 oC,
held for 30 min to burn off the paraffin, and then 3 oC/min to 600 oC,
held for 60 min. This profile was followed by heating at 1 oC/min to
690 oC, held for 90 min. All of the specimens were then
furnace-cooled. A constant air flow was maintained in order to clear the tube
furnace until the temperature reached 500 oC, after which the
specimens were sintered in the atmosphere.
A thermogravimetric analyzer (TGA, TA Instrument Q500) and
a differential scanning calorimetry (DSC, Netzsch Instrument 404 F3) applied a
heating rate of 5 oC/min from
25 oC to 900 oC were carried out for thermal
analyses of the diamond grits and glass powder, respectively. The XRD
(Shimadzu, XRD-6000) with Cu Ka radiation at an acceleration voltage of 30 kV
and current of 30 mA, and diffraction angles of 20° to 100° was
carried out for examined the sintered specimens. A Raman
spectrometer (Lambda Solution, P2) was used to investigate the possible
degradation of diamond grits at high temperatures. The
wavelength of the excitation laser was 780 nm. A SEM (JEOL,
JSM-6390LV) with a working voltage 30 kV was used for examined the
microstructure of sintered specimens and G-ratio test specimens. In addition,
this study also analyzes the radial shrinkage percentages, sintered densities,
matrix hardness, and G-ratios of the sintered specimens. The surface roughness
of the workpieces after G-ratio tests was recorded by a surface
roughness measuring instrument (Kosaka Laboratory Ltd, SEF-3500).
|
Fig. 1 SEM micrographs of the: (a) diamond grits, (b) glass powder, and (c) nano AlN used in this study. |
Thermal
analysis
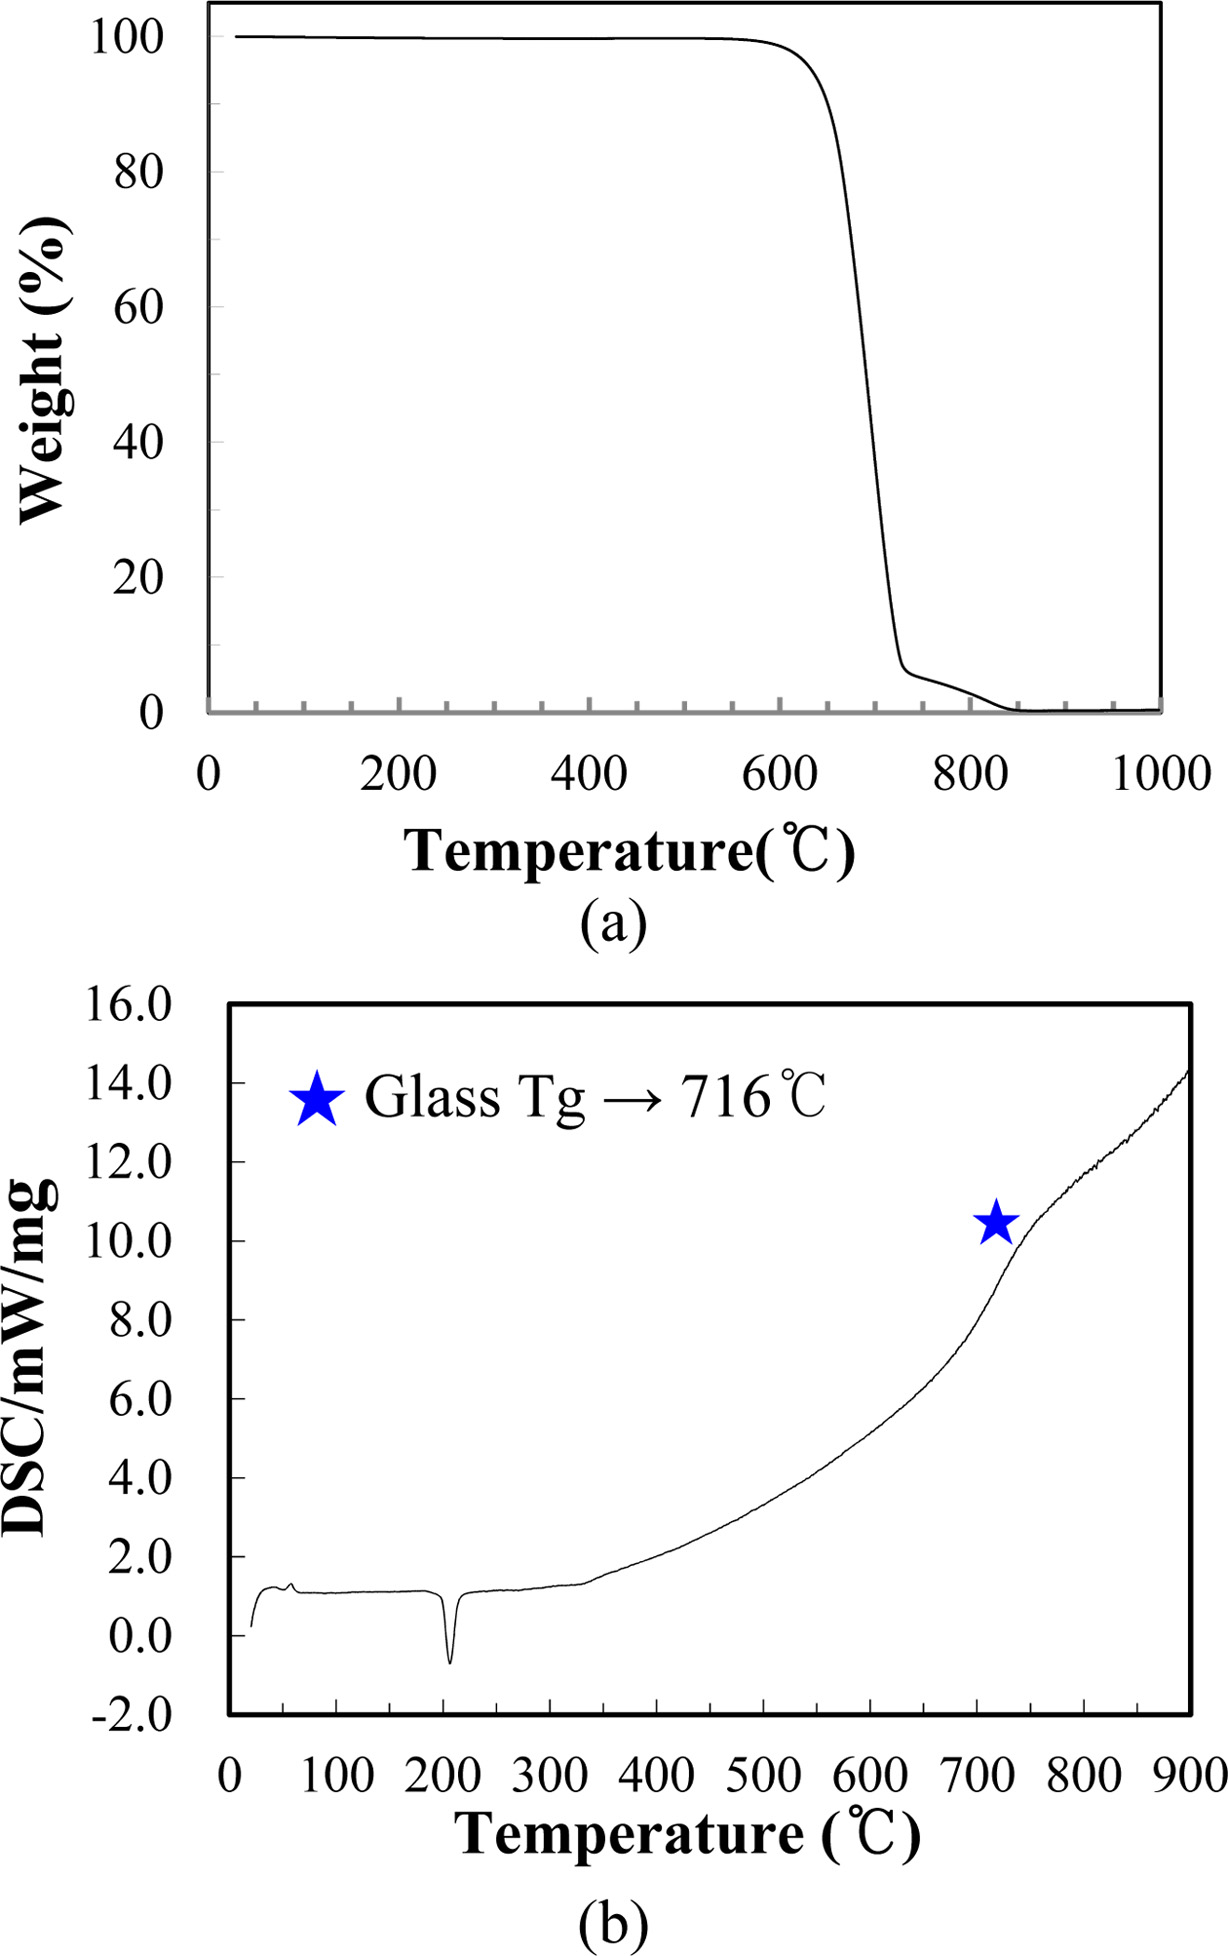
The diamond powder used in this study was subjected
to thermogravimetric analysis under an atmospheric environment. The results
showed a rapid weight loss of the diamonds between 620 oC and
720 oC, with the weight loss being close to 90 wt% at the
temperature of 720 oC (Fig. 2(a)). The DSC analyze of glass
powder and paraffin wax was observed an endothermic peak at 203 oC,
which indicating the volatilization temperature of the paraffin, and also
revealed that glass transition temperature (Tg) was approximately 716 oC
(Fig. 2(b)). In addition, the glass softening temperature offered by the glass powder
manufacturer was approximately 640 oC.
Raman
spectroscopy analysis
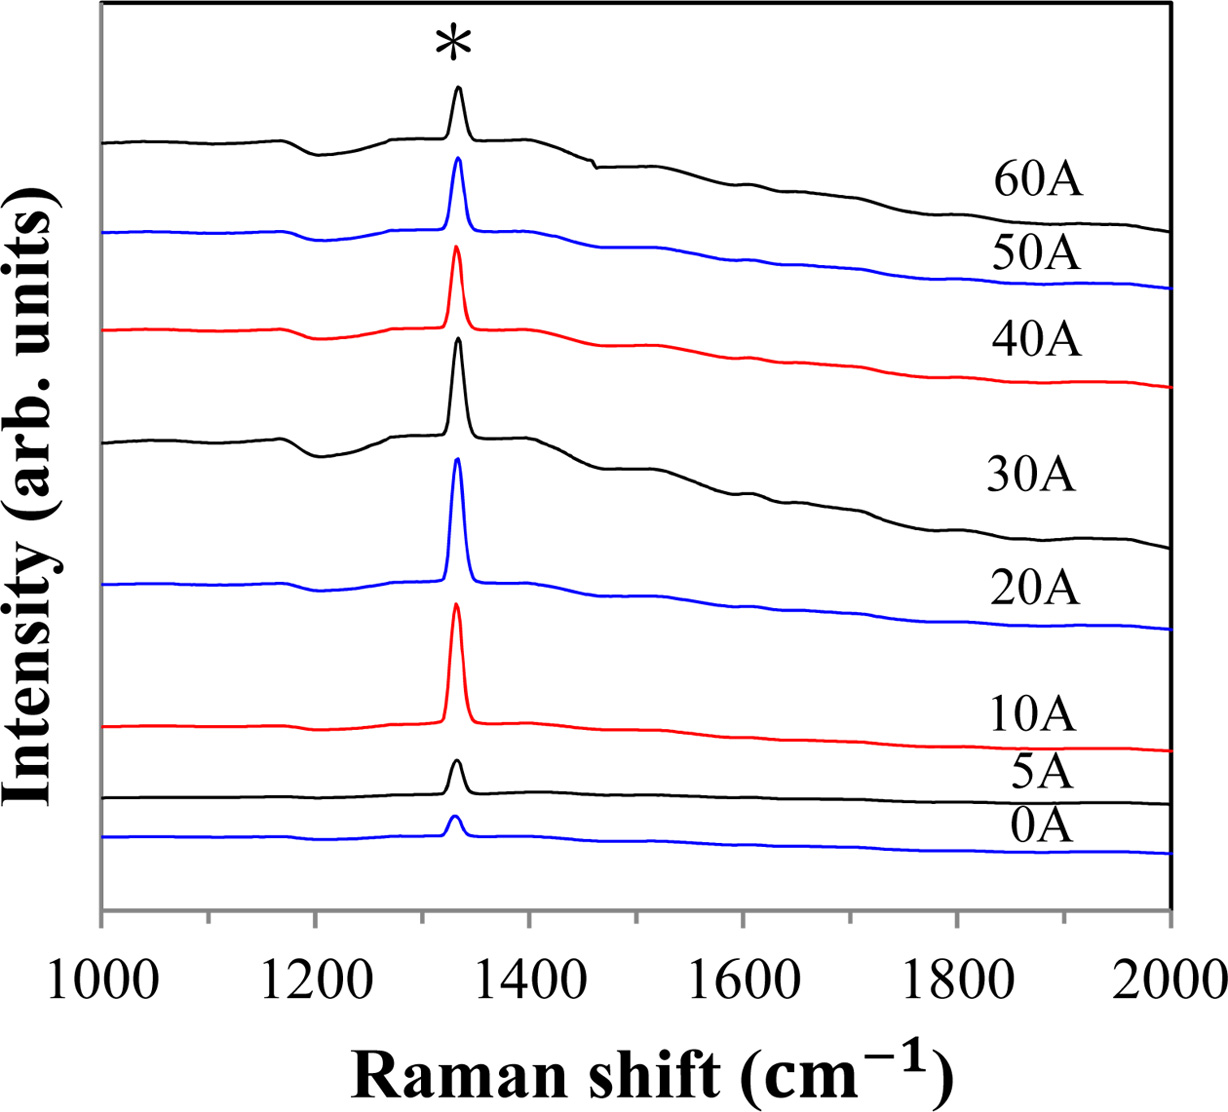
The Raman spectra of all the sintered specimens were shown
in Fig. 3. A sharp peak at 1330.4 cm-1
can be observed, which belongs to the crystalline diamond C-C bond D-band
signal [16-19]. It is notable that the intensity of the D-band signal varies
according to the amount of nano AlN that was added. The 10A and 20A specimens
had the most intense D-band signals, which indicated that the amounts of nano
AlN added to these specimens were the most appropriate for protecting the
crystal structure of the diamond during sintering.
However, the D-band signal intensity gradually decreased when the
amount of nano AlN added over 20 vol%, and
resulting in diamond crystal with lower quality and composition. Moreover, no
obvious G-band signals belonging to the graphite were observed at the range of
1550 cm-1
to 1600 cm-1.
As such, it was concluded that the sintering parameters of a sintering
temperature of 690 oC and isothermal holding for 90 min
used in this study are appropriate for the fabrication of VBD
tools.
XRD analysis
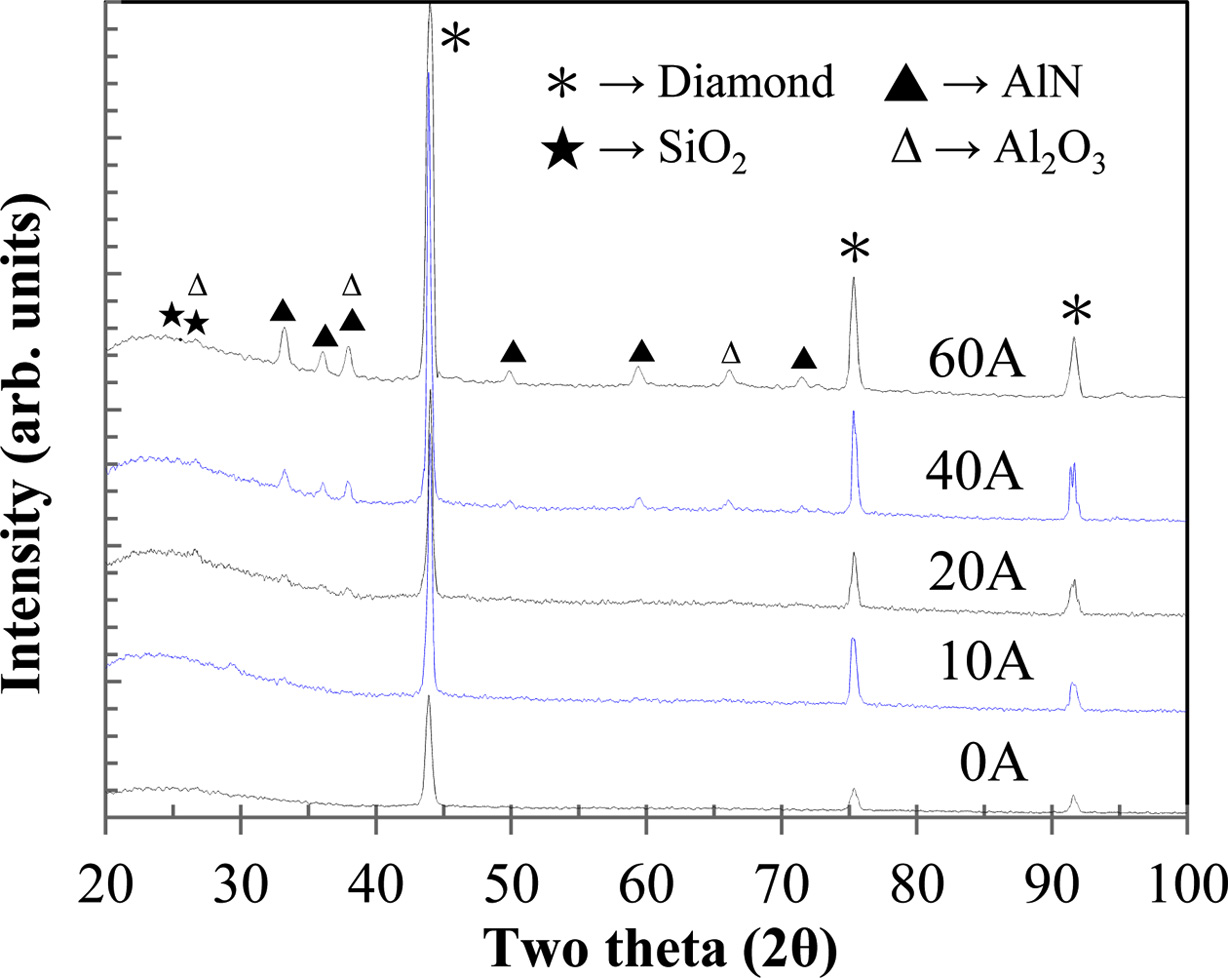
Fig. 4 displays the XRD patterns of the sintered specimens
0A, 10A, 20A, 40A, and 60A. Three obvious diffraction
peaks were observed, the 2θ angles were 44.0°, 75.3°, and 91.5°, respectively,
which correspond to the 2θ angles of the (111), (220), and (311) planes of
diamond crystal (JCPDS 65-0537). It is noteworthy that the specimens added with
higher percentages of nano AlN exhibited the stronger
diffraction peaks of diamond crystal. In addition, the 40A
and 60A specimens also exhibited the diffraction peaks of AlN, the 2θ angles of
which were 33.1°, 35.8°, 37.9°, 49.8°, 59.2°, and 71.3°, respectively, which
corresponded to 2θ angles of the (100), (002), (101), (102), (110) and (112)
planes of aluminum nitride (JCPDS 89-3446). However, for the specimen to which
10 vol% AlN was added, no obvious diffraction peaks of AlN were observed.
As can be seen in Fig. 4, not only the diffraction peaks
of diamond and AlN but also those of the Al2O3 phase
(JCPDS 81-1667) were observed. In addition, two tiny diffraction peaks of SiO2
phase (JCPDS 89-7499) were also observed between the two theta values of 20° and
30°. As noted above, previous studies have reported that
nano AlN is easily oxidized and decomposed into Al2O3
and NO2 when sintering in the air, as well as nano AlN sintered in
argon becomes a crystallization nucleus and promotes the crystallization of α-SiO2,
β-SiO2, and tridymite during the sintering process [10-11].
However, only the Al2O3 phase was clearly observed
in our study. The sintering temperature used in this study was only 690 oC,
maybe the lower sintering temperature have resulted in less phase formation of α-SiO2
and β-SiO2, such that those could not be detected clearly in the XRD
patterns [20, 21].
Microstructure
analysis
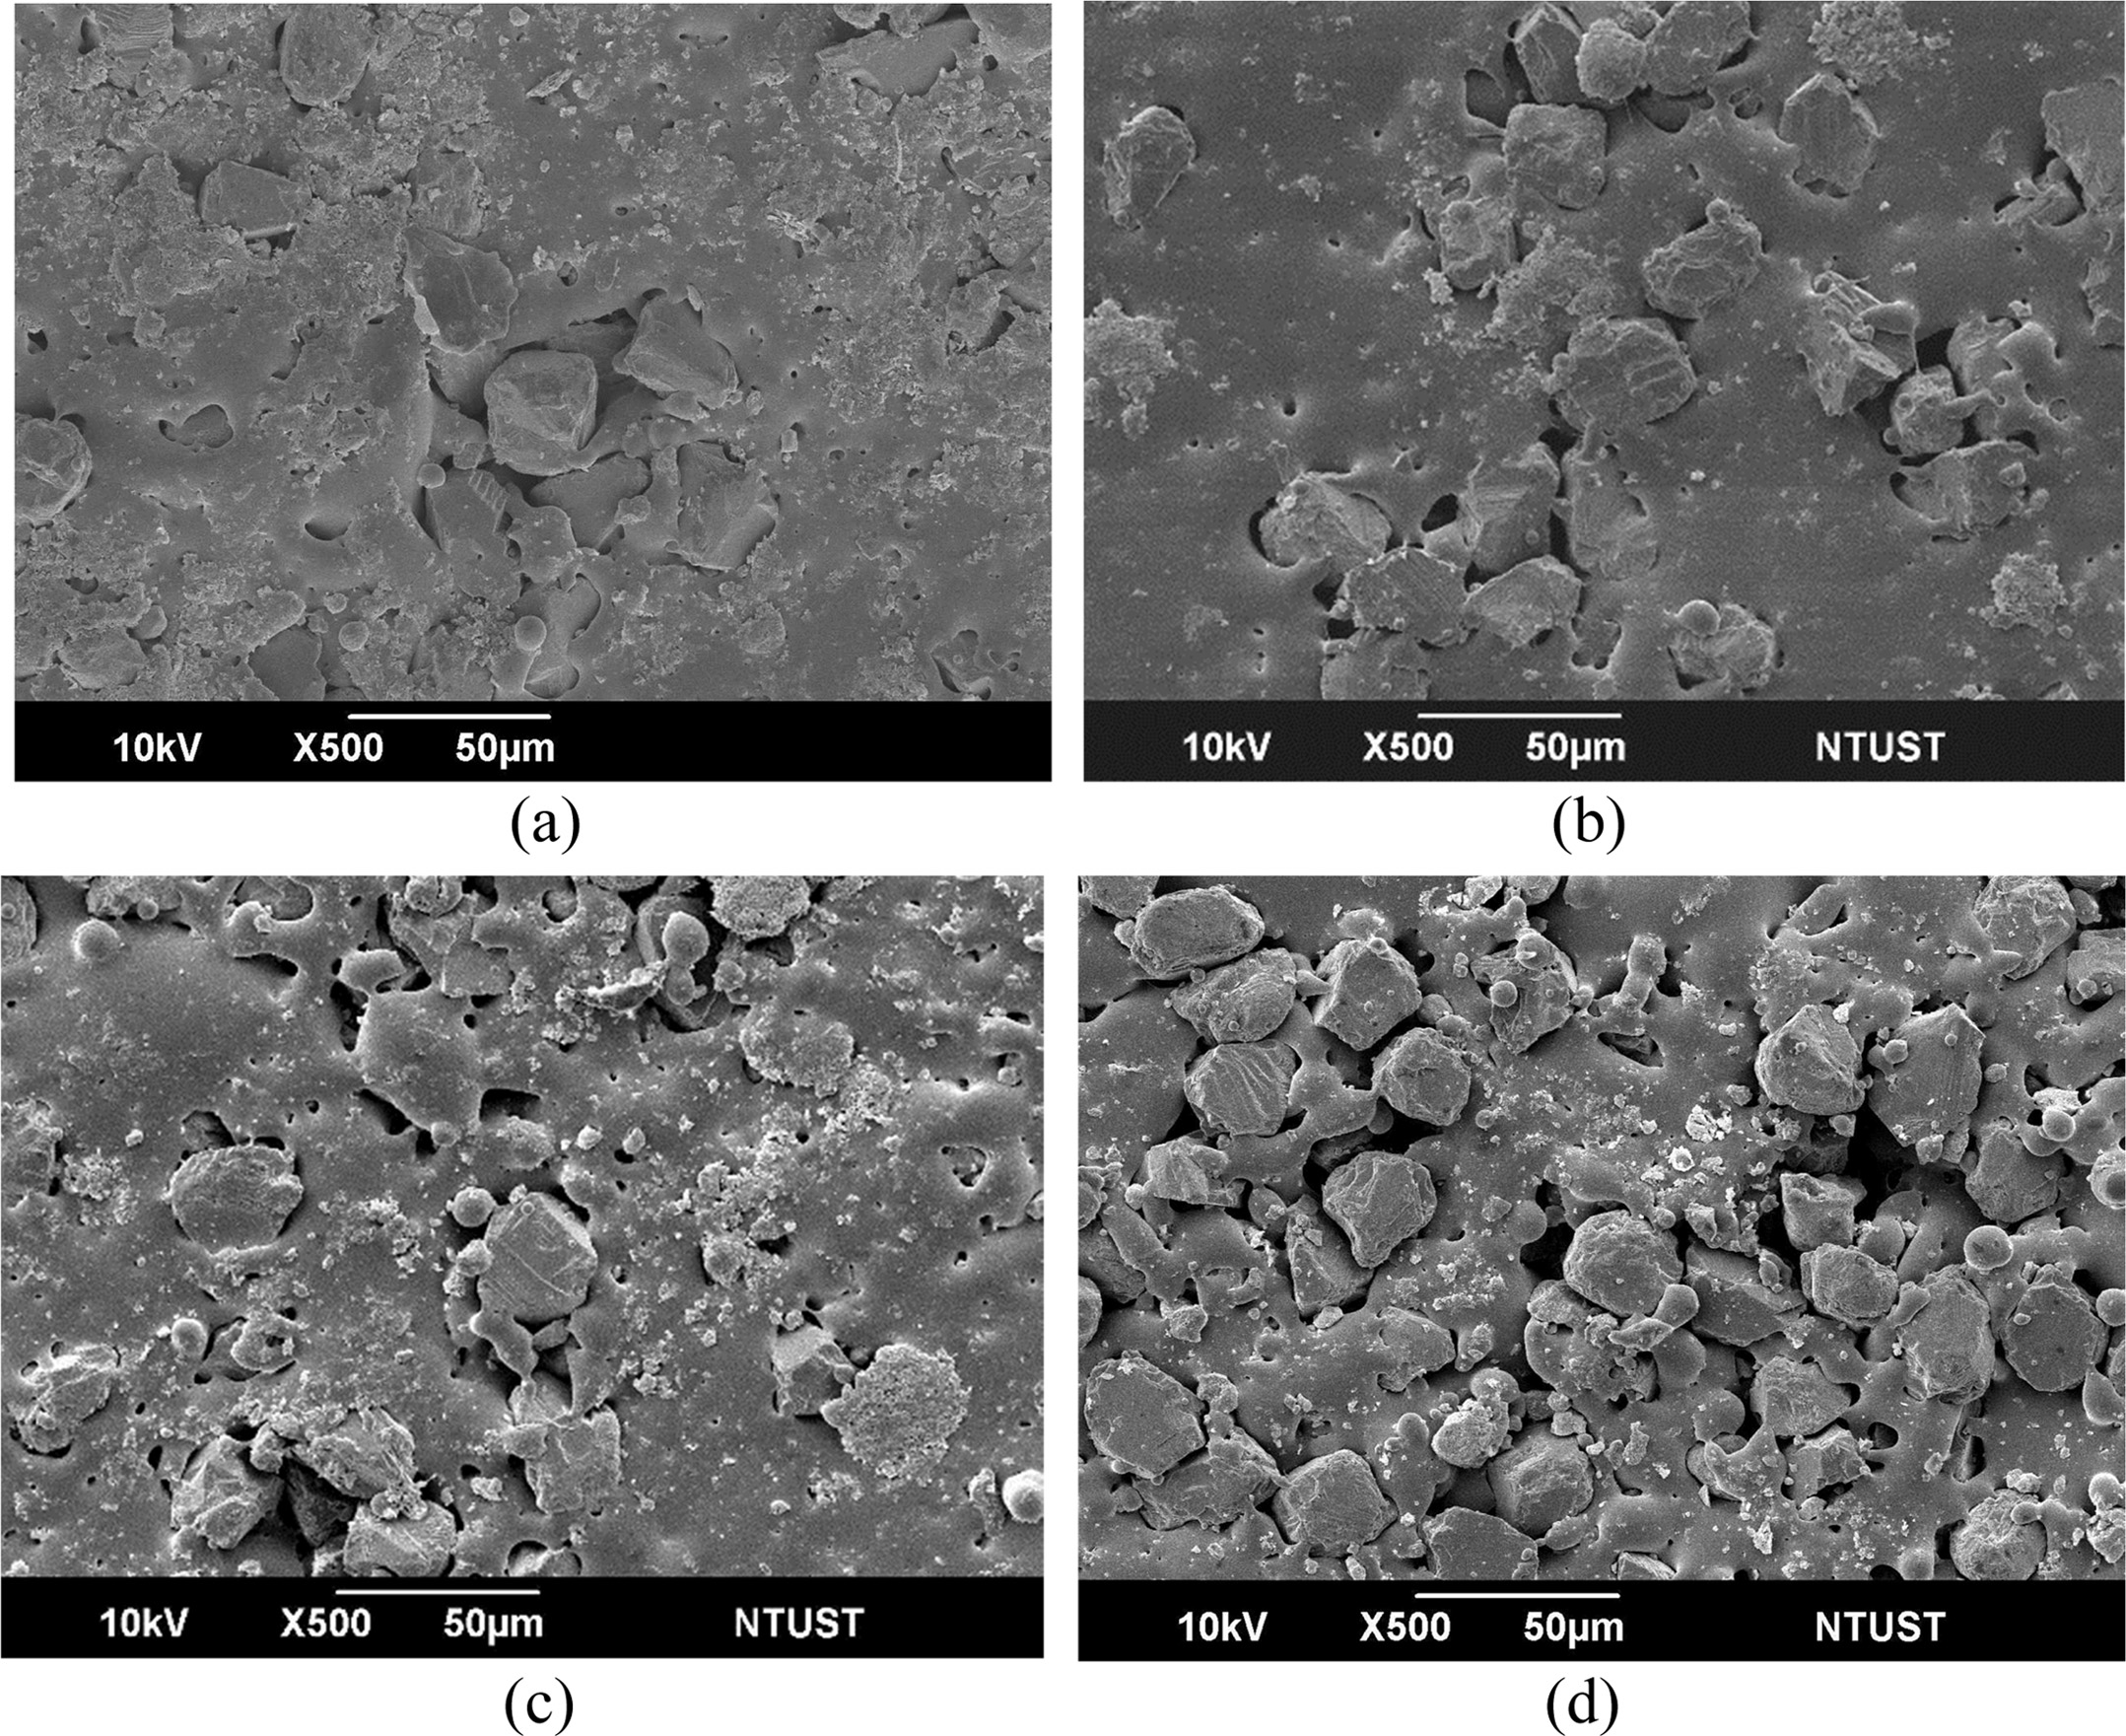
Fig. 5 displays the SEM micrographs of the sintered specimens
0A, 5A, 10A, and 20A, respectively. The diamond grits had a good wetting
and intimately covered by the vitrified bond. The number of pore in the
vitrified matrix had a little bit increased when the amount of AlN added was
increased.
Fig. 6(a) displays the SEM micrograph of the sintered
specimen 30A. Compared with the specimen 20A, specimen 30A exhibited more
pores, and the vitrified matrix gradually formed a loose
structure. Consequently, the wetting between the diamond and
vitrified bond was deteriorated,
and resulted in inadequate bonding force between the diamond grits and the
vitrified matrix. Fig. 6(b) displays the SEM micrograph of the sintered
specimen 40A. The proportion of pore in the vitrified matrix was higher than
that of the specimen 30A. In addition, some of irregularly shaped white
particles with sizes around several µm were observed on the surface of the
vitrified matrix.
Fig. 6(c) displays the SEM image of the sintered specimen
50A. The porosity in the vitrified matrix was even higher than that in the
specimen 40A, the wetting between the diamond grits and the vitrified matrix
were even greater deterioration, and thus the diamond grits were not fixed
strongly. In addition, at the vitrified matrix surface more irregular shaped
white particles were observed. Fig. 6(d) displays the SEM micrograph of the
sintered specimen 60A. The large pores were observed around the diamond grits,
and the bonding between the diamond grit and vitrified matrix was severely
inadequate. Furthermore, much more of irregularly shaped white particles were
observed in the matrix surface.
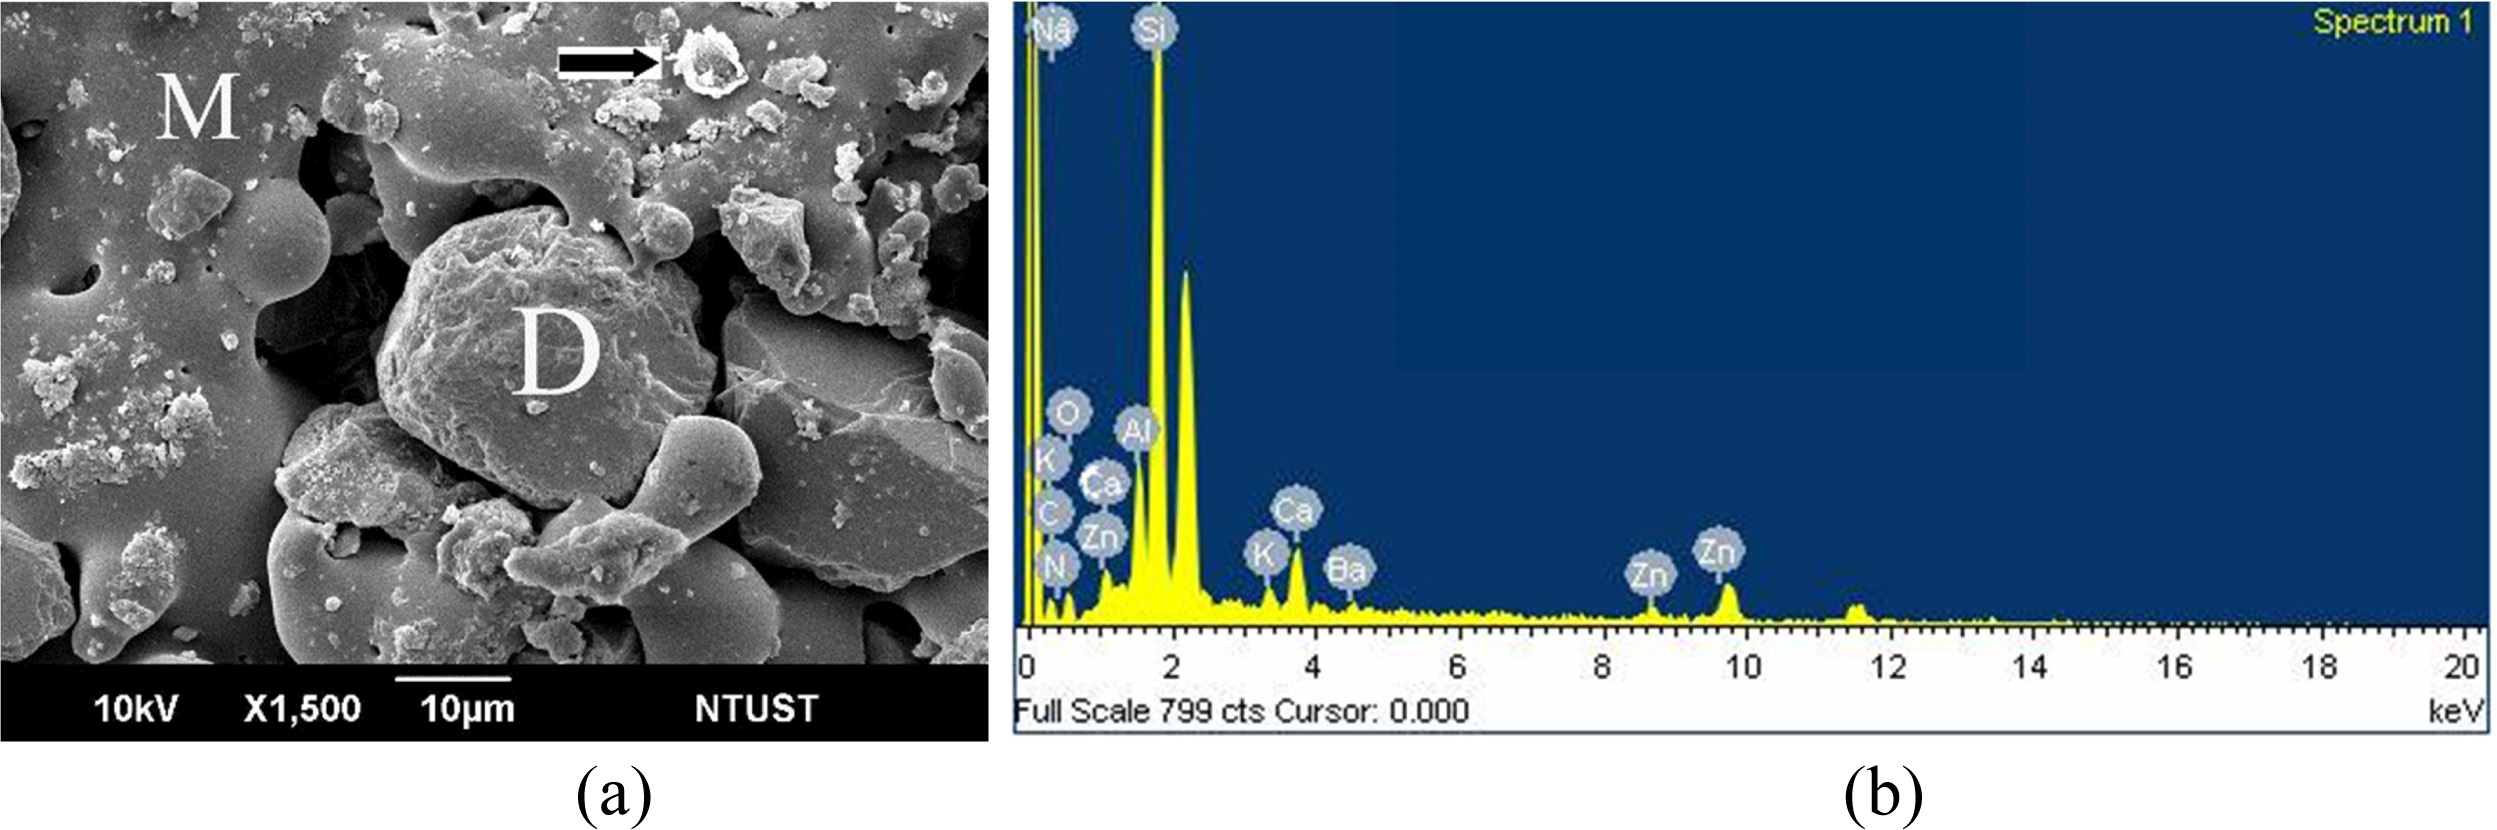
Fig. 7(a) shows a
high-magnification SEM image of sintered specimen 60A. The arrow in Fig. 7(a)
indicates an irregularly shaped particle with a size around several µm.
According to the energy dispersive spectrum (EDS) analysis, the components of
the white particle included the following: Si (22.1 at%), O (10.6 at%), Na
(17.1 at%), B (6.1 at%), Zn (3.6 at%), Al (20.6 at%), N (10.8 at%), etc. The
analysis results indicated that the irregularly shaped particle was a mixture
of the glass and aluminum nitride or alumina.
The SEM images of Fig. 6(b) to 6(d) show that, with an
increase of nano AlN, the numbers of irregularly shaped particles on the matrix
surfaces were increased. Such a variation was due to that
sintering was proceeded in the atmospheric environment, the
nano AlN reacts with oxygen easily, consequently, the nano AlN was decomposed
into alumina and nitrogen dioxide [10, 11], or the nano AlN was transformed
into AlOH and Al2O3 accompanied by NH3
gas [22-24]. Clearly, increased the added amount of nano AlN, the
proportion of gas generated from the specimen was increased also. The gas
resulted in the eruption of the mixture which contains the glass and AlN or Al2O3
from the inside of the matrix, thus greater the porosity around the
diamond.
Shrinkage
percentage and sintered density
The measurement of radial shrinkage percentages of the
sintered specimens were calculated by averaging five tests. The sintered
density of the specimen was analyzed using the Archimedes method, each sintered
specimen being measured three times. Fig. 8 presents the radial shrinkage
percentages and sintered densities of all the sintered specimens.
The radial shrinkage percentage and sintered density of
specimen 0A were 14.20% and 2.43 g/cm3, respectively.
The radial shrinkage percentage of specimen 5A (14.27%) was higher than that of
specimen 0A by 0.5%, and the sintered density was increased by 0.8%. The radial
shrinkage percentage of specimen 10A (15.30%) was higher than that of specimen
0A by 7.7%, and the sintered density was increased by 3.3%. However, it can be
observed that the radial shrinkage percentage and sintered density gradually
decreased when the amount of nano AlN added was higher than 20
vol%. The decrease in the radial shrinkage percentage and sintered
density were especially evident for the specimens 40A to 60A. Such a variation
was believed to arise from the expansion of the vitrified matrix, as shown in
SEM images previously. The vitrified matrix exhibited high porosity due to the
matrix expansion when the amount of nano AlN added was higher than 20 vol%.
According to the above observations, it can be concluded that the optimal
amount of nano AlN to add should be 10 vol%, because the 10A specimen
possessing the best radial shrinkage percentage and sintered density.
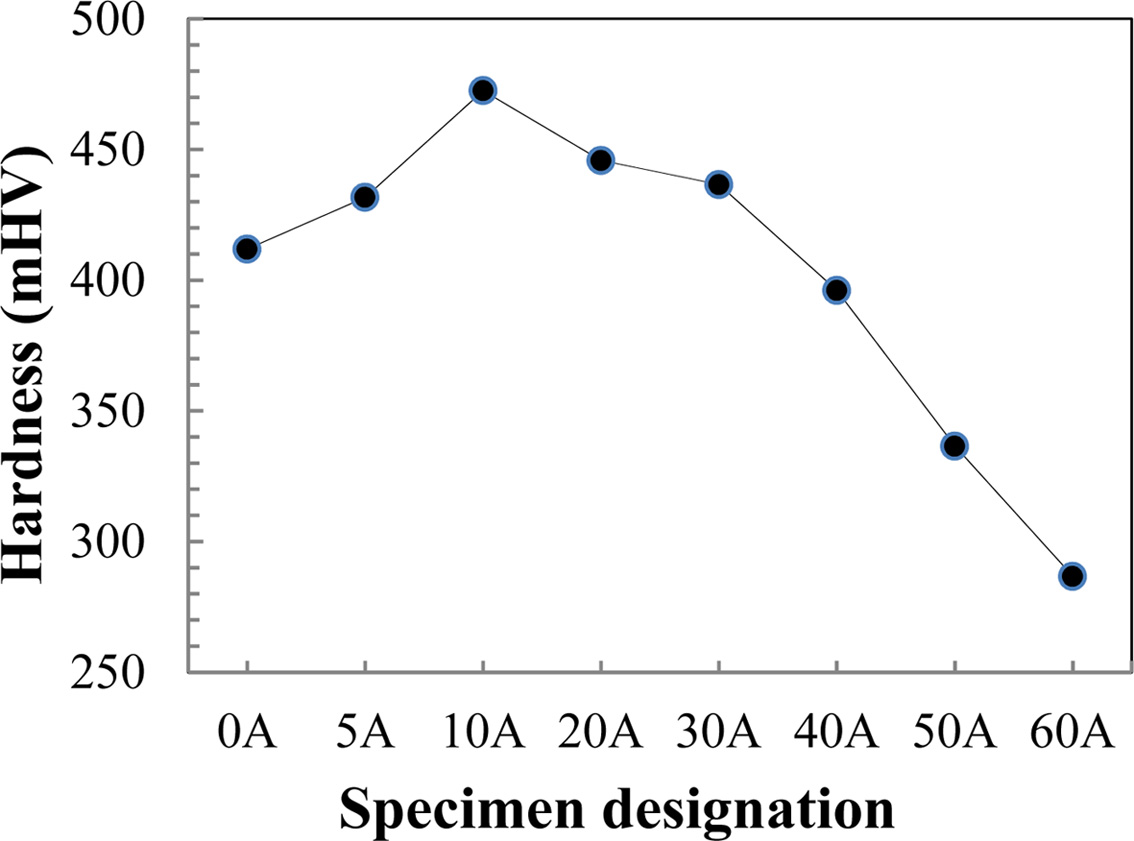
Hardness
test
The hardness value of the vitrified matrix was measured
using a micro Vickers hardness (mHV) tester (Makazawa, HM-221) with a load of
19.6N and a holding time of 20 seconds. Each sintered specimen was measured
five times and then averaged. Fig. 9 presents the average hardness values of
the vitrified matrix of all sintered specimens. The hardness value of specimen
5A (mHV 431.7) was higher than that of specimen 0A (mHV 411.9) by 4.8%. The
hardness value of specimen 10A (mHV 472.5) was higher than that of specimen 0A
by 14.7%. It can be concluded that when the added amounts of nano AlN were
lower than 10 vol%, the hardness increased as the added amount increased.
However, for the amounts of nano AlN was added higher than
10 vol%, the hardness decreased as the added amount
increased. The hardness value of specimen 20A (mHV
445.8) was lower than that of specimen 10A by 5.6%. The hardness value of
specimen 30A (mHV 436.6) was lower than that of specimen 10A by 7.6%. The
specimen 60A had the lowest hardness value (mHV 286.7). This observation
indicates that the addition of a suitable amount of nano AlN contributed to the
hardness of the vitrified matrix. In this study, the optimal amount of added
nano AlN was 10 vol%. The SEM images shown previously also confirm when the
quantity of nano AlN added was over 20 vol%, the matrix expansion will occur,
and thus the hardness will be decreased.
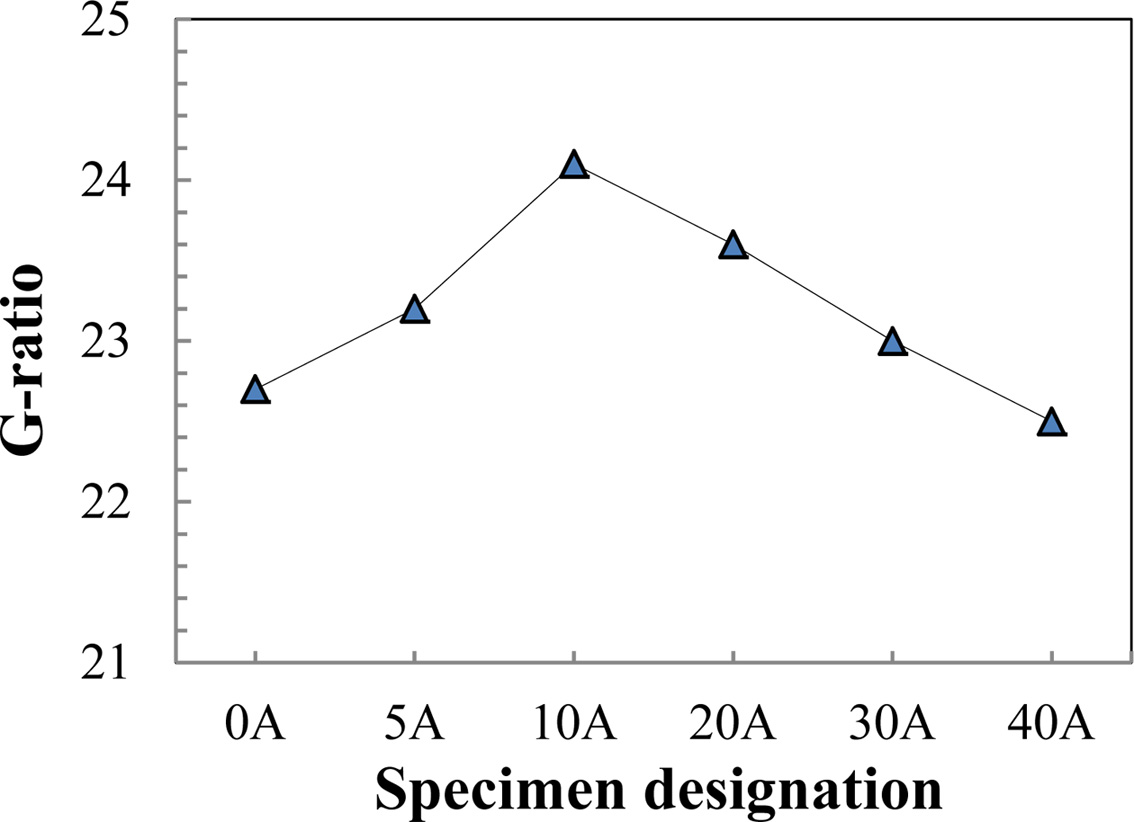
Grinding
ratio tests
G-ratio test of the VBD tool was performed using a high
speed lathe at a rotation speed of 1800 rpm. A disc shape sintered specimen
(VBD tool) with an outer diameter of 30 mm and a thickness of 3 mm was used as
the cutting tool. A tungsten carbide rod with an outer diameter of 4.5 mm
(WC87%-Co13%, density 14.17 g/cm3) was used as the workpiece for the
G-ratio test. The grinding length of the tungsten carbide rod was set as 10 mm.
The cutting depth of the tungsten carbide rod was 0.01mm/pass, the lateral
feeding rate of tungsten carbide rod to the VBD tool was 0.0125 mm/sec, and
water was used as the coolant. The weight loss of the VBD tool and tungsten
carbide rod were recorded after the given grinding test. The definition of
G-ratio is (volume loss of tungsten carbide rod) / (volume loss of VBD tool).
The G-ratios of the sintered specimens 0A, 5A, 10A, 20A,
30A, and 40A were 22.7, 23.2, 24.1, 23.6, 23.0, and 22.5,
respectively (Fig. 10). The G-ratio of specimen 5A (23.2)
was higher than that of specimen 0A (22.7) by 2.2%. The G-ratio of specimen 10A
(24.1) was higher than that of specimen 0A by 6.2%. The G-ratio of
specimen 20A (23.6) was higher than that of specimen 0A by
approximately 4.0%. It was found the G-ratios of VBD tool gradually decreased
when the amount of nano AlN added was over 10 vol%, due to the microstructure
variation and vitrified matrix hardness value decreased.
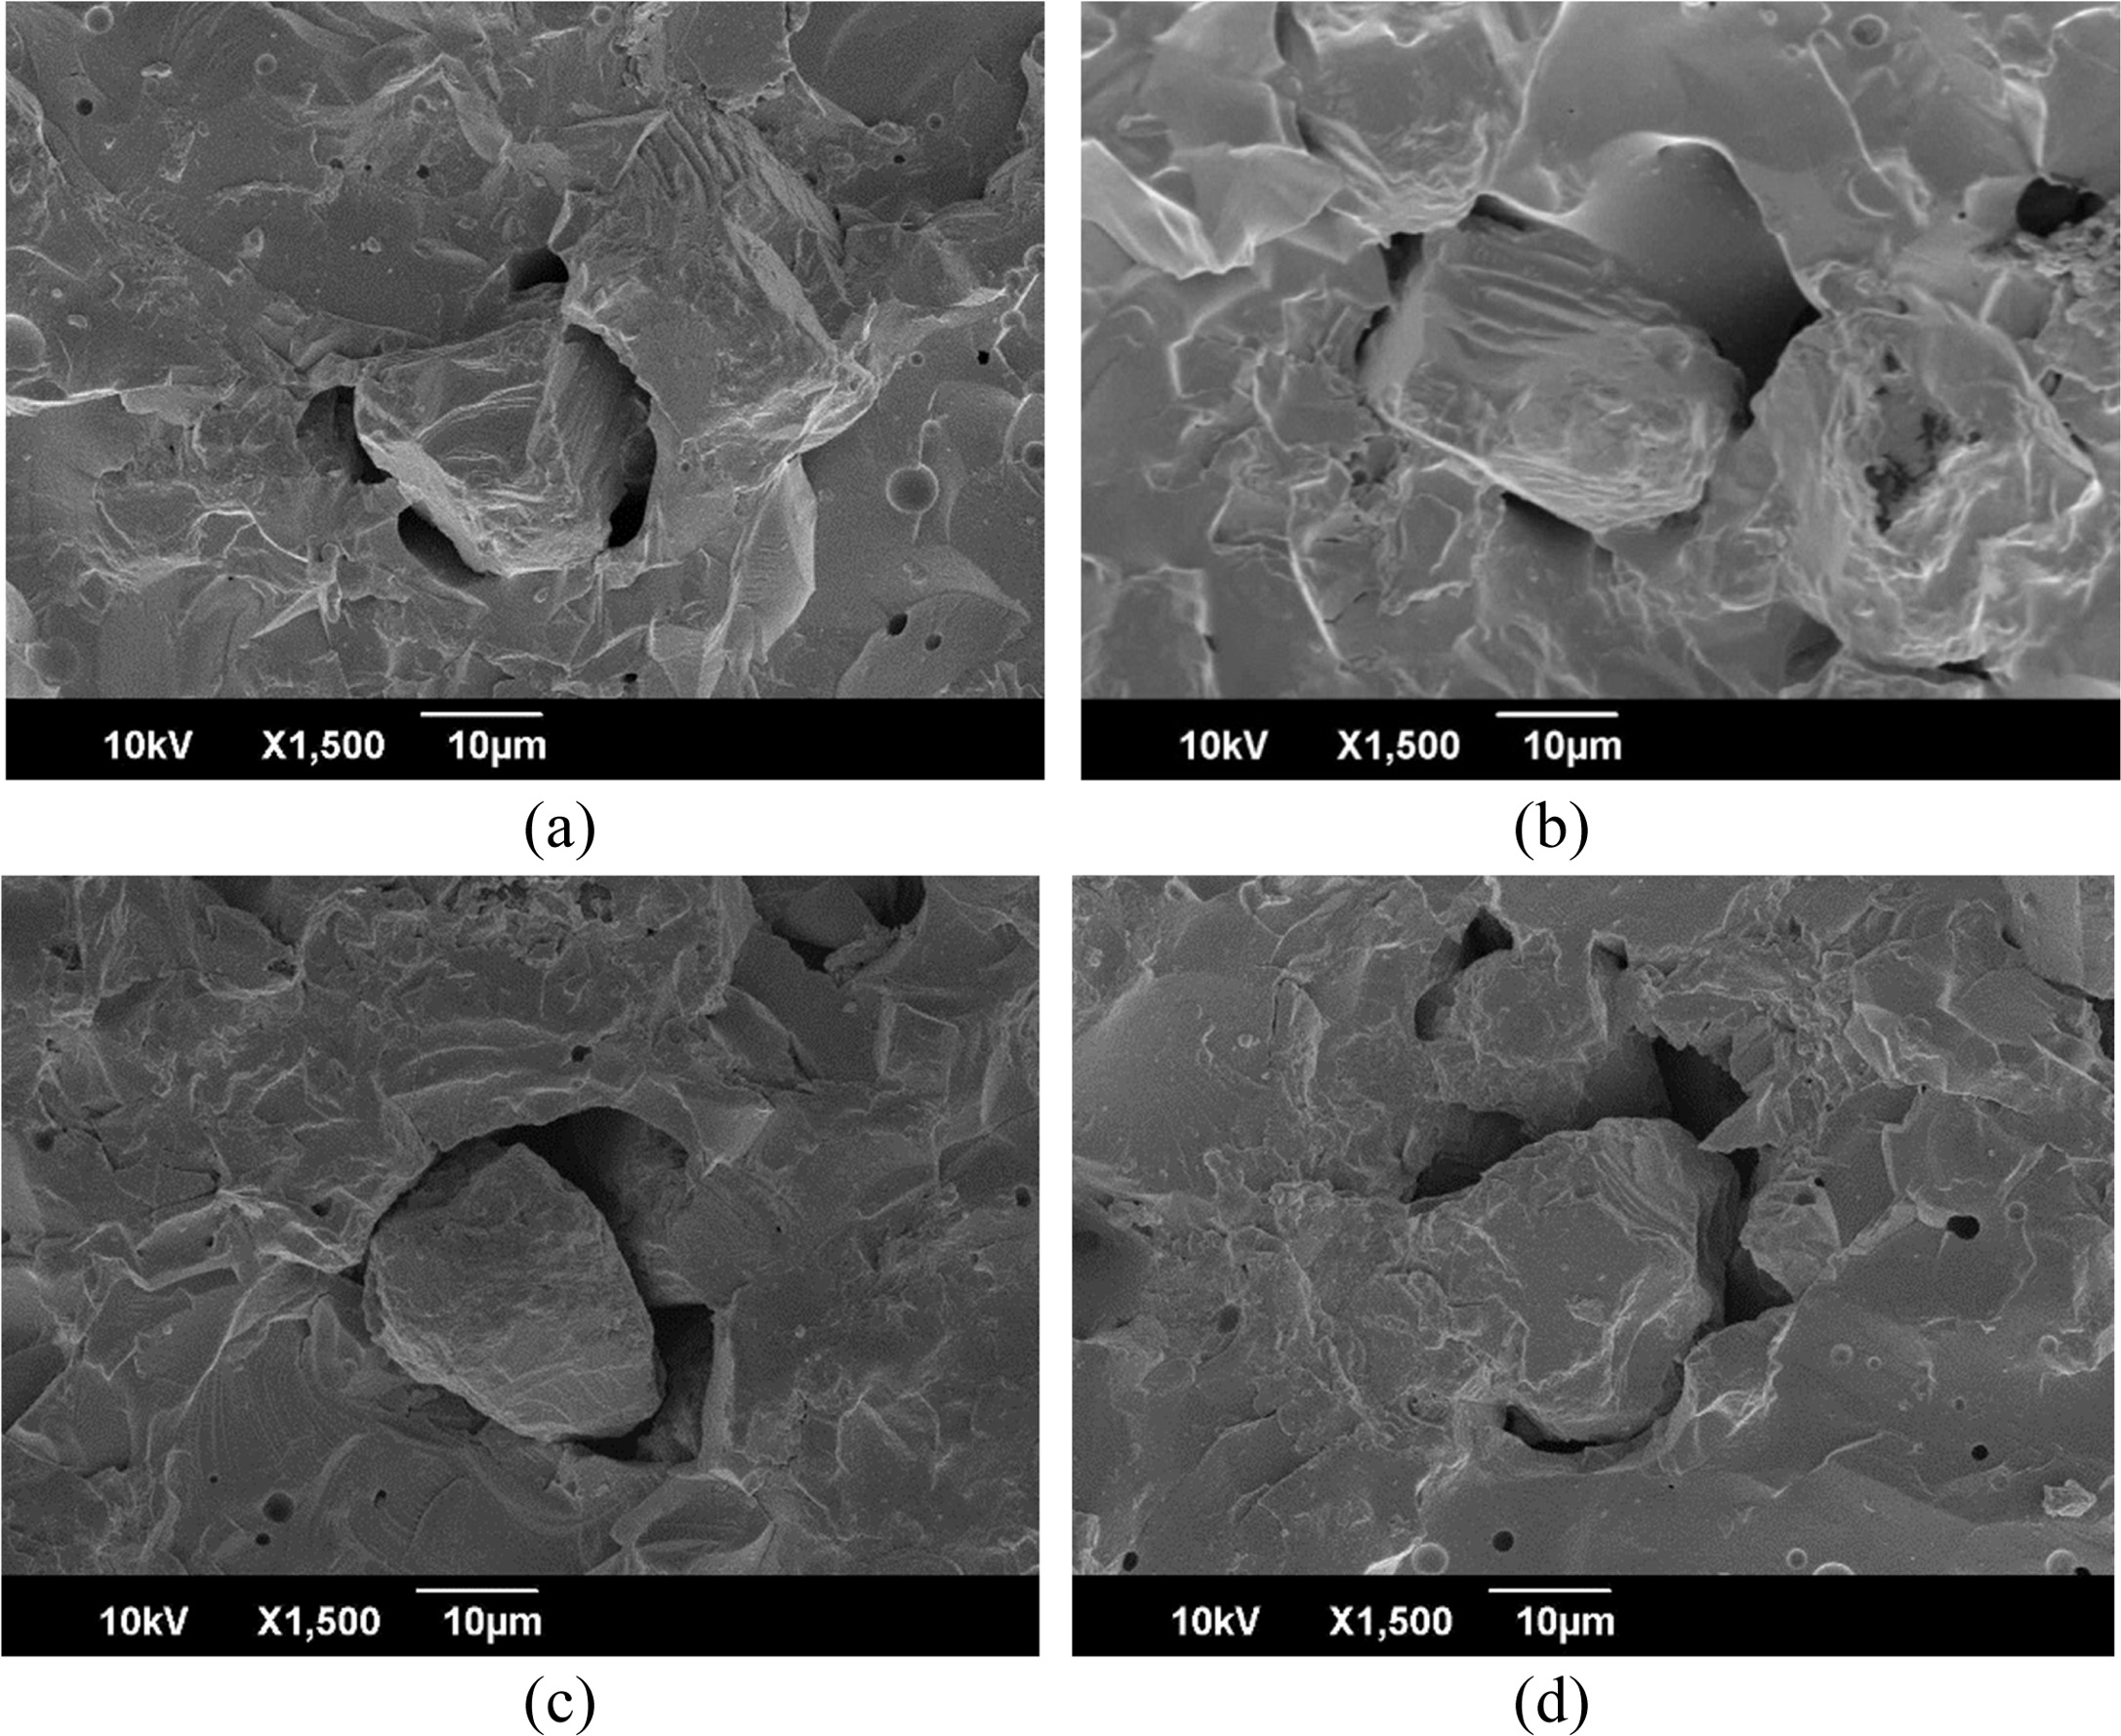
Fig. 11 displays the SEM micrographs of sintered specimens
5A, 10A, 30A, and 40A after the G-ratio tests. Fig. 11(a) shows the wetting
between the vitrified matrix and diamond grit was appropriate, but several
pores with sizes approximately 5 µm to 10 µm were present around the
diamond grit. Compared with the specimen 5A, the specimen 10A had a fewer, and
a smaller size of pores around the diamond grit (Fig. 11(b)). The size of pores
around the diamond gradually increased when the amount of nano AlN
added exceeded than 20 vol%. Fig. 11(c) and 11(d) show the SEM
images of specimens 30A and 40A, respectively. Pores with sizes over 10µm were
observed, and these pores resulted in the diamond grit and vitrified matrix
unable bonding strongly, which in turn caused the diamond grit to be pulled out
from the vitrified matrix before becoming worn. Therefore, the specimens 30A
and 40A had relatively a lower G-ratio. The appropriate porosity around the
diamond grit assists in heat dissipation and preserves the cutting fluid of the
VBD tools. However, too much porosity and large pores decrease the bonding
strength between the diamond and vitrified matrix, consequently result in VBD
tools with a lower G-ratio, and inferior the workpiece surface
roughness.
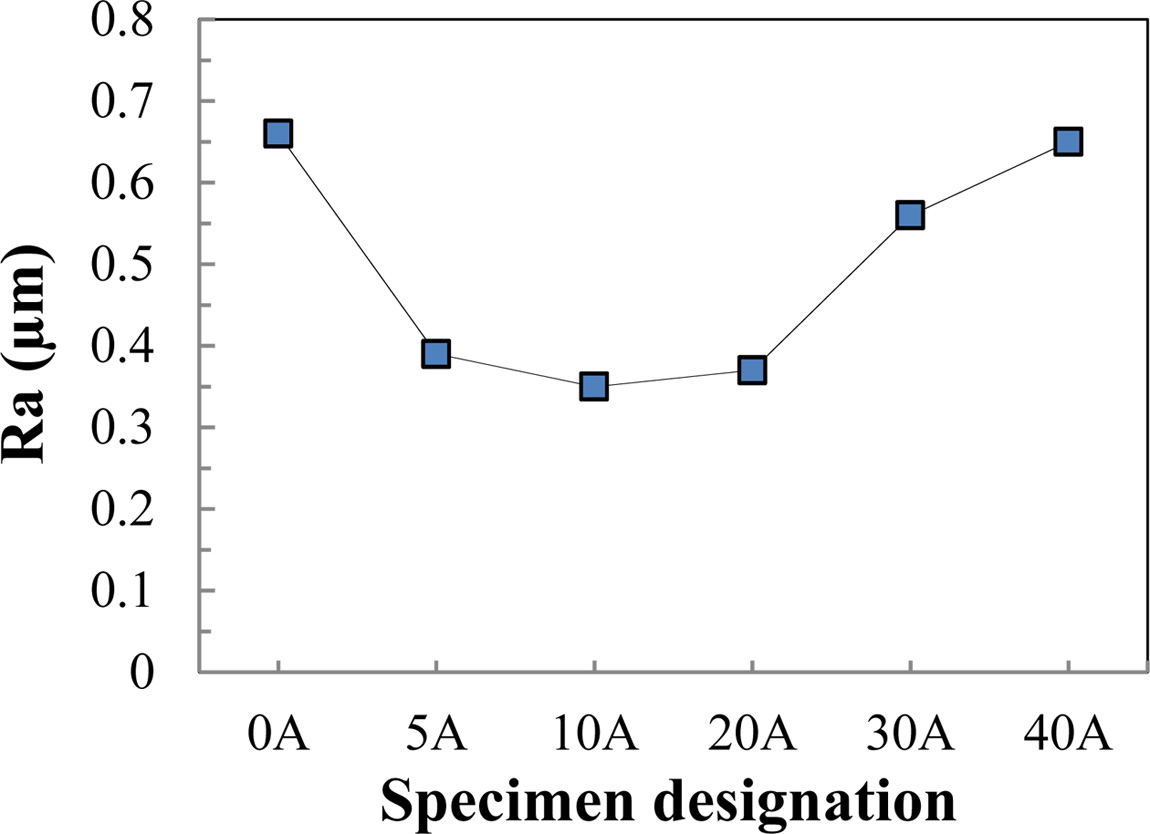
A three dimension surface roughness analysis apparatus
(Kosaka Laboratory, SEF-3500) was used to detect the surface roughness of the
workpiece after the G-ratio test. The center line average roughness (Ra) method
was employed and a three dimension scanning image of the workpieces was taken.
Fig. 12 shows the surface roughness values of six workpieces after the G-ratio
tests were 0.66 µm, 0.39 µm, 0.35 µm, 0.37 µm, 0.56 µm, and 0.65 µm,
respectively. In this work, specimen 10A had the highest G-ratio (24.1) and
workpiece possess with the best surface roughness (Ra, 0.35 µm). The specimens
40A had the lowest G-ratio (22.5) and workpiece possess with the worst surface
roughness (Ra, 0.65 µm).
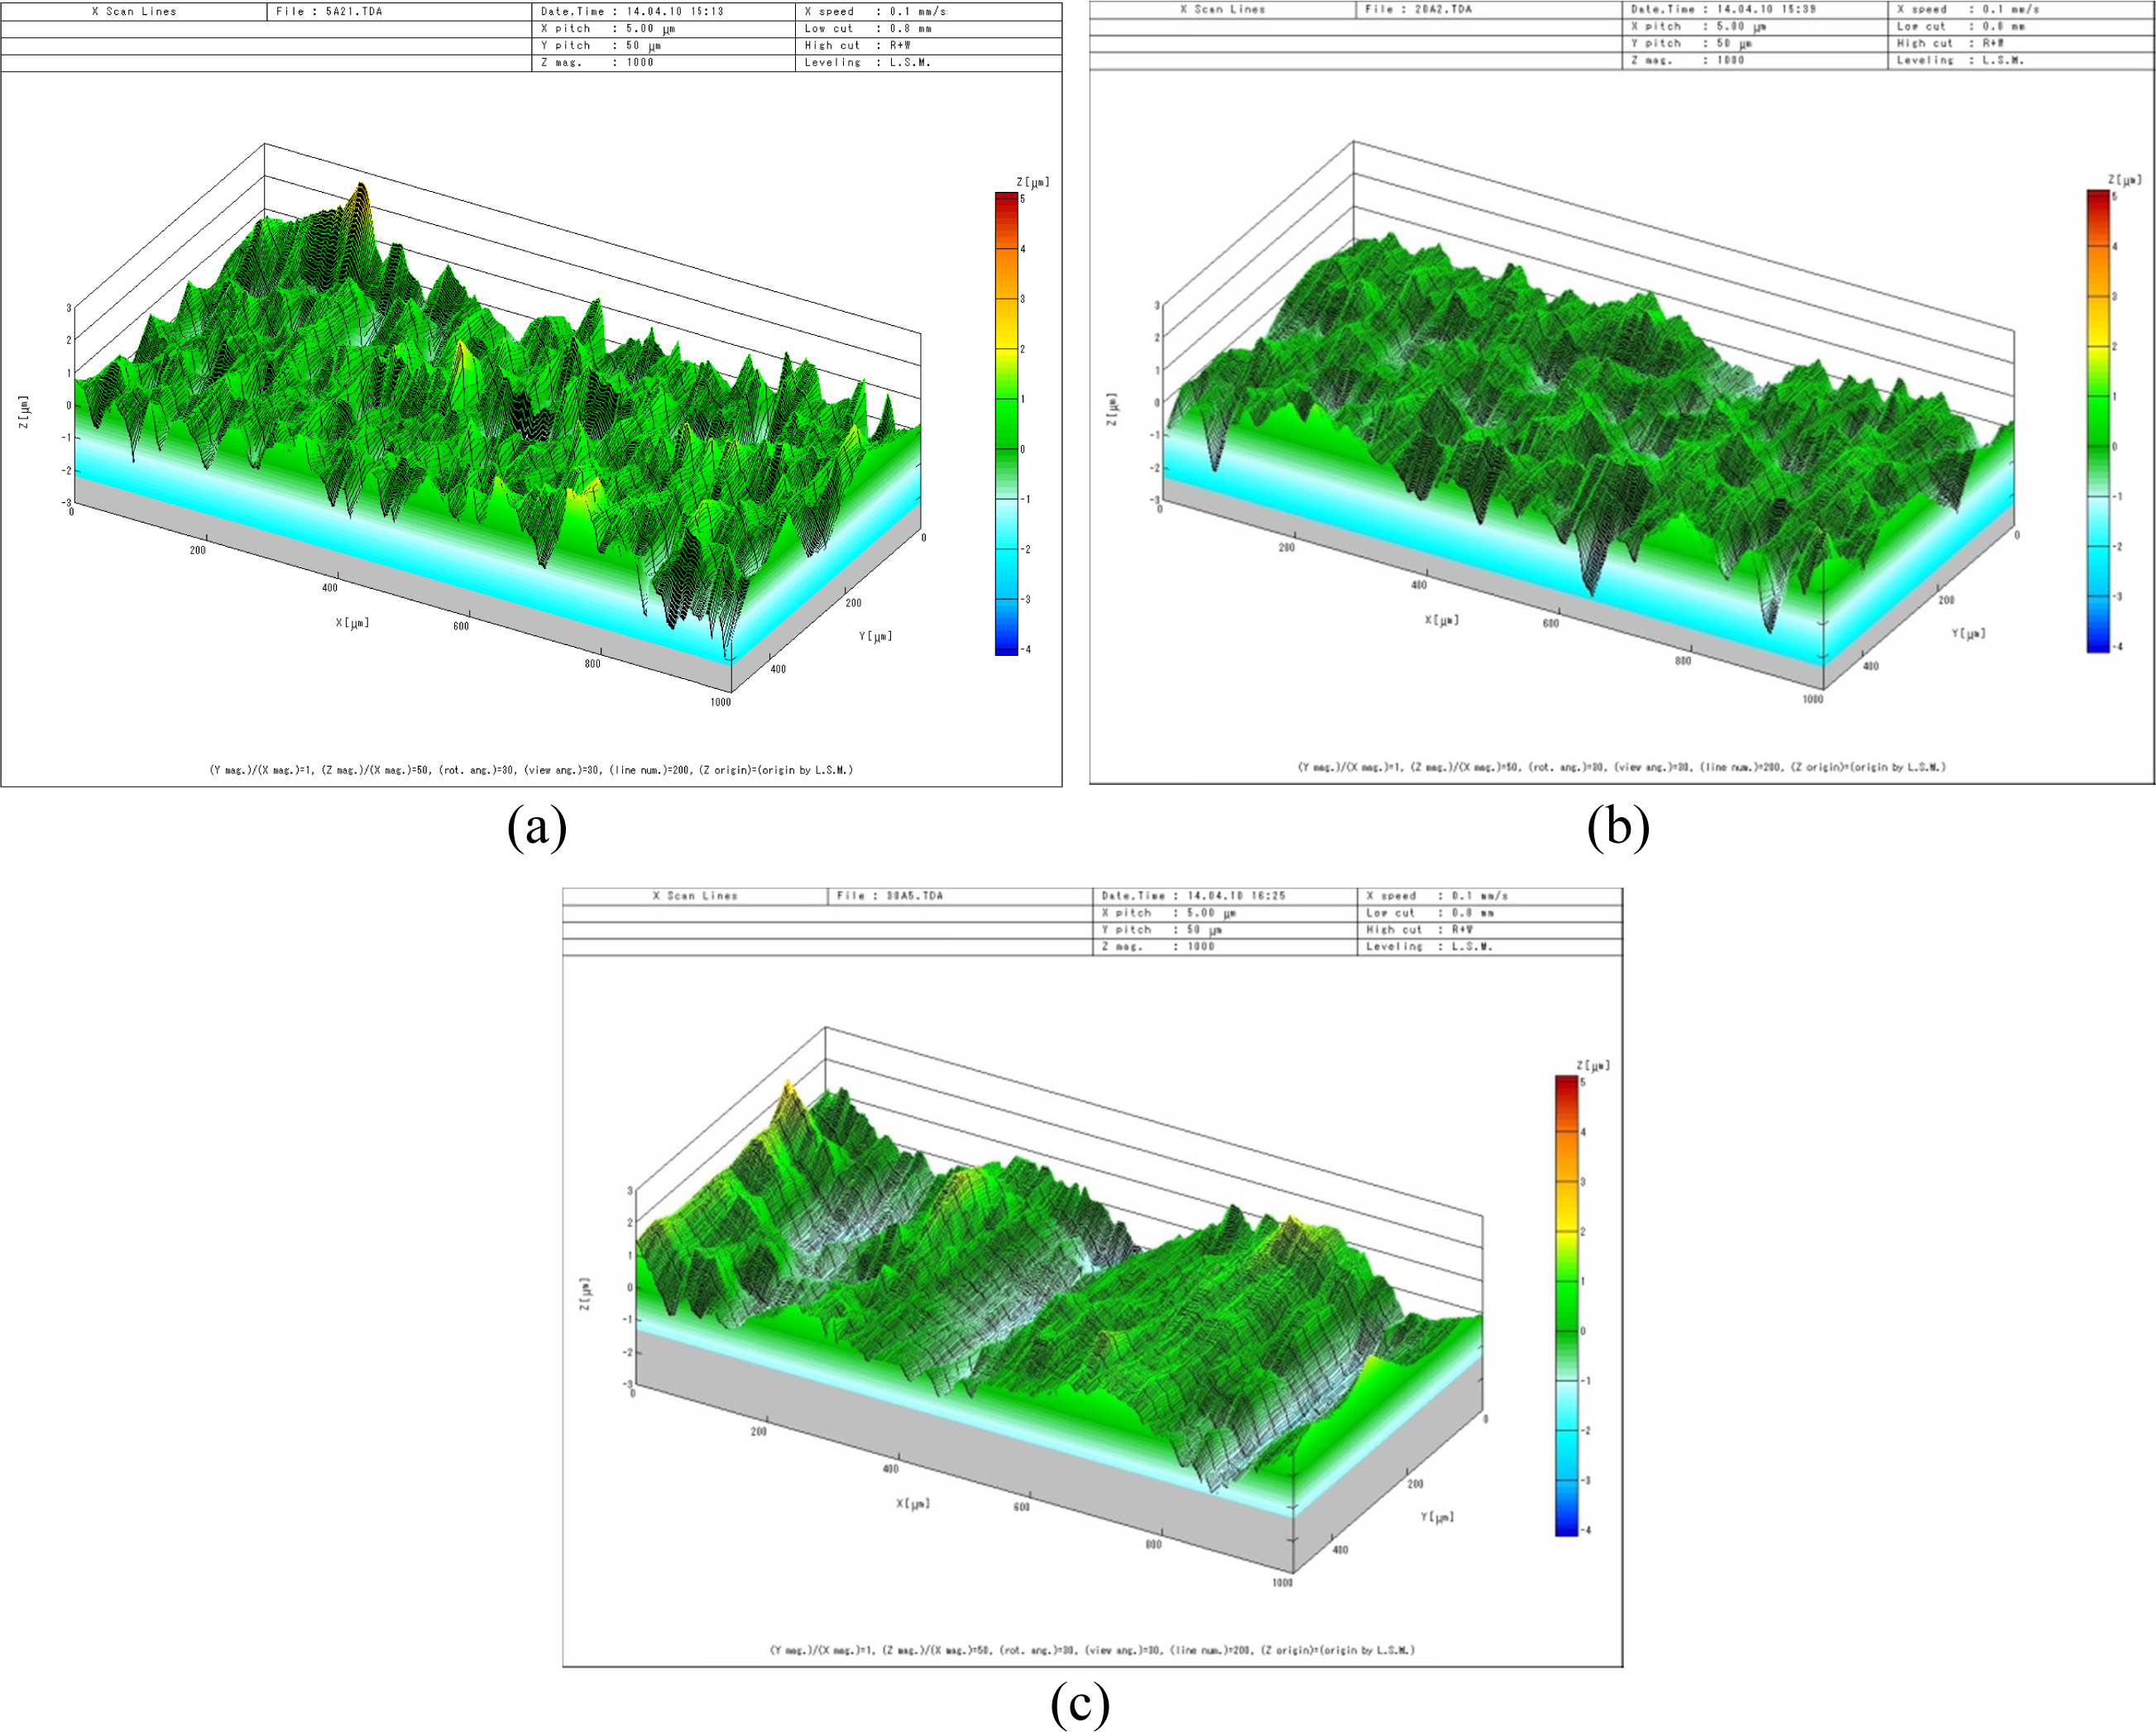
Fig. 13 displays the three dimension surface morphologies
of the workpieces that ground by VBD tools 5A, 10A, and 20A, respectively. The
workpiece ground by VBD tools 10A had the best surface
morphology (Fig. 13(b)), and the workpieces ground by VBD
tools 5A and 20A had slightly poorer surface morphologies (Fig. 13(a) and
Fig. 13(c)). As described previously, when the amount of nano AlN
added exceeded than 20 vol%, there were a higher proportion of pores exist in
the vitrified matrix, thus the bonding force of the diamond grits were
degraded. A poor bonding between the diamond grits and vitrified matrix also
increased the workpiece surface roughness. However, the over tight bonding
between the diamond and vitrified matrix also prevents the diamond grit from
being pulled out of the matrix even when it becomes worn, and thus results in
the workpiece’s surface roughness increased. Not only a proper G-ratio but also
a good workpiece surface roughness is required for the outstanding VBD tool.
Therefore, the bonding force between the diamond and matrix should be adjusted
as necessary, so that the diamond grit can be pulled out from the vitrified
bond when it becomes blunt. Moreover, an appropriate porosity and
brittleness of the matrix allows a VDB tool to maintain its
sharpness and also achieves a better workpiece surface roughness.
|
Fig. 2 Thermal analysis: (a) TGA curve of the diamond powder, and (b) DSC curve of the glass powder. |
|
Fig. 3 Raman spectra of all sintered specimens. |
|
Fig. 4 XRD patterns of five sintered specimens. |

|
Fig. 5 SEM images of specimens: (a) 0A, (b) 5A, (c) 10A, and (d) 20A. |
|
Fig. 6 SEM images of specimens: (a) 30A, (b) 40A, (c) 50A, and (d) 60A. |
|
Fig. 7 Sintered specimen 60A: (a) SEM image (M: matrix, D: diamond), (b) EDS spectrum. |

|
Fig. 8 Radial shrinkage percentages and sintered densities of all sintered specimens. |
|
Fig. 9 Hardness values of the vitrified matrix of all sintered specimens. |
|
Fig. 10 Grinding ratio values of six sintered specimens. |
|
Fig. 11 SEM micrographs after G-ratio tests for specimens (a) 5A, (b) 10A, (c) 30A, and (d) 40A. |
|
Fig. 12 The surface roughness values of workpieces after G-ratio tests. |
|
Fig. 13 Three dimension surface morphologies of the workpieces ground by specimens (a) 5A, (b) 10A, and (c) 20A. |
The Raman spectra analysis indicated added of 10 vol% to
20 vol% nano AlN into the VBD tool assisted to protect the diamond crystal
structure during the sintering process. The XRD analysis results revealed the
obvious diffraction patterns of the diamond crystal in all of the sintered
specimens. However, only the 40A and 60A sintered specimens exhibited the weak
diffraction patterns of AlN, Al2O3, and SiO2
phases, possibly due to the lower sintering temperature of 690 oC
used in this study. The SEM image indicated the VBD tool added of 10 vol% AlN
had an optimal microstructure; it also had an appropriate grinding ratio and a
good workpiece surface roughness. As the added amount of
nano AlN exceeded than 20 vol%, it resulted in expansion
of the vitrified matrix due to the gas formation. The bonding strength between
the diamond grit and matrix was descended; so that G-ratio of the VBD tool was
decreased. The specimen 10A had the optimal workpiece surface roughness,
followed by specimen 20A. In this study, the VBD tool added with 10 vol% (0.8
wt%) nano AlN had the best G-ratio and workpiece surface roughness.
We thank the Ministry of Science and Technology for
providing financial support for this study (study plan MOST
103-2221-E-236-002).
- 1. K.H. Lin, S.F. Peng, and S.T. Lin, Int. J. Refract. Met. Hard Mater. 25[1] (2007) 25-31.
-

- 2. T.K. Chuang, Y.T. Tsai, and K.H. Lin, Int. J. Refract. Met. Hard Mater. 74 (2018) 107-113.
-
- 3. Y.X. Sun, Y.T. Tsai, and K.H. Lin, Mater. Des. 80 (2015) 89-98.
-
- 4. S. Ogawa and T. Okamoto, Bull. Jpn. Soc. Prec. Eng. 20[4] (1986) 264-271.
-
- 5. T. Tanaka, N. Ikawa, N. Ueno, and S. Okada, Bull. Jpn. Soc. Prec. Eng. 19[3] (1985) 221-222.
-
- 6. Y. Kuroshima, Y. Kondo, and S. Okada, J. Ceram. Soc. Jpn. 93[9] (1985) 587-589.
-
- 7. X.F. Liu and Y.Z. Li, Int. J. Refract. Met. Hard Mater. 21[3-4] (2003) 119-123.
-
- 8. H.W. Choi, S.J. Kim, H. Yang, Y.S. Yang, Y.H. Rim, and C.R. Cho, J. Ceram. Process. Res. 20[1] (2019) 63-68.
- 9. X.H. Zhang, Y.H. Wang, J.B. Zang, and X.Z. Cheng, Int. J. Refract. Met. Hard Mater. 29[4] (2011) 495-498.
-
- 10. Y. Shang, Y.G. Hou, G.Y. Qiao, W.J. Zou, F.R. Xiao, and B. Liao, Nonferr. Metal. Soc. China. 19 (2009) s706-s710.
-
- 11. Y.G. Hou, G.Y. Qiao, Y. Shang, W.J. Zou, F.R. Xiao, and B. Liao, Composites: Part B Eng. 42[4] (2011) 756-762.
-
- 12. N. Zhang, T.T. Fu, F.Y. Yang, H.M. Kan, X.Y. Wang, H.B. Long, and L.Y. Wang, J. Ceram. Process. Res. 15[2] (2014) 93-96.
- 13. X.H. Zhang, Y.H. Wang, J.B. Zang, X.Z. Cheng, X.P. Xu, and J. Lu, J. Eur. Ceram. Soc. 31[10] (2011) 1897-1903.
-
- 14. N. Yan, D.P. Zhao, L. Wang, Q. Zou, Y.Y. Xi, X.P. Guo, B. Wang, Z.L. Wang, L.P. Wang, W.J. Dai, M.Z. Wang, and Y.C. Zhao, Int. J. Refract. Met. Hard Mater. 43 (2014) 212-215.
-
- 15. X.H. Zhang, Y.H. Wang, J. Lu, J.B. Zang, J.H. Zhang, and E.B. Ge, Int. J. Refract. Met. Hard Mater. 28[2] (2010) 260-264.
-
- 16. J. Wagner, M. Ramsteiner, Ch. Wild, and P. Koidl, Phys. Rev. B. 40 (1989) 1817-1823.
-
- 17. J.J. Wang, H. Yan, Y.J. Deng, H.D. Li, Y.F. Zhang, F. Zhang, Z. Xia, Q. Gao, W. Du, H. Zhou, and Y. Zou, Solid State Commun. 115[4] (2000) 173-177.
-
- 18. A.C. Ferrari, Diam. Relat. Mater. 11[3-6] (2002) 1053-1061.
-
- 19. S. Prawer, K.W. Nugent, D.N. Jamieson, J.O. Orwa, L.A. Bursill, and J.L. Peng, Chem. Phys. Lett. 332[1-2] (2000) 93-97.
-
- 20. K.S. Kim, S.H. Shim, S. Kim, and S. O. Yoon, J. Ceram. Process. Res. 11[1] (2010) 35-39.
- 21. C.L. Liao, K.H. Lin, and S.T. Lin, J. Ceram. Process. Res. 9[6] (2008) 562-568.
- 22. R. Metselaar, R. Reenis, M. Chen, H. Gorter, and H.T. Hintzen, J. Eur. Ceram. Soc. 15[11] (1995) 1079-1085.
-
- 23. Y.H. Zhang, Mater. Res. Bull. 37[15] (2002) 2393-2400.
-
- 24. D. Hotza, O. Sahling, and P. Greil, J. Mater. Sci. 30[1] (1995) 127-132.
-
 This Article
-
2020; 21(1): 103-112
Published on Feb 28, 2020
- 10.36410/jcpr.2020.21.1.103
- Received on Nov 4, 2019
- Revised on Jan 13, 2020
- Accepted on Jan 17, 2020
Services
- Abstract
introduction
experimental procedure
results and discussion
conclusions
- Acknowledgements
- References
- Full Text PDF
Shared
Correspondence to
- Kuan-Hong Lin
-
Department of Mechanical Engineering, Tungnan University, New Taipei City 222, Taiwan, ROC
Tel : +886-2-8662-5917 Fax: +886-2-8662-5919 - E-mail: khlin@mail.tnu.edu.tw
Clean-Energy Research Institute(CRI), Hanyang University, 222, Wangsimni-ro, Seongdong-gu, Seoul, 04763, Korea
E-mail: jcpr@hanyang.ac.kr