


- Effect of CeO2 addition on crystallization and thermo-physical properties of Li2O-ZnO-SiO2 glass-ceramics
Ruixue Li, Qian Zhang, Xingliang Peng and Weizhen Liu*
Faculty of Resources and Environmental Engineering, Jiangxi University of Science and Technology, Ganzhou 341000,China
The effect of CeO2
addition on crystallization and thermo-physical properties of lithium zinc
silicate (LZS) glasses containing Li2O-ZnO-SiO2-Al2O3-Na2O-P2O5
was investigated. The changes of CeO2 contents (2-8 wt.%) had an
obvious influence on the transition temperatures (Tg) and
crystallization temperatures (Tc) of LZS glass-ceramics, and
they increased with CeO2 content increasing. According to XRD
analysis, CeO2 promoted the formation of cristobalite and β-spodumene crystals, and β-spodumene
increased obviously. As the CeO2 content increasing, the
microstructure and microhardness (being 6.88 Gpa at 880 oC) of
glass-ceramics had great changes. The average thermal expansion coefficient (20
- 450 oC) showed first increasing then decreasing, having a wide
range. The maximum of thermal expansion coefficient was obtained when the
glass-ceramics contained 4 wt.% CeO2, being 175×10-7 K-1 (at 700 oC) and
178×10-7 K-1 (at 880 oC)
respectively. Excellent thermo-physical properties indicate the glass has
greater potential application, such as being used as sealing glass.
Keywords: Lithum zinc silicate, Crystallization, Thermal expansion coefficient, Microhardness
Currently there has been a considerable amount of interest
on crystallization behavior and thermo-physical property of Li2O-ZnO-SiO2
glass-ceramics [1-7] due to their beneficial performances, e.g., a wide range
of thermal expansion coefficient (α = 50 - 200 × 10-7 K-1)
by controlling heat treatments and adding different elements, high electrical
resistivity and good chemical durability. McMillan and Partridge in 1963 [8]
first reported lithium zinc silicate glass-ceramics containing high proportions
of zinc oxide. Later, they found glass-ceramics could also be employed to
produce superior glass-ceramic-to-metal seals [9]. Donald et al. [10] studied
a number of Li2O-ZnO-SiO2 materials containing
relatively high concentrations of ZnO, including the influence of nucleating
species and concentration, and an assessment of the thermal expansion
characteristics and mechanical properties. And they summarized
recent developments of glass-ceramic-to-metal seals and coatings
to gain a better understanding of diffusion and reaction behavior of individual
metallic [11]. The glass-ceramics are suitable for matching sealing to lots of
metals and alloys with different thermal expansion coefficients such as copper
alloys, nickel-based alloys, Fe-Ni-C alloys and stainless steel etc. It is
generally agreed that the properties of glass-ceramics are dependent
on the crystal contents, phases and their microstructure. Chemical compositions
of basic glasses play very important roles in the formation of crystals. The crystallization
characteristic of glass-ceramics is usually influenced
markedly by adding some specific elements, such as rare earth elements.
Recently, Y2O3, Nd2O3, Fe2O3,
B2O3, CuO, alkali oxides and alkali earth oxides also
have been used as flux in some glass-ceramics to study the changes of their
crystallization and thermo-physical properties [12-19].
Cerium oxide, as a rare earth oxide flux, has been reported
in many glass-ceramics studies. In some studies, it is used
as raw material in glasses [20-24]. Mostly CeO2 is used as additive
to regulate the properties of glass-ceramics [25-27]. Sohn et al. [28]
found that CeO2 as a flux markedly decreased viscosity in MgO-Al2O3-SiO2
glasses, and had a little influence on thermal expansion, mechanical properties
and chemical durability of glasses. Anmin Hu et al. [29] investigated
phase transformations of Li2O-Al2O3-SiO2
glasses with CeO2 addition, and showed that the transformations of
glass to β-quartz and of β-quartz to β-spodumene were
accelerated by addition of CeO2. Temuujin et al. [30] studied
the influence of CeO2 addition in crystallization behavior and
mechanical properties of glass ceramics in the Na2O-CaO-Al2O3-SiO2
system, and found that CeO2 added to glass ceramics enhanced
hardness because of an increased crystal size. Yongsheng et al. [31]
also found CeO2 could improve the integrity of the glass network
structure and enhance fracture toughness in CaO-Al2O3-SiO2
system. In the previous research, we know CeO2 in different glass
systems has various influences on thermo-physical and mechanical
properties. Therefore, in order to enhance the properties of lithium
zinc silicate (LZS) glass, it is essential to investigate the effect of CeO2
on LZS glass.
The purpose of this research
was to investigate the effect of different content of CeO2 addition on
crystallization and thermo-physical properties
of Li2O-ZnO-SiO2 glasses. After leaning its effect on the
properties, we could adjust them by adding different content of CeO2 to
make the glass-ceramic better seal to various metals.
Composition
and preparation of the glass
The chemical compositions (wt.%) of the glasses were given in Table 1.
We used the ingredients SiO2, ZnO, Li2O and Na2O.
P2O5 was used as nucleating agent. The starting materials
were SiO2 (≥99.0%), ZnO (≥99.0%), Li2CO3 (≥97.0%),
Na2CO3 (≥99.8%), NH4H2PO4
(≥99.0%) and CeO2 (≥99.0%). The weighted errors of all raw materials were controlled in
the range of ±0.01 g.
Glasses were prepared by fusing regent-grade chemicals
in a platinum crucible. The glass samples were melted and
maintained at 1,400 oC in an electric furnace for 3 h. The
molten glasses were then poured into a preheated
(480 oC) graphite mould and immediately transferred to an
annealing furnace set at 480 oC, being held for 2 h for
annealing before cooling down to room temperature. The
transparent and bubble-free glasses were obtained. Based on the DSC curves, we
made the nucleation temperature and crystallization temperature to obtain
glass-ceramics.
Analytical
methods
Differential scanning calorimeter (DSC, Netzsch 404PC,
Germany) was used to determine the glass transition temperature (Tg)
and crystallization temperature (Tc) of the glass samples.
The DSC measurements were performed using ~15 mg of powdered samples (45-53 μm),
which were placed in an alumina crucible. The temperature range of the samples
was between 20 and 1,000 oC at heating rate of 10 K/min.
The measurement error was ±2 oC.
X-ray diffraction (XRD, D/max, 2500 model, Rigaku,
Japan) was used to investigate the crystalline phases of the
samples. The diffractmeter was with Cu Kα radiation in the 2θ
range from 10o to 80o at 0.02 steps, which operated
at 40 kV and 50 mA at a scanning rate of 4 o/min.
The crystalline phases were identified by matching the peak
positions of the intense peaks with PCPDF standard cards.
The microstructure of glass-ceramics samples were examined
by the scanning electron microscope (SEM, FEI Quanta-200, America). The samples
were polished to under 1μm and eroded by HF (4 wt.%) for 60 s, then transferred
them to an ultrasonic cleaning equipment for 1 h to eliminate impurities that
did not dissolve in the acid before being sputtered with a gold coating.
Crystal morphology could be observed clearly.
Vickers hardness (Hv) tests were tested
on polished glass-ceramics samples, using a Matsuzawa
microhardness tester (HVS-1000) with a pyramid shaped diamond indenter,
applying loads 1.96 N for 30 s. At least 10 different positions measurements
were taken for each sample to take the average values. Indentation
diagonals were measured to calculate hardness values in GPa.
The thermal expansion coefficient (TEC) measurements
were carried out in a thermo-mechanical analyzer (Netzsch DIL 402EP, Germany)
in the temperature range 20-450 oC at heating rate of 2 K/min,
using a silica probe in an inert atmosphere using argon (50 ml/min). The
samples were machined into 3 mm × 3 mm × 20 mm
cuboid test bars. The average thermal expansion coefficient
values were calculated in the temperature range of 20-450 oC.
|
Table 1 Chemical compositions of the base glasses (± 0.02 wt.%)a. |
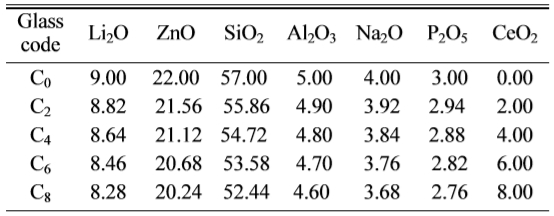
aThe error was caused by converting the content of oxide into that of raw material, weighting of raw materials, volatilizing of oxides and corroding on crucible surface |
Crystalline
phases and microstructure
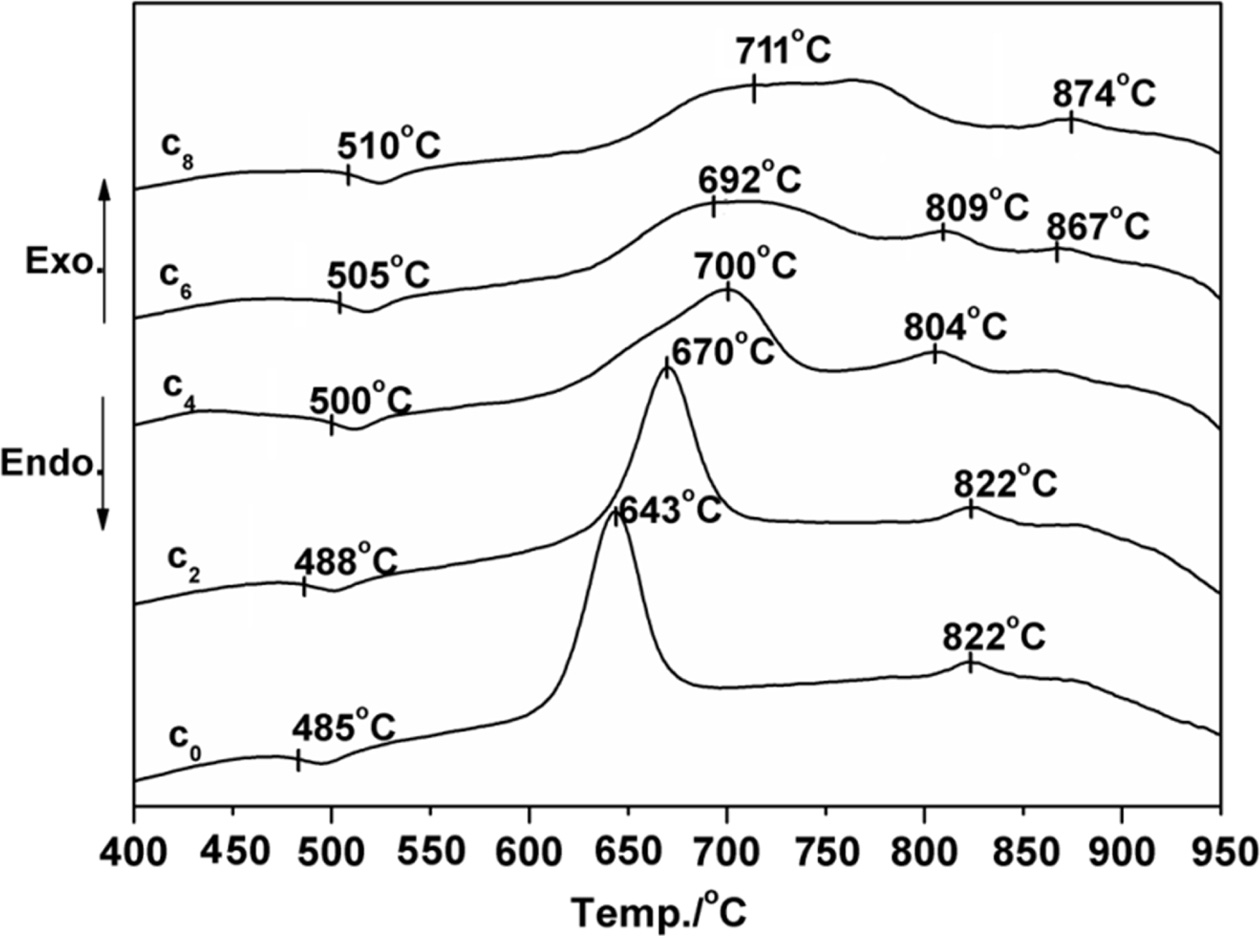
Fig. 1 shows the DSC curves obtained from as-cast LZS
glasses. There were obviously endothermic valleys on the
differential thermal curves. The start points of the endothermic valleys (Tg,
marked temperatures in Fig. 1) were from 485 to 510 oC with CeO2
content increasing. It indicated the glass transition temperature (Tg)
increased. Exothermic peaks were also obvious on the curves,
and the peaks had changed. The temperatures of first
peaks increased but the peak intensity (height and area) weakened at the same
time. Crystallization peaks correspond to the formation of
different crystalline phases. The curve shape of C0
is similar with that of C2, it showed that low content (under 2
wt.%) of CeO2 would not have obvious influence on
crystalline phases. As the CeO2 content increasing, when it
was above 4 wt.%, it had a bigger impact on the formation of
crystals. The curves of C4 and C6 showed new
peaks at 804 oC and 809 oC, and C6 and C8
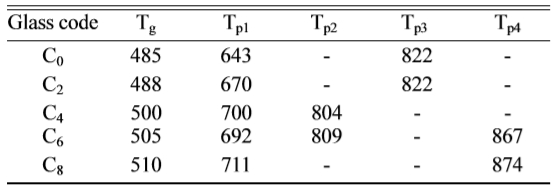
both appeared another peaks at 867 oC and 874 oC. Table 2
given a summary of the results of
differential scanning calorimetry: glass transition temperatures (Tg)
and the peak temperatures of crystallization (Tp). The main
crystals of LZS are lithium zinc silicate
and cistobalite, and the formation temperatures of them are about 650 oC
and 750 oC [34]. However, β-spodumene crystal formation
temperature is about 850 oC.
According to the DSC curves, CeO2 might promote the formation of new
phase β-spodumene. On account
of the analysis of DSC curves above, the nucleation temperature of the samples
was set at 520 oC for 2 h, and the crystallization temperatures were
set at 700, 830 and 880 oC for 2 h, respectively, to obtain
glass-ceramics. We could know the crystal growth process from X-ray diffraction
patterns.
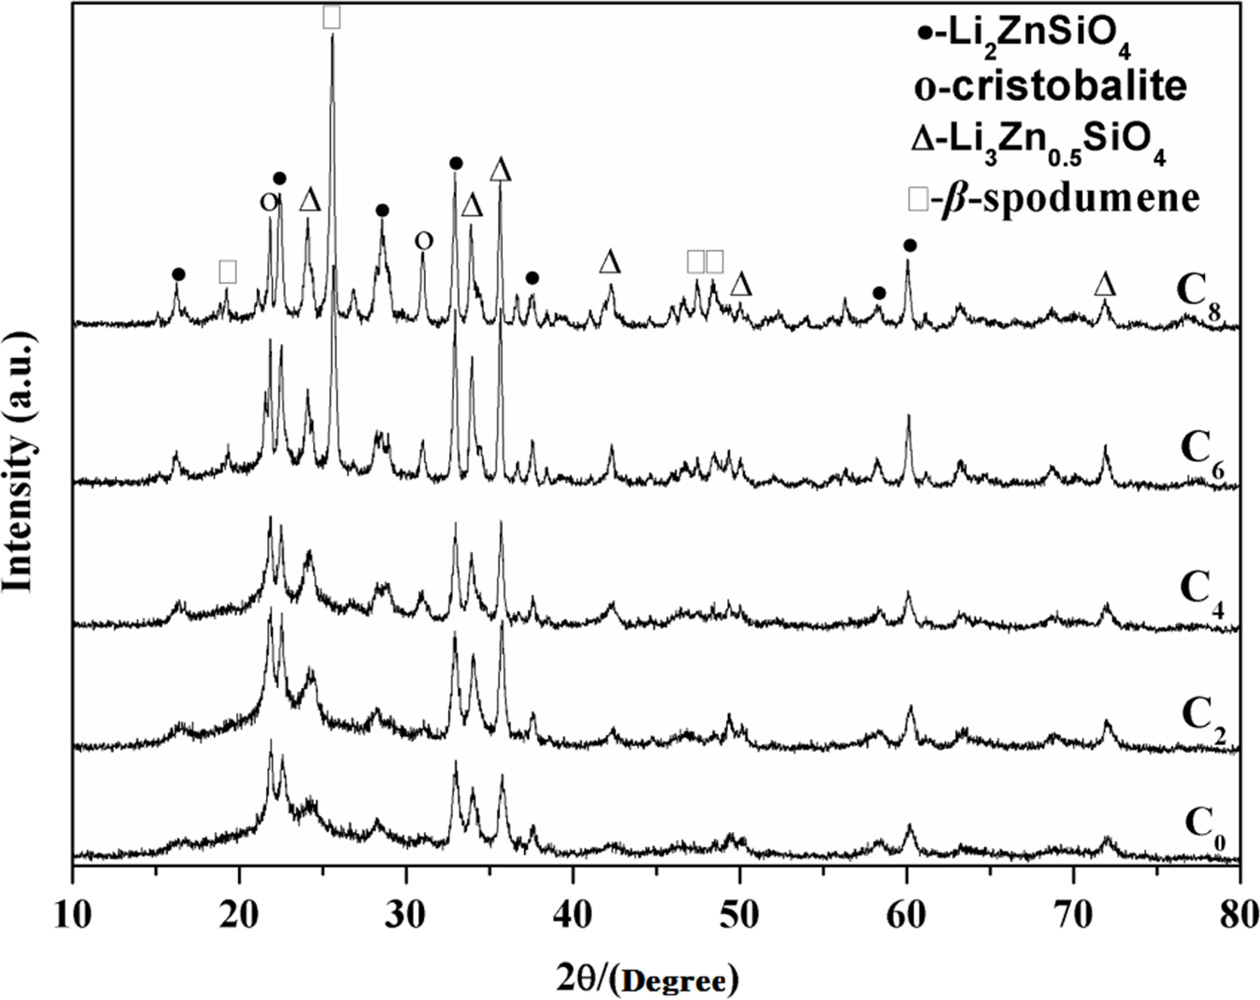
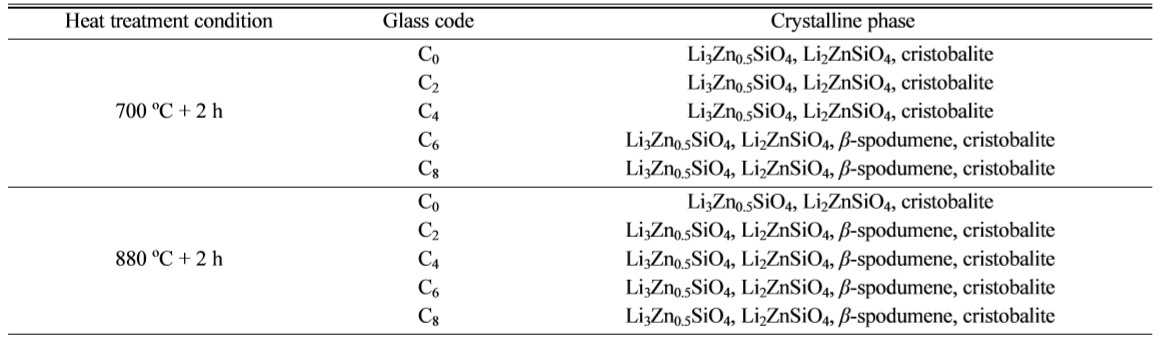
Fig. 2 and 3 show the X-ray diffraction
patterns of LZS glass-ceramics at different crystallization
temperatures (700 oC and 880 oC). Fig. 2
shows the XRD patterns of the samples containing different
amounts of CeO2 crystallized at 700 oC.
Crystallization consequence of the CeO2-free sample is quite simple,
as C0 showing. The major phases were Li2ZnSiO4
(PDF# 24-0677) and Li3Zn0.5SiO4 (PDF#
24-0667), which was the same to LZS system. The curves of C0, C2
and C4 in Fig. 2 are similar. It means that low content of
CeO2 (under 4 wt.%) in LZS system would not have obvious effect on
the main crystals in the glass-ceramics at low crystallization temperature (700 oC).
However, the amounts of main crystals
increased with CeO2 content increasing. When CeO2 content
was over 6 wt.%, β-spodumene (PDF# 35-0797) appeared, which could be
observed from C6 and C8 curves in Fig. 2. According to
the XRD analysis result in Fig. 2, the Li2ZnSiO4 and Li3Zn0.5SiO4
crystals were promoted by CeO2, and the amount of cristobalite
(PDF# 39-1425) also increased. High content of CeO2 (above 6 wt.%)
could accelerate crystals growth, especially for β-spodumene.
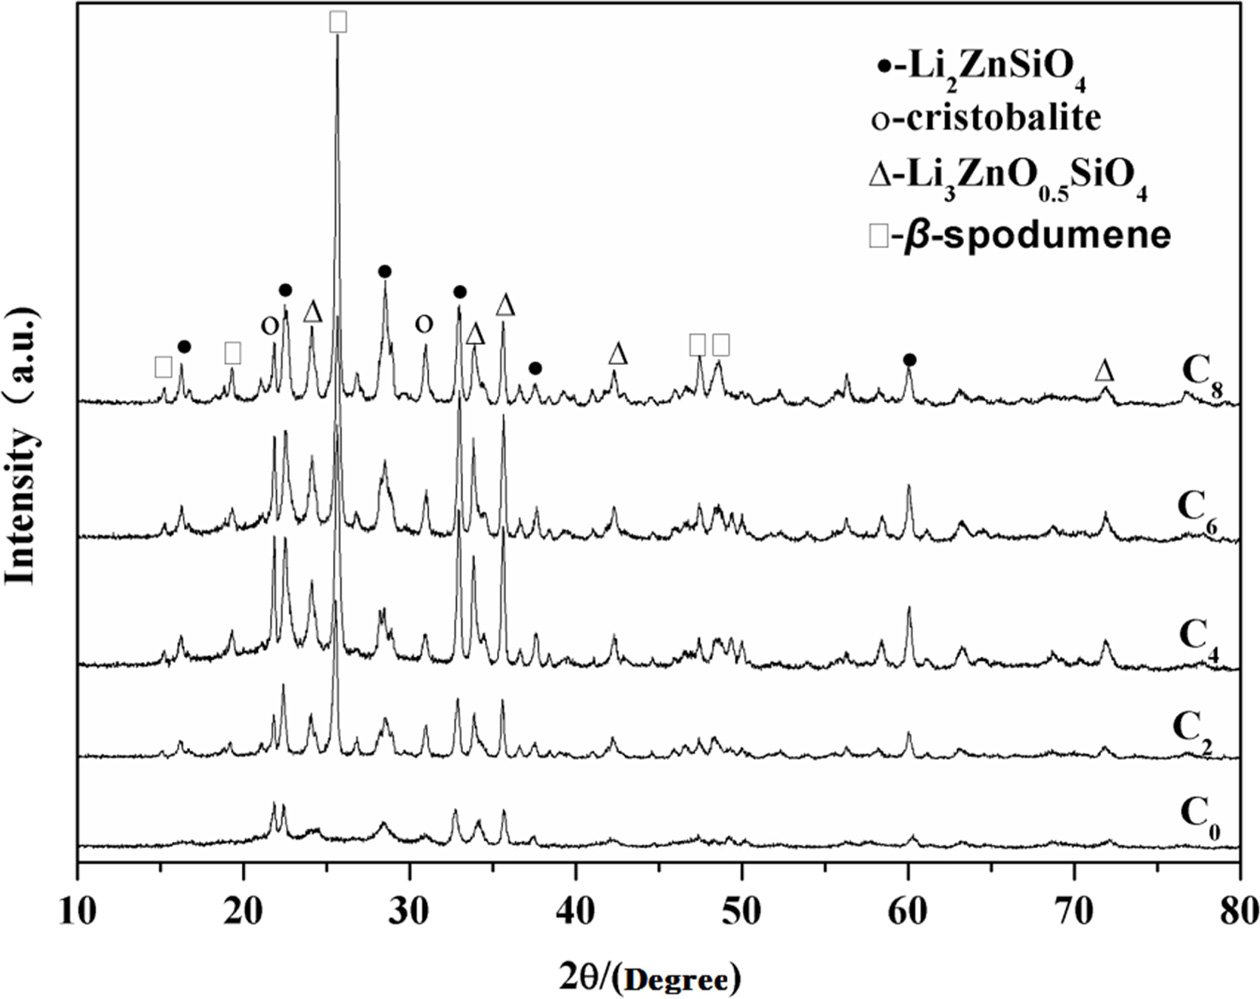
Fig. 3 shows the XRD patterns for the samples crystallized
at 880 oC. Li2ZnSiO4 and Li3Zn0.5SiO4
also were identified as major crystallization phases along with cristobalite
phase increasing when the amount of CeO2 was under 2
wt.%, according to C0 and C2 curves in Fig. 3. C0
curve in Fig. 3 had no obvious difference with C0 in Fig. 2, but at
880 oC, C2 appeared β-spodumene,
and cristobalite increased. It indicated that temperature also
had a distinct effect on the formation of β-spodumene
and cristobalite. At high crystallization temperature (880 oC), CeO2
could better promote crystals growth. The CeO2-free samples had no β-spodumene
phase, regardless of temperature. The amounts of Li2ZnSiO4,
Li3Zn0.5SiO4 and cristobalite also increased
as CeO2 increasing at 880 oC. The samples
containing high amount of CeO2 (6 wt.%) at low
crystallization temperature (700 oC) had the same crystalline phases
with the samples containing low amount of CeO2 (2 wt.%) at high
crystallization temperature (880 oC). When the content of CeO2
reached to 8 wt.%, the amount of β-spodumene was highest at 880 oC.
By contrasting Fig. 2 and Fig. 3, it indicated CeO2 could accelerate
crystals growth in LZS system, and it is more obvious at higher temperature. Table 3 shows more details of crystalline phase changes
of the samples containing different content of CeO2.
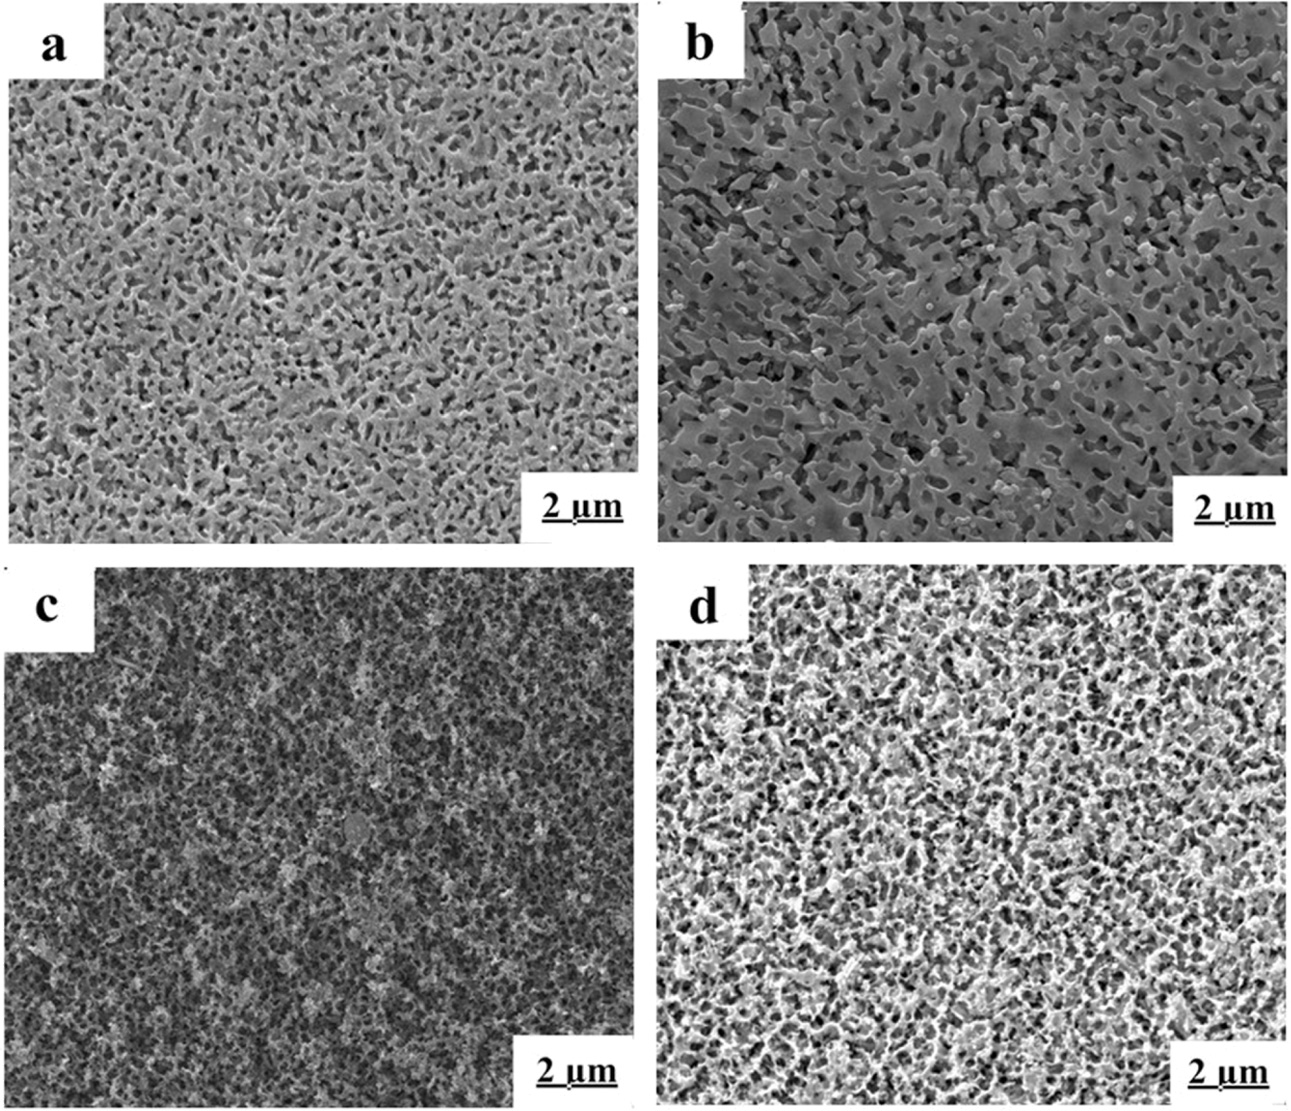
The microstructures of the samples are showed in Fig. 4
and 5. The chosen scanning electron microscope pictures were representative,
which were C0, C2, C6, C8
heat-treated at 700 oC and 880 oC for 2 h, respectively.
The morphology in Fig. 4(a) and (b) was similar. The interconnected network
microstructure formed by tiny dendritic crystals, and the crystals in picture
(b) was much bolder. According to the XRD analysis, the main crystals in Fig.
4(a) and (b) were Li2ZnSiO4 and Li3Zn0.5SiO4
at 700 oC. The microstructures of glass-ceramics had changed
significantly when CeO2 content were 6 and 8 wt.%, showing in Fig.
4(c) and (d). A lot of β-spodumene crystals formed. The
morphologies become smaller network-shaped microstructure, and crystals density
increased. The development and disorderly distribution
of massive thin small dendritic crystals resulted in the formation of
honeycomb-shaped network structure. As the amount of CeO2
increasing, the dendritic crystals became coarser, as shown in Fig. 4(d).
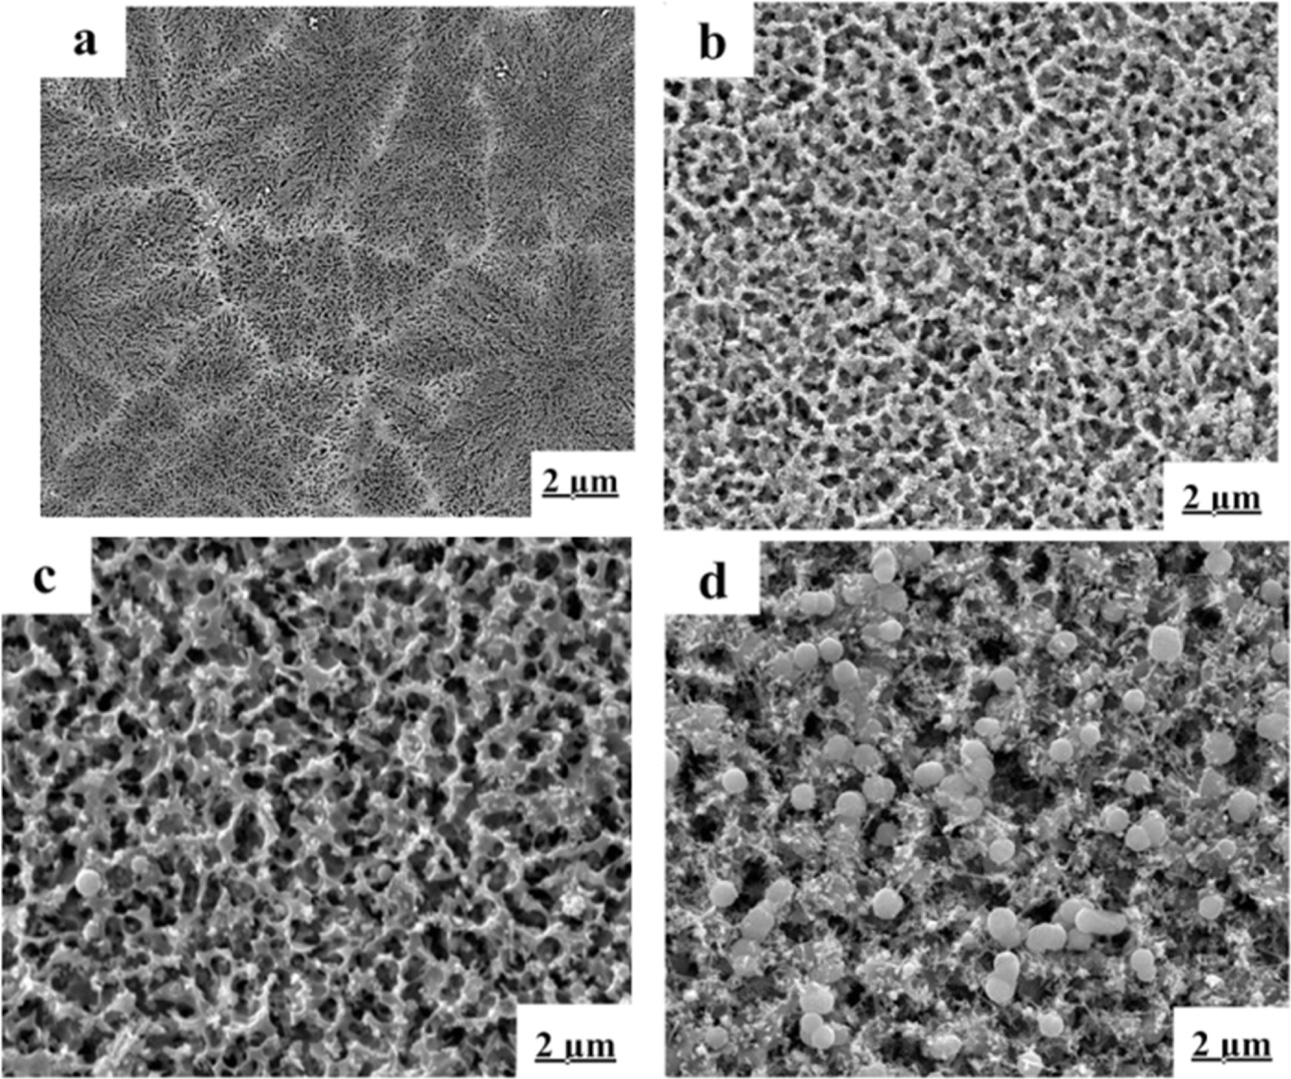
When the heat-treated temperature was 880 oC,
the effect of CeO2 on the crystals was more obvious. The
microstructures of CeO2-free sample appeared different parts
(Fig. 5(a)). The spherical crystals could be observed, which was
cristobalite crystal. Contrasting with Fig. 4(d), Fig. 5(b) had similar
crystalline structure with it. It showed that CeO2 would
have a much stronger impact on promoting crystals formation at a high
temperature (880 oC). The Fig. 5(c) has a looser
net-work structure than that of picture (b). The reason was that with the increasing
of CeO2, the effect of partial substitution of Si4+ by Al3+
ions became stronger [32] and caused crystallization and
development of β-spodumene. The grain of cristobalite grew bigger,
distributing in tiny dendritic β-spodumene crystals, which could be seen
in Fig. 5(d).
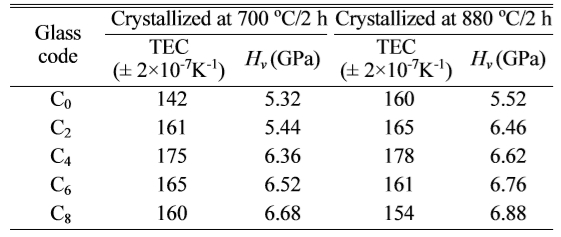
Hardness
(Hv) and Thermal expansion coefficient (α)
Vickers hardness of the glass-ceramics was an important
property. The samples crystallized at 730 oC and 880 oC
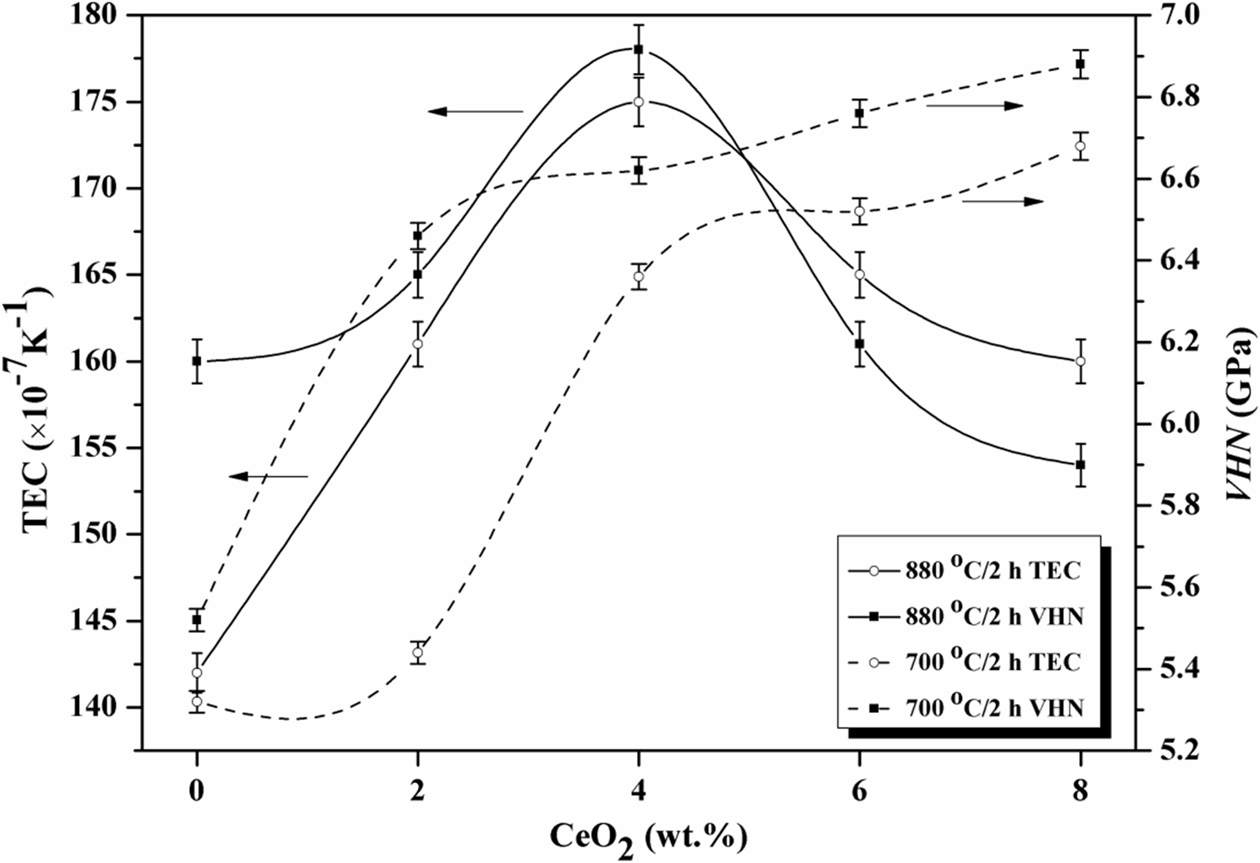
were tested, and the results were showed in Table 4. The microhardness of LZS glass-ceramics increased with CeO2
increasing, as showing in Fig. 6. It was already pointed out that β-spodumene
and cristobalite crystals increased in the glass-ceramics, which both have
higher bond strength than Li3Zn0.5SiO4 and Li2ZnSiO4
crystals. That was the reason of increase in hardness [33]. The hardness curves
crystalized at 700 oC in Fig. 6 had biggest changes when the amount
of CeO2 was from 2 to 4 wt.%. However, at 880 oC, the
changes happened when the amount of CeO2 was from 0 to 2 wt.%. They
were both reached to the maximums, 6.68
GPa and 6.88 GPa respectively, when CeO2 content was 8
wt.%. It suggested high temperature could enhance the effect of CeO2
in LZS glass-ceramics, which is similar with the XRD results. The increase of microhardness was in favour of
advancing the sealing application of LZS glass-ceramics.
The LZS glasses are mainly used to seal to metals, and the
thermo-physical property of the glasses is vital. The average thermal expansion
coefficient at 20-450 oC was investigated. The results were showed
in Table 4. Fig. 6 showed the change of thermal expansion coefficients at
different crystallization temperatures versus CeO2
content. The thermal expansion coefficients was first
increasing then decreasing, as showing in Fig. 6, and reached to the maximums
when the amount of CeO2 was 4 wt.%. According to the XRD results in
Fig. 2, when the amount of CeO2 is free, the main crystals are Li2ZnSiO4
and Li3Zn0.5SiO4, which have low thermal
expansion coefficients (α ≈ 110×10-7 K-1).
However, the amount of cristobalite (α ≈ 270×10-7 K-1)
increased with CeO2 increasing. The thermal expansion coefficient
of LZS glass-ceramics increased, and reached to the
maximum. With the amount of CeO2 increasing (above 4 wt.%), it
promoted the formation of β-spodu-mene, which has a lower thermal expansion coefficient (α ≈ 19×10-7 K-1).
The thermal expansion coefficient of LZS glass-ceramics decreased with β-spodumene
increasing. When the crystallization temperature reached
to 880 oC, the effect of CeO2 promoting β-spodumene
and cristobalite formation was more obvious, and β-spodumene crystals
increased more apparently with CeO2 content increasing. The
glass-ceramics had lower thermal expansion coefficient when
the amount of CeO2 was above 6 wt.% at 880 oC.
A small amount of CeO2 (under 4 wt.%) could increase the average
thermal expansion coefficients of LZS glass-ceramics, but it would markedly
decrease when high CeO2 content promoted the formation of β-spodumene.
It could be concluded that LZS glass-ceramics could have a wide range of
thermal expansion coefficients with the changes of temperature and CeO2
content. The change of thermal expansion coefficient would make it better seal
to more metals.
|
Fig. 1 DSC curves of the glass with different amounts of CeO2. |
|
Fig. 2 X-ray diffraction patterns of the present glasses heattreated at 700 oC for 2 h. |
|
Fig. 3 X-ray diffraction patterns of the present glasses heattreated at 880 oC for 2 h. |
|
Fig. 4 Microstructure of the LZS glass-ceramics heat-treated at 700 oC for 2 h with different mounts of CeO2: (a) 0 wt.%, (b) 2 wt.%, (c) 6 wt.%, (d) 8 wt.%. |
|
Fig. 5 Microstructure of the LZS glass-ceramics heat-treated at 880 oC for 2 h with different mounts of CeO2: (a) 0 wt.%, (b) 2 wt.%, (c) 6 wt.%, (d) 8 wt.%. |
|
Fig. 6 Variation of microhardness and thermal expansion coefficients (TEC) with CeO2 contents. |
|
Table 3 Effect of CeO2 and heat treatment on the formation of crystalline phase. |
|
Table 4 The average thermal expansion coefficients at 20-400 oC and Vicker’s hardness (± 0.02) of different amount of CeO2doped samples crystallized at 700 oC and 880 oC for 2 h. |
The amount of CeO2 could affect the
crystallization and thermo-physical properties of lithium zinc silicate
glass-ceramics. The glass transition temperature (Tg)
increased, but CeO2 promoted the formation of β-spodumene and
cristobalite crystals, which made the structure more rigid and caused the
change of thermo-physical property, and the effects were more obvious at high
crystallization temperature. The microhardness increased with CeO2
content increasing; however, the average thermal expansion coefficients
(20-450 oC) of LZS glass-ceramics showed first increasing then decreasing,
and it obtained a wider range and reached to maximums when the amount of CeO2
was 4 wt.%. The analysis indicated that CeO2 played
an important role in adjusted the crystallization and physical properties.
And a higher microhardness and a wider average thermal expansion coefficient
indicated the LZS glass-ceramics could better seal to metals.
The work was financially supported by Science and
Technology Research Foundation of Jiangxi Education Department (No.
GJJ170537/GJJ170498) and Startup Foundation for Docotors of Jiangxi University
of Science and Technology (No. jxxjbs17019).
- 1. S.C. Clausbruch, M. Schweiger, W. Höland, and V. Rheinberger, J. Non-Cryst. Solids 263 (2000) 388-394.
-

- 2. B.I. Shaima and M. Goswami, J. Mater. Lett. 58 (2004) 2423-2438.
-
- 3. I.W. Donald, J. Non-cryst. solids (2004) 345-346.
-
- 4. M. Goswami, S.K. Deshpande, and R. Kumar, J. Phys. Chem. Solid. 71 (2010) 739-744.
-
- 5. W.Z. Liu, Z.W. Lou, X.L. Hu, and A.X. Lu, Thermochim. Acta. 584 (2014) 45-50.
-
- 6. Y.Z. Chen, W.H. Li, Y. Zhang, Z.Q. Shen, D.L. Yang, and X. Z. Song, Ceram. Int. 42 (2016) 11650-11653.
-
- 7. S.M. Salman, S.N. Salama, and H.A. Abo-Mosallam, Bol. Soc. Esp. Ceram. V. 56 (2017) 205-214.
-
- 8. P.W. McMillan and B.P. Hodgson, Glass Tech. 7 (1966) 121.
- 9. P.W. McMillan, G. Partridge, and B.P. Hodgson, Glass Tech. 7 (1966) 128.
- 10. I.W. Donald and B.L. Metcalfe, J. Mater. Sci. 24 (1989) 3892-3903.
-
- 11. I.W. Donald, P.M. Mallinson, and B.L. Metcalfe, J. Mater. Sci. 46 (2011) 1975-2000.
-
- 12. A. Karamanov, P. Pisciella, and M. Pelino, J. Eur. Ceram. Soc. 20 (2000) 2233-2237.
-
- 13. J.J. Shyu and M.T. Chiang, J. Am. Ceram. Soc. 83 (2000) 635-639.
- 14. A.W.A El-Shennawi, E.M.A. Hamzawy, and G.A. Khater, Ceram. Int. 27 (2001) 725-730.
-
- 15. W. Zheng, J. Cheng, and L. Tang, Thermochim. Acta 456 (2007) 69-74.
-
- 16. H.B. Zhang, G. Gui, C.H. Su, Y.M. Wang, and J. Shao, Chinese J. Inorg. Chem. 26 (2010) 144-148.
- 17. Y. Demirci and E. Günay, J. Ceram. Process. Res. 12 (2011) 352-356.
- 18. Z. Shen, Z. Liang, and Z. Yong, Ceram. Int. 43 (2017) 7099-7105.
-
- 19. D. Lee and S. Kang, J. Ceram. Process. Res. 19 (2018) 504-508.
- 20. G.P. Singh and D.P. Singh, Physica B 406 (2011) 640-644.
-
- 21. E. Mansour, J. Non-Cryst. Solids 357 (2011) 1364-1369.
-
- 22. P.S. Gurinder and D.P. Singh, Physica B 407 (2012) 4168-4172.
-
- 23. H.J. Wang, B.T. Li, and H.X. Lin, Int. J. Appl. Glass Sci. 7 (2016) 310-318.
-
- 24. H.J. Wang, B.T. Li, and H.X. Lin, J. Mater Sci-Mater. El. 27 (2016) 2860-2865.
-
- 25. T. Liu and G. Chen, Ceram. Int. 39 (2013) 5553-5559.
-
- 26. F. Soleimani and M. Rezvani, Mater. Res. Bull. 47 (2012) 1362-1367.
-
- 27. S.A.M. Abdel-Hameed and F.H. Margha, J. Alloys Compd. 554 (2013) 371-377.
-
- 28. S.B. Sohn, S.Y. Choi, and Y.K. Lee, J. Mater. Sci. 35 (2000) 4815-4821.
-
- 29. A.M. Hu, K.M. Liang, and F. Zhou, Ceram. Int. 31 (2005) 11-14.
-
- 30. J. Temuujin, U. Bayarzul, E. Surenjav, K. D. Sung, and C. Y. Sik, J. Ceram. Process. Res. 18 (2017) 112-115.
- 31. Y. S. Du, J. Ma, X. F. Zhang, H. X. Zhang, H. Chen, S. Ouyang, and B.W. Li, J. Ceram. Process. Res. 20 (2019) 401-410.
- 32. M. Goswami and P. Sengupta, Ceram. Int. 33 (2007) 863-867.
-
- 33. A.X. Lu and Z.B. Ke, J. Non-cryst. Solids 353 (2007) 2692-2697.
-
- 34. J. Zarzycki, in “Material Science and Technology” (Weinheim press, 1991) p667-713.
 This Article
-
2020; 21(1): 86-91
Published on Feb 28, 2020
- 10.36410/jcpr.2020.21.1.86
- Received on Sep 29, 2019
- Revised on Nov 18, 2019
- Accepted on Dec 9, 2019
Services
- Abstract
introduction
experimental procedure
results and discussion
conclusions
- Acknowledgements
- References
- Full Text PDF
Shared
Correspondence to
- Weizhen Liu
-
Faculty of Resources and Environmental Engineering, Jiangxi University of Science and Technology, Ganzhou 341000,China
Tel : +8607978312071 Fax: +8607978312051 - E-mail: 9120170002@jxust.edu.cn
Clean-Energy Research Institute(CRI), Hanyang University, 222, Wangsimni-ro, Seongdong-gu, Seoul, 04763, Korea
E-mail: jcpr@hanyang.ac.kr