


- Process parameters and properties of electric resistance spot welded AISI304-AISI1020 dissimilar weldments
Mathi Kannaiyana, Jinu GowthamiThankachi Raghuvaranb,*, Karthikeyan Govindanc and Elaya Perumal Annamalaid
aAssistant Professor, Department of Mechanical Engineering, University College of Engineering, Kancheepuram, Tamil Nadu
bAssistant Professor, Department of Mechanical Engineering, University College of Engineering, Nagercoil, Konam, Tamil Nadu
cAssistant Professor, Department of Mechanical Engineering, University College of Engineering, Pattukkottai, Rajamadam Tamil Nadu
dResearch Scholar/SRF (UGC), Department of Mechanical Engineering, University College of Engineering, Nagercoil, Konam, Tamil Nadu
In this present work, an
attempt was made on optimising the Resistance Spot Welding (RSW) process
parameters for joining two dissimilar combinations of AISI 304 and AISI 1020
grade steel with each other. Experiments were conducted by varying the three
weld process parameters such as welding current, pressure and welding time. The
integrity of the weld joints was evaluated mechanically and metallurgically.
Tensile shear fracture, nugget diameter, and hardness properties were examined.
Macrostructure, Microstructure, and Scanning Electron Microscopy (SEM) analysis were carried out on the tested
samples to validate the type of fracture occurred. Maximum nugget
diameter and maximum tensile fracture of 6.666 mm and 10.5 kN were achieved
respectively. The experimental results confirmed the validity of the used
Response Surface Methodology applied for optimising the welding process
parameter in the RSW process. The Response Surface Methodology (RSM) results
show that the weld current is the most significant factor for Tensile Shear
Fracture Load (TSFL) and nugget diameter, followed by weld pressure and time.
Keywords: Resistance spot welding, Tensile shear fracture, Nugget diameter, Response surface methodology
The RSW process is widely used for joining sheet metals in
automobile sectors due to the increase in the demand for
welding. In automobiles industries fabrication of sheet
metals are ideally suited for mass production due to inexpensive and effective
way to join metal sheets [1, 2]. In RSW process the two sheet metals are joined
in the form of a spot or continuous faying method. The process
of joining the sheet can be completed in three stages namely squeeze time, weld
time/heating time and hold time. In this welding process a
substantial electric current is allowed to flow on the sheets which
are placed together, and pressure is applied with the help of two copper
electrode tips. Due to the flow of welding current against the sheets, the
resistive path is generated at the area to be joined, which creates localized
heating. When the flow of current is stopped, it gets solidify to join the
sheets. The efficiency of the joints was based on the weld process parameters
such as welding current, welding time as well as electrode pressure between the
two water-cooled copper-based electrodes [3]. Vuril et al. investigated
the effect of nugget diameter on mechanical and metallurgical properties of galvanised steel and AISI304 welded lap joints
[4]. Bouyousfi et al. [5] carried out experiments to investigate the
effect of spot welding process on mechanical characteristics of AISI 304
similar joints. They revealed that
the applied load is a major controlling
factor for the mechanical characteristics of weld joint compared to the welding
duration and current intensity of welding. Oscar Martin et al. [6]
carried out spot welding on
austenitic stainless steel(304), and the results revealed that the tensile shear load bearing capacity (TSLBC) increased
initially by increasing weld time and weld current, but when the pressure
increases continuously the TSLBC was decreased. Yoon et al. [7]
identified the optimal weld process parameters for spot welding of AA7075- T6
aluminium alloy sheets using Taguchi method. They found that Electrode force
1323 N, Welding current 14 kA, Welding time four cycles is the optimum process
parameter for obtaining higher tensile shear strength.
Austenitic stainless steel and low carbon steel possess
an excellent combination of mechanical properties, formability, weldability and
corrosion resistance. This combination of steels is extensively used in the
marine industry [8, 9]. Stainless steel is an iron-based alloy having
excellent corrosion resistance due to the passive films on the surface
[10, 11]. This type of materials is used in
several applications due to its superior properties such as high
corrosion resistance, good toughness, high energy absorption, weldability, and
high strength [12]. Stainless steel has been widely used in automotive and aerospace
industries due to its higher corrosion resistance and
workability [13, 14]. Jae Hyung Kima investigated the impact of weld input
process parameters like weld time and current of resistance spot welding with
output responses like tensile strength and nugget diameter on Low Carbon and
High strength Low Alloy (HSLA) Steel [15]. Dawei Zhao [16] investigated the
effect of the specific transition resistance on sheet-sheet contact. They
revealed that the sheet to sheet contact posses ten times higher specific
transition resistance than between electrodes to sheet contact. They also
concluded that the local contact temperature is the most significant
influencing factor for the specific transition resistance. Aslanlar et al.
[17] analysed the effect of variation in dynamic resistance across electrodes
for the nugget growth by varying the RSW parameters such as
electrode force and welding current. They identified that for
higher weld, current and electrode force improves the rate of nugget growth.
From the literature survey, it is identified that several
researchers have shown a keen interest in resistance spot welding process for
welding of various similar and dissimilar joints using duplex
stainless steel, HSLA steels, AA 7075. The various mechanical and
metallurgical investigations were also carried out on the resistance
spot-welded joints based on its applications. No work was carried out for
identifying the optimum RSW process parameters in welding of AISI 304 and AISI
1020 dissimilar joints.
Therefore in this work, Electrical Resistance spot welding
of single lap joint was carried out on AISI 304 and AISI 1020 materials by
varying the weld process parameters such as welding power, welding pressure and
weld time. The various mechanical tests, such as tensile shear fracture and
hardness, were conducted on the welded samples to find the relationship between
weld input process parameters and the resulting weld nugget strength. In this
work RSM was used to predict the tensile shear strength/failure modes of welded
joint at various RSW process parameters.
In this work AISI 304 with chromium as an alloying element
and AISI 1020 with manganese as an alloying element of
1.5 mm as thickness were used in this present investigation
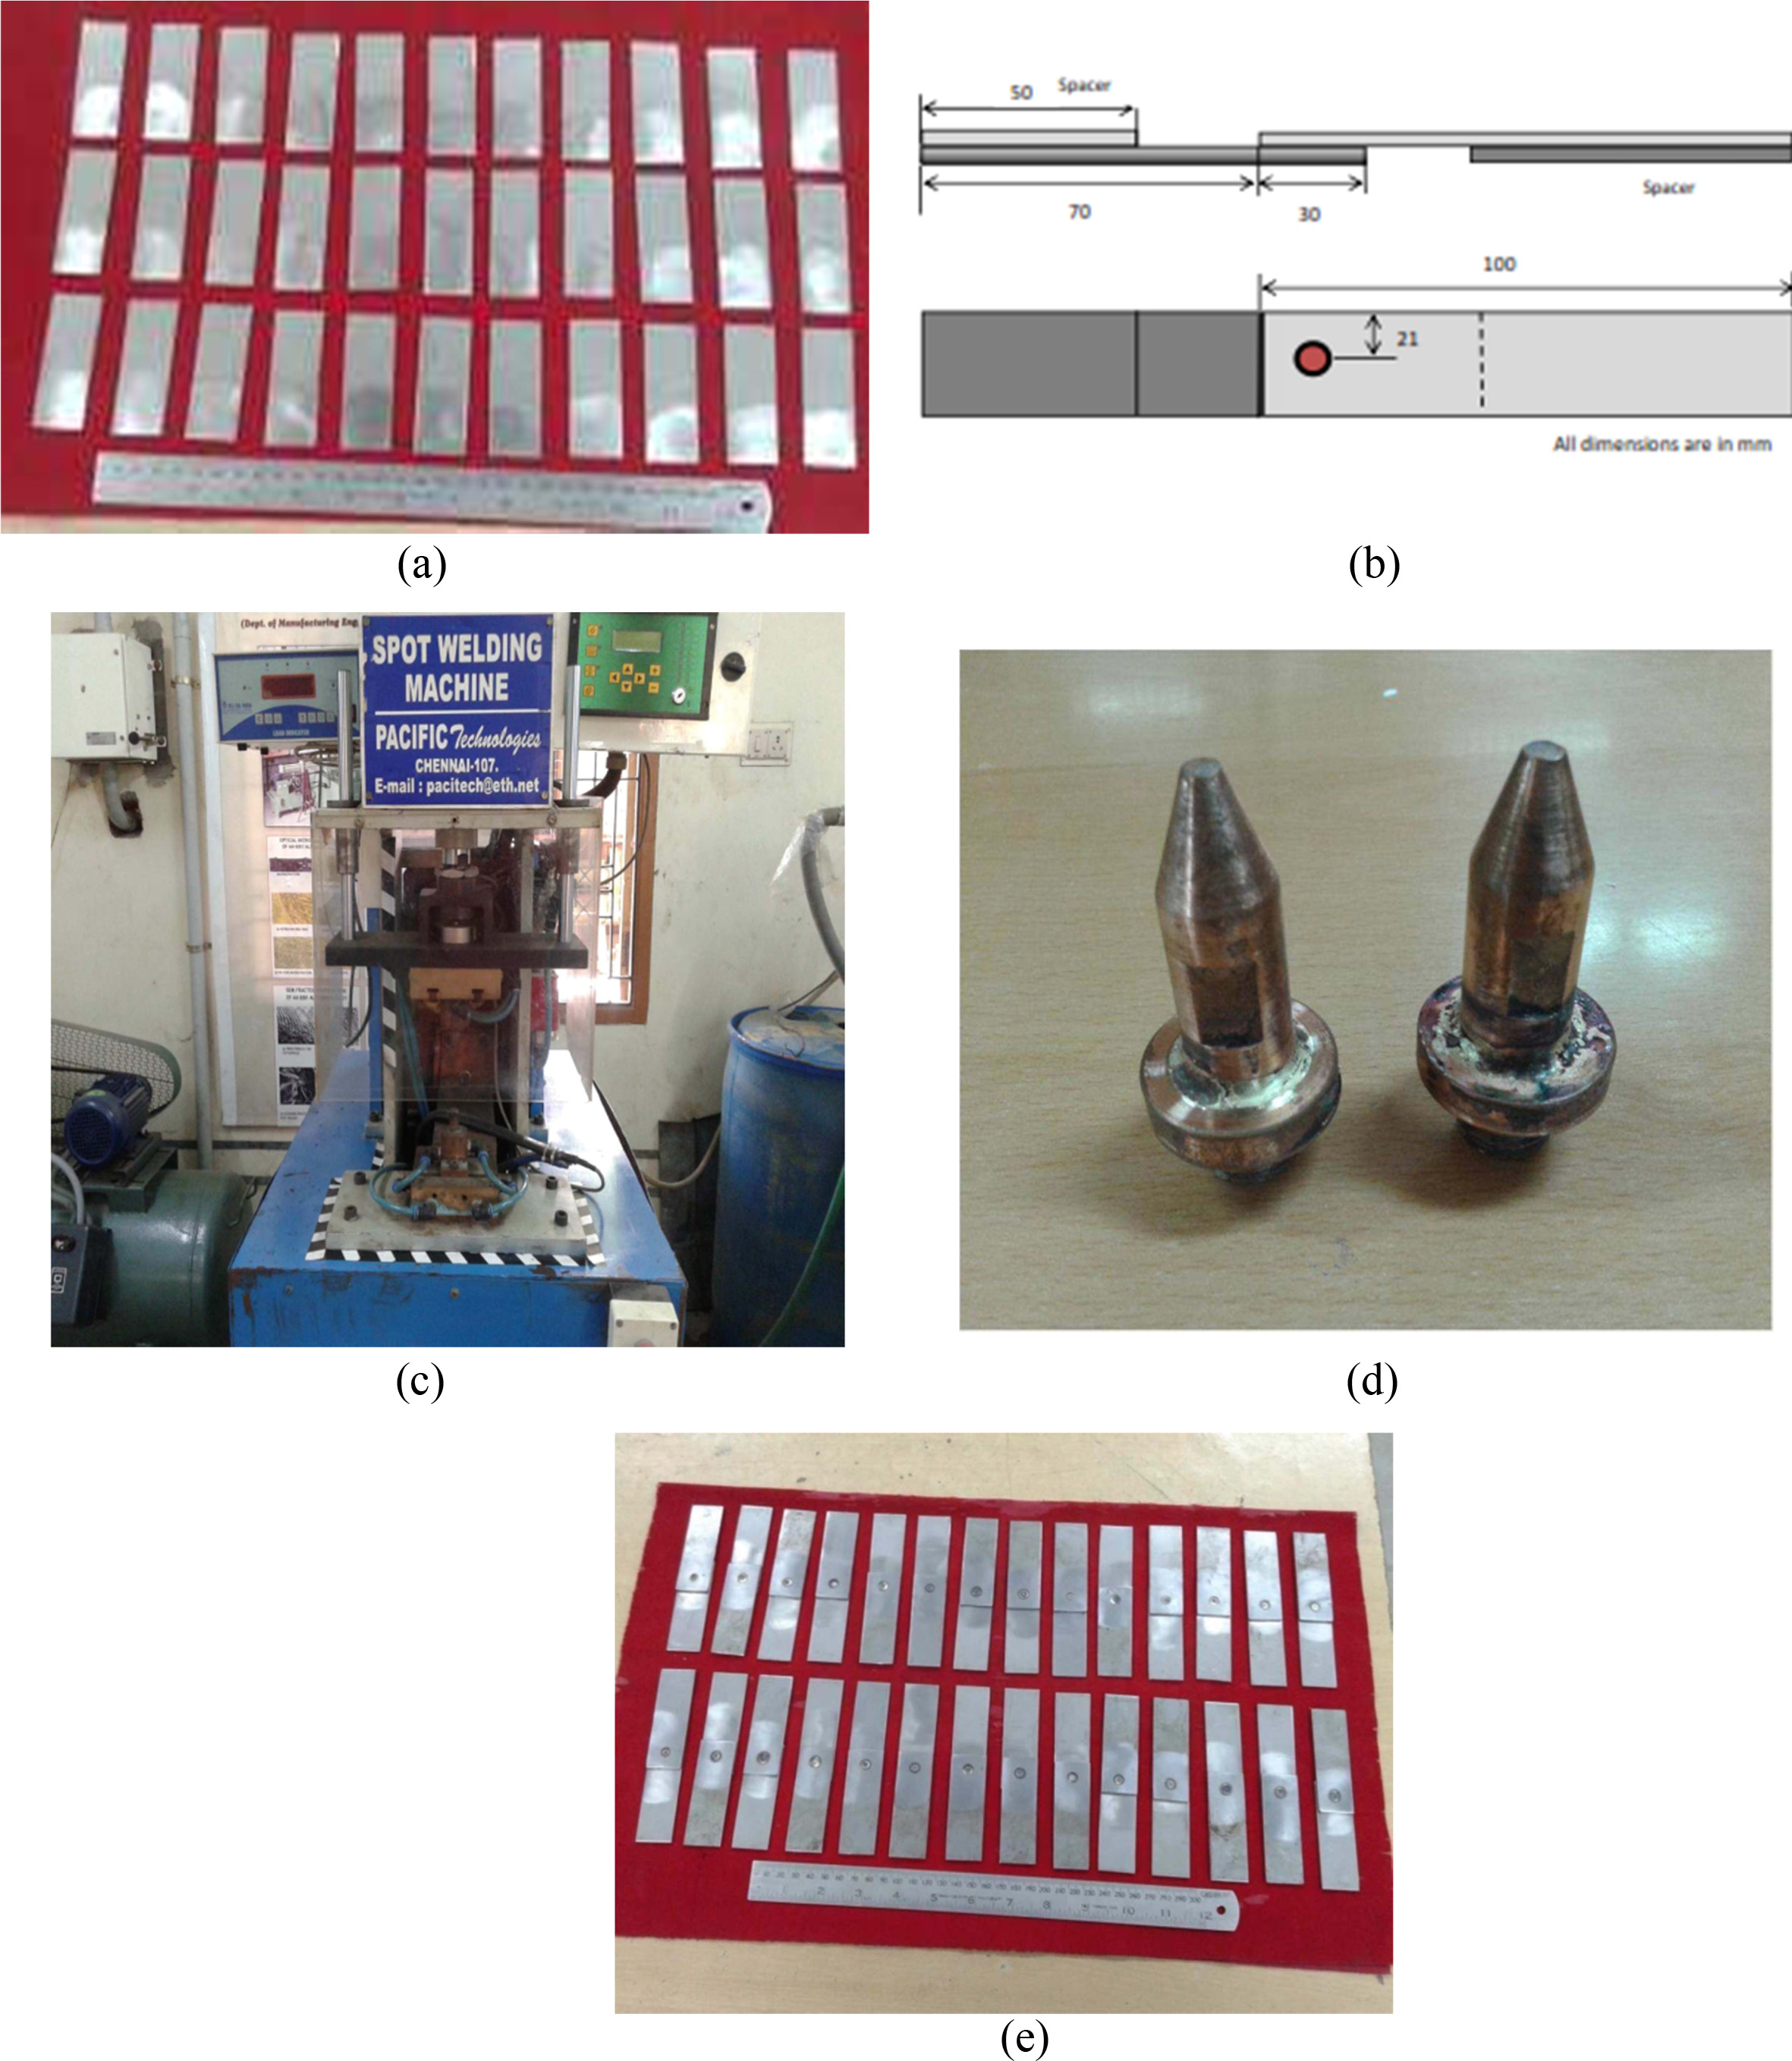
as shown in Fig. 1(a) and (b). The mechanical, thermal
properties and chemical composition of these alloys are given in Table 1 and 2.
The joining of metal sheets was carried out in Resistance spot
welding machine with the configuration of pedestal type
inverter base and medium frequency DC machine (Model PACI TECH-ERSW) of
capacity 90 kV. It has the flexibility of welding sheets up to 6 mm thickness
with a maximum current of 20 kVA capacities shown in Fig. 1(c). The electrode
used in this welding consists of a shank of diameter 16 mm with a conical cap
having a tip diameter of 5 mm shown in Fig. 1(d), which is made up of Cu-Cr-Zr
alloy and is water-cooled during the welding process. The electrodes are made
to hold the sheet specimens under pre-determined pressure, and at that time the
current is passed through it, to fabricate the joints. Three process parameters
with three levels of experiments were selected as given in Table
3. The welded samples are shown in Fig. 1(e). The tensile
shear test was conducted on the welded samples as per the
ISO14273 standards. The width of the samples is
calculated as 41.285 mm, and it was rounded to 42 mm by using the equation
w ≥ wcr = 13:4 + 18:59 t (1)
The nugget diameter was measured by a digital calliper.
Investigating the weld nugget resistance was carried out with the help of
computerised Micro Vickers hardness tester under the application of load 200
gms for 15 seconds of dwell period. The optical system, which is used for
measuring of nugget zone, has a range of 200 µm at 0.01 µm of resolution by a
light source of 12 V/20 W ARTRAY Camera.
For microstructural analysis, the welded samples were
polished by different grit papers and etched to reveal microstructure. A Carl
Zeiss Ultra Plus Gemini FESEM model SEM was used to characterise the weld zones
of the welded samples.
|
Fig. 1 (a) base metal specimen, (b) specification of base metal, (c) resistance spot welding machine, (d) copper electrode, and (e) welded specimen. |

Heat input is one of the main criteria for obtaining the
efficiency of the joint. Also, the capability is based upon the differences in
the melting temperature of the two dissimilar metals. The adequate heat
generation depends on the variation of the three parameters. (1) The current,
(2) the resistance of the conductor and (3) the duration of the current. The required
heat generated through the electrical resistance of the two bodies to be joined
specified in Eq. (1) [18, 19].
Q = I2Rt (2)
where t = Time to current flow
in -s
I = Current in-
A
R = Electrical
resistance in- ohm
Q = Heat
generated in- J
According to Joule's law as welding current decreases
with increasing electrical resistance and induction of constant second voltage.
When heat input is increased weld nugget also increased similar reports were
identified in [19-22].
Based on previous literature’s and by conducting
feasibility weld trials, it is identified that the most influencing process
parameter for RSW process is power, pressure and weld time. Similarly, from the
feasibility study the range of parameters were identified
to obtain defect-free joints. The selected weld process parameters and their
levels are listed in Table 3, by applying those values in Box-Behnken
(three-parameter and three levels).
The 17 combinations of weld process parameters were
collected as given in Table 4; the weld trials were conducted. From the welded
samples the TSFL and hardness test was carried out, and the results are given
in Table 4. The nugget diameter and depth was also measured and given in Table
4.
From the Table 4, it is identified that the maximum TSFL
of 10.5 kN and hardness 543 VHN was obtained for the joint welded at the power
of 65 watts, the pressure of 3.8 kN and the weld time of 2 seconds. The main
parameter in this research is the nugget diameters which decide the joint efficiency,
and it is measured by a video measuring instrument, and the results are
tabulated in Table 4. The maximum efficiency of the joint depends on increasing
the weld time and current. The nugget diameter is varied from 4.612 mm to 6.666
mm. This varied nugget diameter will affect the change in tensile shear
fracture [23].
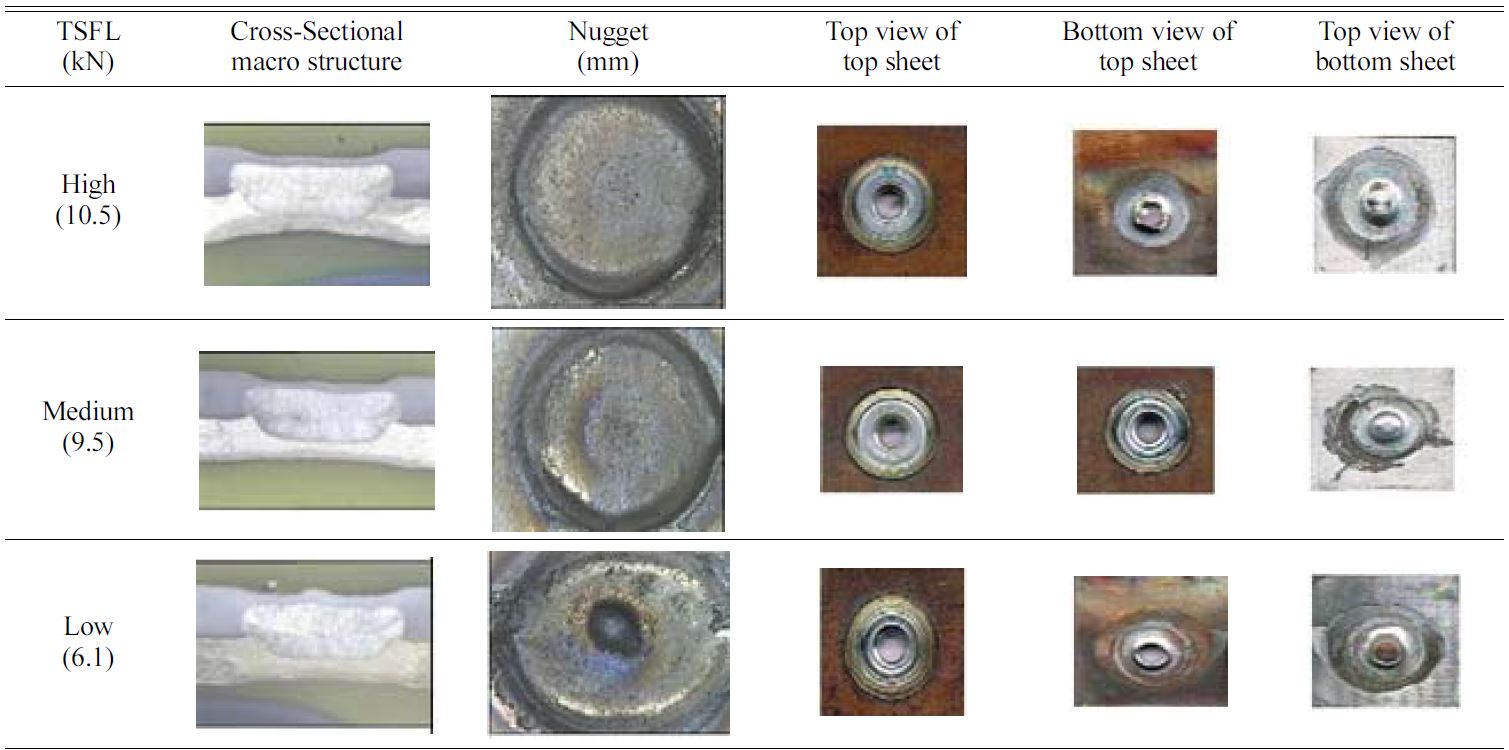
In resistance spot welding, the pressure and current
applied on the lap joined metals and which will attain molten metal and
solidified into nugget after quick cooling. The low, medium, high TSFL values
obtained samples are subjected to macro-structural evaluation, and the
corresponding macro images are given in Table 5. Vural and Akku [4] also
reported that the heat input increases with increasing weld time and current
the varied macrostructure which are shown in the figures and presented in Table
5. reveal that the shearing and tearing occurred on the welded joints.
|
Table 5 Macrostructure evaluations for Resistance spot welded Joints at high, medium and low levels. |
In order to identify the influence of weld process
parameters on the quality of weld joints. It is necessary to find out the
optimal condition of process parameter levels, which were done with the help of
ANOVA. ANOVA was performed based on the experimental data at a confidence
interval of 95%. The obtained results from the ANOVA analysis are given in
Table 6. From Table 6, it is identified that the model P-value of 11.96 implies
that the model is an important one. Similarly, the R- squared value of 0.9389
and the adjacent R squared value of- 0.8304 reveal the same results. From Table
6, it is identified that the weld current is the most significant factor for
TSFL and nugget diameter, followed by the weld pressure. Weld time is the least
significant factor for the above output parameters.
|
Table 6 ANOVA for response surface quadratic model analysis of variance of partial sum of squares type III. |
RSM gives the mathematical relationship between the output
response and the independent variables are unknown [23].
T. Kim et al. [24-29] studied the response surface
methodology by employing it in steel. The second-order model was used in the
resistance spot welding process. The Box-Behnken design was adopted to
formulate a useful regression model. Optimum welding conditions
were determined by desirability approach. Among 17 experimental Runs, 8
Residues lie in the centre and almost all the residue lie in the trend line.
Two outliers present in the normal probability.
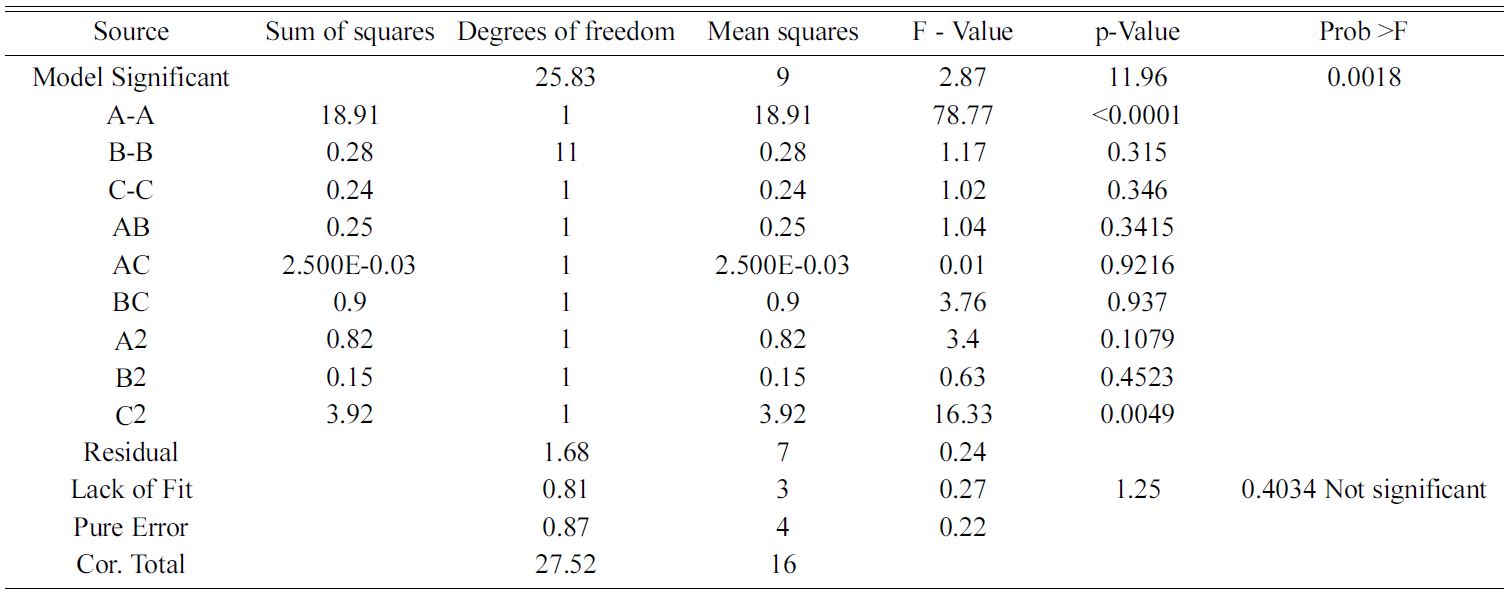
The Response surface of tensile shear fracture load was
obtained for the analysis of the interaction effects. Fig.
2(a), 2(b) and 2(c) show that, when there is an increase in factor A and B,
there will be an increase in 10.5 kN. Fig. 2(a), 2(b) and 2(c) also show that
the peak value is attained during higher A and higher B. At lower and higher
levels of A and C shows dip in the response, whereas in the middle level of A
and C, Steep increase of response as noticed. It is due to Peak Value as
attained in the highest level of A and middle level of C. In the middle level
of B and C, Maximum Response is obtained.
|
Fig. 2 Three dimensional plot for the resistance welding parameter with TSFL as response. |
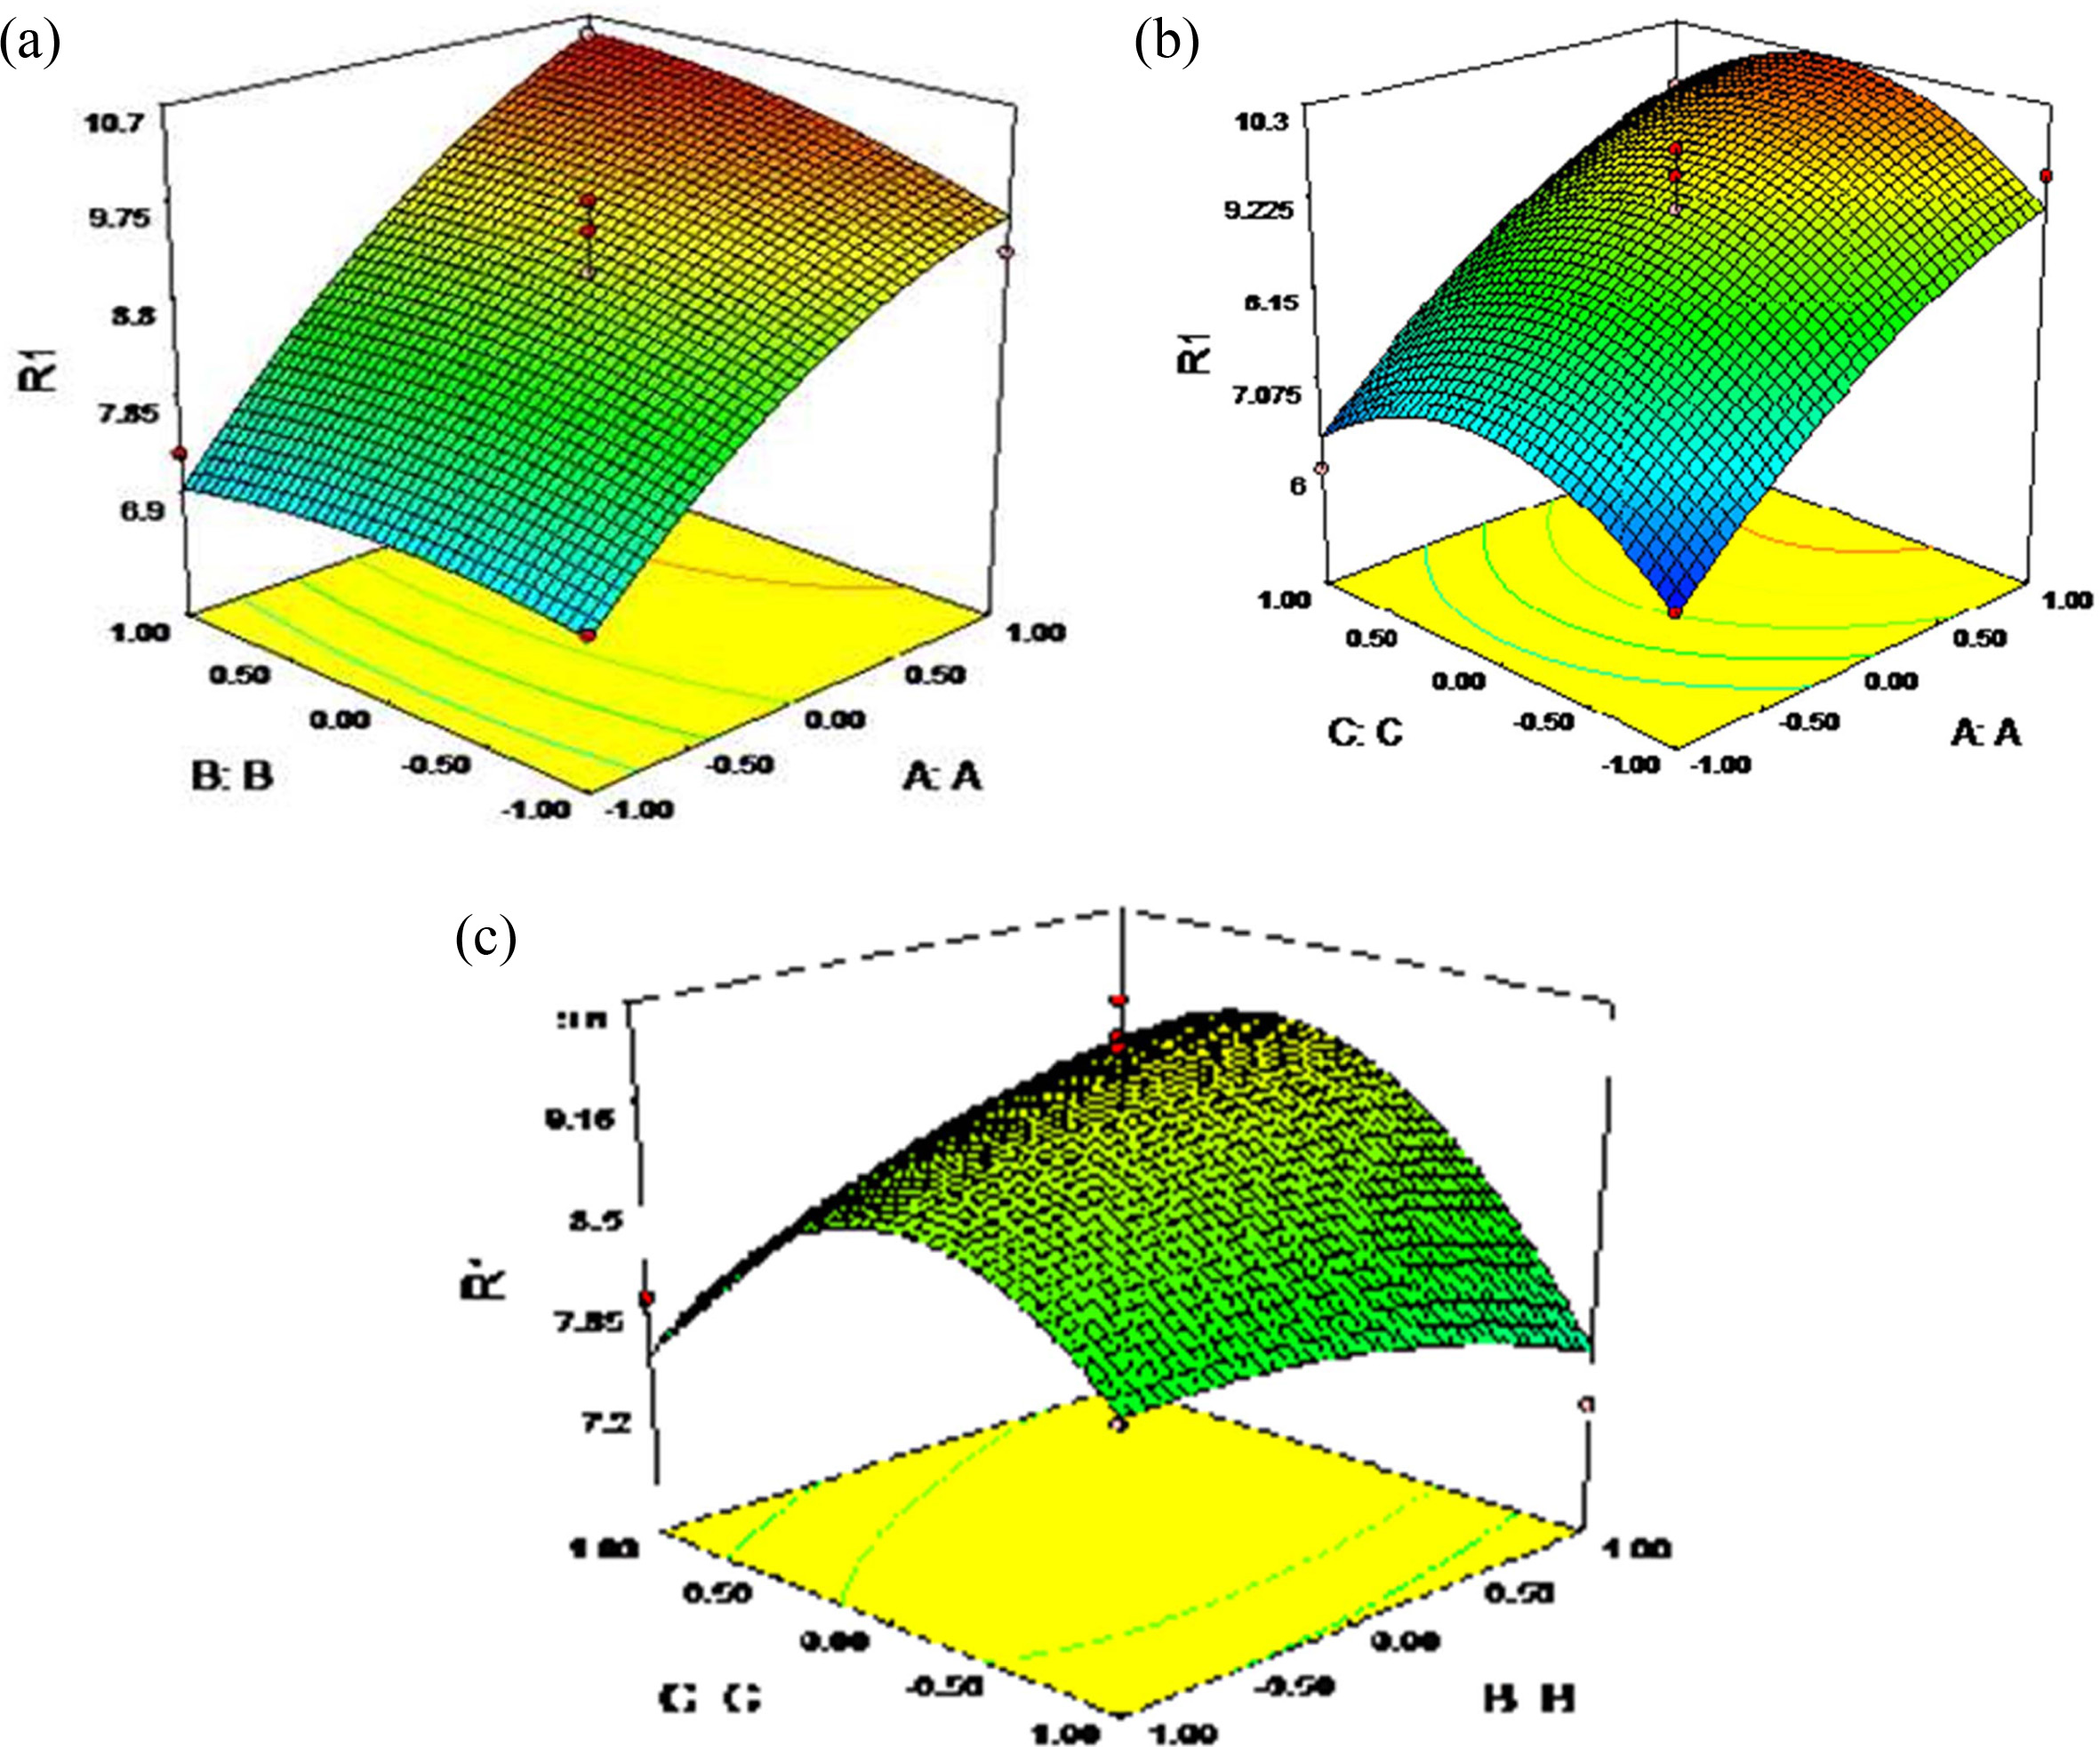
The interaction of hardness values is plotted in Fig.
3(a), (b) and (c). The similar results were obtained for the response plots for
hardness. After the regression model of shear tensile strength and hardness was
developed, the model adequacy examination was performed
in order to substantiate the regression analysis. Fig. 3(d) shows the standard
probability plot of the residual shows the proper sign and the experimental
values are very closer to the straight-line pattern. It is concluded that all
the data’s are normally distributed and the final response equation to predict
the tensile shear strength (R1) is depicted as follows in Eq. (2)
R1 (TSFL) = +9.18+1.54 * A+0.19 * B+0.18
* C+0.25 * A * B+0.025 * A * C+0.47
* B * C-0.44 * A2-0.19 * B2-0.96 * C2
(3)
Fig. 3(e) demonstrates the relationship between the
predicted and experimental values for shear, tensile strength which indicates
that both the results are very closer to the straight-line pattern.
|
Fig. 3 (a), (b) and (c) The distinct relation among hardness on pressure, power, time. (d) and (e) Normal plot for predicted and actual values. |
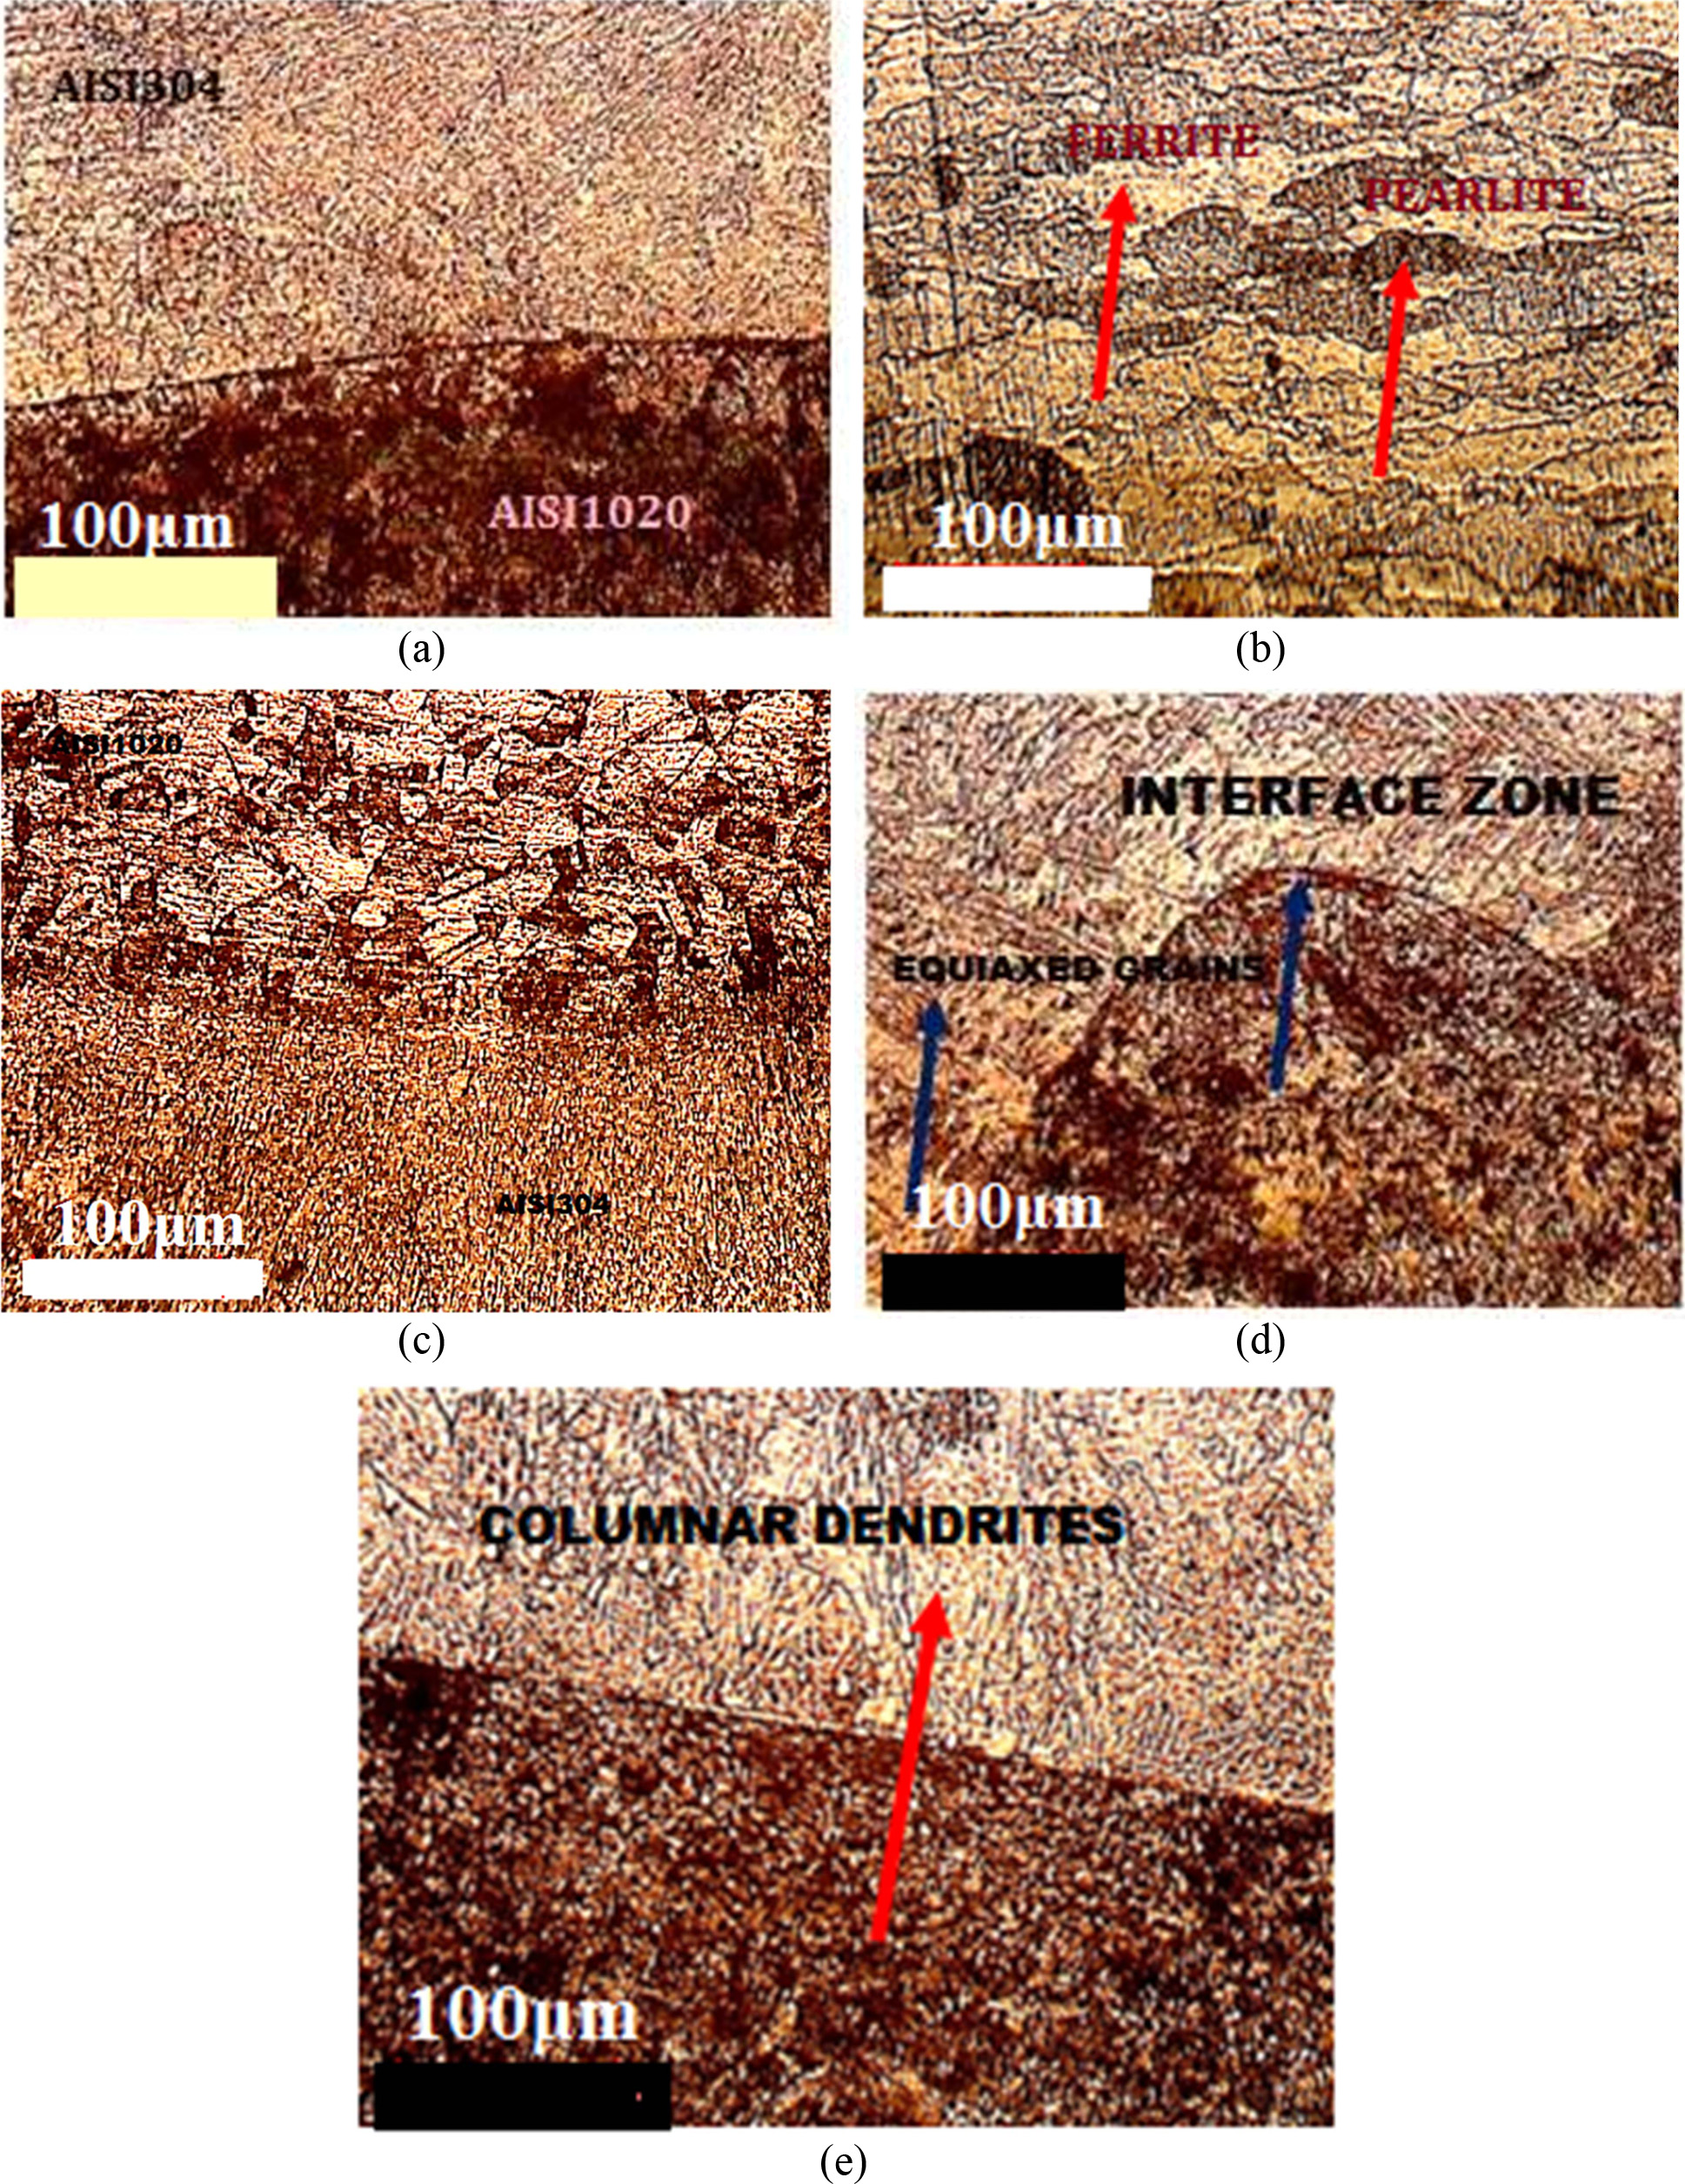
The interfacial zone of AISI 304 and AISI 1020 are shown
in Fig. 4(a), which reveals the fabricated
joints were highly inhomogeneous solidification mode. Fig. 4(b)
shows the interfacial zones of fabricated resistance-welded AISI
304 and AISI1020 materials. It can be observed that the zones consist of coarse
austenite and ferrite modes of solidification occurred. In addition to that
presence of high chromium content in AISI 304 promoted more ferrite content.
The substrate was marginally melted and re-solidified however unmixed where
higher ferrite was examined as shown in Fig. 4(c). The temperature on the
interface reached near to melting point attributed a formation of dendrite
ferrites on the interfacial zone. These dendrite ferrites were almost normal to
each weld interface as presented in Fig. 4(d) because the heat flow takes place
in the same direction in each welding pass. However, when moved to weld
centerline, the temperature gradient was fewer consequences
equiaxed dendrites into columnar dendrites. The visual
appearance of columnar dendrites at the centerline of the weld is as presented
in Fig. 4(e).The flow of elements of AISI 304 in the form of grains is
transferred.
|
Fig. 4 Scanning Electron Microscope images of resistance spot welded joints. |
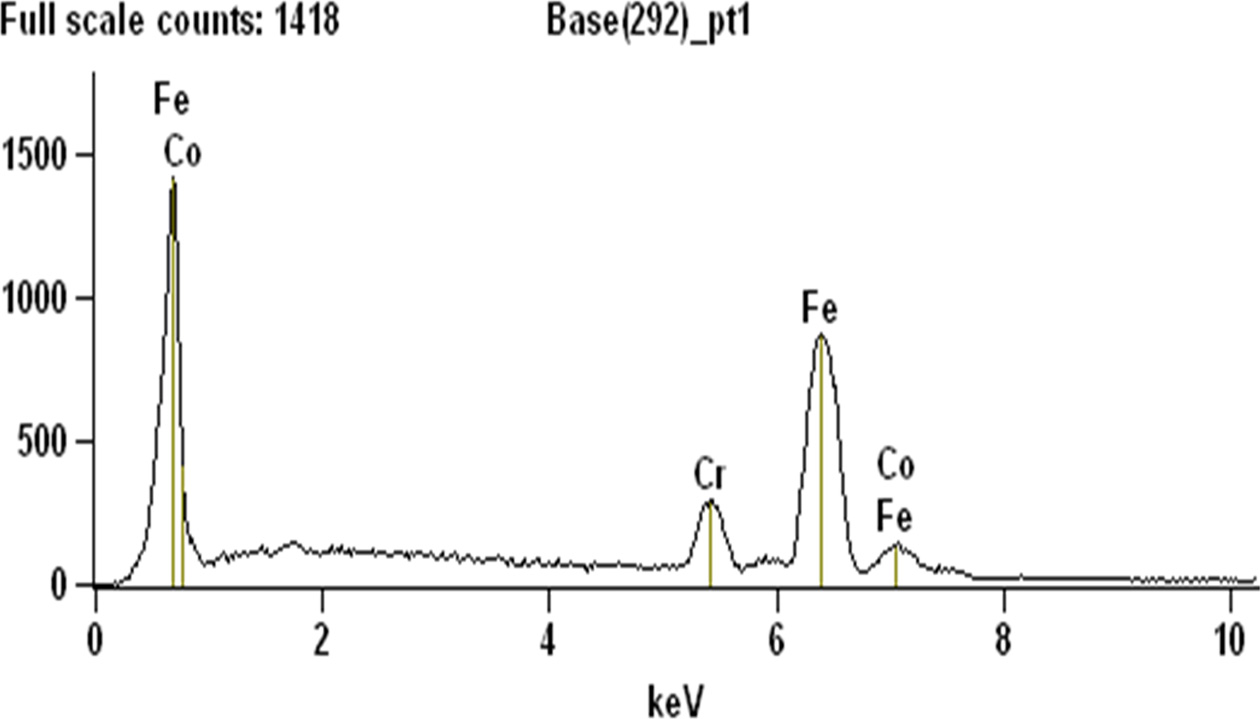
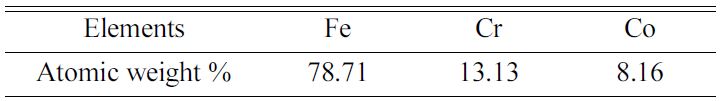
Fig. 5 shows the EDS graph which concluded that the mild
steel has highest scale counts and there is no rise in counts of mild steel
before 1 keV, but after the 1 keV there is a drastic change in the rise of
scale counts of AISI 304 elements. Also the presence of all elements which in
the form of the weight of all atoms present and net counts of all the atoms
present in the specimen [30]. Amount of atoms present in the
specimen after the spot welding also listed by the application of
EDX. The presence of chromium of about 13.13% and Fe content of 78.71% as shown
in Table 7.
|
Fig. 5 EDS plot for the spot welded sample. |
Based on the objective of this work RSW process was used
for welding of AISI 304/AISI 1020. From the Box-Behnken analysis was carried
out for ANOVA and RSM models were developed for identifying the
optimal parameter to study the most influencing parameter.
From this study, the following conclusions were drawn
accordingly.
The TSFL values recorded in different parameters such as
pressure, time and welding current. The highest values of TSFL is 10.5 kN and
the hardness of AISI 304-AISI 1020 combination is 543 VHN. The nugget diameter
and Tensile strength are proportional to weld time, pressure and current. With
the increase in heat input during welding, the shear -
tensile strength increases within the adequate weld range due
to the enlargement of nugget size.
From the RSM, it is identified that the nugget diameter and tensile strength are influenced by weld
current, followed by time and weld pressure.
The microstructural studies reveal that the welded joints
are in high in homogeneous solidification mode. The weld zone consists of
coarse austenite and ferrite mode, and similarly the presence of high chromium
content in AISI304 promotes the formation of ferrite content.
The chemical characterisation and elemental analysis of
certain samples were welded at optimum condition are executed by EDX analysis,
which shows that the presence of iron, chromium and cobalt in the spot-welded
joints.
- 1. H. Zhang, F. Wang, T. Xi, J.Zhao, L. Wang, and W. Gao, Mechanical System and Signal Processing.,62-63 (2015) 431-443.
-

- 2. P.De Tiedra, Ó. Martín, and M. López, Corrosion. Sci. 53 (2011) 2670-2675.
-
- 3. JanVinas, Lubos Kascak, and Miroslav Gres, De Gruyter Open. 6[1] (2016) 504-510.
-
- 4. M.Vural, A. Akkus, and B. Eryurek, Journal of Materials Processing Technology 176(2006) 127-132.
-
- 5. B.Bouyousfi, T. Sahraoui, S. Guessasma, and K.T. Chaouch, Materialsand Design 28 (2007) 414-419.
-
- 6. O.Martin, P.D. Tiedra, M. Lopez, M. San-Juan, C. Garcia, F. Martin, and Y.Blanco, Materials and Design 3 (2009) 68-77.
-
- 7. <!--[endif]-->H.-K.Yoon, B.-H. Min, C.-S. Lee, D.-H. Kim, Y.-K. Kim, and W.-J. Park, InternationalJournal of Modern Physics B. 20[25-27] (2006) 4297-4302.
-
- 8. N. Charde and R. Rajkumar, Journal of Engineering Scienceand Technology. 8 (2013) 69-76.
-
- 9. M.Ishak, L.H. Shah, I.S.R. Aisha, W. Hafizi, and M.R. Islam, Journal ofMechanical Engineering and Sciences 6 (2014) 793-806.
-
- 10. T.K. Mori, T.Masachika, E. Yamazaki, and Y. Watanabe, Journal of Material Processing andTechnology 143-144(2003) 242-248.
-
- 11. N.Kahraman, B. Gülenç, and H. Akça, Journal of the Faculty of Engineering andArchitecture of Gazi University 17 (2002) 75-85.
-
- 12. R.Shashanka and D. Chaira, Powder Technology 278 (2015) 35-45.
-
- 13. H.Ma, G. Qin, P. Geng, F. Li, B. Fu, and X. Meng, Materials & Design 86(2015) 587-597.
-
- 14. A.Fattah-Alhosseini and S. Vafaeian, Egyptian Journal of Petroleum.24 (2015) 333-341.
-
- 15. J.H. Kim, Y. Cho, and Y.H.Jang, Journal of Manufacturing Systems 32[3] (2013) 505-512.
-
- 16. D. Zhao, Y. Wang, S. Sheng,and Z. Lin, Measurement 46[6] (2013) 1957-1963.
-
- 17. S. Aslanlar, A. Ogur, U.Ozsarac, E. Ilhan, and Z. Demir, Materials & Design 28 (2007) 2-7.
-
- 18. L.P. Conner, WeldingHandbook, 8th edition, Vol. 1, P.16, American Welding SocietyMiami, FL, USA (1987).
- 19. A SM Handbook, Welding Brazing and Soldering, Vol.6, P.2062, ASMInternational, Materials Park, OH, USA (1993).
- 20. A.M. Pereira, J.M. Ferreira,A. Loureiro, J.D.M. Costa, and P.J. Bártolo, Materials and Design 31 (2010)2454-2463.
-
- 21. M. Hessamoddin and S.F. Iradj.Journal of Material Processing Technology 212 (2012) 347-354.
-
- 22. Z. Hongqiang, Q. Xiaoming, B.Yang, X. Fei, Y. Haiyan, and S. Yanan, Materials & Design 63 (2014)151-158.
-
- 23. G.Karthikeyan and G.R. Jinu, Transactions of the Canadian Society for MechanicalEngineering 40[3] (2016) 351-369.
-
- 24. K.Danial, M. Amir, and A.A. Ahmad, Materials & Design 61 (2014) 251-263.
-
- 25. T. Kim, H. Park, and S.Rhee, International Journal of ProductionResearch 43[21] (2005) 4643-4657.
-
- 26. A. Şenaras,in “Sustainable Engineering Products and Manufacturing Technologies” (AcademicPress is an imprint of Elsevier, 2019) p.187-197.
-
- 27. S.K. Beheraa, H. Meenaa, S. Chakrabortya, and B.C. Meikapab, International Journal of Mining Scienceand Technology 28 (2018) 621-629.
-
- 28. YongWang, Layun Deng, and Youhua Fan, Advances in Materials Science and Engineering2018 (2018) 1-8.
-
- 29. Shuo Deng, Yinguang Chen,Water Sci Technology, 79[1] (2019) 188-197.
-
- 30. G. Karthikeyan, G.R. Jinu, and P. Vijayalakshmi, Matéria (Rio de Janeiro) 22[3] (2017) 1-12.
-
 This Article
-
2020; 21(1): 26-34
Published on Feb 28, 2020
- 10.36410/jcpr.2020.21.1.26
- Received on Jul 12, 2019
- Revised on Nov 5, 2019
- Accepted on Dec 9, 2019
Services
- Abstract
introduction
experimental procedure
result and discussions
microstructural studies
conclusions
- References
- Full Text PDF
Shared
Correspondence to
- Jinu GowthamiThankachi Raghuvaran
-
Assistant Professor, Department of Mechanical Engineering, University College of Engineering, Nagercoil, Konam, Tamil Nadu
Tel : +919443994330 Fax: 04652-260510 - E-mail: grjinu1980@gmail.com
Clean-Energy Research Institute(CRI), Hanyang University, 222, Wangsimni-ro, Seongdong-gu, Seoul, 04763, Korea
E-mail: jcpr@hanyang.ac.kr