


- Preparation of lead-free piezoelectric (K0.5Na0.5)NbO3 nanopowder by a simple aqueous route
John G. Fishera,*, Kwi-Hak Leea and Won-Jin Moonb
aSchool of Materials Science and Engineering, Chonnam National University, Gwangju 61186, Korea
bKorea Basic Science Institute, Gwangju Center, Gwangju 61186, Korea
(K0.5Na0.5)NbO3-based
ceramic powders for lead-free piezoelectric applications are usually prepared
by solid state synthesis. This generally involves wet ball milling in an
organic liquid such as ethanol, which is a drawback for industrial production.
In the present work, a method for the preparation of NaNbO3
nanopowders is modified to produce a simple method of preparing (K0.5Na0.5)NbO3
nanopowders by an aqueous route. K2CO3, Na2CO3
and NH4[NbO(C2O4)2].xH2O
are mixed in water and dried to form a gel, which is then calcined at
temperatures between 400 ~ 650 °C for 1 h. The uncalcined gel
and calcination products are analysed using Thermogravimetric
Analysis/Differential Thermal Analysis, X-ray Diffraction, Fourier Transform
Infrared Spectroscopy, Scanning Electron Microscopy, Transmission Electron
Microscopy and Raman Scattering. A single phase tetragonal (K0.5Na0.5)NbO3
nanopowder with a particle size of ~ 30 nm can be produced after
calcination at 650 °C for 1 h.
Keywords: lead-free piezoelectric, (K0.5Na0.5)NbO3, nanopowder, microstructure
Materials based on (K0.5Na0.5)NbO3
(KNN) are leading contenders to replace lead-based piezoelectric
ceramics such as Pb(Zr,Ti)O3 and Pb(Mn1/3Nb2/3)O3-PbTiO3
[1-7]. KNN-based powders are most commonly prepared by solid-state
synthesis, in which alkali carbonates and Nb2O5 are mixed
together by wet ball milling, followed by calcination at temperatures of
750 ~ 950 °C [3, 8-10]. Due to the hygroscopic and water-soluble
nature of K2CO3 and Na2CO3, ethanol
or acetone are usually used as the milling liquid [11, 12]. While use of
organic solvents is acceptable in the laboratory, the use of organic solvents
on an industrial scale increases production costs, as the solvents must be
handled, recycled or disposed of according to local health and safety and
environmental regulations [12]. In addition, KNN powders prepared by
solid-state synthesis can suffer from chemical inhomogeneity which can cause
variations in the electrical properties [10, 13, 14].
As
a result, numerous studies have been carried out on the production of KNN
powders by water-based methods such as the
Pechini method, sol-gel combustion method,
hydrothermal method, mechanochemical activation
and spray-drying [15-31]. Besides avoiding the use of organic solvents, these processes have potential advantages such as lower synthesis or calcination
temperatures, reduced powder size, narrow particle size distribution, improved
chemical homogeneity and the possibility
of forming nanostructures of different shapes such as nanowires, nanorods,
nanocubes and microfingers.
The methods mentioned above can prepare KNN powders but
often require specialized equipment or use complex chemical processes or
corrosive chemicals. A simpler method which uses easily-handled chemicals would
be beneficial. Su et al. described the synthesis of NaNbO3
powders by simply mixing Na2CO3 and ammonium niobium
oxalate, NH4[NbO(C2O4)2(H2O)2] (H2O)3, in water to
form a slurry, followed by drying and calcination at different temperatures
[32]. A single phase NaNbO3 nanopowder could be formed at a calcination
temperature as low as 400 °C. In the present work,
their method is modified to produce nanopowders of (K0.5Na0.5)NbO3.
K2CO3 (Alfa Aesar, 99%), Na2CO3
(Acros Organics, 99.5%) and ammonium niobium oxalate NH4[NbO (C2O4)2].xH2O
(Aldrich, 99.99%) were used as starting materials. The mass% of Nb2O5 in the NH4[NbO(C2O4)2]. xH2O powder was determined by
Thermogravimetric Analysis/Differential
Thermal Analysis (TG/DTA, DTG-60,
Shimadzu, Kyoto, Japan). The K2CO3 and Na2CO3
powders were dried at 250 °C for 2 h before weighing to remove adsorbed
water. The NH4[NbO(C2O4)2]· xH2O powder was not dried.
Stoichiometric amounts of the starting materials (enough to make
5 g of (K0.5Na0.5)NbO3
powder) were weighed and dissolved in 100 ml of deionized water. The solution
was stirred using a digital hotplate/magnetic stirrer (MaXtir 500, Daihan,
Wonju, Korea) at a temperature of 65 °C and a rotation speed of 250 rpm
for 1 h. The solution temperature was controlled using a temperature probe
inserted in the solution. The temperature was then increased to 95 °C and
the solution evaporated until ~25 vol% remained. The remaining solution
was heated at 200 °C for 3 h. The solution transformed into a white porous
gel. After cooling, the gel was crushed into powder in an agate mortar and
pestle.
Thermogravimetric Analysis/Differential Thermal Analysis
(TG/DTA, DTG-60, Shimadzu, Kyoto, Japan) was carried
out on the NH4[NbO(C2O4)2]·xH2O
powder and gel powder in the temperature range
25 ~ 1000 °C in air at a heating rate of 10 °C·min-1.
Samples of gel powder were calcined at temperatures of 400, 450, 500, 550, 600
and 650 °C for 1 h in air with heating and cooling rates of 5 °C·min-1.
X-ray Diffraction (XRD) was carried out on uncalcined and calcined samples with
Cu Kα radiation (XRD XPert PRO, PANalytical, The
Netherlands) with 2θ range = 20° ~ 80°, scan speed =
3°·min-1
and 0.02° step size. Fourier Transform Infrared
spectroscopy was carried out on the starting materials, uncalcined gel powder
and calcined samples (FTIR, Spectrum 400, Perkin Elmer, Waltham, MA). Powder
samples were mixed with KBr and pressed into pellets. Scanning Electron
Microscopy (SEM, Hitachi S-4700, Tokyo, Japan) was carried out on uncalcined
and calcined samples. Raman scattering (LabRam HR800 UV Raman microscope,
Horiba Jobin-Yvon, France), with a 515 nm diode laser and output power of 10
mW, was carried out on a powder sample calcined at 650 °C for 1 h. Spectra
were recorded in back scattering geometry over a range of 50 ~ 1,000
cm-1
with a resolution of ~ 0.5 cm-1.
In order to study the
structure in more detail, XRD (D8 Advance, Bruker, Billerica, MA) with Cu Kα
radiation, 2θ range = 20° - 80°, scan speed = 0.3°·min-1 and 0.0062° step size was carried out on a powder
sample calcined at 650 °C for 1 h. A powder sample calcined at 650 °C
for 1 h was also studied using Transmission Electron Microscopy (TEM, FEI TECNAI F 20, FEI Company,
Hillsboro, OR) operated at an accelerating voltage of 200 kV.
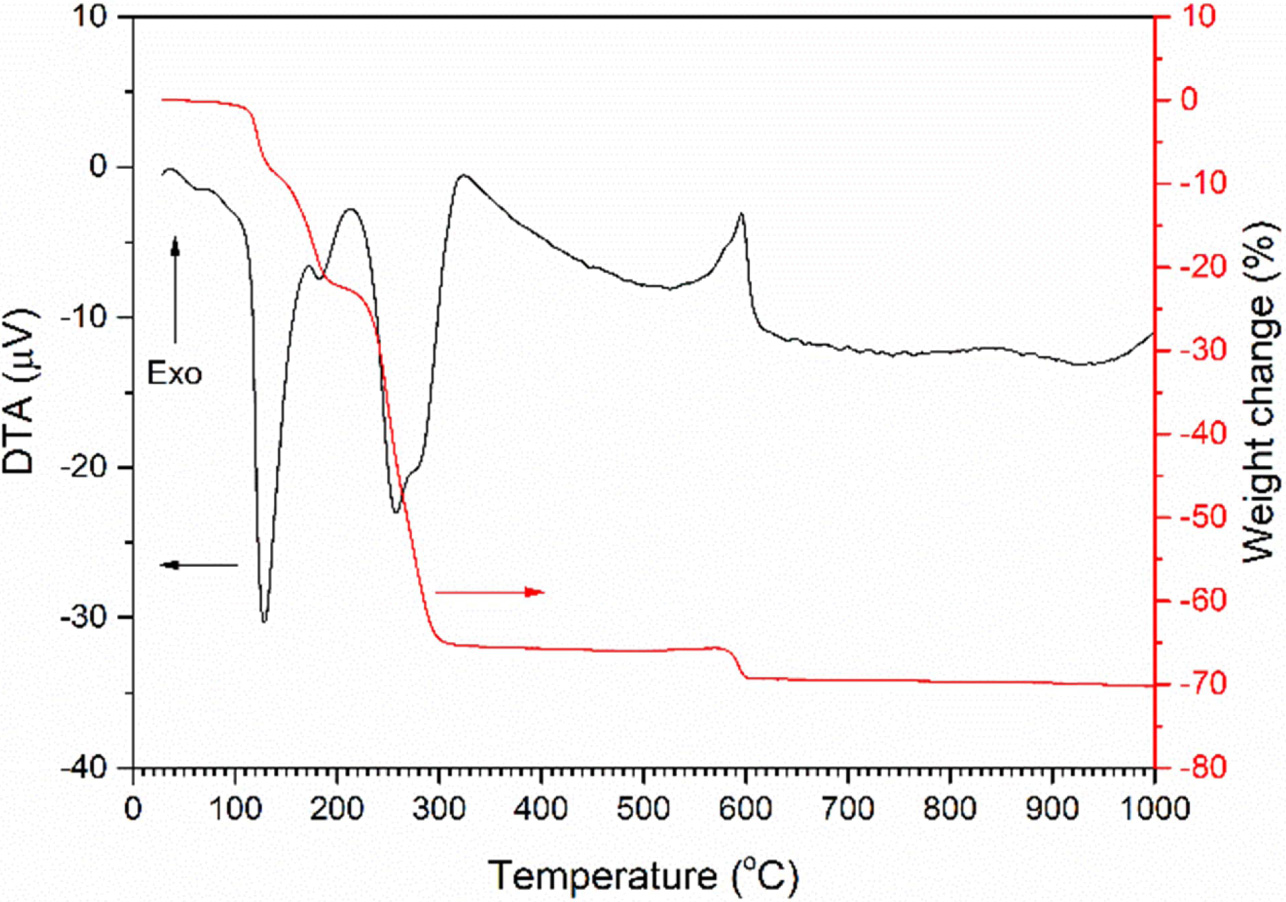
A TG/DTA trace of the precursor NH4[NbO(C2O4)2]·xH2O powder is shown in Fig. 1. The DTA
trace contains endothermic peaks at
129 °C, 183 °C and 258 °C (with a shoulder at 275 °C), and
an exothermic peak at 596 °C (with a shoulder at 579 °C). The peak at
129 °C corresponds to the loss of water of hydration and is accompanied by
a loss in weight of ~ 10%. The endothermic peaks at 183 °C and
258 °C correspond to the release
of NH3 and the decomposition of the organic material
in NH4[NbO(C2O4)2]·xH2O
as it transforms to amorphous niobic acid Nb2O5·nH2O
[32-35]. These peaks are accompanied
by a weight loss of ~ 55%. The exothermic peak at 596 °C corresponds
to the crystallisation of amorphous niobic acid into a hexagonal or
orthorhombic phase [33, 34, 36, 37]. The small accompanying weight loss of
~ 4% may be due to the release of CO2 caused by oxidation of
residual carbon [33]. A total weight
loss of 70.3% was measured between
25 ~ 1,000 °C.
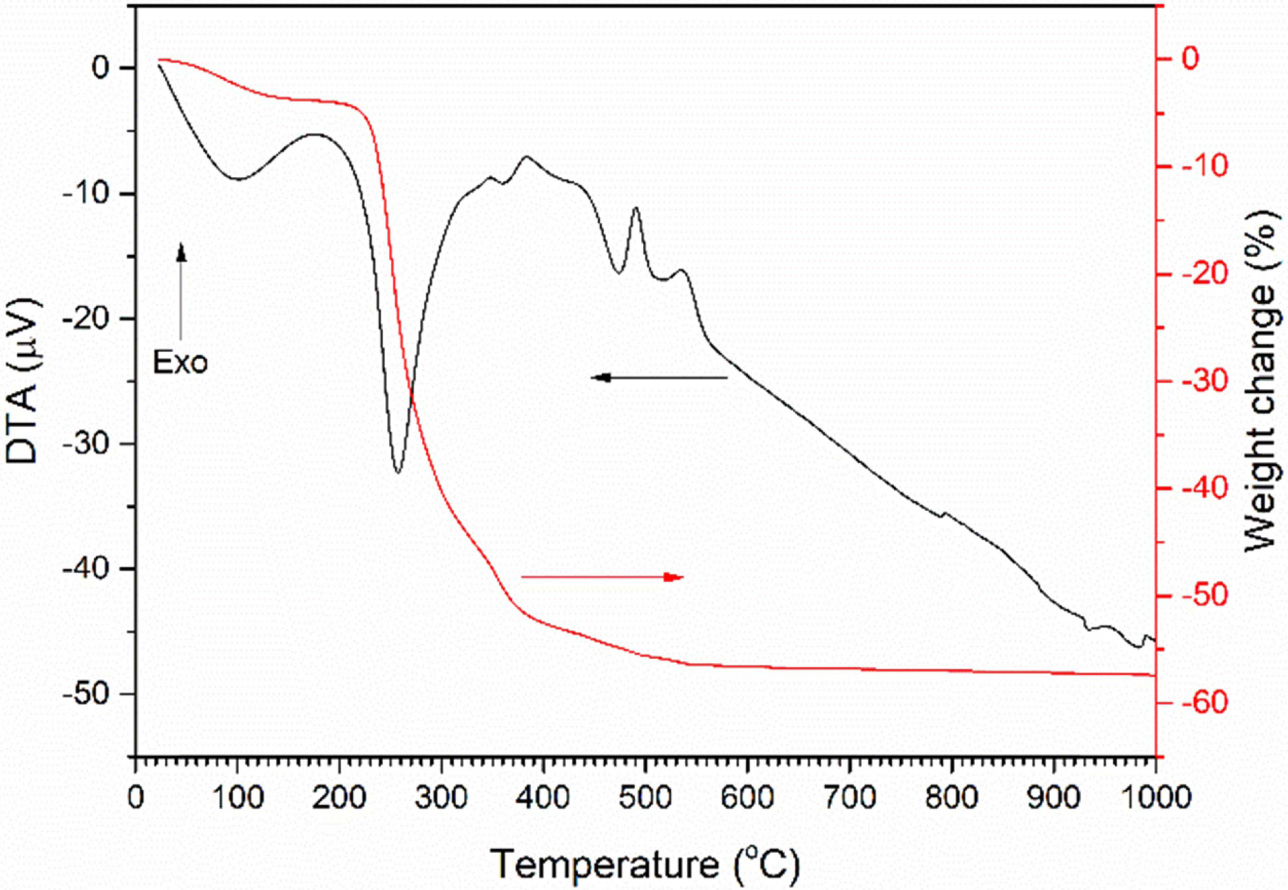
A TG/DTA trace of the uncalcined gel is shown in Fig. 2.
The sample has a broad endothermic peak at 100 °C, accompanied by a weight
loss of ~ 3.8% which corresponds to the loss of water of hydration. A
large endothermic peak at 257 °C followed by a smaller peak at 361 °C
corresponds to the decomposition of the gel into K2CO3,
Na2CO3 and Nb2O5·nH2O
[27, 32]. These peaks are accompanied by a weight loss of ~ 47.8%.
Exothermic peaks at 490 °C and 535 °C correspond to the decomposition
of the K2CO3 and Na2CO3 and the
reaction to form (K0.5Na0.5)NbO3 [27, 38, 39].
These peaks are accompanied by a weight loss of ~ 2.5%. A further
small weight loss may be due to the decomposition of unreacted
K2CO3 and Na2CO3. Total weight loss
is 57.3%.
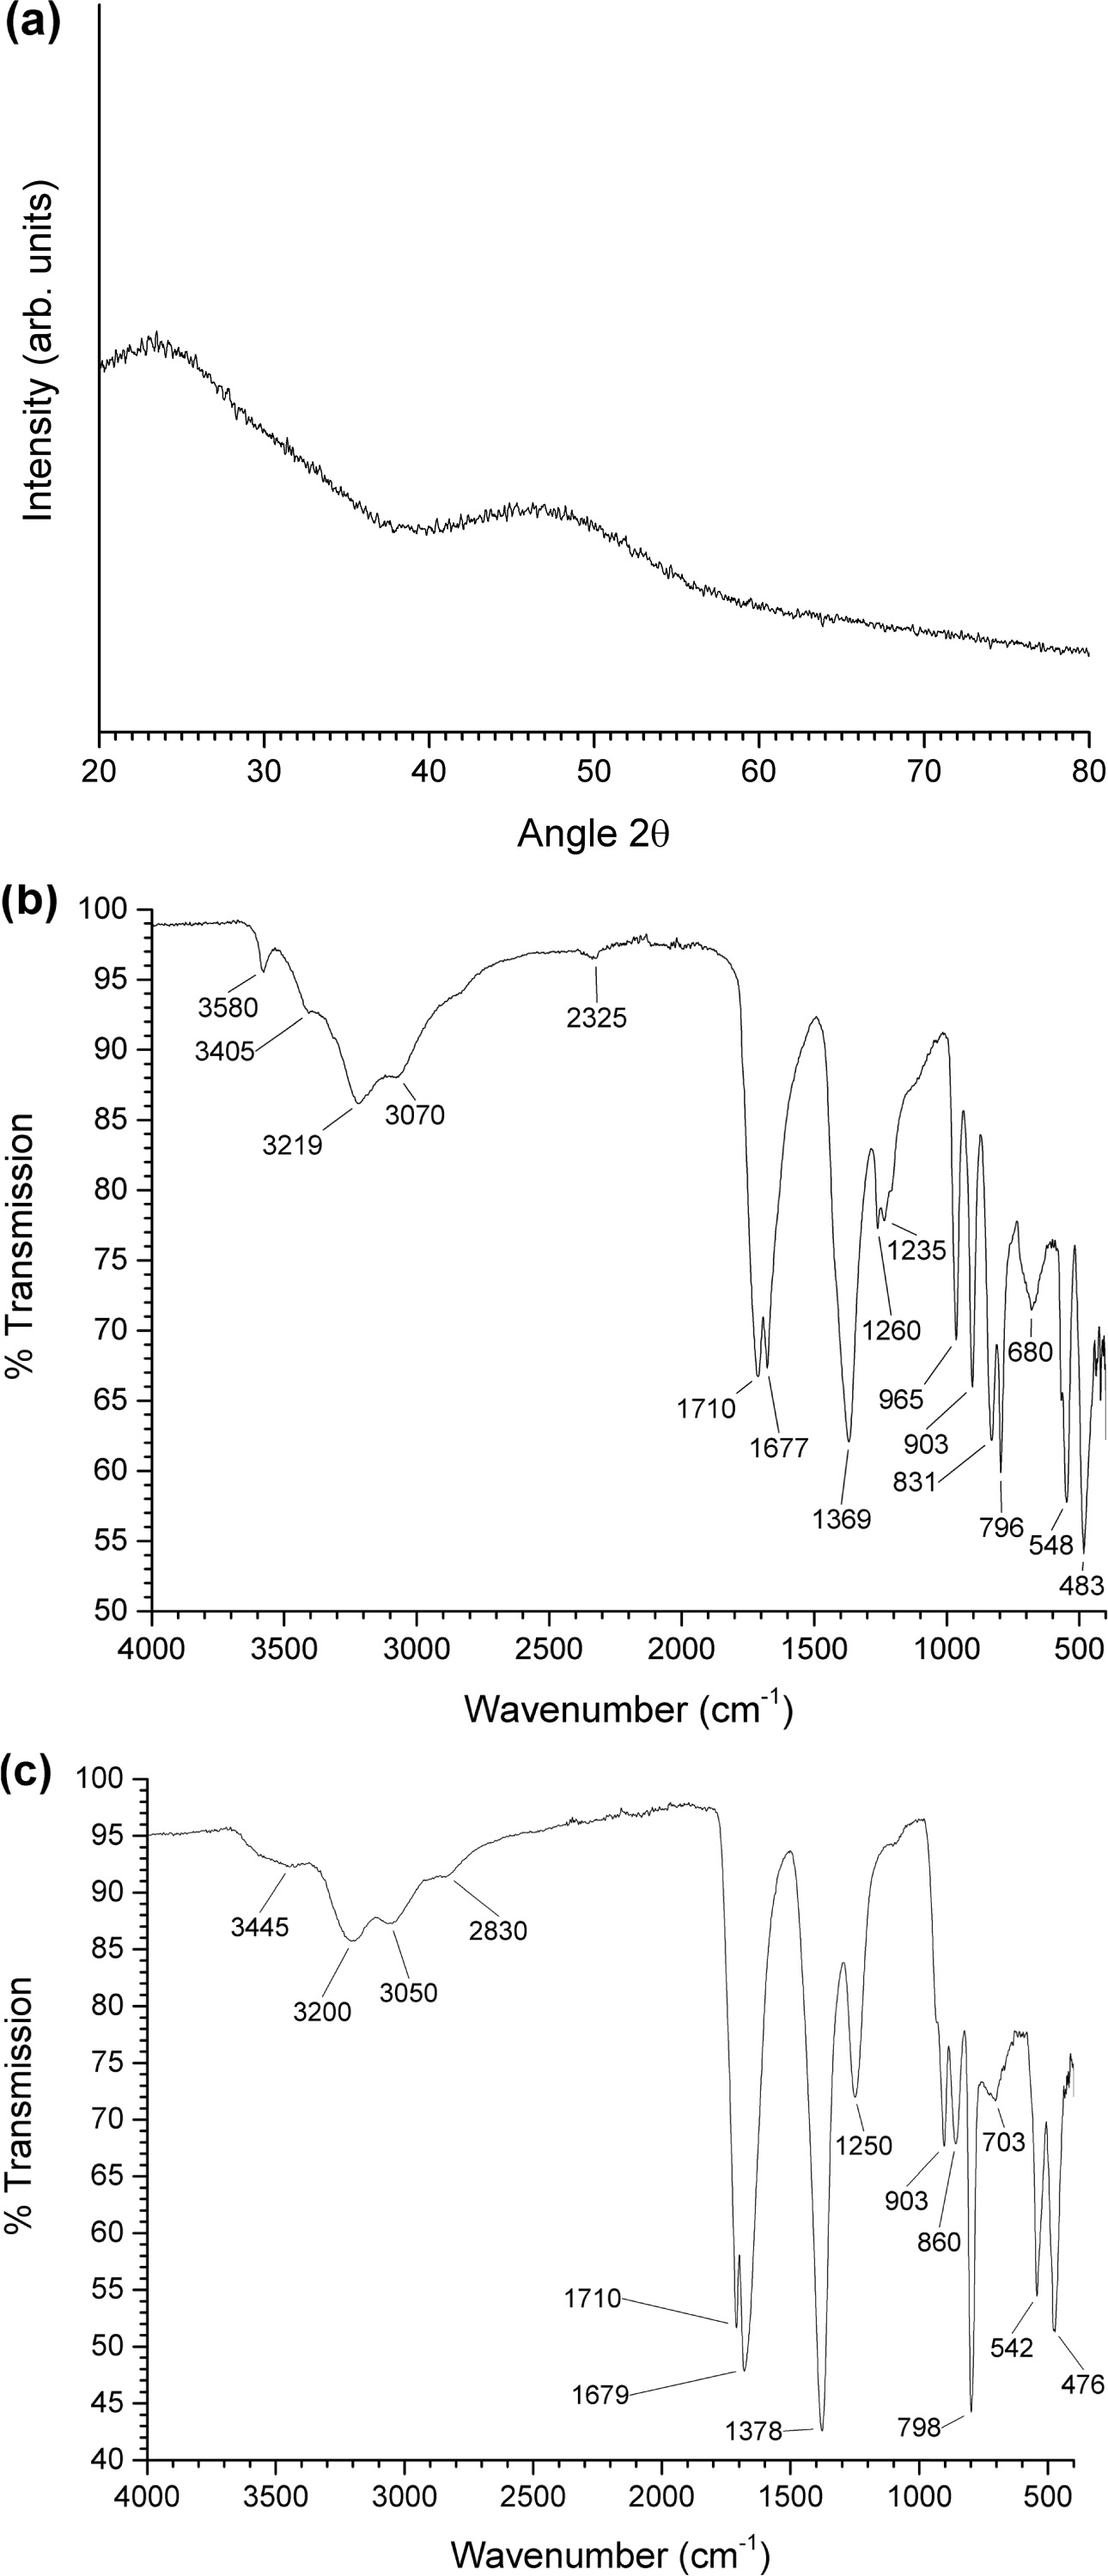
Fig. 3(a) shows an XRD pattern of the uncalcined gel. The
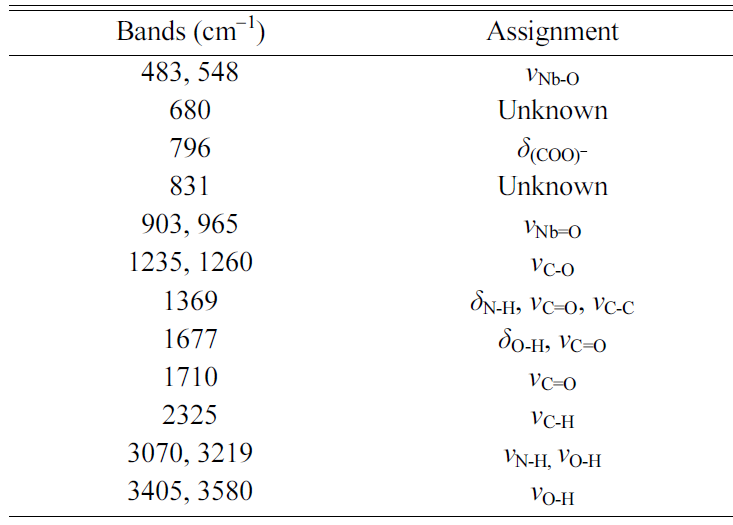
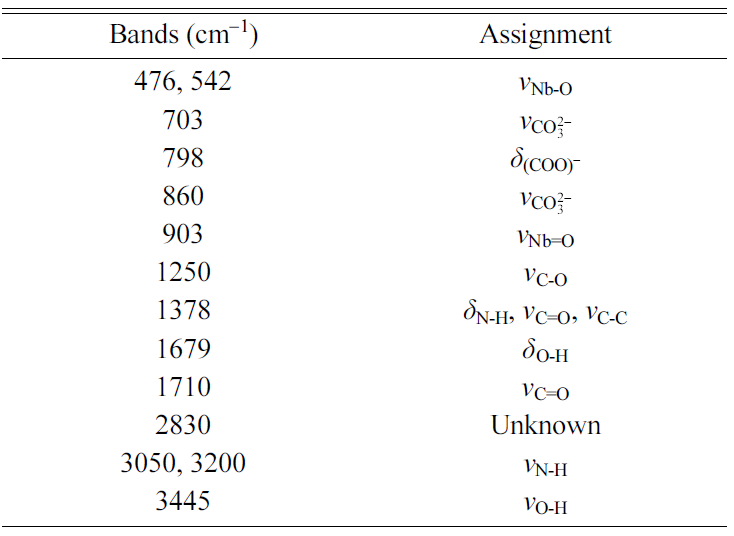
gel has an amorphous structure. An FTIR spectrum of the precursor NH4[NbO(C2O4)2].xH2O
powder is shown in Fig. 3(b). The main infrared bands are summarized in Table 1 [33, 34, 40]. An FTIR spectrum of the
uncalcined gel is shown in Fig. 3(c). The main infrared bands are summarized in
Table 2 [33, 34, 41]. Shifts in the peak positions and the absence
of the main K2CO3 and Na2CO3 peaks
at 1,450 cm-1
indicate that NH4[NbO(C2O4)2]·xH2O
has reacted with K2CO3 and Na2CO3
to form a gel [41]. However, the appearance of new peaks at 1,259 and 907 cm-1 due
to the ligand exchange reaction between H2O and NH3 was
not observed [32]. In addition to the bands from NH4[NbO(C2O4)2].xH2O,
bands from the carbonate groups of K2CO3 and Na2CO3
are present at 703 and 860 cm-1,
indicating that not all of the K2CO3 and Na2CO3
has reacted with the NH4[NbO(C2O4)2].xH2O.
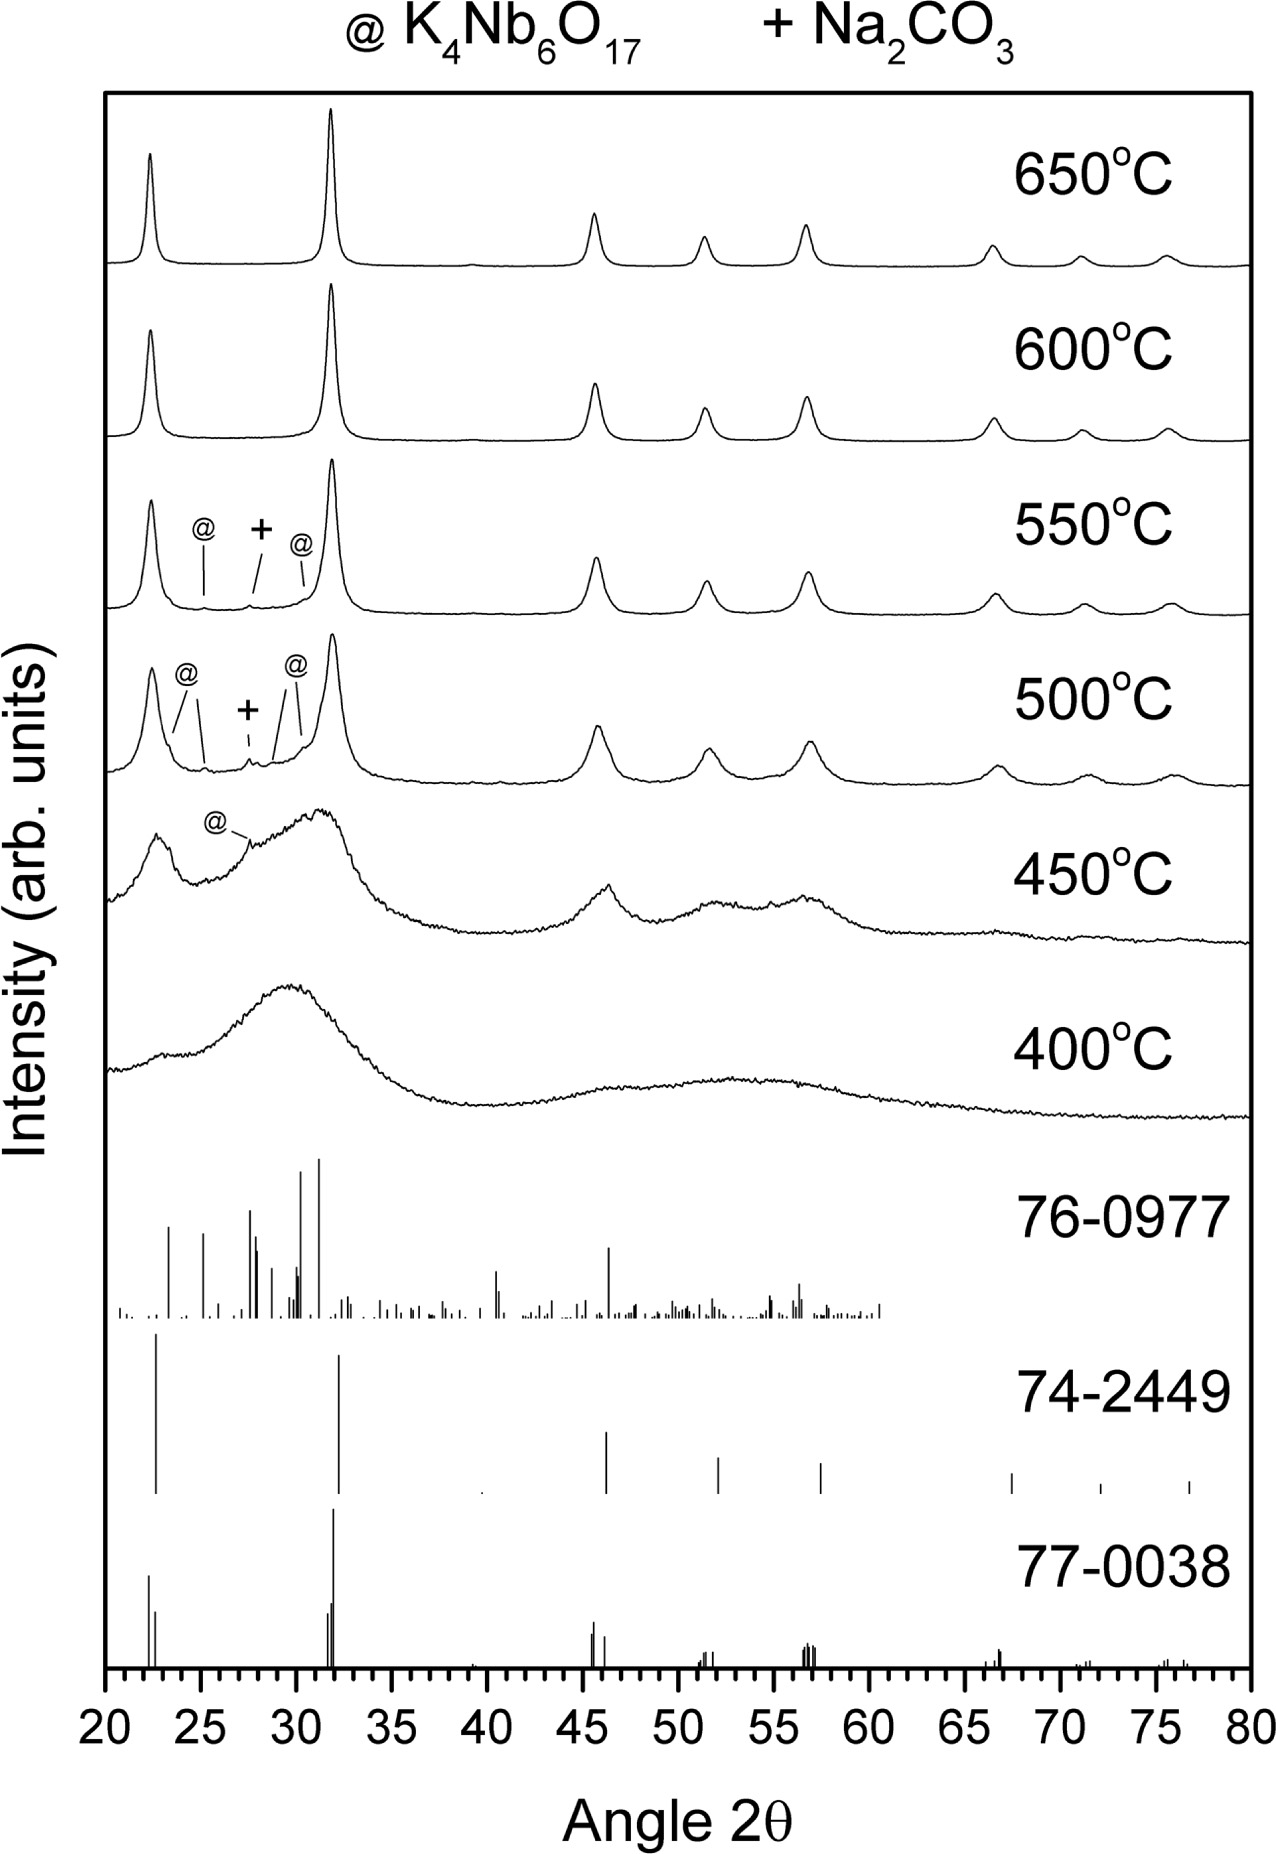
XRD patterns of the gel calcined at temperatures between
400 ~ 650 °C for 1 h are shown in Fig. 4. Also included are the patterns for ICDD card #77-0038
[(Na0.35K0.65)NbO3, monoclinic, space group
Pm(6)], ICDD card # 74-2449 [NaNbO3, monoclinic, space group
P2/m(10)] and ICDD card #76-0977 [K4Nb6O17, orthorhombic, space group P21nb(33)]. After
calcination at 400 °C, the
sample appears to be still amorphous. As the calcination temperature increases
to 450 °C, very broad peaks
corresponding to (K0.5Na0.5)NbO3, NaNbO3 and K4Nb6O17
form. As the calcination temperature increases
from 450 to 500 °C, the peaks become narrower and better defined. The
peaks corresponding to NaNbO3 shift to smaller values of 2θ and merge with the peaks corresponding to
(K0.5Na0.5)NbO3. As the calcination temperature increases from 450 °C, the peaks
correspond- ing to K4Nb6O17
gradually decrease in intensity, finally disappearing at 600 °C. Some unreacted
Na2CO3 is also present in the samples calcined at
500 °C and 550 °C (ICDD card # 86-0309).
The crystallite size of the sample calcined at 650 °C
for 1 h was estimated using Scherrer’s formula: (1)
(1)
where τ = crystallite size, λ
= X-ray wavelength (0.154184 nm for Cu Kα), β = FWHM (in radians)
and θ = Bragg angle. Using the (200) peak with θ = 11.16°, the
crystallite size was estimated to be 20 nm.
FTIR spectra of the gel calcined at temperatures between
400 °C - 650 °C for 1 h are shown in Fig. 5. FTIR spectra of the K2CO3
and Na2CO3 precursor powders are also included. A
comparison of the spectra of the uncalcined gel and the sample
calcined at 400 °C clearly show that the gel has decomposed.
The peaks at 520 and 850 cm-1
in the sample calcined at 400 °C are due to Nb-O vibrations [33, 42].
The peak at 1,330 cm-1
in the sample calcined at 400 °C may belong to a CH3 bending
mode [16] or to an oxalate group such as Na2C2O4
or K2C2O4 [43, 44]. It should be noted that the
gel calcined at 400 °C contains partially decomposed
organic material and is black in colour. The peaks at 1,330 cm-1,
1,540 cm-1
and 1,590 cm-1
may also belong to a carbonato complex [45, 46]. The band at 1,055 cm-1 may correspond to a
C-OH stretching vibration or to the ν1
vibration of the carbonate ion [16, 45, 47]. The ν1 vibration
is usually infrared inactive, but becomes active when the coordination symmetry
of the carbonate ion is lowered i.e. the crystal structure of the carbonate is
degraded. These peaks therefore indicate the decomposition of the gel and the
formation of alkali carbonates. As
the calcination temperature increases to
500 °C, these peaks change position and gradually disappear, while peaks
associated with Na2CO3 (1,455 cm-1)
and K2CO3 (1,455 cm-1,
1,365 cm-1,
1,630 cm-1) appear.
These peaks belong to unreacted alkali carbonates. As the
calcination temperature increases further, the peaks associated with the alkali
carbonates also decrease, finally
disappearing in the sample calcined at 650 °C. The colour of the calcined
samples also becomes lighter with calcination temperature, finally becoming
white at 650 °C. Changes in the position and width of the peaks at 520 and 850 cm-1
as the calcination temperature increases indicate the formation of (K0.5Na0.5)NbO3.
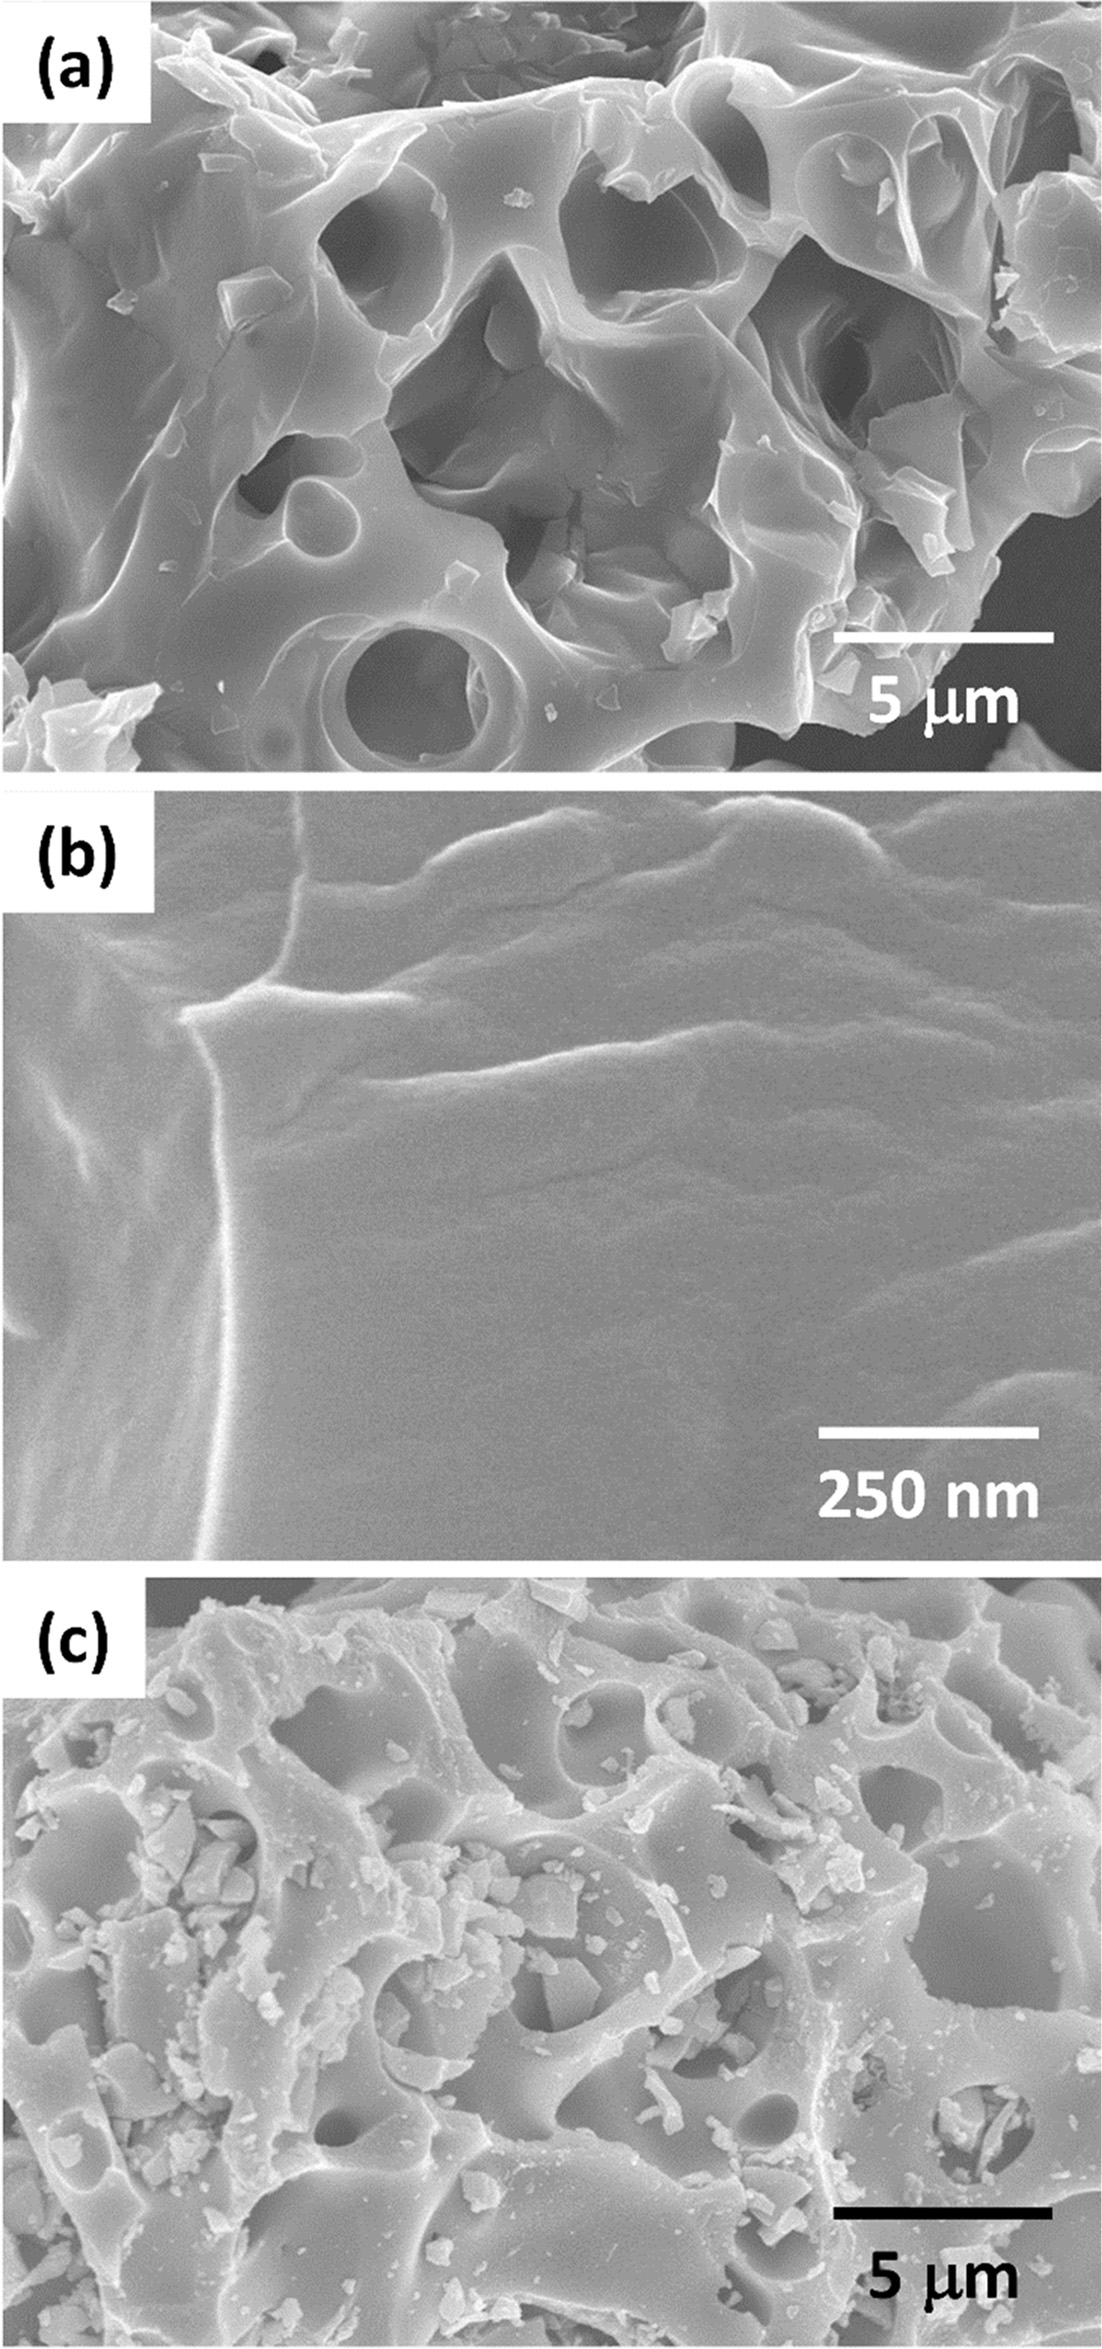
An SEM micrograph of the uncalcined gel is shown in
Fig. 6(a). The gel has a honeycomb appearance, which may
be caused by the release of NH3 and CO2 during the ion
exchange reaction between the starting materials. A micrograph taken at higher
magnification shows that the gel appears to lack any polycrystalline structure
[Fig. 6(b)]. An SEM micrograph of the gel
after calcination at 650 °C for 1 h shows that the calcined gel maintains
the honeycomb structure [Fig. 6(c)]. The
samples calcined at lower temperatures look similar.
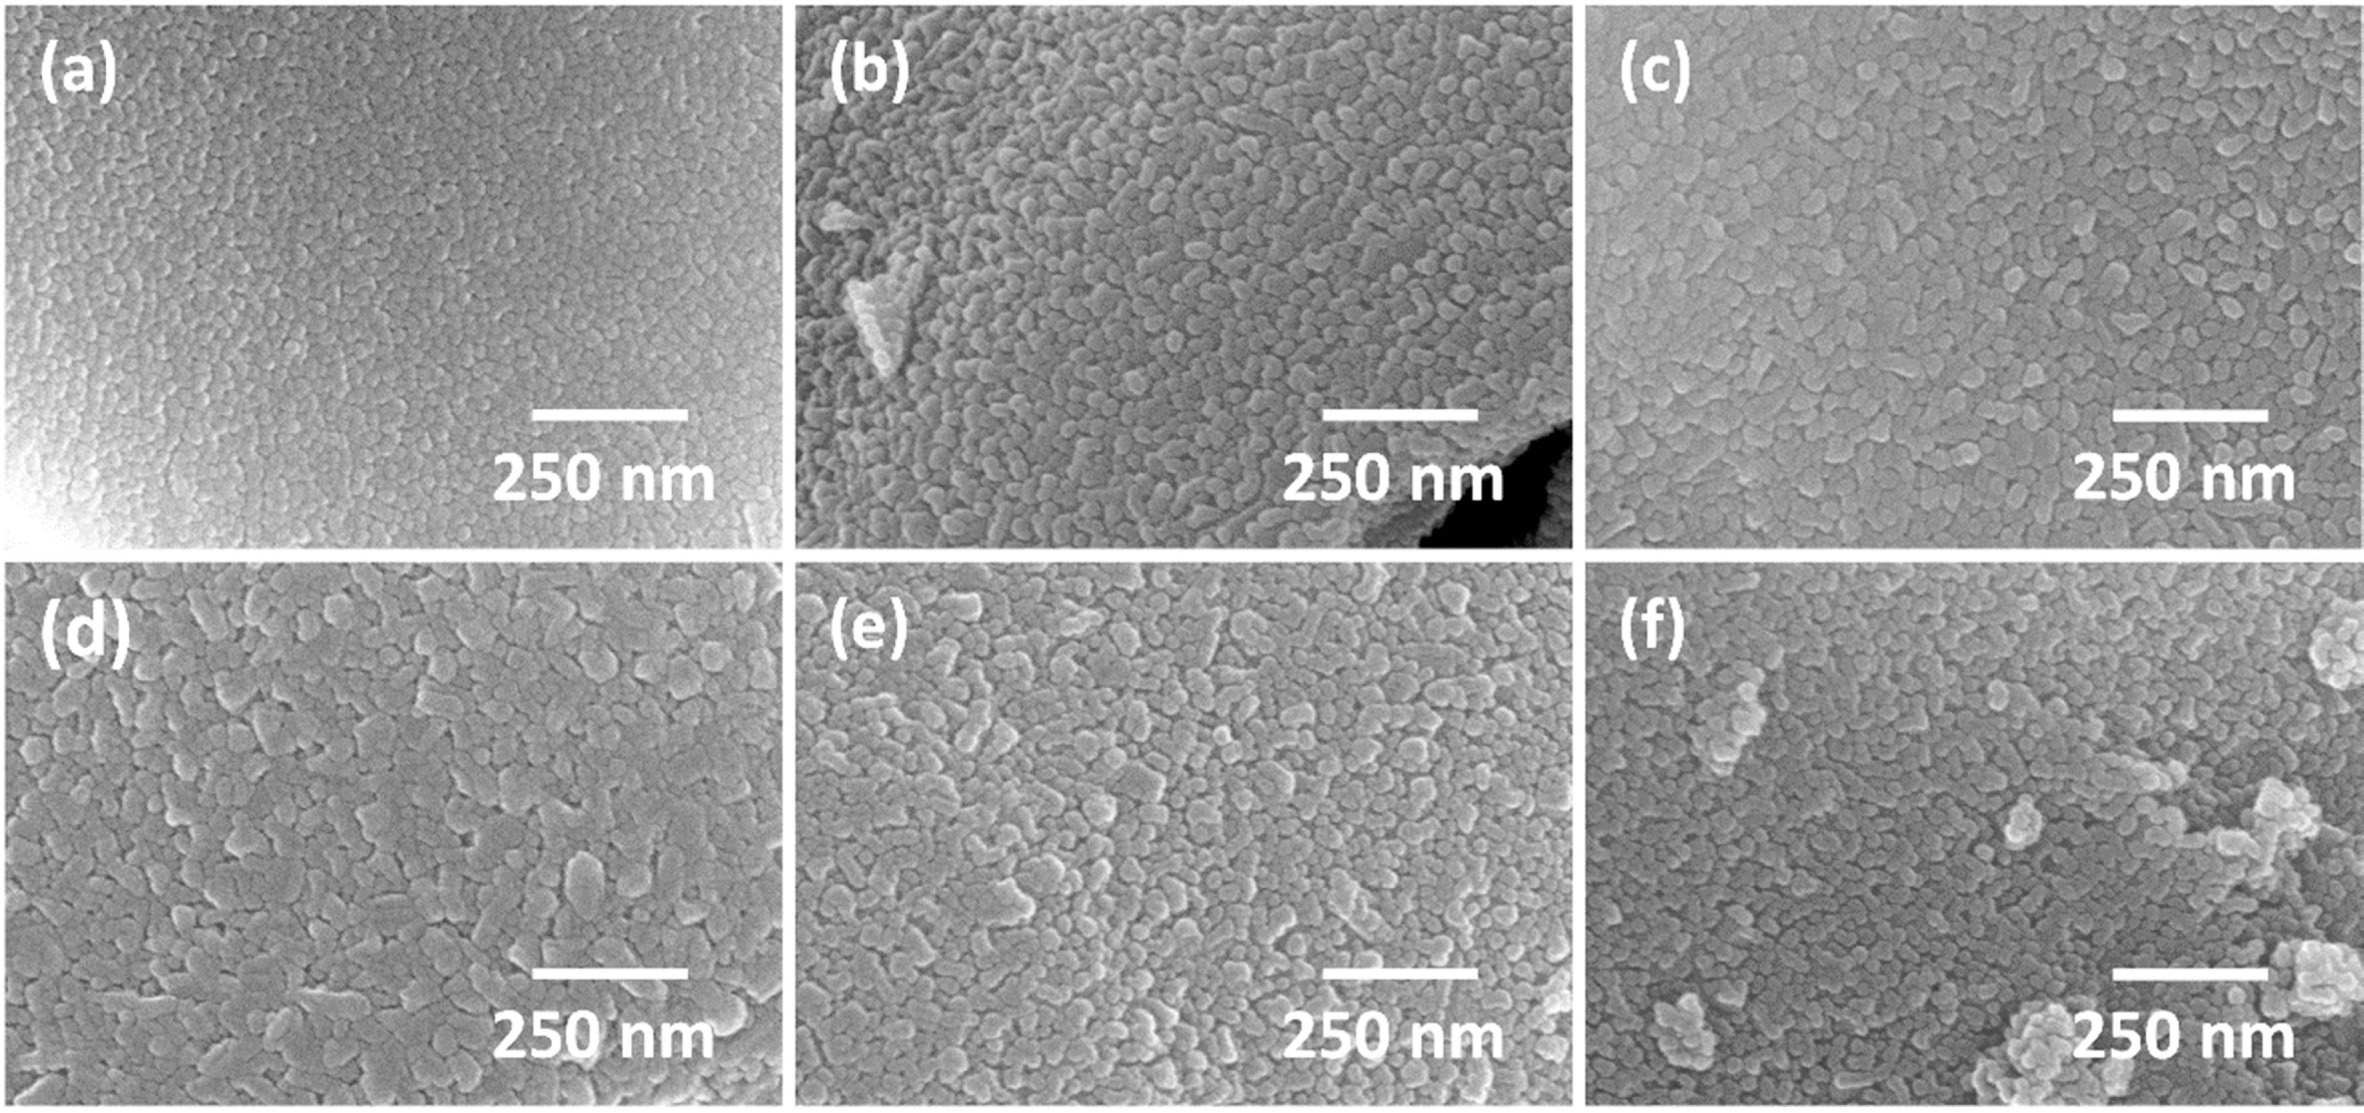
High magnification SEM micrographs of the gel after
calcination at different temperatures for 1 h are shown in Fig. 7. All the
samples show a polycrystalline microstructure consisting of nano-sized grains,
even the sample calcined at 400 °C. The grain size coarsens slightly as
calcination temperature increases, but even after calcination at 650 °C,
the mean grain size is only ~ 30 nm. This agrees quite well with the
estimation of crystallite size using Scherrer’s formula. The samples calcined
at temperatures ≥ 500 °C show some areas with abnormal coarsening,
with some grains up to 100 nm in diameter. The nano-sized grains have partially
sintered together to form agglomerates, even after calcination at the low
temperature of 400 °C. The small grain radius and high surface area provides
a high driving force for sintering, causing the grains to
partially sinter together during the calcination process [48, 49].
The agglomerate size may be reduced by ball milling [50] or by cold isostatic
pressing of the powder to break the agglomerates [51].
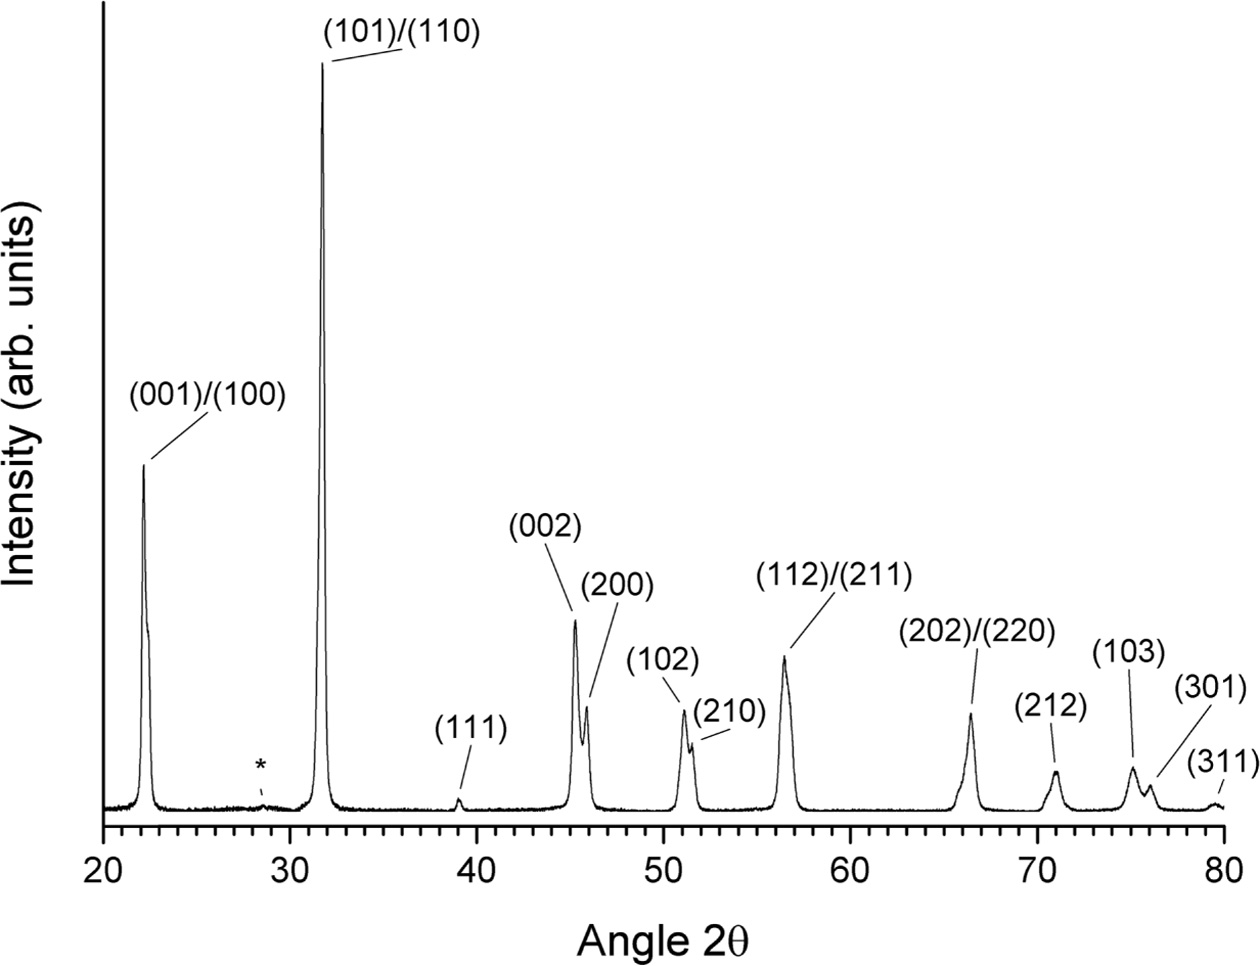
A slow-scan XRD pattern of a gel sample calcined at
650 °C for 1 h is shown in Fig. 8. The pattern can be indexed with ICDD
card# 71-0948 (KNbO3, tetragonal, space group P4mm). The unit cell
parameters were refined as a = 3.9528 Å, c = 4.0033 Å. (K0.5Na0.5)NbO3
usually has an orthorhombic unit cell at room temperature. The change in symmetry
to tetragonal is caused by the very small grain size [52]. A small peak at
28.5° (marked with an asterisk) may be due to unreacted K2CO3 (ICDD card # 87-0730) or to K3Nb7O19
(ICDD card # 84-0812).
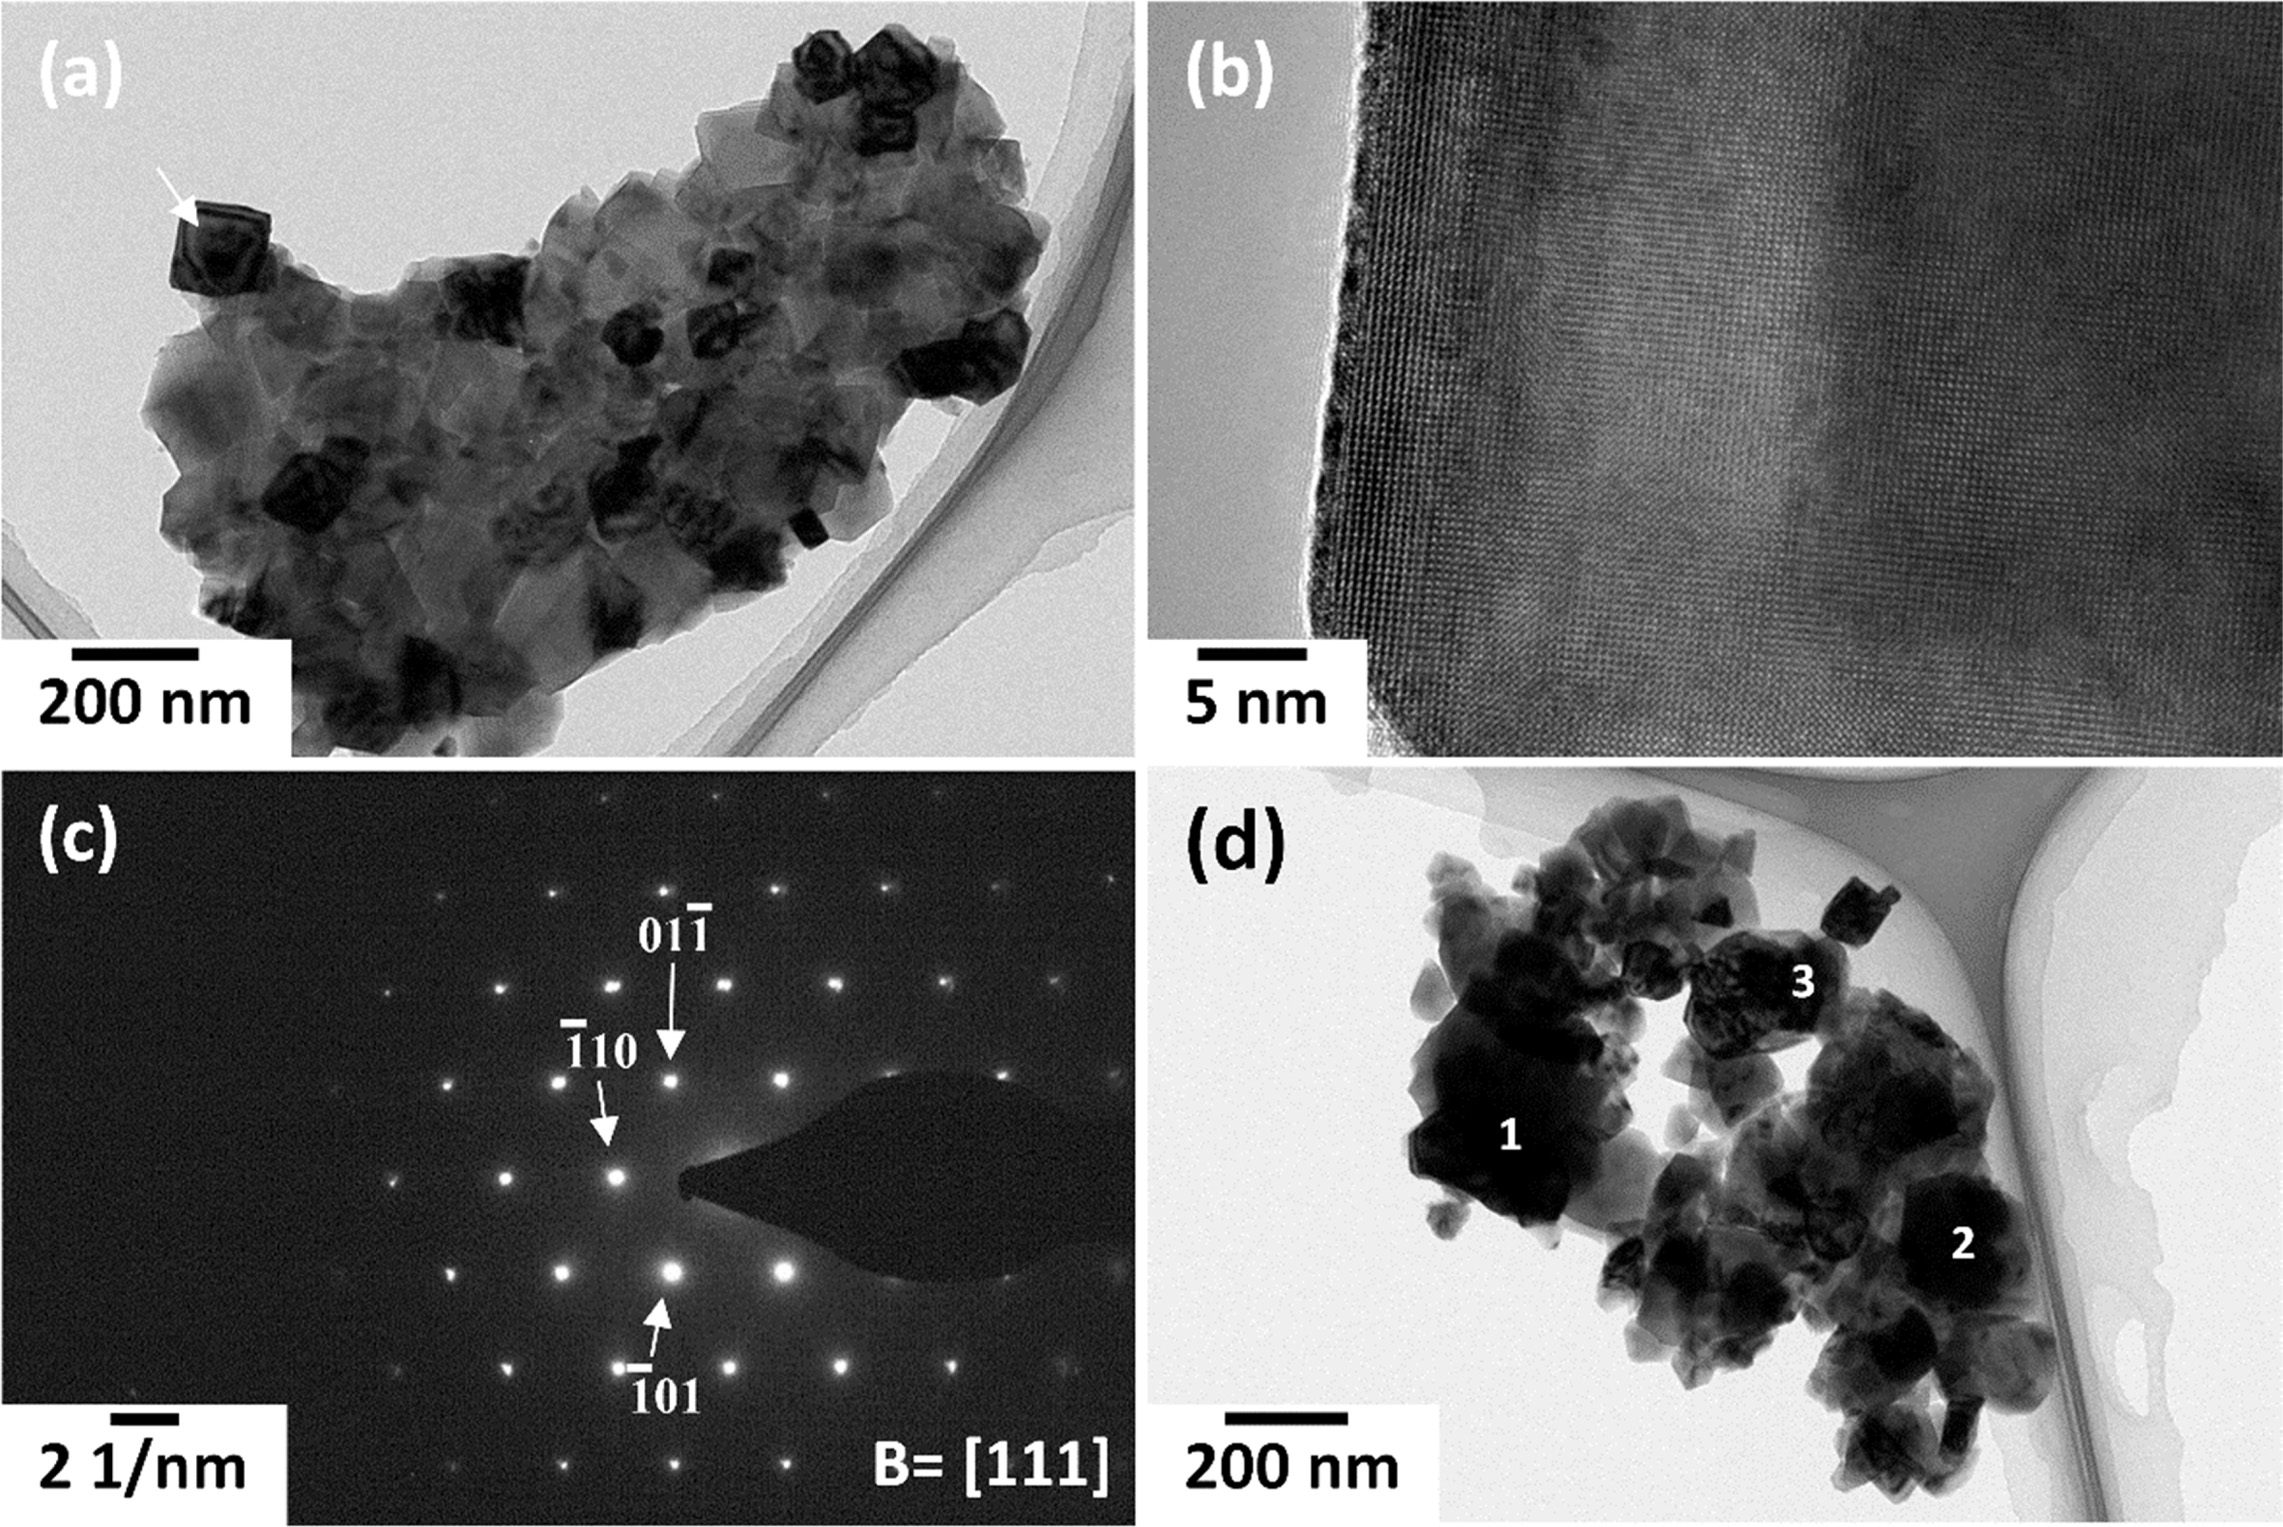
TEM micrographs of a gel sample calcined at 650 °C
for 1 h are shown in Fig. 9(a) and Fig. 9(d). The grains are cubic in shape, as
is typical for (K0.5Na0.5)NbO3 [10, 53] and
vary in size from 20-200 nm. It can clearly be seen that
the nano-sized grains have sintered together to
form agglomerates. Fig. 9(b) shows a high-resolution TEM image of
the grain marked by an arrow in Fig. 9(a). The crystal structure of the grain
can clearly be seen. Fig. 9(c) shows a selected area diffraction pattern of a
different grain. The pattern was indexed using a tetragonal unit cell. EDS
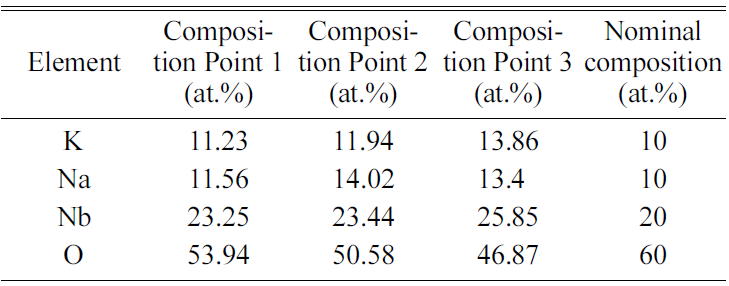
point analysis of the three grains marked in Fig. 9(d) is shown in Table 3. The
chemical compositions of the grains are close to the nominal composition for (K0.5Na0.5)NbO3,
indicating good chemical homogeneity of the powder.
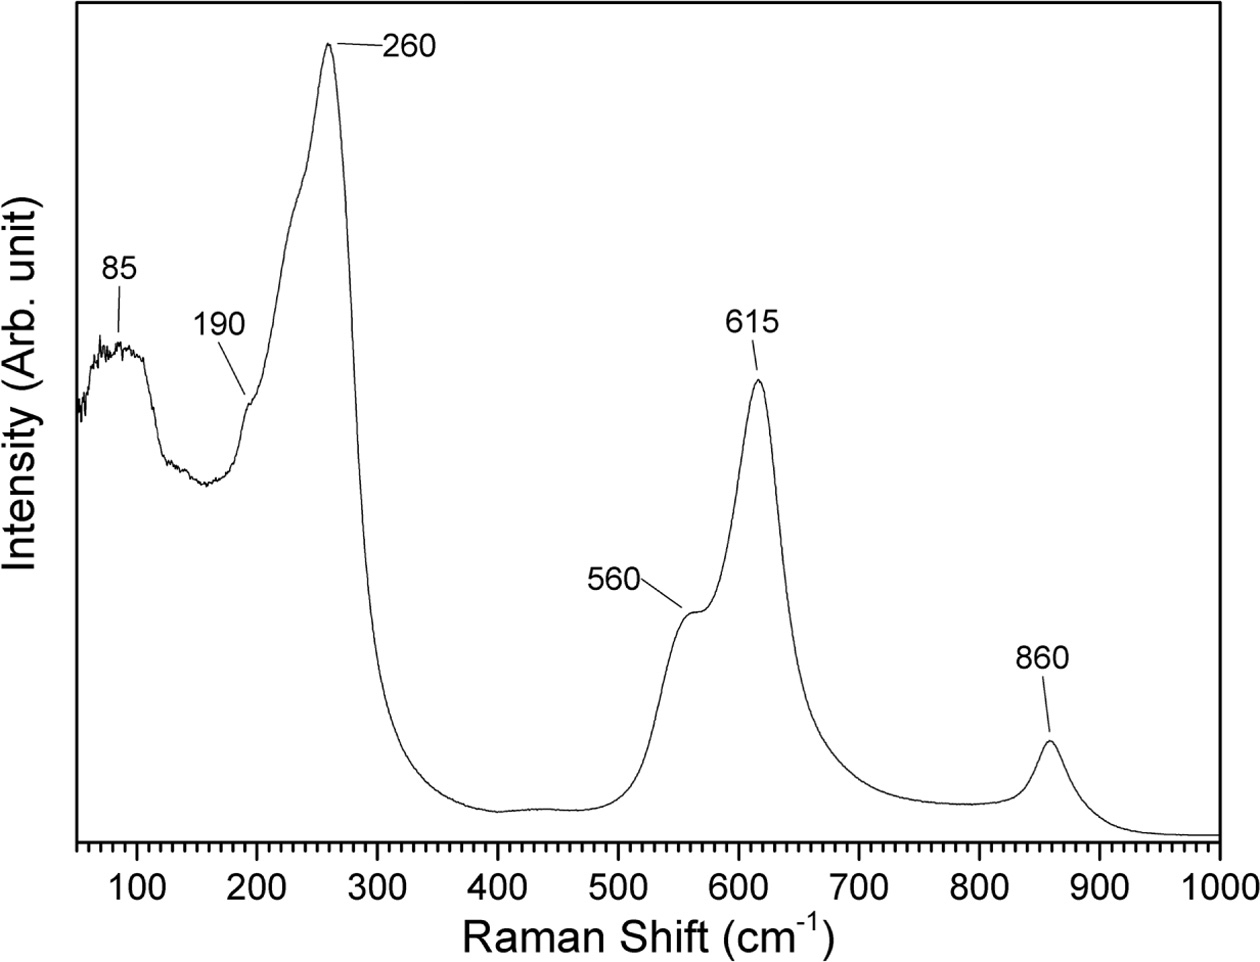
A Raman spectrum of a gel sample calcined at 650 °C
for 1 h is shown in Fig. 10. The spectrum shows features typical of (K0.5Na0.5)NbO3
[54, 55]. The peak at 85 cm-1
and the shoulder at 190 cm-1
are assigned to translational modes of Na+/K+ cations and
rotations of the NbO6 octahedra. The peak at 260 cm-1
is assigned to the ν5 NbO6 bending mode. The
shoulder at 560 cm-1 and
the peak at 615 cm-1
are assigned to the ν2 and ν1 NbO6
stretching modes respectively. At 860 cm-1,
there is a mode assigned to a combination tone of the ν1
and ν5 modes. The overlap of the ν1 and ν2
modes may indicate the tetragonal phase of (K0.5Na0.5)NbO3
[56].
According to Su et al., the following ion exchange
reaction takes place between alkali carbonates and ammonium niobium oxalate
[32]:
2NH4[NbO(C2O4)2(H2O)2](H2O)3
+ A2CO3 →
2A[NbO(C2O4)2(H2O)2](H2O)3
+ 2NH3 + CO2 + H2O
(A = K, Na) (2)
This is then followed by a ligand exchange reaction:
A[NbO(C2O4)2(H2O)2](H2O)3
+ 2NH3 →
A[NbO(C2O4)2(NH3)2](H2O)3
+ 2H2O (3)
Only half of the oxalate will undergo the ligand exchange
reaction due to an insufficient amount of ammonia.
Upon heating, the gel decomposes into K2CO3, Na2CO3
and Nb2O5·nH2O according to the following
reactions:
2A[NbO(C2O4)2(H2O)2](H2O)3
+ 2O2 → A2CO3
+ Nb2O5·nH2O + 7CO2
+ (10 - n)H2O (4)
2A[NbO(C2O4)2(NH3)2](H2O)3
+ 2O2 → A2CO3
+ Nb2O5·nH2O + 7CO2
+ 4NH3 + (6 - n)H2O (5)
Because the alkali ions and niobium ions are mixed in the
gel on a molecular scale, the gel decomposes to give a finely interspersed
mixture of alkali carbonates and Nb2O5·nH2O.
This reduces the diffusion distances needed for subsequent chemical reactions,
allowing the (K0.5Na0.5)NbO3
phase to be formed at lower calcination temperatures
than those achieved by conventional solid state processing. The higher
reactivity of Nb2O5·nH2O compared to Nb2O5
is also beneficial. In the present work, single phase (K0.5Na0.5)NbO3
nanopowders could be formed at calcination temperatures comparable to those of
other aqueous preparation methods, but with a much simpler process [16, 18,
26].
In their work, Su et al. were able to prepare
single phase NaNbO3 powders using calcination temperatures as
low as 400 °C [32]. However, in the present work a calcination
temperature of 600 °C was necessary to obtain a single phase powder.
Furthermore, the (K0.5Na0.5)NbO3
phase appears to develop via intermediate NaNbO3
and K4Nb6O17 phases. It should be noted that,
as well as the NaNbO3 phase, there are other (K1-xNax)NbO3 phases with very
similar diffraction patterns to NaNbO3 and (K0.5Na0.5)NbO3
(ICDD card # 74-2024 for (K0.02Na0.98)NbO3 and
ICDD card #s 74-2025 and 77-0037 for (K0.1Na0.9)NbO3)
and it is difficult to assign particular diffraction patterns to
the XRD traces as KNbO3 and NaNbO3 form a complete range
of solid solutions [57]. On calcination at 400 and 450 °C, the gel
powder probably forms a range of sodium-rich (K1-xNax)NbO3
phases along with K4Nb6O17 and as the calcination
temperature increases, the overall composition moves
towards (K0.5Na0.5)NbO3. The exact nature of
the sample after calcination at 400 °C is not known. From the XRD pattern
(Fig. 4) it appears amorphous, but from the SEM micrograph it
appears polycrystalline (Fig. 7). The sample may be
partially crystalline.
Malic et al. studied the synthesis of (K0.5Na0.5)NbO3
from alkali carbonates and Nb2O5 by the use of diffusion
couples of K2CO3/Nb2O5, Na2CO3/Nb2O5
and (K2CO3+Na2CO3)/Nb2O5
[58]. They found that the perovskite phase formed via
intermediate phases such as Na2Nb4O11,
K6Nb10.88O30, K4Nb6O17
and (K,Na)2Nb4O11. They also
found that the reaction rate for formation of (K0.5Na0.5)NbO3
was determined by the diffusion of the more slowly moving K+ ions
and that the reaction rate constant for the reaction in the K2CO3/Nb2O5
and (K2CO3+Na2CO3)/Nb2O5
diffusion couples was an order of magnitude slower than that of the Na2CO3/Nb2O5
diffusion couple.
Yang et al. in their synthesis of (K0.5Na0.5)NbO3
powders by the Polymerized Complex method found that (K0.5Na0.5)NbO3
formed via intermediate NaNbO3 and K2Nb8O21
phases [15]. Similar results were found in the synthesis
of KNN powders by the hydrothermal method [17, 21] Toyama et al.
in their study of the synthesis of (K1-xNax)NbO3
nanoparticles using a supercritical water flow system also found that KNbO3
could form via an intermediate K4Nb6O17
phase [24]. NaNbO3, on the
other hand, formed directly and (K1-xNax)NbO3
nanoparticles always had a higher Na/K molar ratio than the molar ratio of the starting precursors,
indicating that Na+ ions
have a higher reactivity than K+ ions. This difference in diffusion
rates and reactivity of the alkali ions would explain why intermediate phases
form and why a higher calcination temperature then that of Su et al. is
needed to obtain a single phase (K0.5Na0.5)NbO3
powder in the present work. Sodium-rich (K1-xNax)NbO3
phases form first due to the higher diffusion rate and reactivity of the Na+
ions. These phases then change to the (K0.5Na0.5)NbO3
composition at higher calcination temperatures due to the increase in diffusion
rate and reactivity of K+ ions.
|
Fig. 1 TG/DTA trace of NH4[NbO(C2O4)2]·xH2O powder. |
|
Fig. 2 TG/DTA trace of uncalcined gel. |
|
Fig. 3 (a) XRD pattern of uncalcined gel; (b) FTIR spectrum of NH4[NbO(C2O4)2].xH2O powder; (c) FTIR spectrum of uncalcined gel. |
|
Fig. 4 XRD patterns of gel calcined at temperatures between 400 ~ 650 °C for 1 h. |

|
Fig. 5 FTIR spectra of gel calcined at temperatures between 400 ~ 650 °C for 1 h. |
|
Fig. 6 (a) and (b) SEM micrographs of uncalcined gel; (c) SEM micrograph of gel calcined at 650 °C for 1 h. |
|
Fig. 7 SEM micrographs of gel calcined for 1 h at (a) 400 °C, (b) 450 °C, (c) 500 °C, (d) 550 °C, (e) 600 °C and (f) 650 °C. |
|
Fig. 8 Slow-scan XRD pattern of gel calcined for 1 h at 650 °C. |
|
Fig. 9 (a), (d) TEM micrographs of gel calcined for 1 h at 650 °C; (b) HRTEM micrograph of the grain marked by an arrow in (a); (c) SADP of a grain. |
|
Fig. 10 Raman spectrum of gel calcined for 1 h at 650 °C. |
Based on the work of Su et al., a facile aqueous
method for the production of (K0.5Na0.5)NbO3
nanopowders from alkali carbonates and ammonium niobium oxalate has
been developed. The alkali carbonates and ammonium niobium
oxalate are dissolved and mixed in water and an ion exchange reaction takes
place between the ammonium niobium oxalate and alkali carbonates. The water is
then evaporated, leaving behind a gel which is then calcined. From the TG/DTA,
XRD and FTIR results, the calcination reactions begin at temperatures between
450-500 °C, but a calcination temperature of 650 °C
is needed to form a single phase (K0.5Na0.5)NbO3
powder. The (K0.5Na0.5)NbO3 phase appears to
develop via intermediate sodium-rich (K1-xNax)NbO3
and K4Nb6O17 phases. This
is probably due to the difference in diffusion rate and reactivity between Na+
and K+ ions. A single phase (K0.5Na0.5)NbO3
powder with tetragonal structure and a mean grain size of ~ 30 nm could be
prepared at a calcination temperature of 650 °C. This method allows the
formation of (K0.5Na0.5)NbO3 nano powder at
temperatures 100 ~ 300 °C lower than that of conventional solid
state reaction routes and without the need for ball milling the starting
materials using organic solvents.
This research was supported by the Basic Science Research
Program through the National Research Foundation of Korea (NRF), funded by the
Ministry of Education under Grant number: 2015R1D1A1A01057060.
The authors would like to thank Kyeong-Kap Jeong and Jeong-Chi Sang (Centre for
Research Facilities, Chonnam National University) for operating the XRD and
FTIR, Hey-Jeong Kim (Centre for Development of Fine Chemicals, Chonnam National
University) for operating the SEM and Dr. Sang-Hun Jeong and Kang-Min Lee
(Korea Basic Science Institute, Gwangju centre) for carrying out the Raman
scattering and slow-scan XRD experiments respectively.
- 1. J. Rödel, W. Jo, K.T.P. Seifert, E.-M. Anton, T. Granzow, and D. Damjanovic, J. Am. Ceram. Soc. 92[6] (2009) 1153-1177.
-

- 2. J. Rödel, K.G. Webber, R. Dittmer, W. Jo, M. Kimura, and D. Damjanovic, J. Eur. Ceram. Soc. 35[6] (2015) 1659-1681.
-
- 3. B. Malič, J. Koruza, J. Hreščak, J. Bernard, K. Wang, J. Fisher, and A. Benčan, Materials 8[12] (2015) 5449.
-
- 4. J. Wu, D. Xiao, and J. Zhu, Chem. Rev. 115[7] (2015) 2559-2595.
-
- 5. M. Villafuerte-Castrejón, E. Morán, A. Reyes-Montero, R. Vivar-Ocampo, J.A. Peña-Jiménez, S.O. Rea-López, and L. Pardo, Materials 9[1] (2016) 21.
-
- 6. K. Wang, B. Malič, and J. Wu, MRS Bulletin 43[8] (2018) 607-611.
-
- 7. H.-C. Thong, C. Zhao, Z. Zhou, C.-F. Wu, Y.-X. Liu, Z.-Z. Du, J.-F. Li, W. Gong, and K. Wang, Materials Today 29 (2019) 37-48.
-
- 8. H. Birol, D. Damjanovic, and N. Setter, J. Eur. Ceram. Soc. 26[6] (2006) 861-866.
-
- 9. J.G. Fisher, D. Rout, K.S. Moon, and S.J.L. Kang, J. Alloys Compd. 479[1–2] (2009) 467-472.
-
- 10. J. Hreščak, A. Bencan, T. Rojac, and B. Malič, J. Eur. Ceram. Soc. 33[15–16] (2013) 3065-3075.
-
- 11. N. Marandian Hagh, B. Jadidian, and A. Safari, J Electroceram 18[3-4] (2007) 339-346.
-
- 12. J. Koruza, A.J. Bell, T. Frömling, K.G. Webber, K. Wang, and J. Rödel, J. Materiomics 4[1] (2018) 13-26.
-
- 13. H.-C. Thong, C. Zhao, Z.-X. Zhu, X. Chen, J.-F. Li, and K. Wang, Acta Mater. 166 (2019) 551-559.
-
- 14. H.-C. Thong, Z. Xu, C. Zhao, L.-Y. Lou, S. Chen, S.-Q. Zuo, J.-F. Li, and K. Wang, J. Am. Ceram. Soc. 102[2] (2019) 836-844.
-
- 15. H. Yang, Y. Lin, F. Wang, and H. Luo, Mater. Manuf. Processes 23[5] (2008) 489-493.
-
- 16. A. Chowdhury, S. O'Callaghan, T.A. Skidmore, C. James, and S.J. Milne, J. Am. Ceram. Soc. 92[3] (2009) 758-761.
-
- 17. A.D. Handoko, and G.K.L. Goh, Green Chem. 12[4] (2010) 680-687.
-
- 18. G. Stavber, B. Malič, and M. Kosec, Green Chem. 13[5] (2011) 1303-1310.
-
- 19. Y. Hou, C. Wang, J. Zhao, H. Ge, M. Zhu, and H. Yan, Mater. Chem. Phys. 134[1] (2012) 518-522.
-
- 20. D.-Q. Zhang, D.-W. Wang, H.-B. Zhu, X.-Y. Yang, R. Lu, B. Wen, W.-Q. Cao, J. Yuan, and M.-S. Cao, Ceram. Int. 39[5] (2013) 5931-5935.
-
- 21. R. López-Juárez, R. Castañeda-Guzmán, and M.E. Villafuerte-Castrejón, Ceram. Int. 40[9, Part B] (2014) 14757-14764.
-
- 22. A.B. Haugen, F. Madaro, L.P. Bjørkeng, T. Grande, and M.A. Einarsrud, J. Eur. Ceram. Soc. 35[5] (2015) 1449-1457.
-
- 23. X. Meng, W. Wang, H. Ke, J. Rao, and Y. Zhou, Materials Science and Engineering: B 212 (2016) 1-6.
-
- 24. S. Toyama, H. Hayashi, M. Takesue, M. Watanabe, and R.L. Smith, J. of Supercritical Fluids 107 (2016) 1-8.
-
- 25. Y. Wang, Q. Zhang, L. Hu, E. Yu, and H. Yang, J. Alloys Compd. 685 (2016) 1-7.
-
- 26. G.H. Khorrami, M. Mousavi, and M. Dowran, Mod. Phys. Lett. B 31[15] (2017) 1750175.
-
- 27. R. Rani, S. Sharma, M. Quaglio, R. Rai, S. Bianco, D. Pugliese, and C. Pirri, Mat. Sci. Applications 8[3] (2017) 247-257.
-
- 28. N. Senes, A. Iacomini, N. Domingo, S. Enzo, G. Mulas, S. Cuesta-Lopez, and S. Garroni, Physica Status Solidi (a) 215[16] (2018).
-
- 29. H.-l. Cheng, J. Xiao, P. Gao, Y.-y. Yan, S.-p. Gao, and H.-l. Du, Transactions of Nonferrous Metals Society of China 28[9] (2018) 1801-1807.
-
- 30. S.L. Skjærvø, K.H. Wells, W. van Beek, T. Grande, and M.-A. Einarsrud, CrystEngComm 20[42] (2018) 6795-6802.
-
- 31. B. Chen, P. Liang, D. Wu, X. Zhao, X. Qiao, Z. Peng, L. Wei, X. Chao, and Z. Yang, Powder Technol. 346 (2019) 248-255.
-
- 32. T. Su, Y. Zhai, H. Jiang, and H. Gong, Res. Chem. Intermed. 36[5] (2010) 565-575.
-
- 33. F.F.P. Medeiros, M.F.V. Moura, A.G.P. da Silva, C.P. Souza, K.K.P. Gomes, and U.U. Gomes, Brazil. J. Chem. Eng. 23 (2006) 531-538.
-
- 34. T.T. Su, Y.C. Zhai, H. Jiang, and H. Gong, J. Therm. Anal. Calorim. 98[2] (2009) 449-455.
-
- 35. H. Jiang, T.T. Su, H. Gong, and Y.C. Zhai, Cryst. Res. Technol. 46[1] (2011) 85-89.
-
- 36. I. Nowak and M. Ziolek, Chem. Rev. 99[12] (1999) 3603-3624.
-
- 37. V.S. Braga, J.A. Dias, S.C.L. Dias, and J.L. de Macedo, Chem. Mater. 17[3] (2005) 690-695.
-
- 38. B. Malic, D. Jenko, J. Bernard, J. Cilensek, and M. Kosec, Mat. Res. Soc. Proc. 755 (2002) 83-88.
- 39. J. Hreščak, B. Malič, J. Cilenšek, and A. Benčan, J. Therm. Anal. Calorim. 127[1] (2017) 129-136.
-
- 40. J.V. Reis, T.C.P. Pereira, T.H.A. Teles, A.B. França, J.D.A. Bellido, F.L. Naves, and E.P. Baston, Mater. Lett. 227 (2018) 261-263.
-
- 41. S. Joshi, S. Kalyanasundaram, and V. Balasubramanian, Appl. Spectrosc. 67[8] (2013) 841-845.
-
- 42. T. Ikeya and M. Senna, J. Non-Cryst. Solids 105[3] (1988) 243-250.
-
- 43. K.I. Peterson and D.P. Pullman, J. Chem. Educ. 93[6] (2016) 1130-1133.
-
- 44. L. Monico, F. Rosi, C. Miliani, A. Daveri, and B.G. Brunetti, Spectrochim. Acta Pt. A: Mol. Biomol. Spec. 116 (2013) 270-280.
-
- 45. T. Rojac, M. Kosec, P. Šegedin, B. Malič, and J. Holc, Sol. Stat. Ionics 177[33] (2006) 2987-2995.
-
- 46. B.M. Gatehouse, S.E. Livingstone, and R.S. Nyholm, J. Chem. Soc. (Resumed) (1958) 3137-3142.
-
- 47. G. Busca and V. Lorenzelli, Mat. Chem. 7[1] (1982) 89-126.
-
- 48. S.J.L. Kang, in “Sintering: Densification, Grain Growth & Microstructure” (Elsevier Butterworth Heineman, 2005) pp. 39-55.
-
- 49. R.M. German, in “Sintering Theory and Practice” (Wiley, 1996) pp. 67-141.
- 50. G. Rez, Y. Sakka, T.S. Suzuki, T. Uchikoshi, and E.F. Aglietti, J. Ceram. Soc. Jpn. 117[1364] (2009) 470-474.
-
- 51. M. Mazaheri, M. Valefi, Z.R. Hesabi, and S.K. Sadrnezhaad, Ceram. Int. 35[1] (2009) 13-20.
-
- 52. C. Wang, Y.-D. Hou, H.-Y. Ge, M.-K. Zhu, and H. Yan, J. Eur. Ceram. Soc. 29[12] (2009) 2589-2594.
-
- 53. D. Jenko, A. Bencan, B. Malic, J. Holc, and M. Kosec, Microsc. Microanal. 11[6] (2005) 572-580.
-
- 54. K. Kakimoto, K. Akao, Y.P. Guo, and H. Ohsato, Jpn. J. Appl. Phy. 44[9B] (2005) 7064-7067.
-
- 55. Y. Shiratori, A. Magrez, and C. Pithan, Chem. Phys. Lett. 391[4–6] (2004) 288-292.
-
- 56. N. Klein, E. Hollenstein, D. Damjanovic, H.J. Trodahl, N. Setter, and M. Kuball, J. Appl. Phys. 102[1] (2007) 014112.
-
- 57. B. Jaffe, W.R. Cook, and H. Jaffe, in “Piezoelectric Ceramics” (Academic Press, 1971) pp. 185-212.
-
- 58. B. Malic, D. Jenko, J. Holc, M. Hrovat, and M. Kosec, J. Am. Ceram. Soc. 91[6] (2008) 1916-1922.
-
 This Article
-
2020; 21(1): 5-13
Published on Feb 28, 2020
- 10.36410/jcpr.2020.21.1.5
- Received on Feb 15, 2019
- Revised on Dec 20, 2019
- Accepted on Jan 21, 2020
Services
- Abstract
introduction
experimental
results and discussion
conclusions
- Acknowledgements
- References
- Full Text PDF
Shared
Correspondence to
- John G. Fisher
-
School of Materials Science and Engineering, Chonnam National University, Gwangju 61186, Korea
Tel : +82-62-530-1702 Fax: +82-62-530-1699 - E-mail: johnfisher@jnu.ac.kr
Clean-Energy Research Institute(CRI), Hanyang University, 222, Wangsimni-ro, Seongdong-gu, Seoul, 04763, Korea
E-mail: jcpr@hanyang.ac.kr