- Y2O3-stabilized ZrO2, Ni, and graphene-added Mg by reactive mechanical grinding processing for hydrogen storage and comparison with Ni and Fe2O3 or MnO-added Mg
Myoung Youp Songa,*, Eunho Choib and Young Jun Kwaka
aDivision of Advanced Materials Engineering, Hydrogen & Fuel Cell Research Center, Engineering Research Institute, Jeonbuk National University, 567 Baekje-daero, Deokjin-gu, Jeonju 54896, Korea
bDepartment of Materials Engineering, Graduate School, Jeonbuk National University, 567 Baekje-daero, Deokjin-gu, Jeonju 54896, Korea
The optimum powder to ball
ratio was examined, which is one of the important conditions in reactive
mechanical grinding processing. Yttria (Y2O3)-stabilized
zirconia (ZrO2) (YSZ), Ni, and graphene were chosen as additives to
enhance the hydriding and dehydriding rates of Mg. Samples with a
composition of 92.5 wt% Mg + 2.5 wt% YSZ + 2.5 wt% Ni + 2.5 wt% graphene (designated as
Mg-2.5YSZ-2.5Ni-2.5graphene) were prepared by grinding in hydrogen atmosphere.
Mg-2.5YSZ-2.5Ni-2.5graphene had a high effective hydrogen-storage capacity of
almost 7 wt% (6.85 wt%) at 623 K in 12 bar H2 at the second cycle (n
= 2). Mg-2.5YSZ-2.5Ni-2.5graphene contained Mg2Ni phase after
hydriding-dehydriding cycling. Mg-2.5YSZ-2.5Ni-2.5graphene had a larger
quantity of hydrogen absorbed for 60 min, Ha (60 min), than
Mg-2.5Ni-2.5graphene and Mg-2.5graphene. The addition of YSZ also increased the
initial dehydriding rate and the quantity of hydrogen released for 60 min, Hd
(60 min), compared with those of Mg-2.5Ni-2.5graphene. Y2O3-stabilized
ZrO2, Ni, and graphene-added Mg had a higher initial hydriding rate
and a larger Ha (60 min) than Fe2O3, MnO,
or Ni and Fe2O3-added Mg at n = 1.
Keywords: Hydrogen storage, Grinding in H2, Scanning electron microscopy (SEM), X-ray diffraction, YSZ, Ni, graphene addition
Magnesium (Mg) has several good properties for hydrogen
storage: it has high hydrogen storage capacity (7.6 wt%
based on magnesium hydride (MgH2) weight and 8.3 wt% based on
Mg weight), is relatively inexpensive, and has high reserves in the earth’s
crust. However, the reaction kinetics of magnesium with hydrogen is slow. The
potential of magnesium hydride as a reversible hydrogen storage medium has
drawn attention to improving the reaction kinetics of magnesium
with hydrogen [1]. Many researchers have attempted to increase the hydrogen
absorption and release rates of magnesium [2-7] by alloying with
magnesium transition metals [8, 9] such as Cu, Ni, Ti, and Fe and
by synthesizing compounds such as LaMg12 and CeMg12 [10].
Oxides can be easily pulverized during mechanical grinding
since they are brittle. The added oxides and/or the oxides pulverized during
mechanical grinding can make the particles of magnesium finer. The hydriding and
dehydriding kinetics of Mg have also been improved by the
additions to MgH2 or Mg of V2O5, VN or VC
[11], Cr2O3 [12], Nb2O5 [13-16],
MgO [17], Cr2O3, Al2O3
and CeO2 [18], CeO2 [19], and Y2O3
[20]. Addition of nano-sized oxides to Mg
[21, 22] and coating of Ni on the Mg particles [23] are expected to improve the
hydrogen-storage properties of Mg. We were interested in Yttria (Y2O3)-stabilized
zirconia (ZrO2) (YSZ) as an additive. Due to its
hardness and chemical inertness, it is used for tooth crowns [24]; and due to its hardness and optical properties in
monocrystal form, is used as jewelry.
YSZ is also used as the solid electrolyte in solid oxide fuel
cells (SOFCs) [24].
The addition of Ni to Mg is known to increase the hydriding
and dehydriding rates of Mg [25-28]. Graphite, one
of the allotropes of carbon, has high thermal conductivity
compared with most metals. When graphite is added to
Mg, it can thus help the sample disperse heat rapidly. The average specific
gravity of graphite is 1.6-2.0, which is smaller than the specific gravity of
aluminum, and the specific surface area of graphite is large. Graphene, another
allotrope of carbon, has a theoretical specific surface
area (SSA) of 2,630 m2/g [29].
We were also interested in Ni and graphene as additives.
One of the important
conditions in reactive mechanical grinding processing is powder to ball ratio. In this
work, the optimum powder to ball ratio was examined. Yttria (Y2O3)-stabilized
zirconia (ZrO2) (YSZ), Ni, and graphene were
expected to increase the hydriding and dehydriding rates of Mg when added. They
were thus chosen as additives. Samples with a composition of 92.5 wt%
Mg + 2.5 wt% YSZ + 2.5 wt% Ni + 2.5 wt% graphene
were prepared by grinding in a planetary ball mill in hydrogen atmosphere (reactive
mechanical grinding). The hydriding and dehydriding properties of the prepared
samples were examined. The samples were designated as
Mg-2.5YSZ-2.5Ni-2.5graphene. The initial hydriding rate and the quantity of
hydrogen absorbed for 60 min, Ha (60 min), of Y2O3-stabilized
ZrO2, Ni, and graphene-added Mg at the first cycle were compared
with those of Fe2O3, MnO, or Ni and Fe2O3-added
Mg.
The optimum powder to ball ratio for Mg-10 Fe2O3
with a composition of 90 wt% Mg + 10 wt% Fe2O3 was
examined varying the powder to ball ratios (weight ratio of powder to ball)
among 1/45, 1/27, and 1/9. The average particle size of Fe2O3
used for this experiment was smaller than 5 μm.
The starting materials to prepare the sample Mg-2.5YSZ-2.5Ni-2.5
graphene were pure Mg powder (-20 +100 mesh, 99.8%, metals basis,
Alfa Aesar), YSZ (partially-stabilized zirconia powder with
uniform dispersion of 3 mol% yttria, prepared by the co-precipitation method, Tosoh, Japan), Ni (Nickel
powder APS, 2.2-3.0 µm, purity 99.9% metal basis, C typically < 0.1%,
Alfa Aesar), and graphene (3-10 multi-layer graphene, 5-10 µm, purity ≥ 99
wt%, thickness 3-6 nm, surface area 150 m2/g, chemical exfoliation
proprietary method, Carbon Nano-material Technology Co., Ltd).
Reactive mechanical grinding was performed in a planetary
ball mill (Planetary Mono Mill; Pulverisette 6, Fritsch). Mixtures with a
composition of 92.5 wt% Mg + 2.5 wt% YSZ + 2.5 wt% Ni (total weight = 7.8 g)
were mixed in a stainless steel container (with 105 hardened steel balls, total
weight = 360 g) that was hermetically sealed. In order to prevent oxidation,
all sample handling was performed in a glove box filled with Ar. The disc
revolution speed was 400 rpm. The mill container (volume of 250 ml) was then filled
with high-purity hydrogen gas (≈ 12 bar). The reactive mechanical grinding
was performed for 12 h, refilling the hydrogen every two hours.
To prepare Mg-2.5YSZ-2.5Ni-5graphene, the addition
of graphene (0.2 g) was also performed in a planetary ball mill (Planetary Mono
Mill; Pulverisette 6, Fritsch) under similar conditions to those for the
preparation of 92.5 wt% Mg + 2.5 wt% YSZ + 2.5 wt% Ni for 30 min. The sample to
ball weight ratio was 1/45.
The absorbed or released hydrogen quantity was measured
as a function of time using a volumetric method with a
Sievert’s type hydriding and dehydriding apparatus
that was previously described [30]. During the measurements, the hydrogen
pressures were maintained as nearly constant by replenishing
the absorbed hydrogen from a small reservoir of known volume during the hydriding
reaction and by removing the released hydrogen to the small
reservoir during the dehydriding reaction. The 0.5 g of the samples was used
for the measurement of the absorbed or released hydrogen quantity as a function
of time. After the absorbed and then released hydrogen quantities were measured
at 623 K for 1 h in 12 and 1.0 bar H2, respectively, the sample was
then dehydrided at 623 K in a vacuum for 2 h.
Samples after reactive mechanical grinding and after
hydriding-dehydriding cycling were characterized by X-ray diffraction (XRD)
with Cu Kα radiation, using a Rigaku D/MAX 2500 powder diffractometer. The
microstructures of the powders were observed using a JSM-5900
scanning electron microscope (SEM) operated at 15 kV.
The quantity of hydrogen absorbed by the sample, Ha,
and the quantity of hydrogen released by the sample, Hd, were both
defined using the sample weight as a standard. Ha and Hd
were expressed in the unit of wt% H. The initial hydriding rate (wt% H/min) was
defined as the quantity of hydrogen charged for the first 2.5 min
divided by 2.5. The initial dehydriding rate (wt% H/min) was defined as the
quantity of hydrogen discharged for the first 2.5 min divided by 2.5.
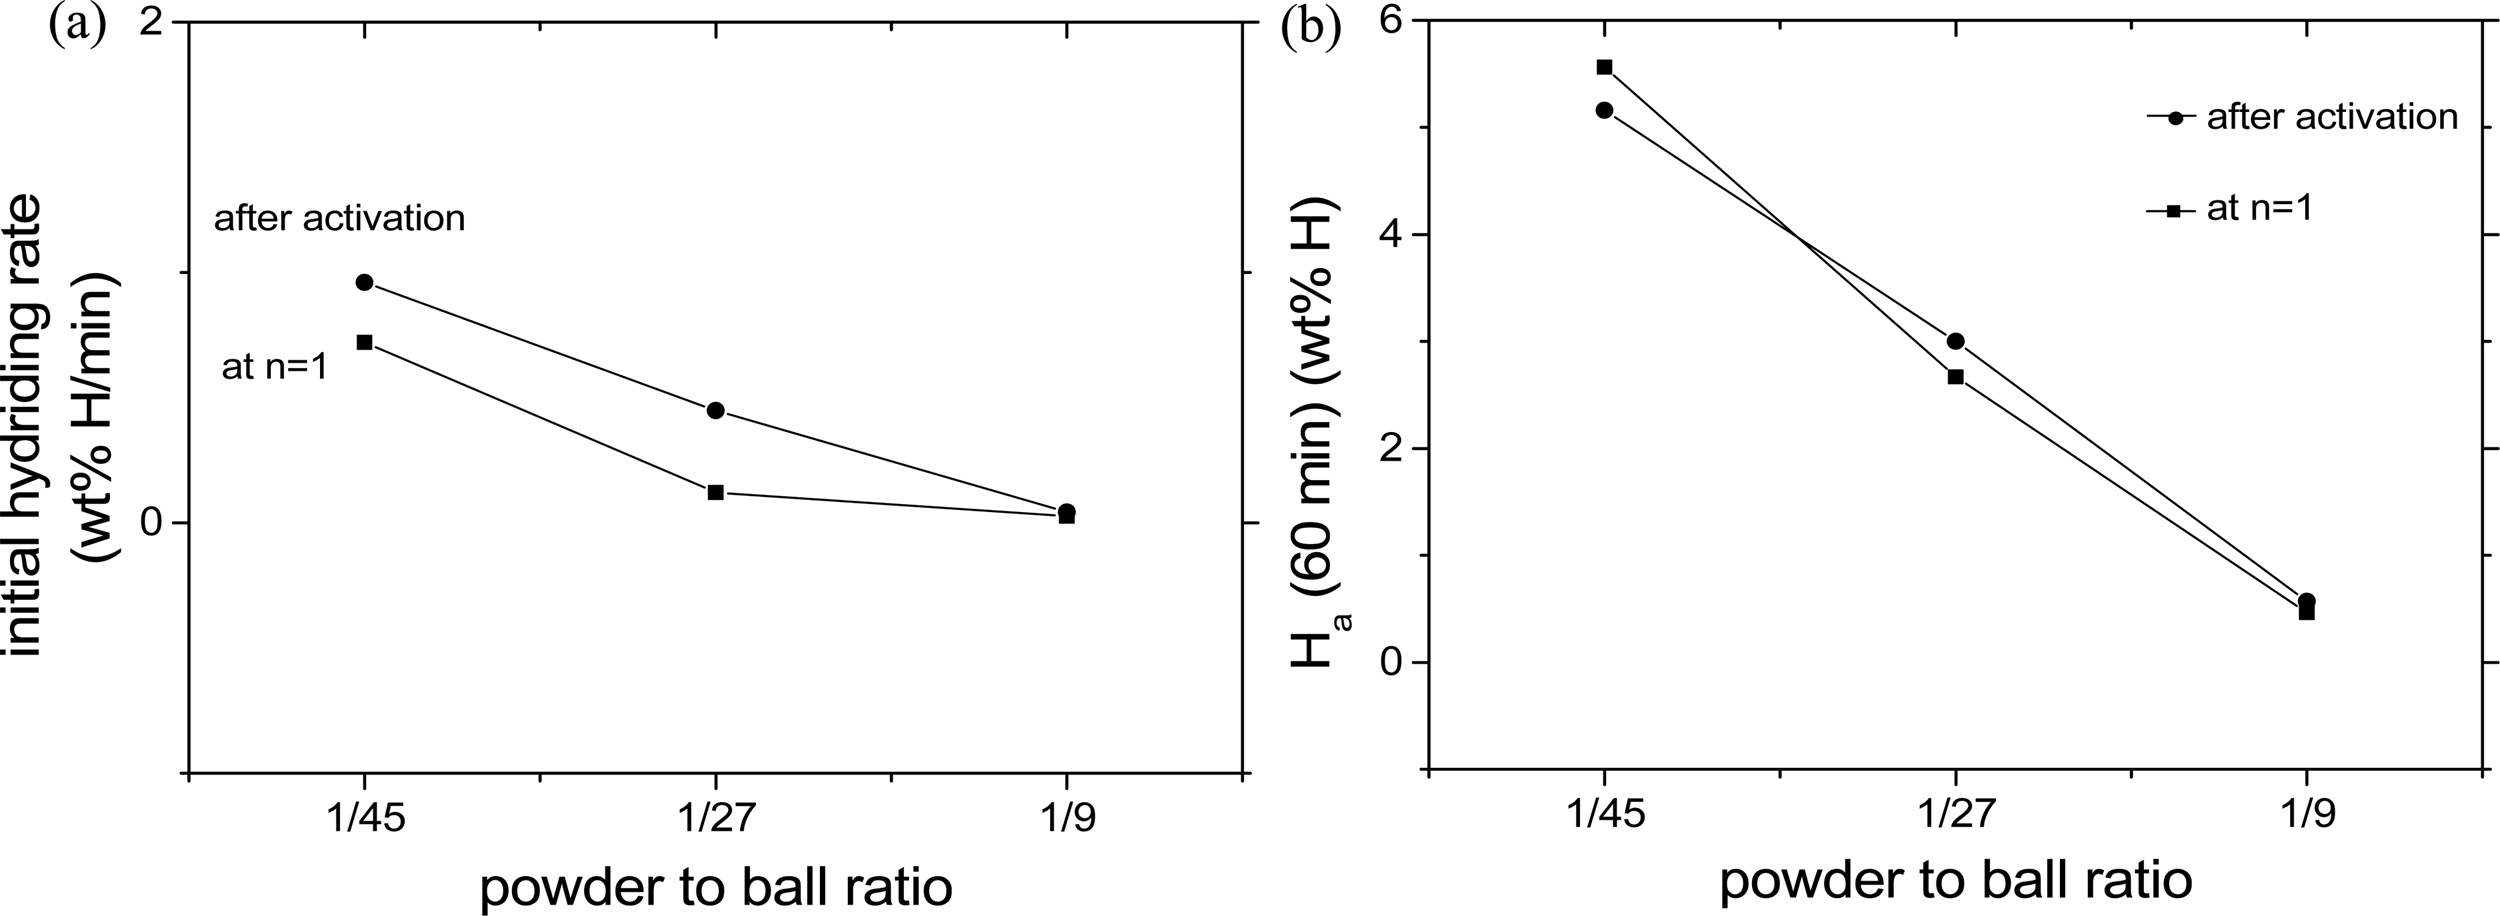
The variations in the initial hydriding rate and the
quantity of hydrogen absorbed for 60 min, Ha (60 min), at 593K in 12
bar H2 with the powder to ball ratio (1/45, 1/27, and 1/9) at
n = 1 and after activation (at n = 2) for Mg-10 Fe2O3
with a composition of 90 wt% Mg + 10 wt% Fe2O3
are shown in Fig. 1. The starting materials to prepare
the sample Mg-10Fe2O3 (at a revolution speed 250 rpm and
by reactive mechanical grinding for 2 h) were pure Mg powder (particle size 50 μm)
and Fe2O3 (< 5 μm, purity 99+%, Aldrich) [31]. At
n = 1 and after activation (at n = 2), the initial
hydriding rate decreased as the powder to ball ratio
increased; the initial hydriding rates were the highest when the
powder to ball ratio was 1/45. The initial hydriding rates after
activation were higher than those at n = 1.
At n = 1 and after activation
(at n = 2), Ha (60 min) decreased as the powder to ball
ratio increased; Ha (60 min)’s were the largest when the powder to
ball ratio was 1/45. At the powder to ball ratio of 1/45, the Ha (60
min) after activation was smaller than that at n = 1. On the other
hand, at the powder to ball ratio of 1/27 and 1/9, the Ha (60 min)’s
after activation were larger than that at n = 1. The decreases in the
initial hydriding rate and Ha (60 min) with the increase in the
powder to ball ratio show that the milling effects got better as the powder to
ball ratio increased.
From the results in Fig. 1, the powder to ball ratio of
1/45 was used in the process of reactive mechanical grinding for sample
preparation.
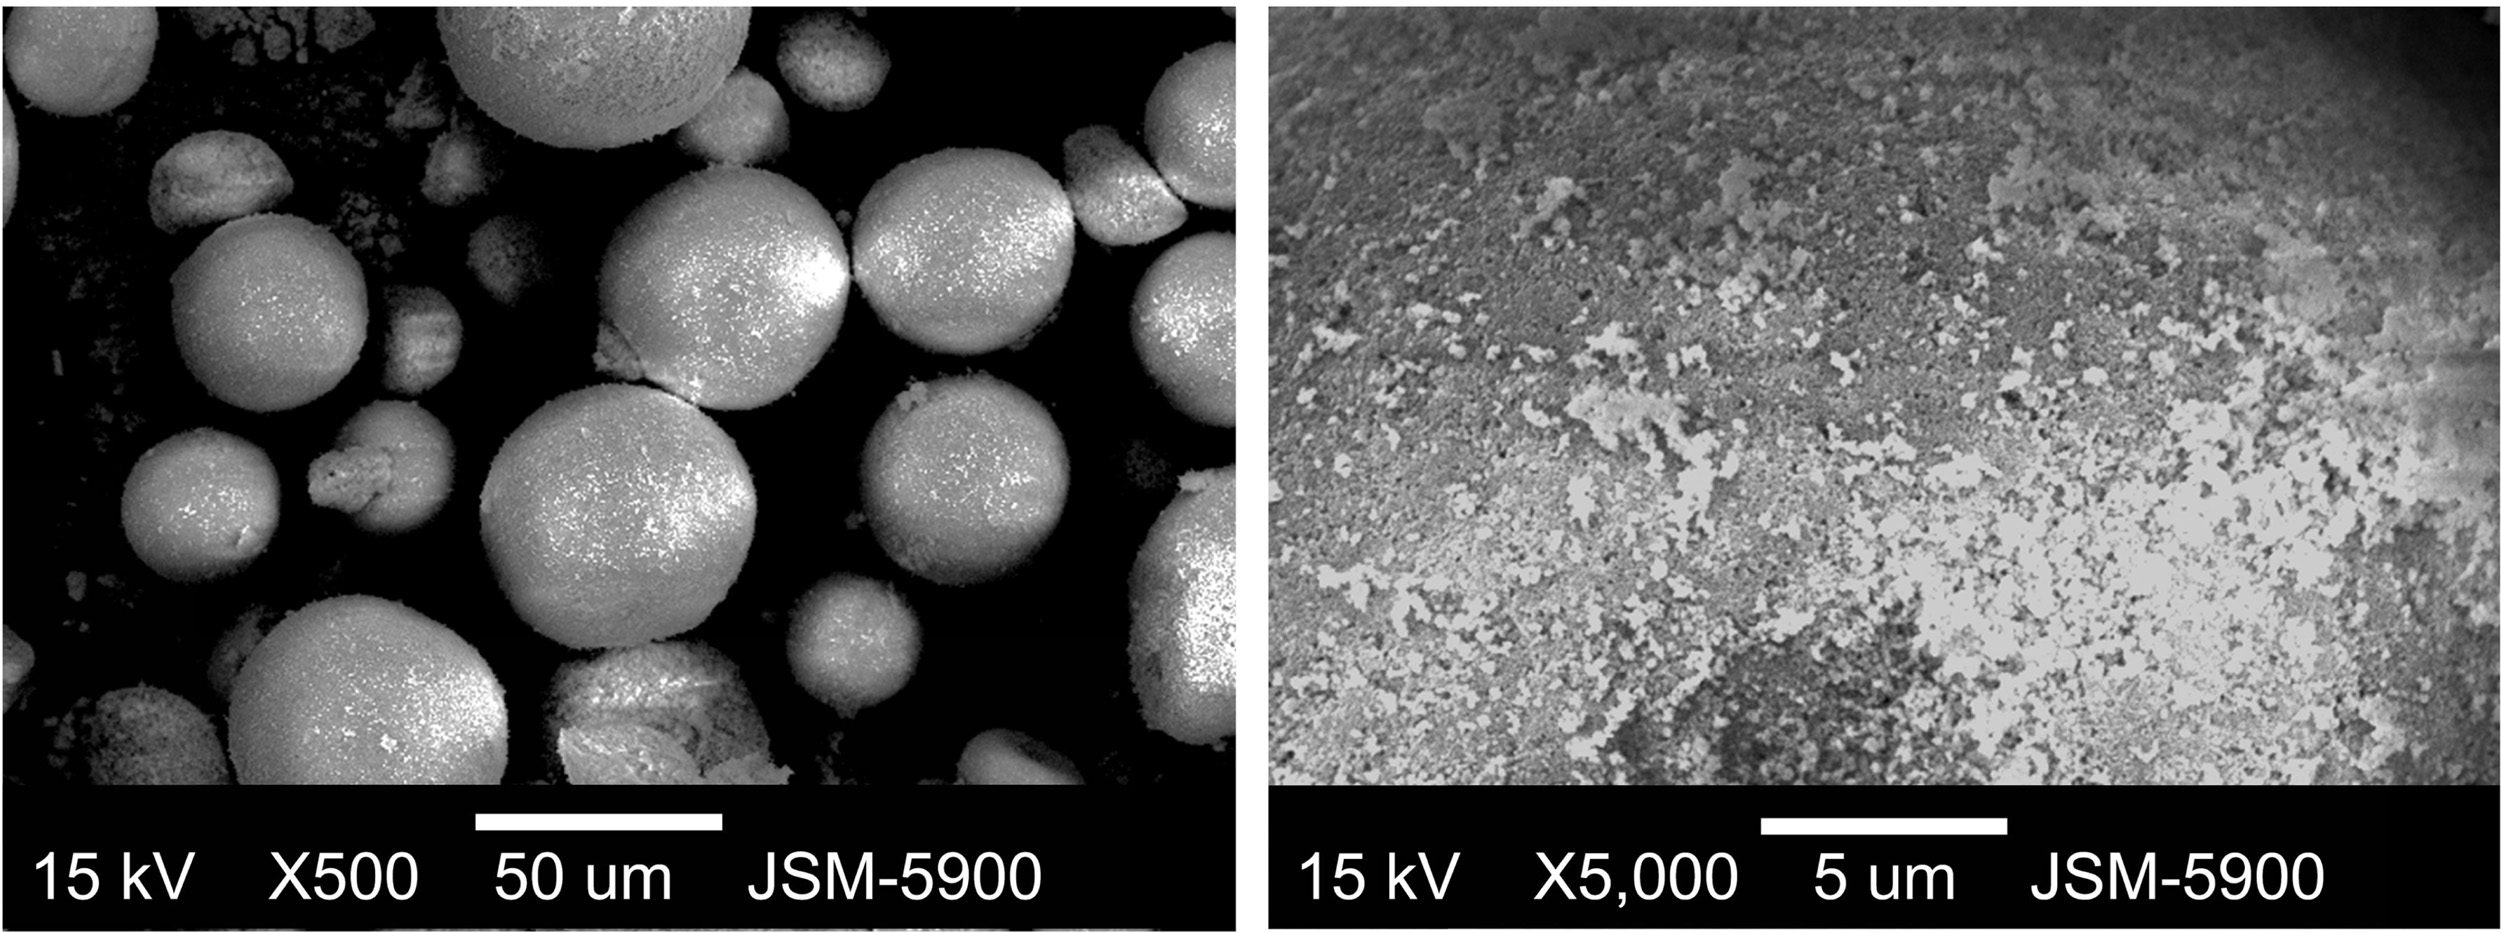
The SEM micrographs of YSZ at different magnifi- cations are shown in Fig. 2.
The particles were spherical and the particle sizes were not
homogeneous. The surfaces of particles were not smooth. The particles appeared
to consist of fine particles, their surfaces having many defects.
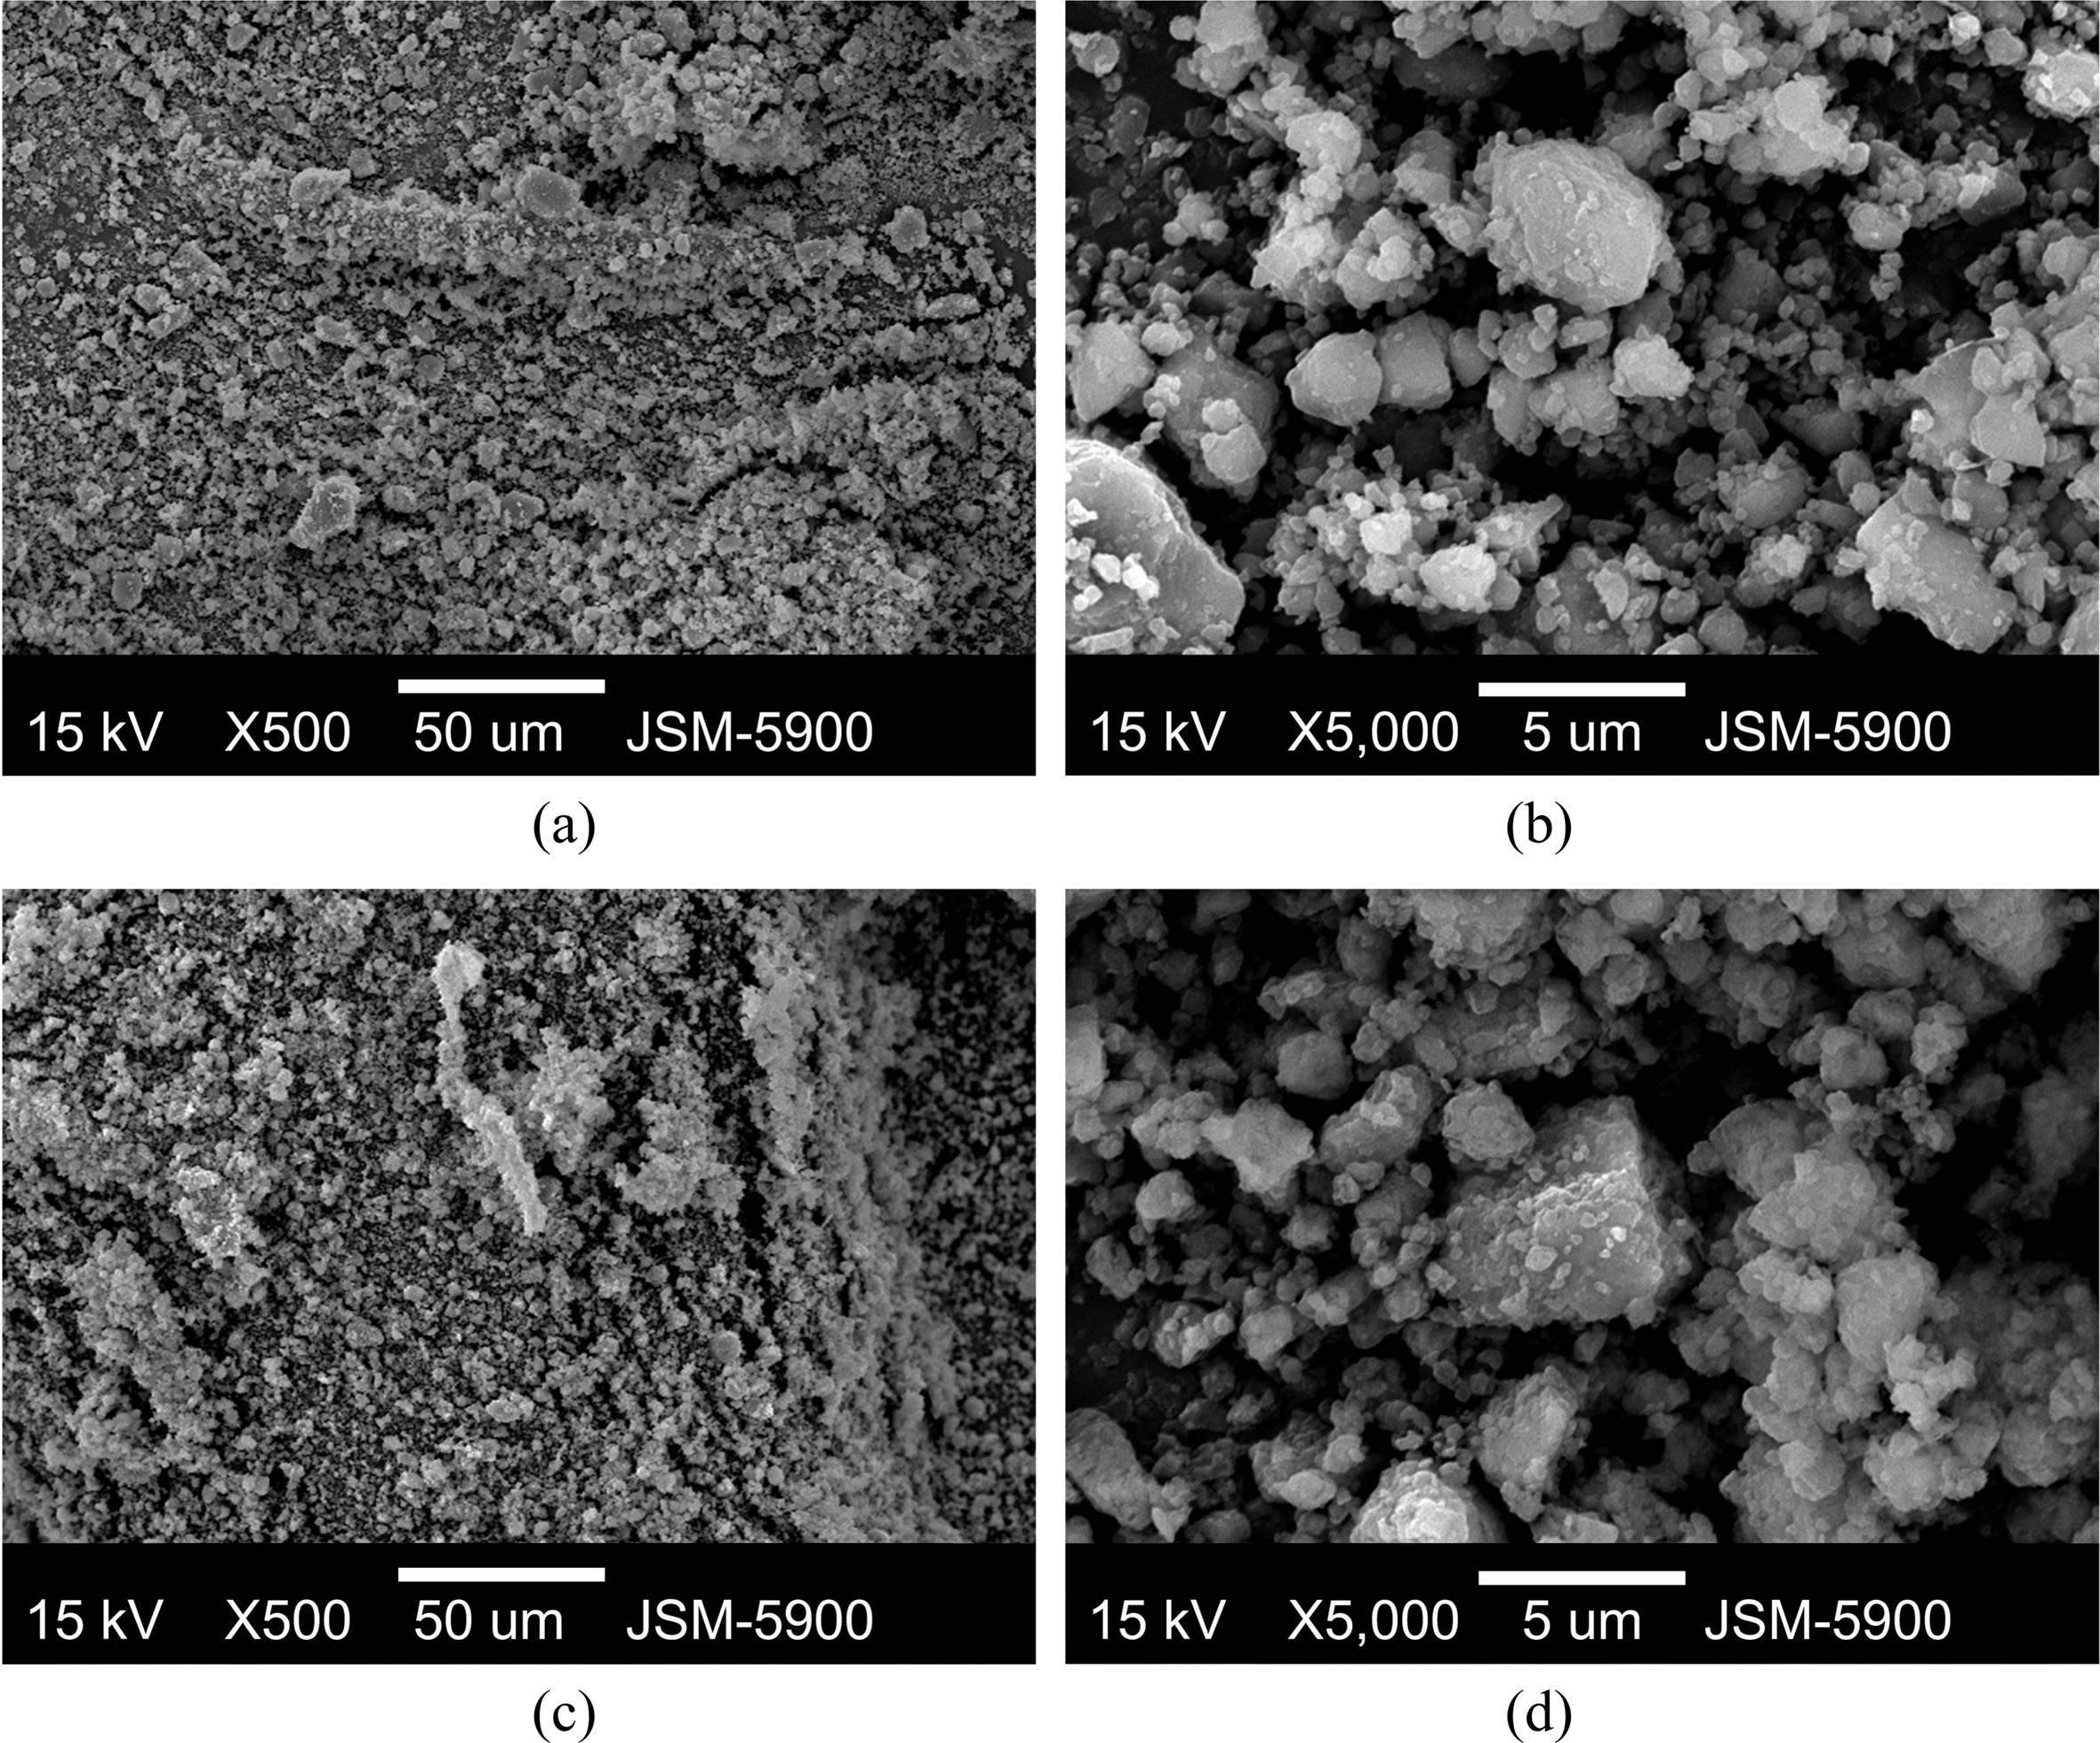
Fig. 3 shows the SEM micrographs at different
magnifications of Mg-2.5YSZ-2.5Ni-2.5graphene after reactive mechanical grinding
and dehydrided at the 4th hydriding-dehydriding cycle. The particle
sizes of the sample after reactive mechanical grinding were not homogeneous.
The surfaces of the particles were smooth. The
particles of this sample were much smaller than those of YSZ, indicating that
the YSZ particles were pulverized during reactive mechanical grinding. The particle
sizes of the sample dehydrided at the 4th hydriding-dehydriding
cycle were not homogeneous, either. The particle sizes of this sample were
similar to, but very slightly larger than, those of the sample after reactive
mechanical grinding. Maintenance at relatively high
temperatures during hydriding-dehydriding cycling is believed
to have brought about the sintering of particles and led to the very slight increase
in particle size.
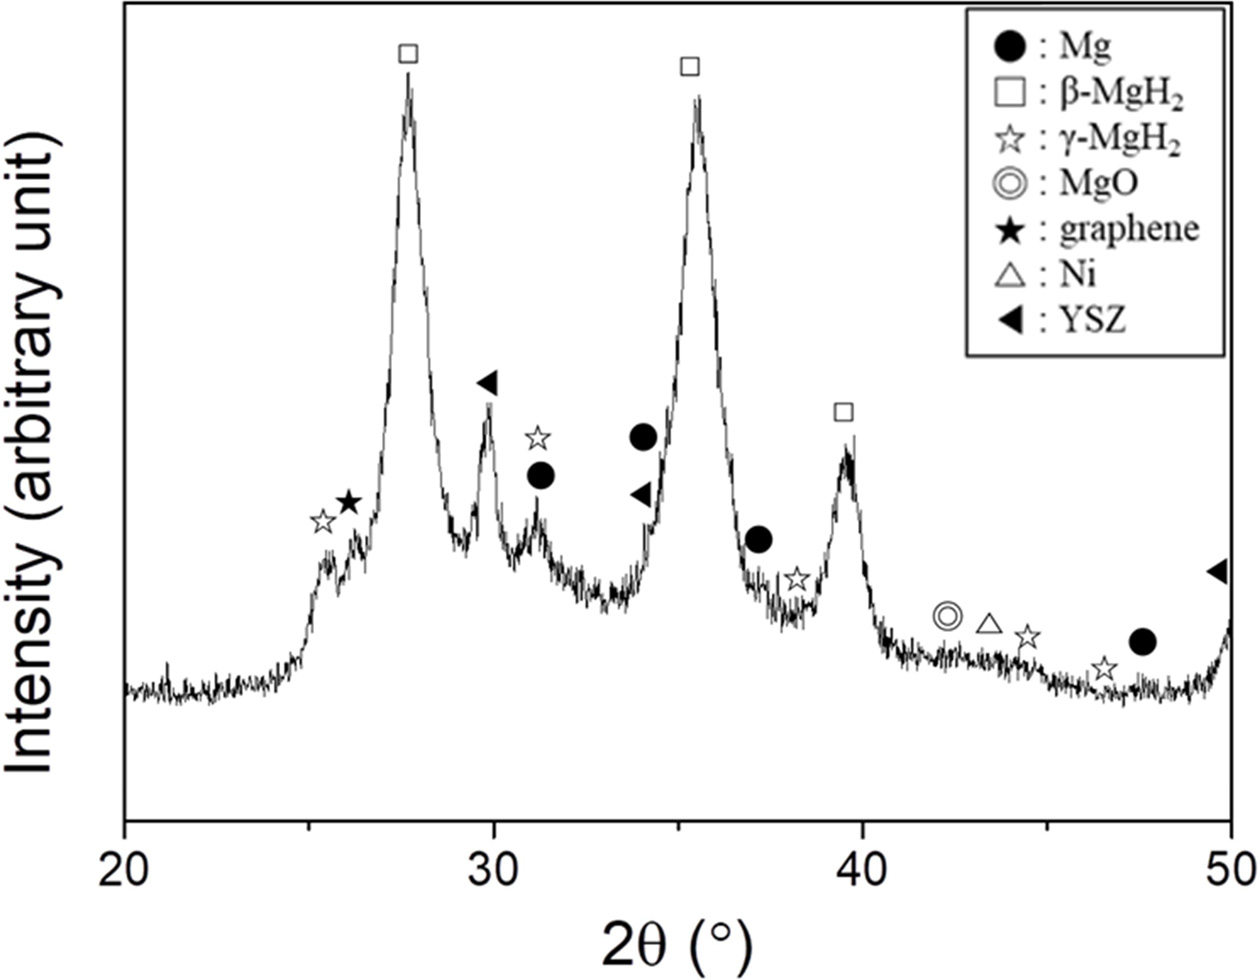
Fig. 4 shows the XRD pattern of
Mg-2.5YSZ-2.5Ni-2.5graphene after reactive mechanical grinding. The peaks were
quite broad and the background of the XRD pattern was quite high, showing that
reactive mechanical grinding had led to the formation of very small
crystallites. The sample contained a large amount of β-MgH2 with
small amounts of Mg, γ-MgH2, YSZ, Ni, graphene, and MgO. β-MgH2
and γ-MgH2 were formed by the reaction of Mg with H2
during grinding in hydrogen. The β-MgH2 is a low-pressure form of
magnesium hydride with tetragonal structure. The γ-MgH2 is a
high-pressure form of magnesium hydride with an orthorhombic unit cell
structure of α-PbO2 type, which usually forms in high hydrogen
pressure. MgO is believed to have been formed by the reaction of Mg with oxygen
adsorbed on the surfaces of as-purchased Mg particles.
Table 1 presents the variations in Ha with t at
623 K in 12 bar H2 at CN = 1-4 for Mg-2.5YSZ-2.5Ni-2.5graphene.
As the number of cycles, n, increased from one to two, the initial hydriding
rate increased and from n = 2 to n = 3 or n = 4, the initial hydriding rate
decreased. The quantity of hydrogen absorbed for 60 min, Ha (60
min), increased from one to two, and decreased and from n = 2
to n = 4. From n = 1 to n = 2, the increase in the initial
hydriding rate was very large. Mg-2.5YSZ-2.5Ni-2.5 graphene absorbed 1.73 wt% H for 10 min
and 5.93 wt% H for 60 min at n = 1 and absorbed 5.50 wt% H for 10 min and 6.85
wt% H for 60 min at n = 2.
Table 2 presents the variations in Hd with t at
623 K in 1.0 bar H2 at n = 1-4 for Mg-2.5YSZ-2.5Ni-2.5graphene.
At n = 1, the initial dehydriding rate of Mg-2.5YSZ-2.5Ni-2.5graphene was quite
high and the quantity of hydrogen released for 60 min, Hd (60 min),
was quite large. As n increased from one to three, the initial dehydriding rate
decreased and the initial dehydriding rate increased from n = 3 to n = 4. The
quantity of hydrogen released for 60 min, Hd (60 min), increased
from n = 1 to n = 2 and decreased from n = 2 to n = 3 or n = 4.
Mg-2.5YSZ-2.5Ni-2.5graphene released 2.82 wt% H for 2.5 min and 5.23 wt% H for
60 min at n = 1 and released 2.73 wt% H for 2.5 min and 5.64 wt% H for 60 min
at n = 2.
Table 1 and 2 show that the activation of
Mg-2.5YSZ-2.5Ni-2.5graphene was completed after n = 2. An effective hydrogen
storage capacity was defined as the quantity of hydrogen absorbed for 60 min.
Mg-2.5YSZ-2.5Ni-2.5graphene had a high effective hydrogen-storage
capacity of almost 7 wt% (6.85 wt%) at 623 K in 12 bar H2 at n = 2.
The XRD pattern of Mg-2.5YSZ-2.5Ni-2.5graphene dehydrided
at the 4th hydriding-dehydriding cycle showed that the
sample contained a large amount of Mg and small amounts
of MgO and β-MgH2. Very small amounts of C, Mg2Ni,
and YSZ were also observed. MgO is believed to have been formed by the reaction
of Mg with oxygen adsorbed on the surfaces of Mg particles during treatment the
sample to obtain the XRD pattern. Graphene was changed to carbon after
hydriding-dehydriding cycling. Mg2Ni is believed to have been formed
by the reaction of Mg with Ni. The γ-MgH2, which was observed after
reactive mechanical grinding, is believed to have been transformed to β-MgH2
during hydriding-dehydriding cycling. The peaks in the XRD pattern were
sharp and the background of the XRD pattern was very high, showing that the
sample was well crystallized. The sample, which was quite amorphous
after reactive mechanical grinding, became crystalline.
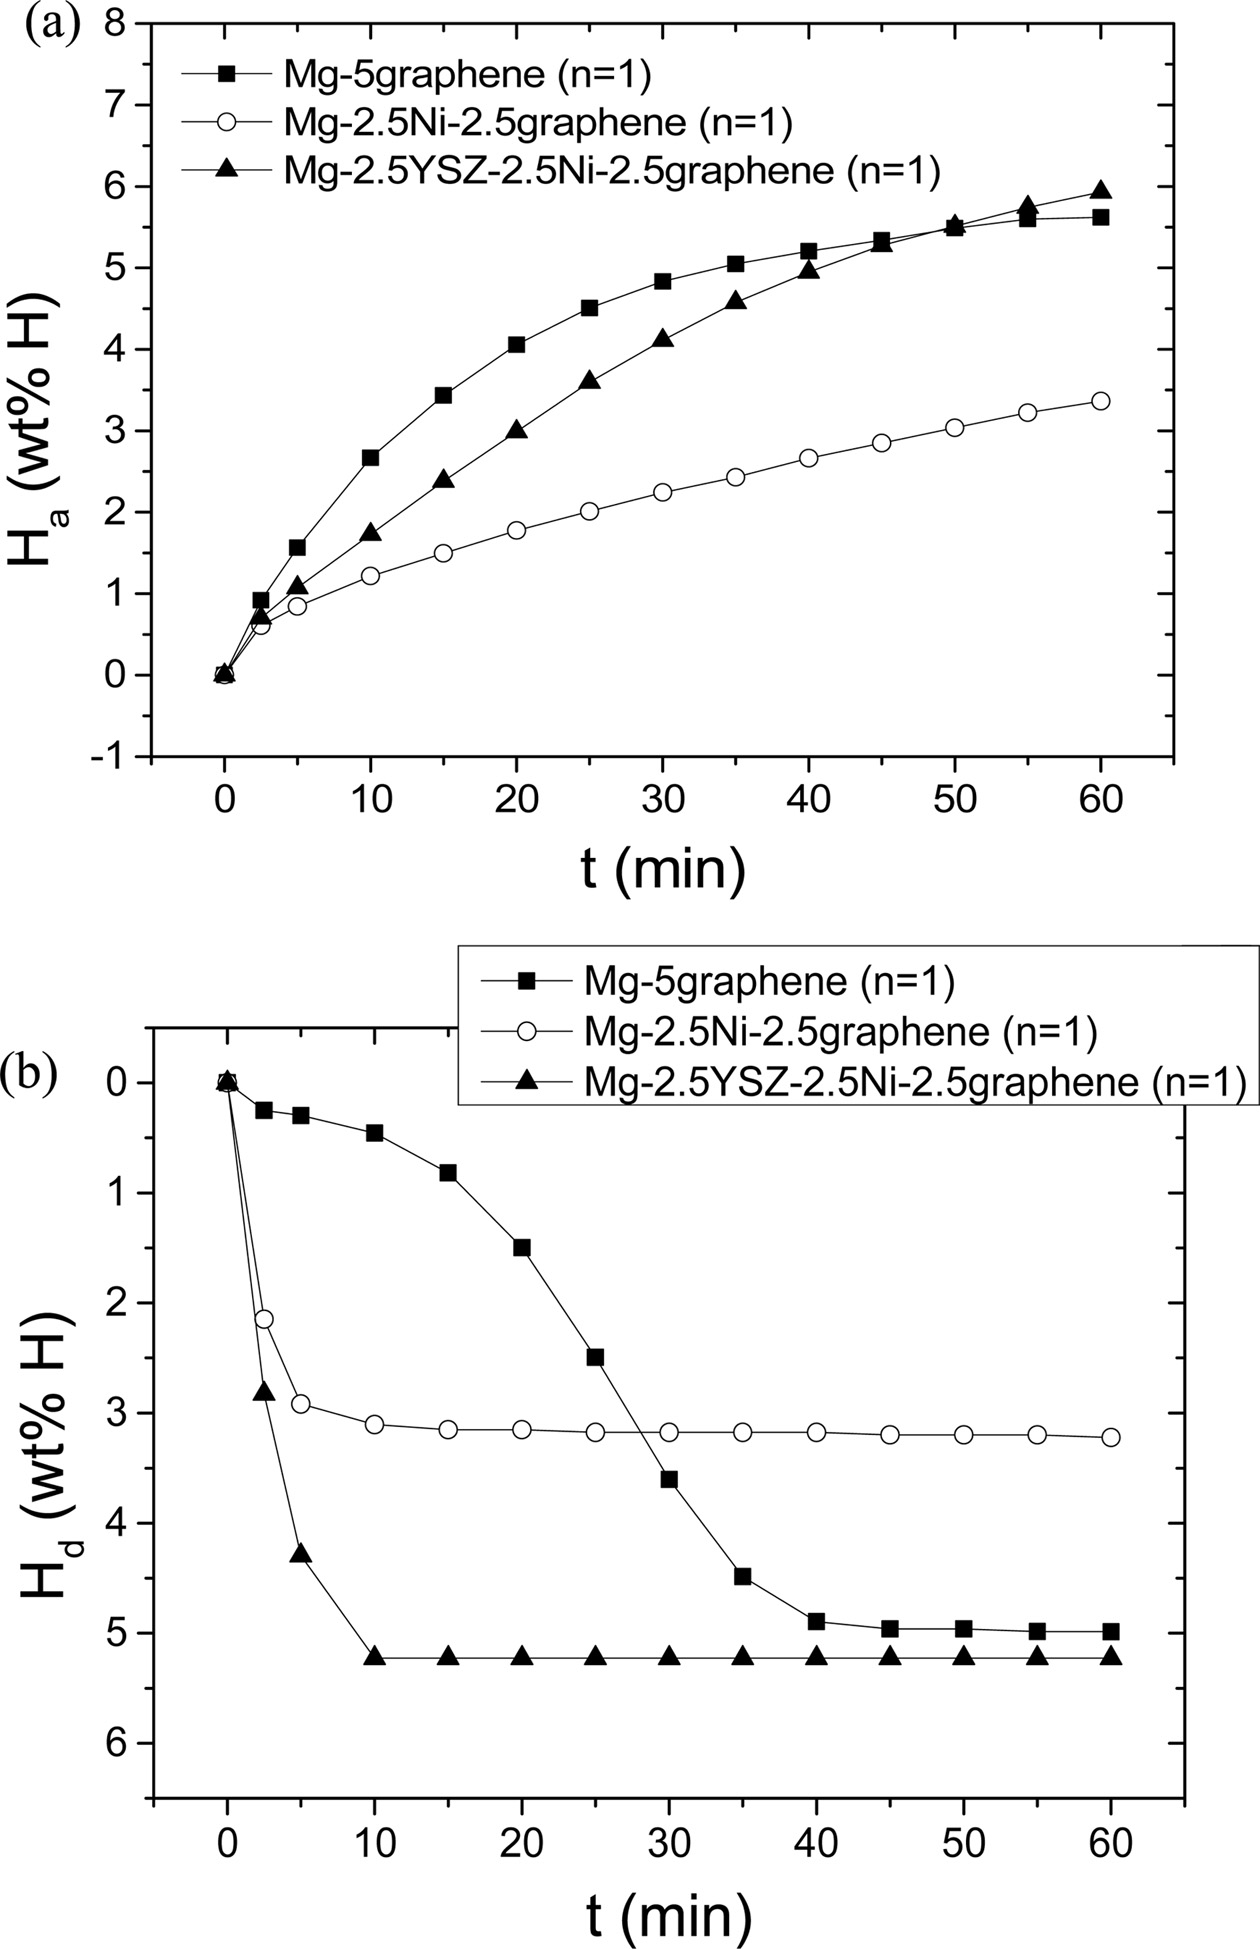
Fig. 5 shows the Ha vs. t curves at 623 K in 12
bar H2 and the Hd vs. t curves at 623 K in 1.0 bar H2
at n = 1 of a 95 wt% Mg + 5 wt% graphene alloy (named Mg-5graphene),
a 95 wt% Mg + 2.5 wt% Ni + 2.5 wt% graphene alloy (named Mg-2.5Ni-2.5graphene),
and Mg-2.5YSZ-2.5Ni-2.5graphene. Mg-5graphene and Mg-2.5Ni-2.5graphene
were prepared under similar conditions to those for preparing
Mg-2.5YSZ-2.5Ni-2.5graphene. Mg-5graphene had the highest initial hydriding
rate, followed in order by Mg-2.5YSZ-2.5Ni-2.5graphene and Mg-2.5Ni-2.5graphene.
Mg-2.5YSZ-2.5Ni-2.5graphene had the largest Ha (60 min), followed in
order by Mg-5graphene and Mg-2.5Ni-2.5graphene. Mg-2.5YSZ-2.5Ni-2.5graphene
absorbed 1.73 wt% H for 10 min and 5.93 wt% H for 60 min. Mg-5graphene absorbed
2.67 wt% H for 10 min and 5.62 wt% H for 60 min. Table 3
presents the variations in Ha with t at 623 K in 12 bar H2
at n = 1 for Mg-5graphene, Mg-2.5Ni-2.5 graphene, and
Mg-2.5YSZ-2.5Ni-2.5graphene. Mg-2.5YSZ-2.5Ni-2.5graphene dehydrided
at the 4th hydriding-dehydriding cycle contained Mg2Ni
phase. Mg-2.5Ni-2.5graphene after hydriding-dehydriding cycling also contained
the Mg2Ni phase. Mg2Ni is known to have higher hydriding
and dehydriding rates than Mg. The equilibrium plateau pressures at 623 K of
the Mg-H and Mg2Ni-H systems are 5.90 bar and 9.24 bar, respectively
[31, 32]. At 623 K in 12 bar H2, the driving forces for
the hydriding reaction of Mg and Mg2Ni, which are related to the
difference between the applied hydrogen pressure (12 bar H2 in this
work) and the equilibrium plateau pressure, were 6.10 bar and 2.76 bar,
respectively. The slow nucleation of Mg2NiH4 in Mg-2.5YSZ-2.5Ni-2.5graphene
and Mg-2.5Ni-2.5graphene due to the small driving force is believed to have led
to the lower initial hydriding rates of Mg-2.5YSZ-2.5Ni-2.5graphene and
Mg-2.5Ni-2.5graphene than that of Mg-5graphene. Mg-2.5YSZ-2.5Ni-2.5graphene had
a higher initial hydriding rate than Mg-2.5Ni-2.5graphene, suggesting
that the addition of YSZ increased the initial hydriding
rate. After a relatively long time, for example, after 60
min, the quantity of hydrogen absorbed by Mg-2.5YSZ-2.5Ni-2.5graphene
was larger than those by Mg-5graphene
and Mg-2.5Ni-2.5graphene. Mg-5graphene released a small amount of
hydrogen in the beginning (for 2.5 min) and then released hydrogen very slowly.
Thereafter, the dehydriding rate of Mg-5graphene increased
slowly, reaching its maximum after about 25 min, and was very low after 40 min.
The Hd vs. t curve for Mg-5graphene exhibited an S-shaped curve,
showing that the dehydriding reaction of Mg-5graphene progressed by the
nucleation and growth mechanism. Mg-2.5YSZ-2.5Ni-2.5graphene had the highest
initial dehydriding rate, followed in order by Mg-2.5Ni-2.5graphene and
Mg-5graphene. Mg-2.5YSZ-2.5Ni-2.5graphene had the largest Hd
(60 min), followed in order by Mg-5graphene and
Mg-2.5Ni-2.5graphene. At 623 K in 1.0 bar H2, the driving forces for
the dehydriding reaction of Mg and Mg2Ni, which are related to the
difference between the equilibrium plateau pressures and the applied hydrogen
pressure (1.0 bar H2 in this work), were 4.90 bar and 8.24
bar, respectively. The rapid nucleation of the Mg2Ni-H
solid solution in Mg-2.5Ni-2.5graphene and Mg-2.5YSZ-2.5Ni-2.5graphene
due to the large driving force is believed to have led to the
higher initial dehydriding rates of Mg-2.5Ni-2.5graphene and
Mg-2.5YSZ-2.5Ni-2.5graphene than that of Mg-2.5graphene. The addition of YSZ
also increased the initial dehydriding rate and Hd (60
min), compared with those of Mg-2.5Ni-2.5graphene.
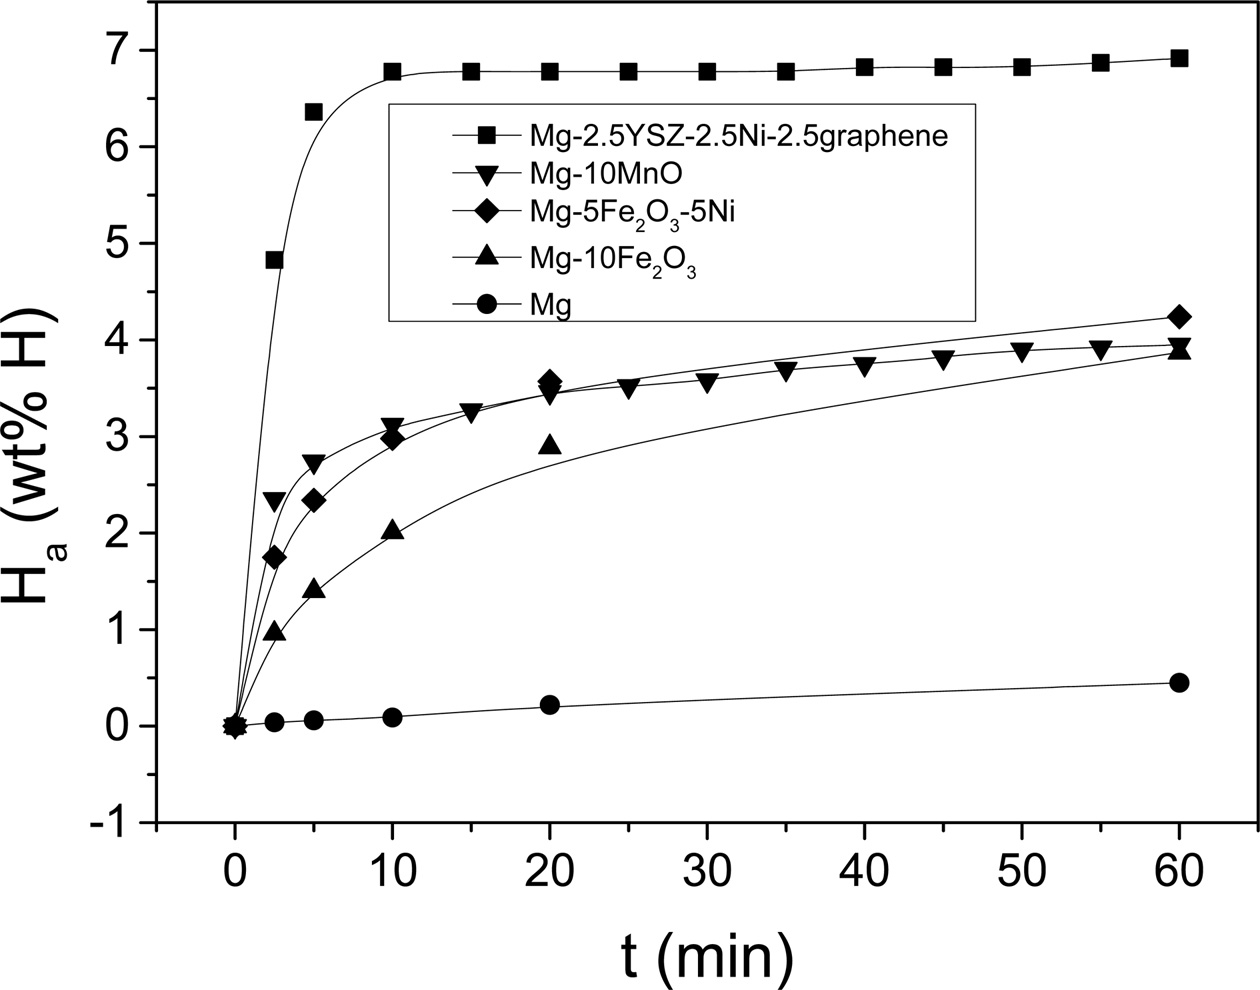
Fig. 6 shows the Ha vs. time t curves at 593 K
in 12 bar H2 at n = 1 for pure Mg (named Mg) [33], a 90 wt% Mg + 10
wt% MnO alloy (named Mg-10MnO) [34], a 90 wt% Mg + 10 wt% Fe2O3
alloy (named Mg-10Fe2O3) [35], 90 wt% Mg + 5 wt% Fe2O3
+ 5 wt% Ni (named Mg-5Fe2O3-5Ni) [35], and
Mg-2.5YSZ-2.5Ni-2.5graphene. The starting materials to prepare the
sample Mg-10MnO (at a revolution speed 250 rpm and by reactive
mechanical grinding for 2 h) were Mg powder (particle size 50 μm) and MnO
(88-250 μm, purity 99%, Aldrich) [34]. The starting materials to prepare the
samples Mg-10Fe2O3 and Mg-5Fe2O3-5Ni
(at a revolution speed 250 rpm and by reactive mechanical grinding for 2 h)
were Mg (assay ≥ 99%, grit; 50~150 mesh, Fluka,), Fe2O3
(nano-sized Fe2O3, prepared by spray conversion process,
about 36 nm), and Ni (purity 99.9%, average ~5 μm, CERAC) [35]. The Mg, Mg-10MnO,
Mg-10Fe2O3, and Mg-5Fe2O3-5Ni
samples were prepared under similar conditions to
those for preparing Mg-2.5YSZ-2.5Ni-2.5graphene. The Mg
absorbed hydrogen very slowly. Mg-2.5YSZ-2.5Ni-2.5graphene had the
highest initial hydriding rate, followed in order by Mg-10MnO,
Mg-5Fe2O3-5Ni, Mg-10Fe2O3, and Mg.
Mg-2.5YSZ-2.5Ni-2.5graphene had the largest Ha (60 min),
followed in order by Mg-5Fe2O3-5Ni, Mg-10MnO,
Mg-10Fe2O3, and Mg. Mg absorbed 0.04 wt% H for 2.5 min,
and 0.45 wt% H for 60 min [35]. Mg-2.5YSZ-2.5Ni-2.5graphene absorbed
4.83 wt% H for 2.5 min and 6.92 wt% H for 60 min. On the other hand, Mg-10Fe2O3
absorbed 0.96 wt% H for 2.5 min and 3.87 wt% H for 60 min
[35]. Table 4 summarizes the variations in absorbed hydrogen quantity (wt% H)
with time at 593 K in 12 bar H2 at n = 1 for these samples [33-35].
The considerably higher initial hydriding rate and
considerably larger Ha (60 min) of Mg-2.5YSZ-2.5Ni-2.5graphene
than Mg show that the addition of YSZ, Ni, and graphene significantly increased
the initial hydriding rate and Ha (60 min).
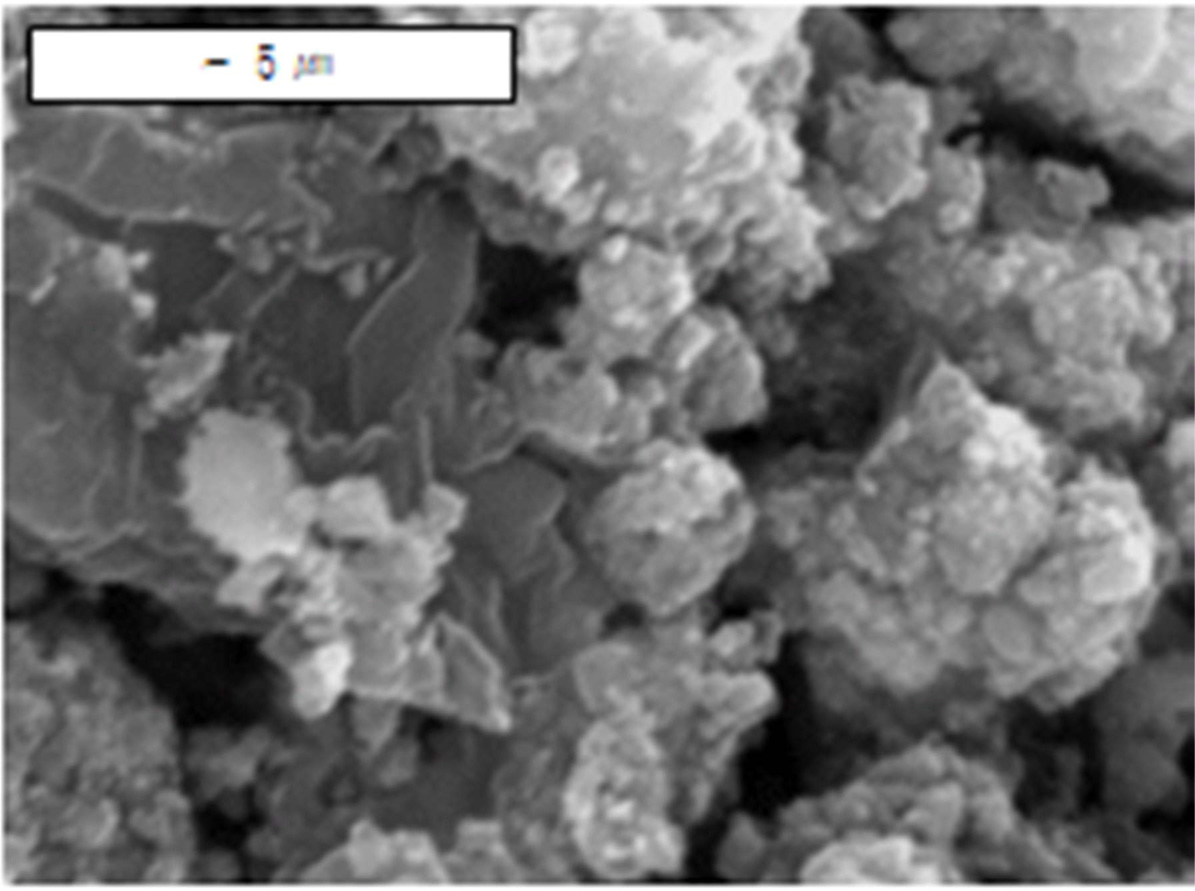
A SEM micrograph of Mg-10Fe2O3
hydrided at the 12th hydriding-dehydriding cycle [35] is shown in
Fig. 7. The particles of this sample were larger than those of
Mg-2.5YSZ-2.5Ni-2.5graphene dehydrided at the 4th
hydriding-dehydriding cycle, supporting well that the activated
Mg-2.5YSZ-2.5Ni-2.5graphene had a much higher initial hydriding rate and much
larger Ha (60 min) than the activated Mg-10Fe2O3.
The reactive mechanical
grinding of Mg with YSZ, Ni, and graphene is believed to have created defects
(leading to facilitation of nucleation), produced cracks and clean surfaces
(leading to increase in reactivity), and decreased particle sizes (leading to
diminution of diffusion distances or
increasing the flux of the diffusing hydrogen atoms) [36-43].
|
Fig. 1 Variations in (a) the initial hydriding rate and (b) the quantity of hydrogen absorbed for 60 min, Ha (60 min), at 593K in 12 bar H2 with the powder to ball ratio at n = 1 and after activation (at n = 2) for Mg-10Fe2O3. |
|
Fig. 2 SEM micrographs of YSZ at different magnifications. |
|
Fig. 3 SEM micrographs at different magnifications of Mg-2.5YSZ-2.5Ni-2.5graphene (a, b) after reactive mechanical grinding and (c, d) dehydrided at the 4th hydriding-dehydriding cycle. |
|
Fig. 4 XRD pattern of Mg-2.5YSZ-2.5Ni-2.5graphene after reactive mechanical grinding. |
|
Fig. 5 (a) Ha vs. t curves at 623 K in 12 bar H2 and (b) Hd vs. t curves at 623 K in 1.0 bar H2 at n = 1 for Mg-5graphene, Mg-2.5Ni-2.5graphene, and Mg-2.5YSZ-2.5Ni-2.5graphene. |
|
Fig. 6 Ha vs. t curves at 593 K in 12 bar H2 at n = 1 for Mg [33], Mg-10MnO [34], Mg-10Fe2O3 [35], Mg-5Fe2O3-5Ni [35], and Mg-2.5YSZ-2.5Ni-2.5graphene. |
|
Fig. 7 A SEM micrograph of Mg-10Fe2O3 hydrided at the 12th hydriding-dehydriding cycle [35]. |
|
Table 1 Variations in Ha with t at 623 K in 12 bar H2 at n = 1-4 for Mg-2.5YSZ-2.5Ni-2.5graphene. |

|
Table 2 Variations in Hd with t at 623 K in 1.0 bar H2 at n = 1-4 for Mg-2.5YSZ-2.5Ni-2.5graphene. |

|
Table 3 Variations in Ha with t at 623 K in 12 bar H2 at n = 1 for Mg-5graphene, Mg-2.5Ni-2.5graphene, and Mg-2.5YSZ-2.5Ni-2.5graphene. |

|
Table 4 Variations in absorbed hydrogen quantity (wt% H) with time at 593 K in 12 bar H2 at n = 1 for Mg, Mg-10MnO, Mg-10Fe2O3, Mg-5Fe2O3-5Ni, and Mg-2.5YSZ-2.5Ni -2.5graphene. |

The optimum powder to ball ratio for Mg-10 Fe2O3
was 1/45, which is one of the important conditions in reactive mechanical
grinding processing. Samples with a composition of 92.5 wt% Mg +
2.5 wt% YSZ + 2.5 wt% Ni + 2.5 wt% graphene (designated as Mg-2.5YSZ-2.5Ni-2.5graphene)
were prepared by grinding in hydrogen.
Mg-2.5YSZ-2.5Ni-2.5graphene was completely activated
after n = 2, having an effective hydrogen-storage capacity (the quantity of
hydrogen absorbed for 60 min) of almost 7 wt% (6.85 wt%) at 623 K in 12 bar H2
at n = 2. The sample absorbed 5.50 wt% H for 10 min and 6.85 wt% H for 60 min
in 12 bar H2 and released 2.73 wt% H for 2.5 min and 5.64 wt% H for
60 min in 1.0 bar H2, at 623 K at n = 2. Mg-2.5YSZ-2.5Ni-2.5graphene
contained Mg2Ni phase after hydriding-dehydriding
cycling. The slow nucleation of Mg2NiH4 in
Mg-2.5YSZ-2.5Ni-2.5graphene and Mg-2.5Ni-2.5 graphene due to the small driving
force is believed to have led to the lower initial hydriding rates than that of
Mg-5graphene. Mg-2.5YSZ-2.5Ni-2.5graphene had a higher
initial hydriding rate than Mg-2.5Ni-2.5graphene, suggesting
that the addition of YSZ increased the initial hydriding
rate. Mg-2.5YSZ-2.5Ni-2.5graphene had a larger Ha (60 min) than
Mg-2.5Ni-2.5graphene and Mg-2.5graphene. The rapid nucleation
of Mg2Ni-H solid solution in Mg-2.5Ni-2.5graphene and
Mg-2.5YSZ-2.5Ni-2.5graphene due to the large driving force is believed to have
led to their higher initial dehydriding rates than that of Mg-2.5graphene. The
addition of YSZ also increased the initial dehydriding rate and the Hd
(60 min), compared with those of Mg-2.5Ni-2.5 graphene. Y2O3-stabilized
ZrO2, Ni, and graphene-added Mg had a
higher initial hydriding rate and larger Ha (60 min) than Fe2O3,
MnO, or Ni and Fe2O3-added Mg at the first cycle.
This research was supported by Basic
Science Research Program through the National Research Foundation
of Korea (NRF) funded by the Ministry of Education (grant number
NRF-2017R1D1A1B03030515). This paper was supported by the
selection of research-oriented professor of Jeonbuk National University in
2019.
- 1. M.Y. Song, Y.J. Kwak, S.H. Lee, and H.R. Park, Korean J. Met. Mater. 51[2] (2013) 119-123.
-

- 2. Y. Wang, K. Luo, W. Ye, S. Du, J.S.Francisco, J. Yin, and P. Gao, Int. J. Hydrogen Energy 44[29] (2019) 15239-15245.
-

- 3. S. Niyomsoan, D.R. Leiva, R.A. Silva, L.F. Chanchetti, R.N. Shahid, S.Scudino, P. Gargarella, and W.J. Botta, Int. J. Hydrogen Energy 44[29] (2019) 23257-23266.
-

- 4. M.Y. Song, E. Choi, and Y.J. Kwak, Int. J. Hydrogen Energy 44[29] (2019) 3779-3789.
-

- 5. Y.J. Kwak, S.H. Lee, and M.Y. Song, J. Nanosci. Nanotech. 18[9] (2018) 6040-6046.
-

- 6. M.Y. Song, E. Choi, andY.J. Kwak, Mater. Res. Bull. 108 (2018) 23-31.
-

- 7. Y.J. Kwak, E. Choi, and M.Y. Song, Met. Mater. Int. 24[5] (2018) 1181-1190.
-

- 8. S.H. Hong, S.N. Kwon, and M.Y. Song, Korean J. Met. Mater. 49[4] (2011) 298-303.
-

- 9. J.J. Reilly and R.H. Wiswall Jr, Inorg. Chem. 7[11] (1968) 2254-2256.
-

- 10. J.M. Boulet and N. Gerard, J. Less-Common Met. 89 (1983) 151-161.
-

- 11. W. Oelerich, T. Klassen, and R. Bormann, J. Alloys Compd. 322 (2001) L5-9.
-

- 12. Z. Dehouche, T. Klassen, W. Oelerich, J. Goyette, T.K. Bose, and R. Schulz, J. Alloys Compd. 347 (2002) 319-323.
-

- 13. G. Barkhordarian, T. Klassen, and R. Bormann, Scripta Materialia 49 (2003) 213-217.
-

- 14. G. Barkhordarian, T. Klassen, and R. Bormann, J. Alloys Compd. 407[1-2] (2006) 249-255.
-

- 15. O. Friedrichs, T. Klassen, J.C. Sánchez-López, R. Bormann, and A. Fernández, Scripta Materialia 54[7] (2006) 1293-1297.
-

- 16. O. Friedrichs, F. Aguey-Zinsou, J.R. Ares Fernández, J.C. Sánchez-López, A. Justo, T. Klassen, R. Bormann, and A. Fernández, Acta Materialia 54[1] (2006) 105-110.
-

- 17. K.F. Aguey-Zinsou, J.R. Ares Fernandez, T. Klassen, and R. Bormann, Mat. Res. Bull. 41[6] (2006) 1118-1126.
-

- 18. M.Y. Song, J-L. Bobet, and B. Darriet, J. Alloys Compd. 340 (2002) 256-262.
-

- 19. S. Long, J. Zou, Y. Liu, X. Zeng, and W. Ding, J. Alloys Compd. 580 (Supplement 1) (2013) S167-170.
-

- 20. S. Long, J. Zou, Xi Chen, X. Zeng, and W. Ding, J. Alloys Compd. 615 (Supplement 1) (2014) S684-688.
-

- 21. J.-I. Song, G.-Y. Lee, J.-R. Kim, and J.-S. Lee, J. Cer. Proc. Res. 19[4] (2018) 279-284.
- 22. C.W. Park, J.H. Lee, S.H. Kang, J.H. Park, H.M. Kim, H.S. Kang, H.A. Lee, J.H. Lee, J.H. In, and K.B. Shim, J. Cer. Proc. Res. 19[2] (2018) 179-182.
- 23. S.-M. Sim, J. Cer. Proc. Res. 19[1] (2018) 1-4.
- 24. https://en.wikipedia.org/wiki/Yttria-stabilized_zirconia
- 25. S.-H. Hong and M.Y. Song, Korean J. Met. Mater. 54[2] (2016) 125-131.
-

- 26. M.Y. Song, Y.J. Kwak, S.H. Lee, and H.R. Park, Korean J. Met. Mater. 54[3] (2016) 210-216.
-

- 27. M.Y. Song, Y.J. Kwak, and H.R. Park, Korean J. Met. Mater. 54[7] (2016) 503-509.
-

- 28. S.N. Kwon, H.R. Park, and M.Y. Song, Korean J. Met. Mater. 54[7] (2016) 510-519.
- 29. https://en.wikipedia.org/wiki/Graphene
- 30. M.Y. Song, S.H. Baek, J.-L. Bobet, and S.H. Hong, Int. J. Hydrogen Energy 35 (2010) 10366-10372.
-

- 31. M.Y. Song and Y.J. Kwak, Korean J. Met. Mater. 56[3] (2018) 244-251.
- 32. M.Y. Song and H.R. Park, J. Alloys Compd. 270 (1998) 164-167.
-

- 33. M.Y. Song, Y.J. Kwak, S.H. Lee, and H.R. Park, Bull. Mater. Sci. 37[4] (2014) 831-835.
-

- 34. M.Y. Song, I.H. Kwon, S.N. Kwon, C.G. Park, S.H. Hong, J.S. Bae, and D.R. Mumm, J. Alloys Compd. 415 (2006) 266-270.
-

- 35. S.N. Kwon, Improvement of the hydrogen absorption and desorption kinetics of Mg by catalytic effects of Fe2O3 and Ni, M.E. thesis, Jeonbuk National University, February 22, 2008.
- 36. M.Y. Song, S.H. Lee, and D.R. Mumm, J. Cer. Proc. Res. 19[3] (2018) 211-217.
- 37. M.Y. Song, Y.J. Kwak, and S.H. Lee, J. Cer. Proc. Res. 20[2] (2019) 173-181.
- 38. S.-H. Hong and M.Y. Song, Korean J. Met. Mater. 56[2] (2018) 155-162.
-

- 39. M.Y. Song, E. Choi, and Y.J. Kwak, Korean J. Met. Mater. 56[5] (2018) 392-399.
-

- 40. M.Y. Song, Y.J. Kwak, and E. Choi, Korean J. Met. Mater. 56[7] (2018) 524-531.
-

- 41. M.Y. Song and Y.J. Kwak, Korean J. Met. Mater. 56[8] (2018) 611-619.
-

- 42. M.Y. Song, E. Choi, and Y.J. Kwak, Korean J. Met. Mater. 56[8] (2018) 620-627.
-

- 43. M.Y. Song and Y.J. Kwak, Korean J. Met. Mater. 56[12] (2018) 878-884.
-

 This Article
-
2019; 20(6): 609-616
Published on Dec 31, 2019
- 10.36410/jcpr.2019.20.6.609
- Received on Aug 5, 2019
- Revised on Sep 26, 2019
- Accepted on Oct 7, 2019
 Services
- Abstract
introduction
experimental details
results and discussions
conclusions
- Acknowledgements
- References
- Full Text PDF
Shared
 Correspondence to
- Myoung Youp Song
-
Division of Advanced Materials Engineering, Hydrogen & Fuel Cell Research Center, Engineering Research Institute, Jeonbuk National University, 567 Baekje-daero, Deokjin-gu, Jeonju 54896, Korea
Tel : +82-63-270-2379 Fax: +82-63-270-2386 - E-mail: songmy@jbnu.ac.kr


 Copyright 2019 International Orgranization for Ceramic Processing. All rights reserved.