- N2 plasma treatment of pigments with minute particle sizes to improve their dispersion properties in deionized water
Jingjing Zhanga, Yeong Min Parka, Xing Yan Tana, Mun Ki Baea, Dong Jun Kima, Tae Hwan Janga, Min Su Kima, Seung Whan Leeb and Tae Gyu Kimc,*
aDepartment of Nano Fusion Technology, Pusan National University, Busan, Korea
bPlasma Technology Research Center, National Fusion Research Institute, 37 Dongjangsan-ro, Gunsan-si, Jeollabuk-do, 54004, Korea
cDepartment of Nanomechatronics Engineering, Pusan National University, Busan, Korea
Pigments with minute particle
sizes, such as carbon black (CB) and pigment red 48:2 (P.R.48:2), are the most
important types of pigment and have been widely used in many industrial
applications. However, minute particles have large surface areas, high oil
absorption and low surface energy. They therefore tend to be repellent to the
vehicle and lose stability, resulting in significant increases in viscosity or
reaggregation in the vehicle. Therefore, finding the best way to improve the
dispersion properties of minute particle size pigments presents a major
technical challenge. In this study, minute particle types of CB and P.R.48:2
were treated with nitrogen gas plasma generated via radio frequency-plasma
enhanced chemical vapor deposition (RF-PECVD) to increase the dispersion
properties of minute particles in deionized (DI) water. The morphologies and
particle sizes of untreated and plasma treated particles were evaluated using
scanning electron microscopy (SEM) and atomic force microscopy (AFM). The
average distributions of particle size were measured using a laser particle
sizer. Fourier transform infrared spectroscopy was carried out on the samples
to identify changes in molecular interactions during plasma processing. The
results of our analysis indicate that N2 plasma treatment is an
effective method for improving the dispersibility of minute particles of
pigment in DI water.
Keywords: N2 Plasma, Plasma treatment, Dispersion, Aggregation, RF-CVD
Minute particles of pigment, including carbon black (CB)
and some organic pigments like pigment red 48:2 (P.R.48:2), which can have
primary particle sizes as small as a nanometer, have been widely used in
coatings, paintings, packing, printing inks, cosmetics, and other applications due to their
numerous advantages in terms of light sensitivity, color strength,
transparency, lightfastness, brilliance,
inherent stability, migration resistance, and so on [1-5].
Furthermore, as these minute pigments possess outstanding properties in terms
of heat resistance, oil resistance, acid or alkali fastness, weather fastness,
and friction resistance, they can also be widely used in tires and plastics,
and as fillers in rubber products [6, 7].
However, interaction forces between the particles (especially the van der
Waals forces) in relation to gravitational forces, as well as the
collision probabilities of the particles, will increase as
particle size decreases and the specific surface area increases [8]. Therefore,
minute particles can easily be aggregated and agglomerated when added to a
polymer matrix or a variety of media, due to the van der Waals forces,
electrostatic, magnetic forces, sintering bonds and complex configuration
[9-11]. The pigment aggregates and agglomerates, with sizes that can reach up
to several hundred nanometers, or even a dozen or dozens of micrometers in
diameter. This will impact the performance of such materials,
including their mechanical properties, surface properties,
weather fastness, storage stability, color, and so on [11, 12]. Hence, it is very important to
break down the aggregates or agglomerates of minute
scale pigments in media during the material fabrication process; that is to
say, we need to improve the dispersibility of minute particle size pigments in
media during the manufacturing process.
To increase the dispersion of minute particle size
pigments, numerous surface treatment methods, mainly physical and chemical
methods, have been studied by many researchers. Physical dispersion methods
usually consist of ultrasonic treatment, stirring, ball-milling etc. [13, 14], while chemical dispersion methods mainly consist of
surfactant surface adsorption [15], surface chemical grafting [16], surface
oxidation [17], etc. Physical dispersion methods, which usually adopt
mechanical methods to disperse the aggregates or agglomerates, are of low cost and thus are suitable for large-scale
production. However, the dispersion rate tends to be low and secondary
agglomeration occurs easily [18]. Therefore, physical methods are usually used
in support of other methods [19]. Chemical dispersion methods are stable, but
cause damage to particle structures and thus environmental pollution [20]. Therefore, preparing stable
dispersions of minute particles in aqueous medium using
low-cost, technically straightforward and environmentally friendly methods is
of great importance and urgently required.
Plasma surface treatment has developed quickly over recent
years due to the rapid reaction time, low cost, absence of organic residue,
environmental friendliness, and ease of functionalizing various functional
groups [21]. Furthermore, many scholars have made progress in the study of the
influence of oxygen plasma surface treatment on the dispersibility of minute
particles [22-25]. Plasma surface treatment is known to be an effective means of improving the dispersibility of minute particles of pigment.
In this study, we investigated plasma-assisted func- tionalization using radio frequency-plasma
enhanced chemical vapor deposition (RF-PECVD), which uses a low pressure
plasma. It can be applied to control the interaction
between plasma and the ambient gas, and to observe the
effect of plasma functionalization on electrospinning. Here, CB and P.R.48:2
pigments were treated with N2 plasma to improve the
extent of pigment dispersion in deionized (DI) water. The change in
particle size was studied to elucidate the influence of N2 plasma on
the dispersibility of the samples. We also attempt to explain the dispersion
mechanism of the N2 plasma treatment in this paper.
Materials
The CB (N220), whose primary particle size and specific
surface area were approximately 20 nm and 120 m2/g, respectively,
used in this experiment was purchased from Sigma-Aldrich (USA). The P.R.48:2
(Azo 2B-Toner (Ca)) pigments, with 5.926 l/kg bulk volume and 59.1 m2/g
specific surface area, used in this experiment were provided by BASF (Germany).
Pretreatment
process
The plasma surface treatment process for minute pigments
(CB and P.R.48:2) was based on RF-PECVD. The
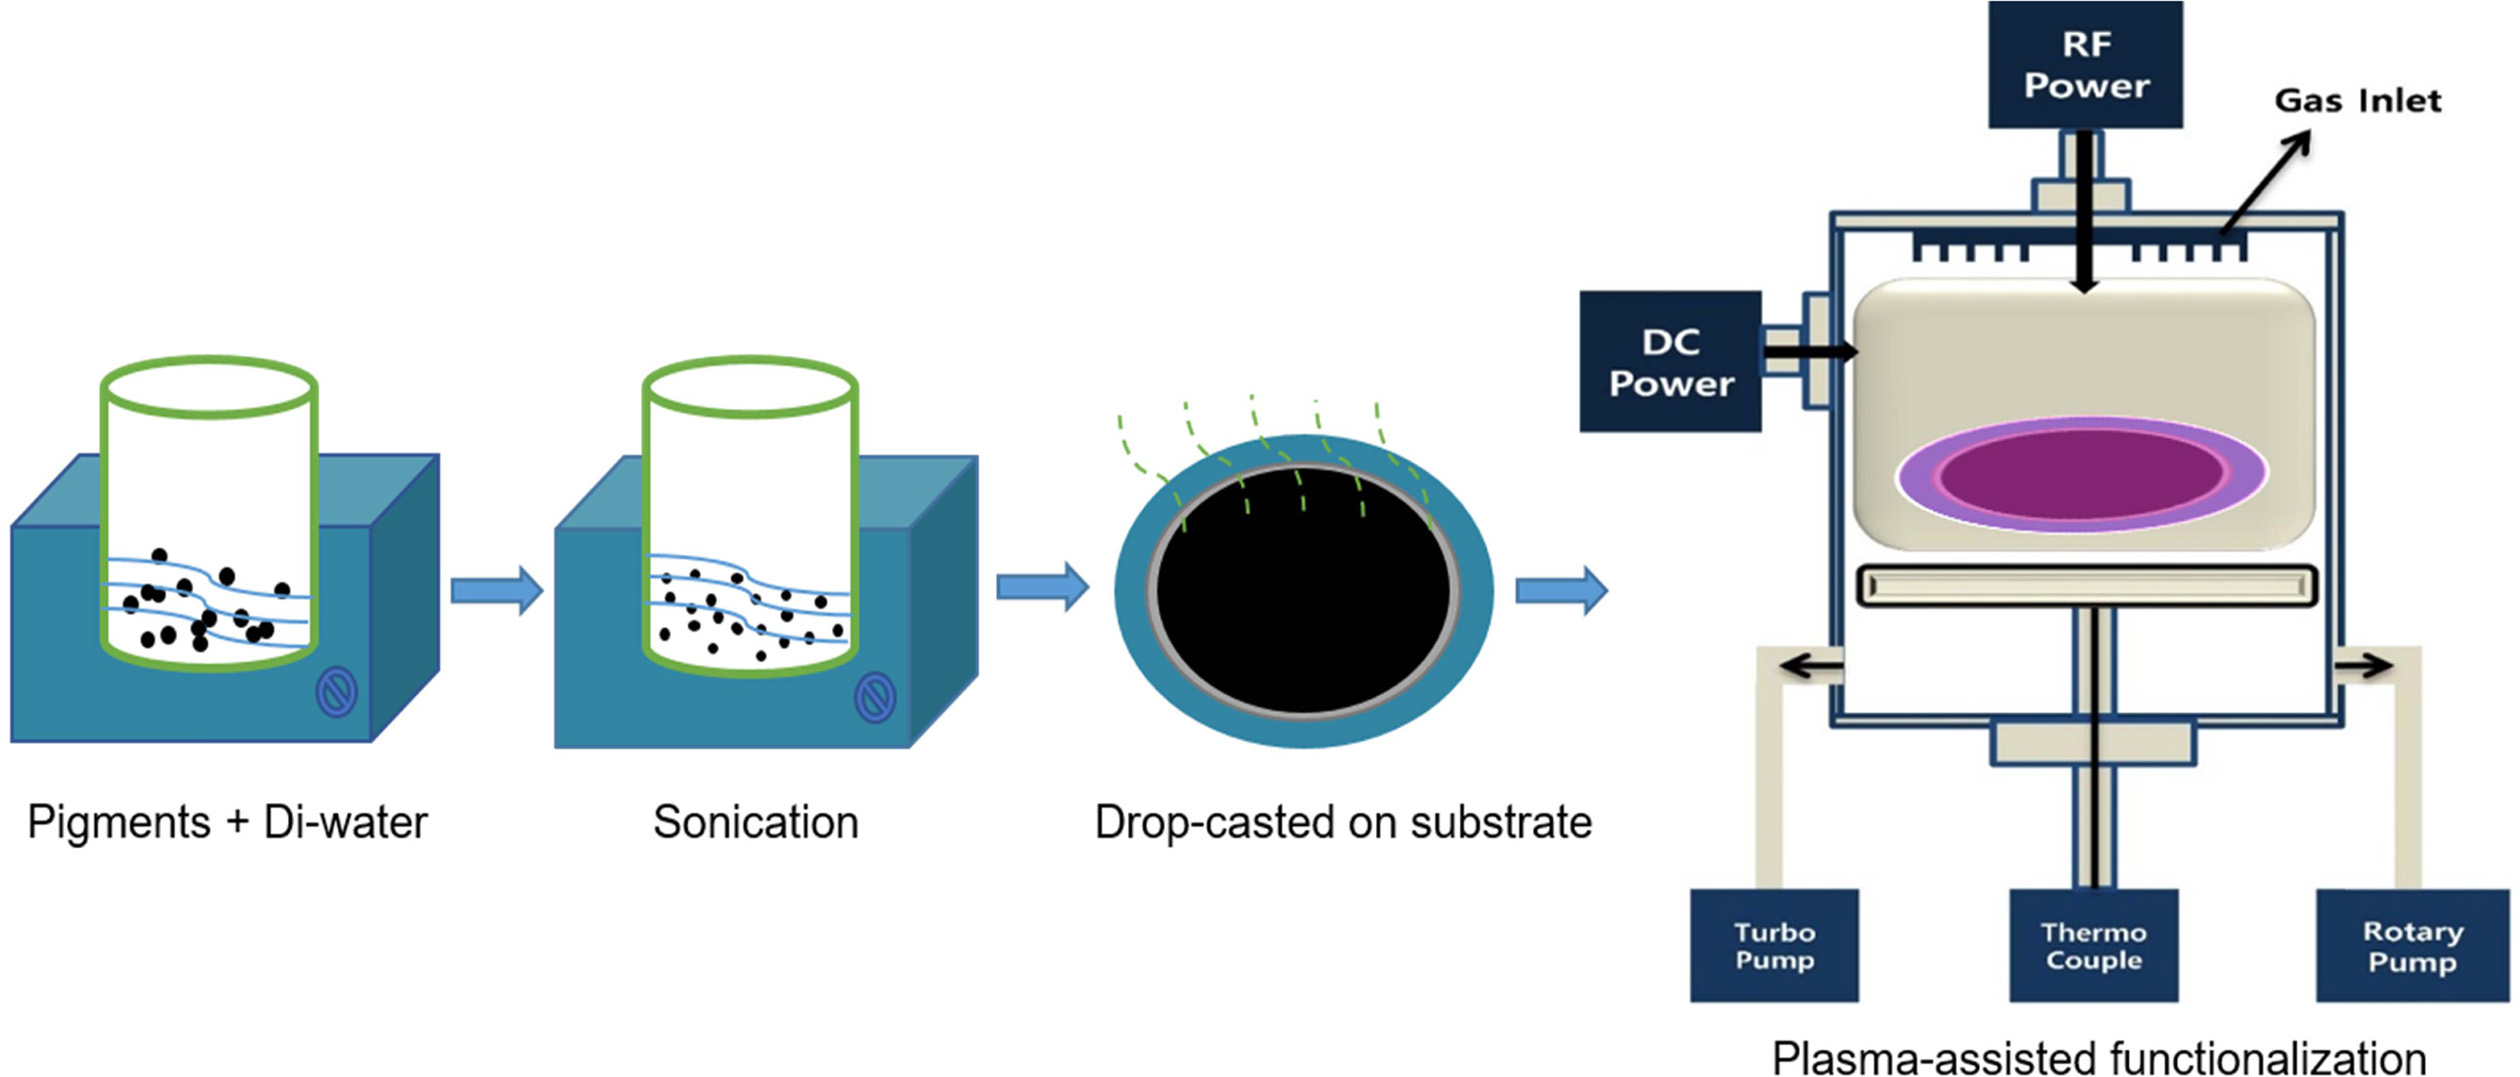
details of the plasma setup are shown in Fig. 1. Initially, the dry powder
cannot be placed directly in the vacuum chamber, because it will float. To
prevent dust pollution and loss of pigments, 10 g of CB or P.R.48:2 powder was
added to 10 ml of DI water, followed by sonication for 90 minutes to make a
well-mixed solution. Then, the muddy solutions were drop-casted
on a stainless-steel disc substrate with a diameter of 10 cm.
The samples were dried for 2 hours under ambient conditions to reduce the
moisture content as much as possible.
Plasma
treatment process
To treat the surfaces of the pigments, samples were placed
on the base of the vacuum chamber of the RF-PECVD system (13.56 MHz), which was
slowly evacuated up to 10-4
Torr. Then, N2 gas (80 sccm) was purged to 10-2
Torr. During the experiments, the samples were exposed
to the plasma, at a power of 300 W for 40 minutes.
Characterization
The morphologies and diameters of the CB and P.R.48:2
pigments were observed by scanning electron microscopy (SEM; S-4800; Hitachi, Japan) at an acceleration voltage of
15 kV. The samples were coated with Pt using an E-1010 ion sputterer (Hitachi)
prior to characterization (20 mA, 10 Pa, 30 s).
Atomic force microscopy (AFM; XE-100; Park Systems, Korea)
was used to investigate the three-dimensional (3D) morphologies and particle
size distributions of CB and P.R.48:2 particles. The scanner was calibrated in
both lateral and vertical directions with a standard grid. Typical measurement
conditions were scan size of 3 μm and scan
rate of 0.48 Hz.
The average particle size distributions of CB and P.R.48:2
pigments in DI water were measured by a laser particle sizer (AS-2012;
AimSizer, China) with an extended submicron size range of 0.04-500 μm.
Fourier-transform infrared
spectroscopy (FT-IR) of CB and P.R.48:2 pigments was carried out using an FT-IR 6300 instrument (JASCO,
Japan) which was operated in transmission mode at room temperature in the range
550-4,000 cm-1.
|
Fig. 1 Schematic of the N2 plasma-assisted functionalization of pigments. |
Fig. 1 shows the effects of the pretreatment and plasma
treatment on the minute pigments (CB and P.R.48:2). To treat the pigments, we
employed N2 plasma with the RF-PECVD system. The pigments with or
without N2 plasma treatment were dispersed in DI water so that we
could study their dispersibility. We initially compared the perceptibility of
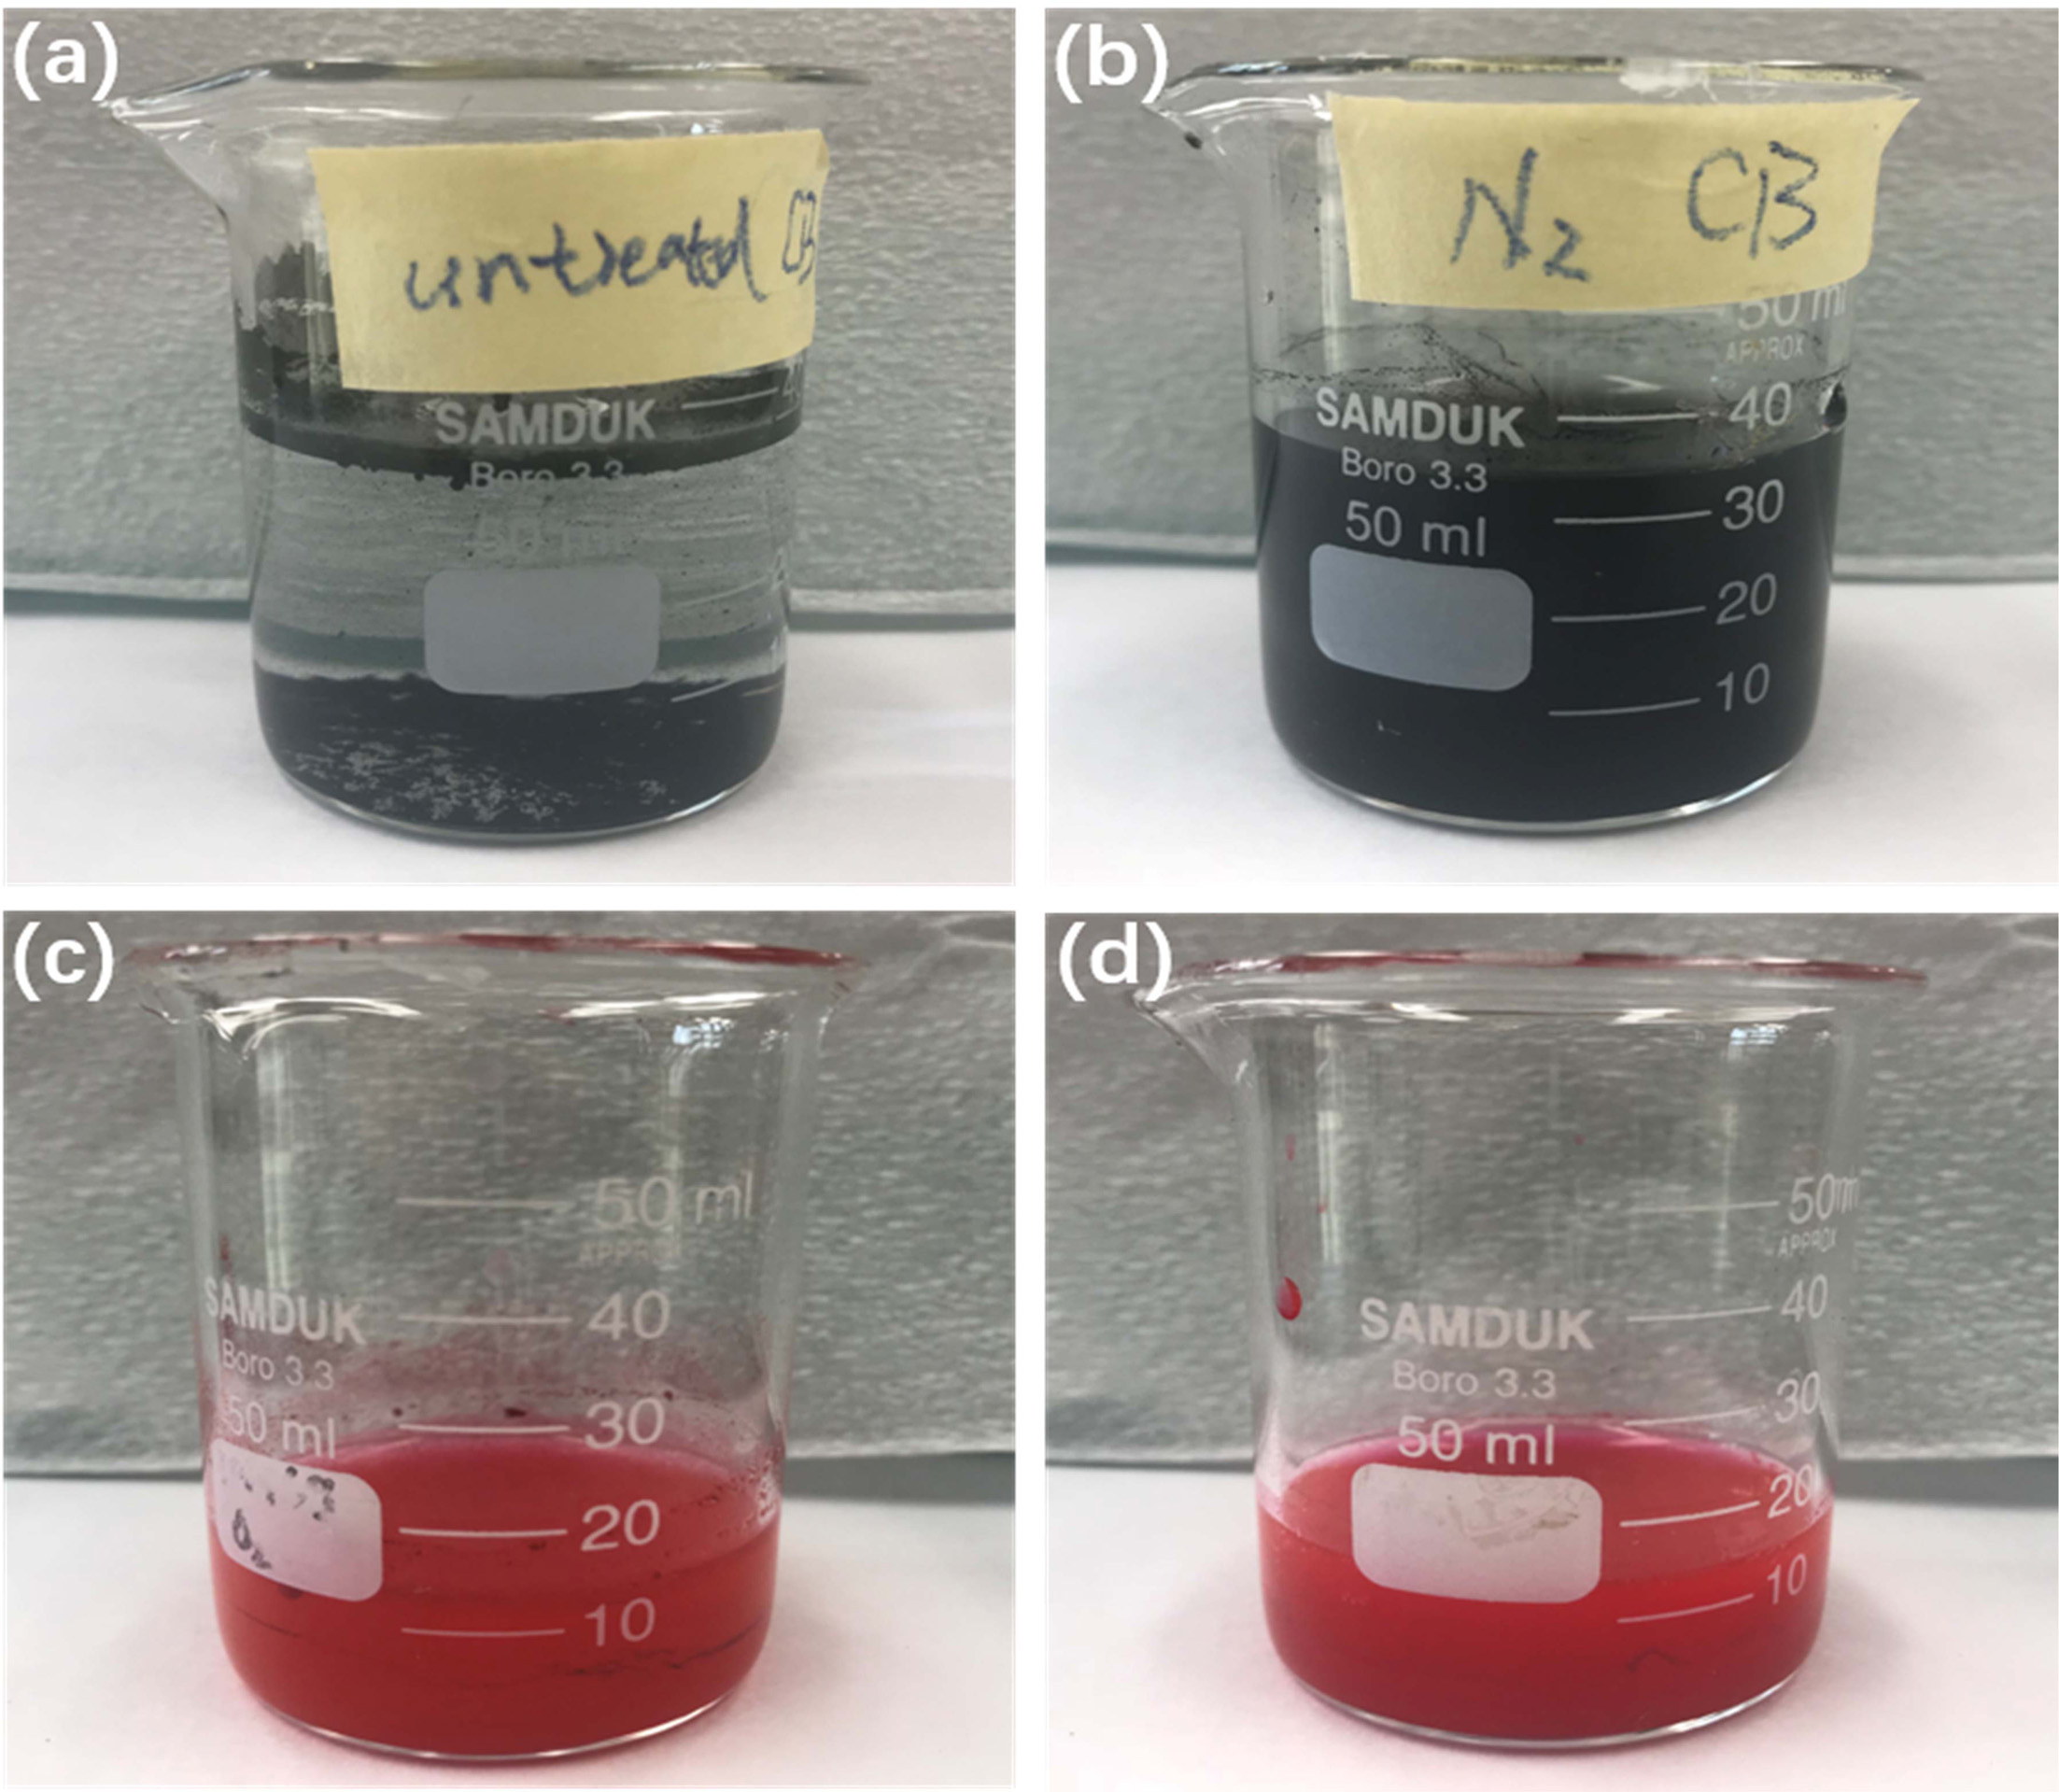
CB (0.0165 g) in DI water (35 ml) and P.R.48:2 (0.012 g) in DI water (15 ml) by
observing ultrasonically vibrated (60 min) pigment solutions that had been left
to stand for a fortnight (Fig. 2). The results clearly showed that, 2 weeks
later, a precipitate formed in untreated CB pigment solution. However, in the
case of the N2 plasma-treated CB pigment solution,
no such precipitate was observable by the naked eye. There was no
obvious precipitate in either the untreated
P.R.48:2 or the N2 plasma-treated P.R.48:2 pigment solution. These differences were compared further in the
experiments described in the following.
Firstly, morphologies and diameters of particles were characterized
by SEM and AFM in order to investigate the
differences in dispersion between untreated and N2 plasma-treated
pigments in DI water. Because the liquid samples cannot be observed directly,
we first processed them by seeding particles on silicon wafers. The
specific approach is as follows: (i) Small pieces of silicon wafer were cleaned
for 5 minutes by ultrasonication in acetone, alcohol, and DI water;
(ii) the cleaned wafers were placed in untreated CB solution
(Fig. 2(a)), N2 plasma-treated CB solution (Fig. 2(b)), untreated P.R.48:2 solution (Fig. 2(c)) and N2 plasma-treated P.R.48:2 solution (Fig. 2(d));
(iii) the solutions were undergone ultrasonic vibration for 30 minutes; (iv)
then the wafers were removed from the solutions and dried in a vacuum drying
oven at 60 oC for
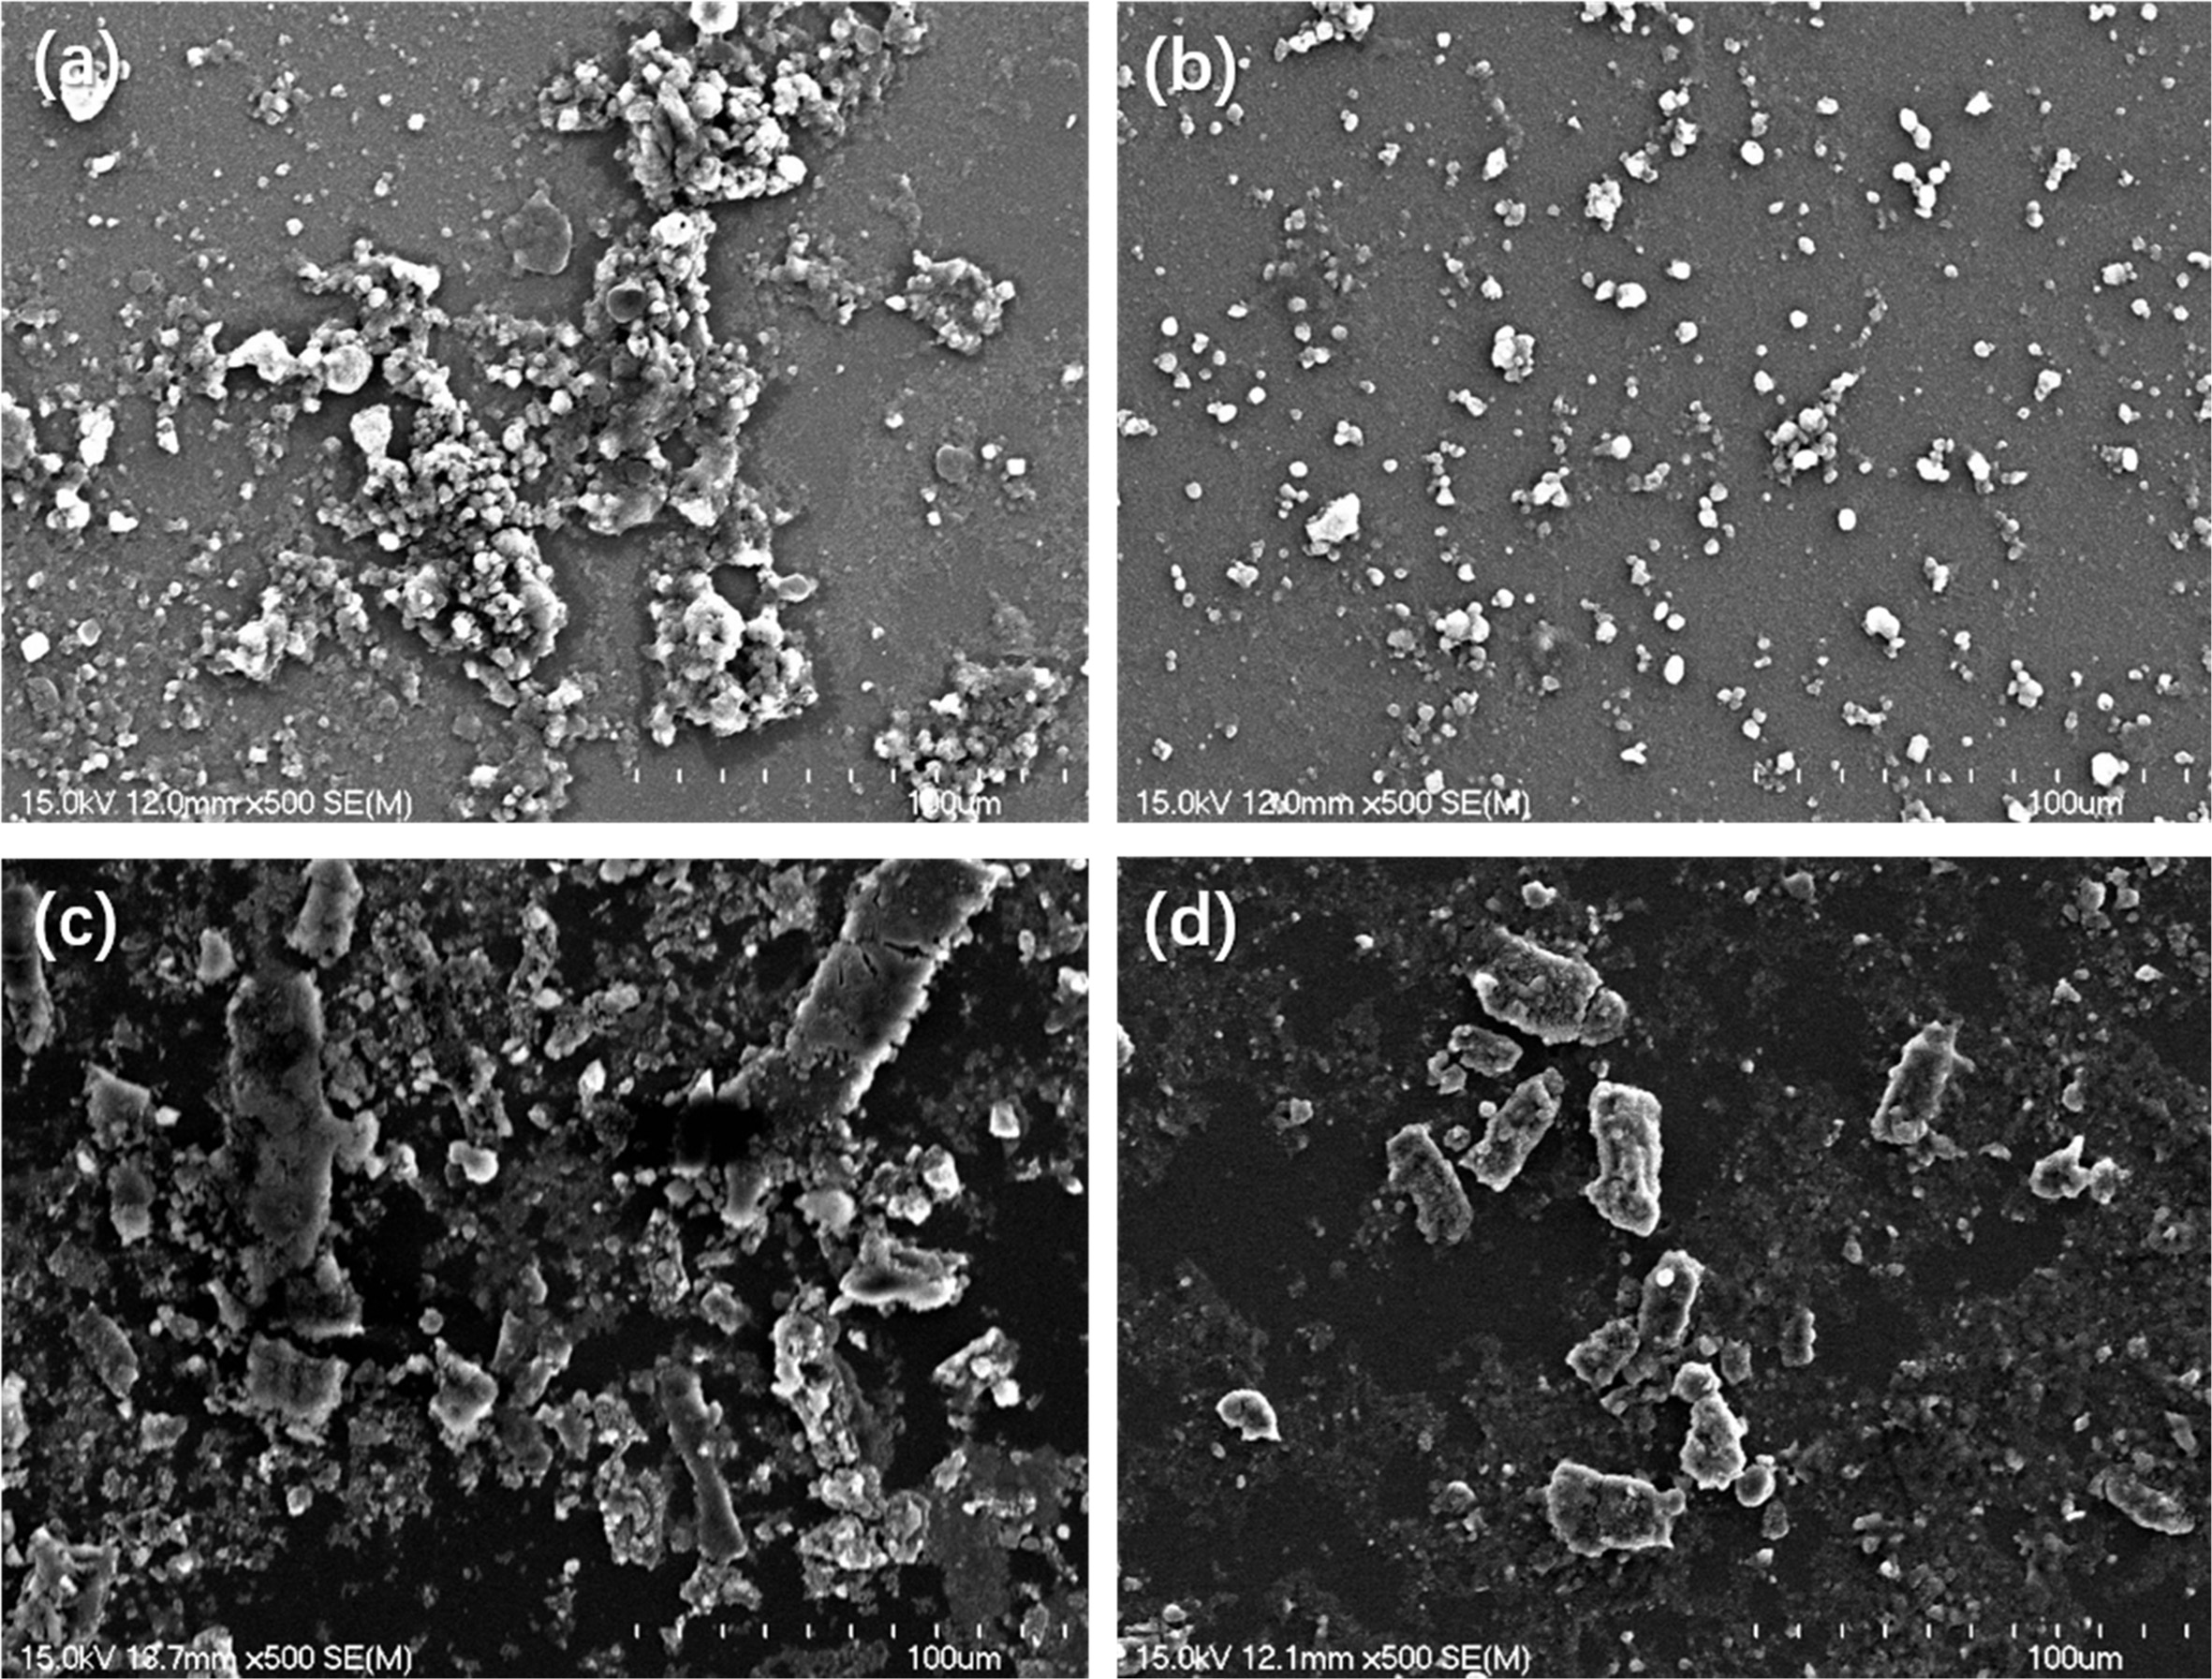
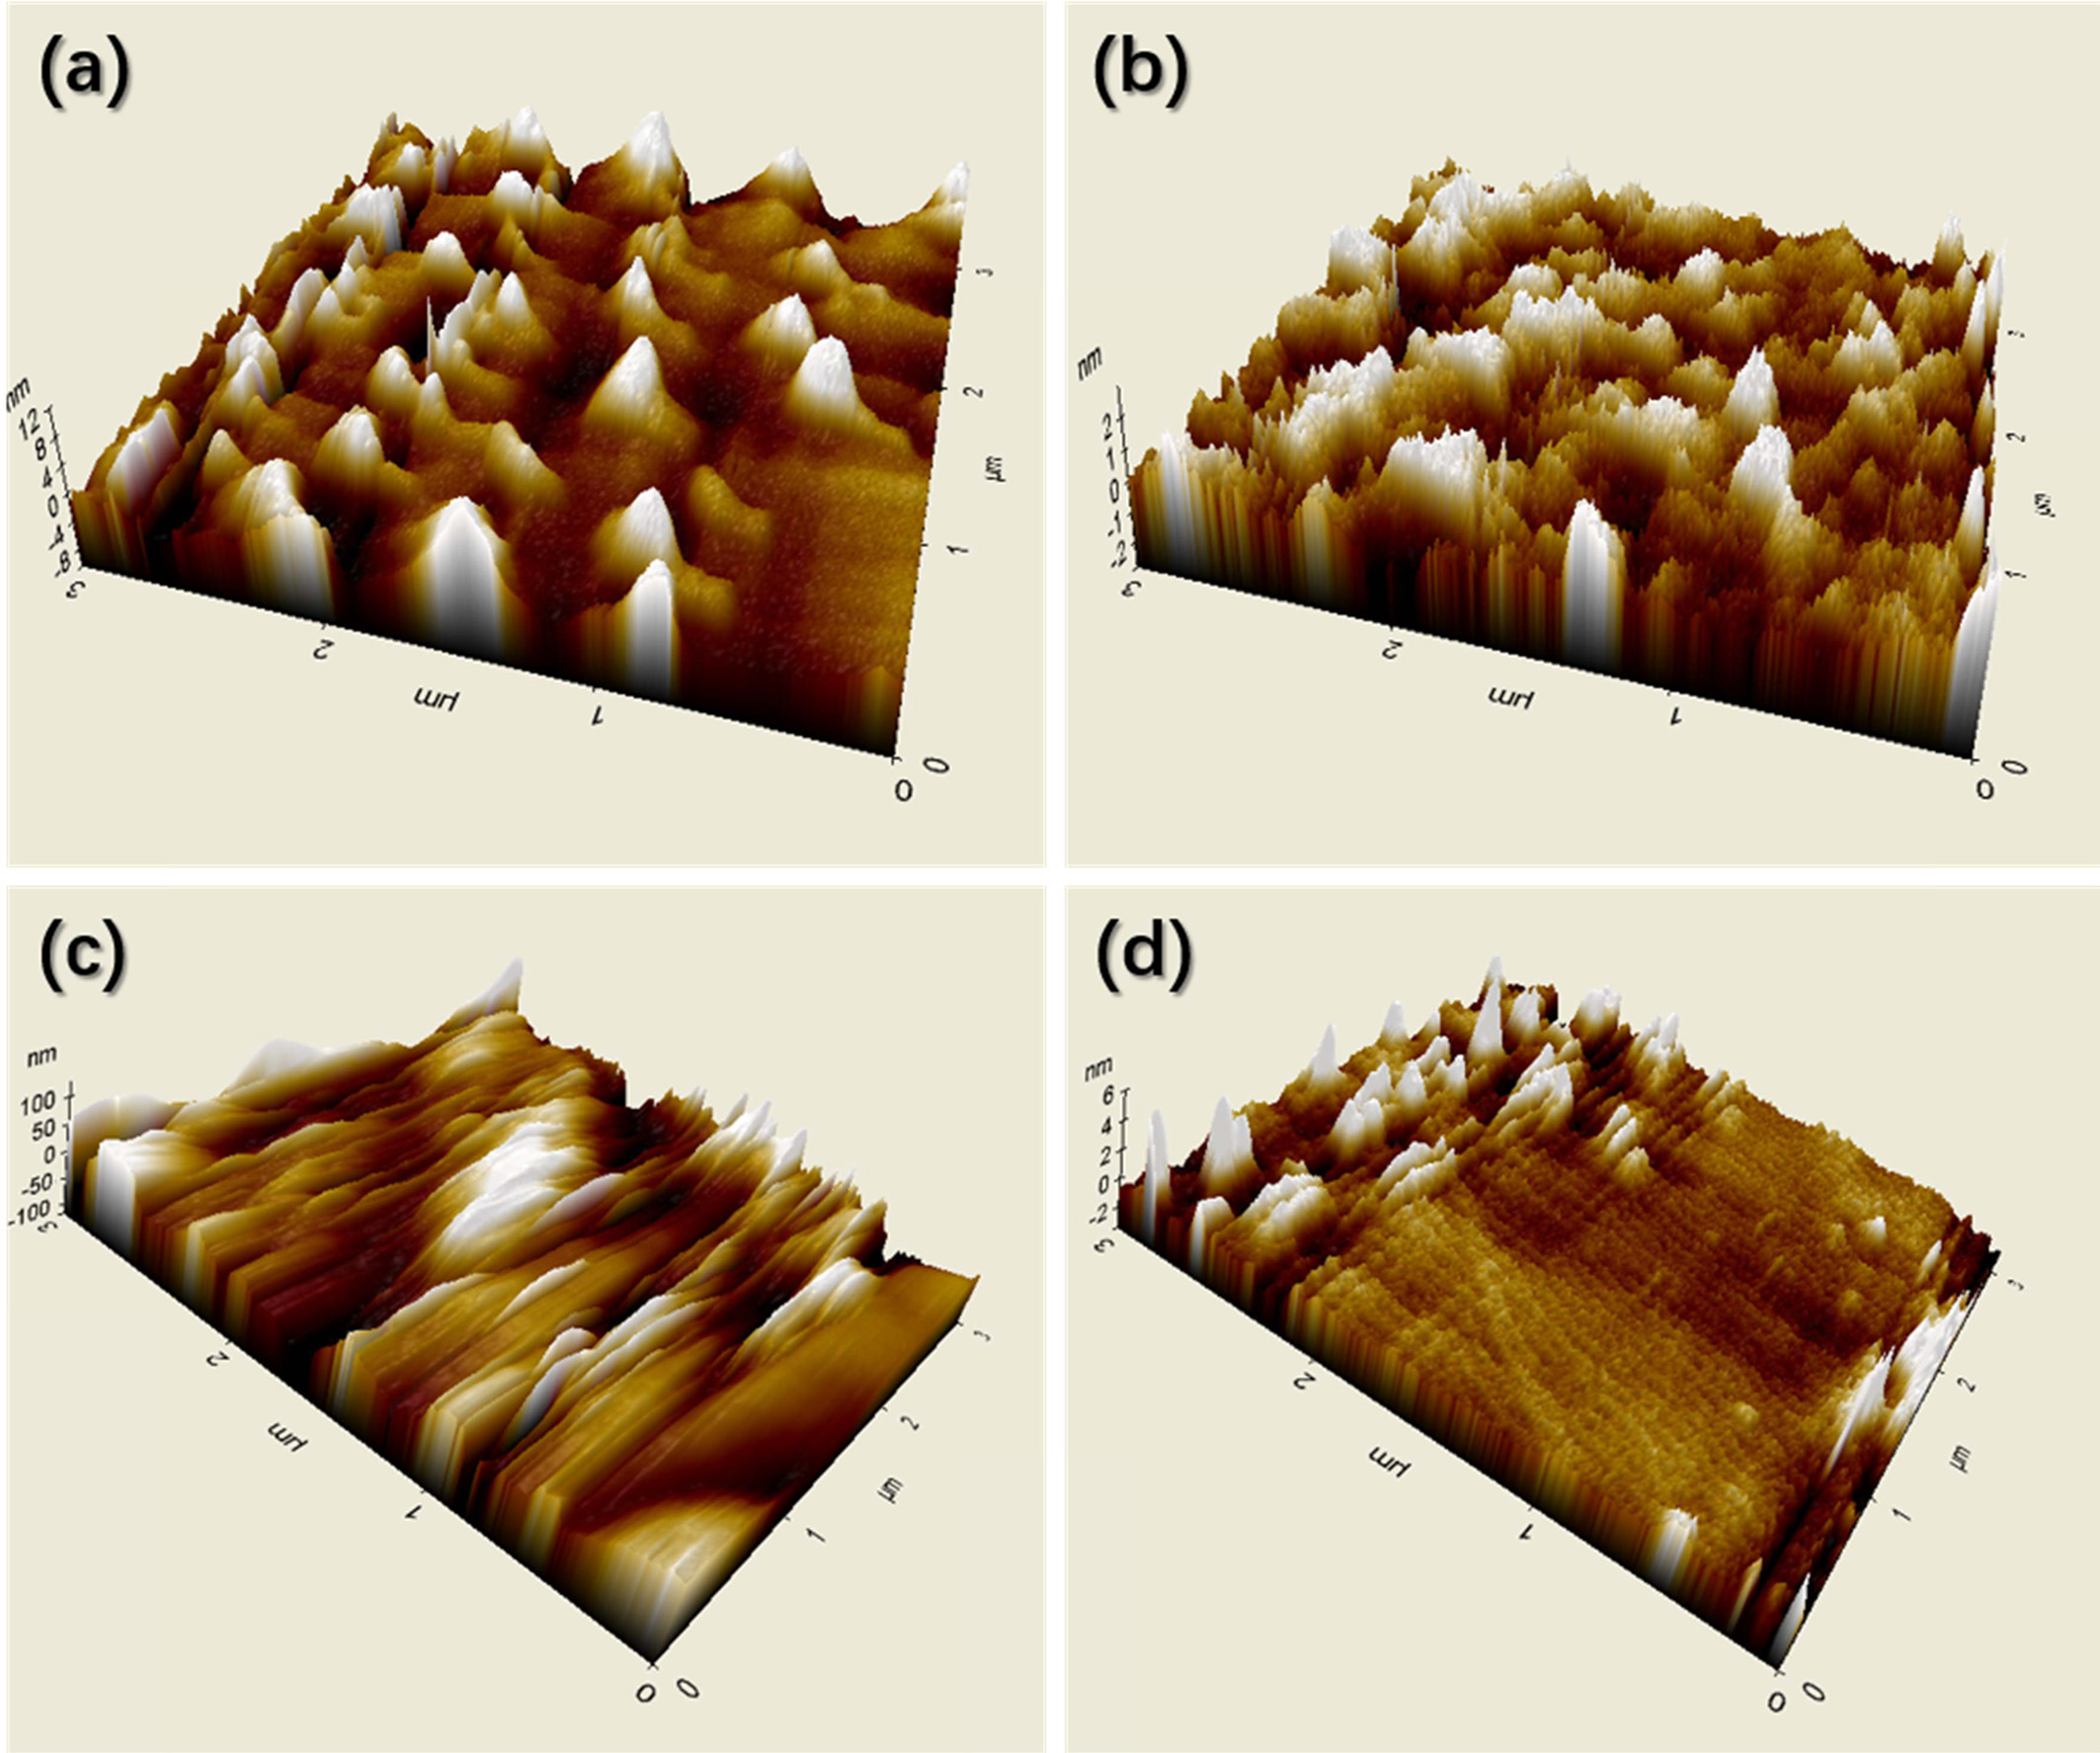
12 hours. The SEM images (Fig. 3) and AFM 3D images (Fig. 4) show the
morphologies of the particles on the wafers. Figs. 3(a) and (b) show SEM images
of untreated CB and N2 plasma-treated CB pigments. The results show
that the N2 plasma treatment was able to break down the
agglomerates, and the particle size of CB pigments was reduced from 100 μmz to
500 nm. Figs. 3(c) and (d) show that N2 plasma treatment can also
help to break down agglomerates of P.R.48:2 particles; the P.R.48:2 particles
were reduced from hundreds of micrometers to 20 μm. This illustrates that N2
plasma treatment is an effective method for improving the
dispersion properties of minute pigments in DI water. Figs. 4(a) to (d) show 3D
images of untreated CB, N2 plasma-treated CB, untreated P.R.48:2,
and N2 plasma-treated P.R.48:2 pigments, respectively. The results
indicated many differences in morphology between the untreated particles and N2
plasma-treated particles. It is obvious that the particle size decreases after
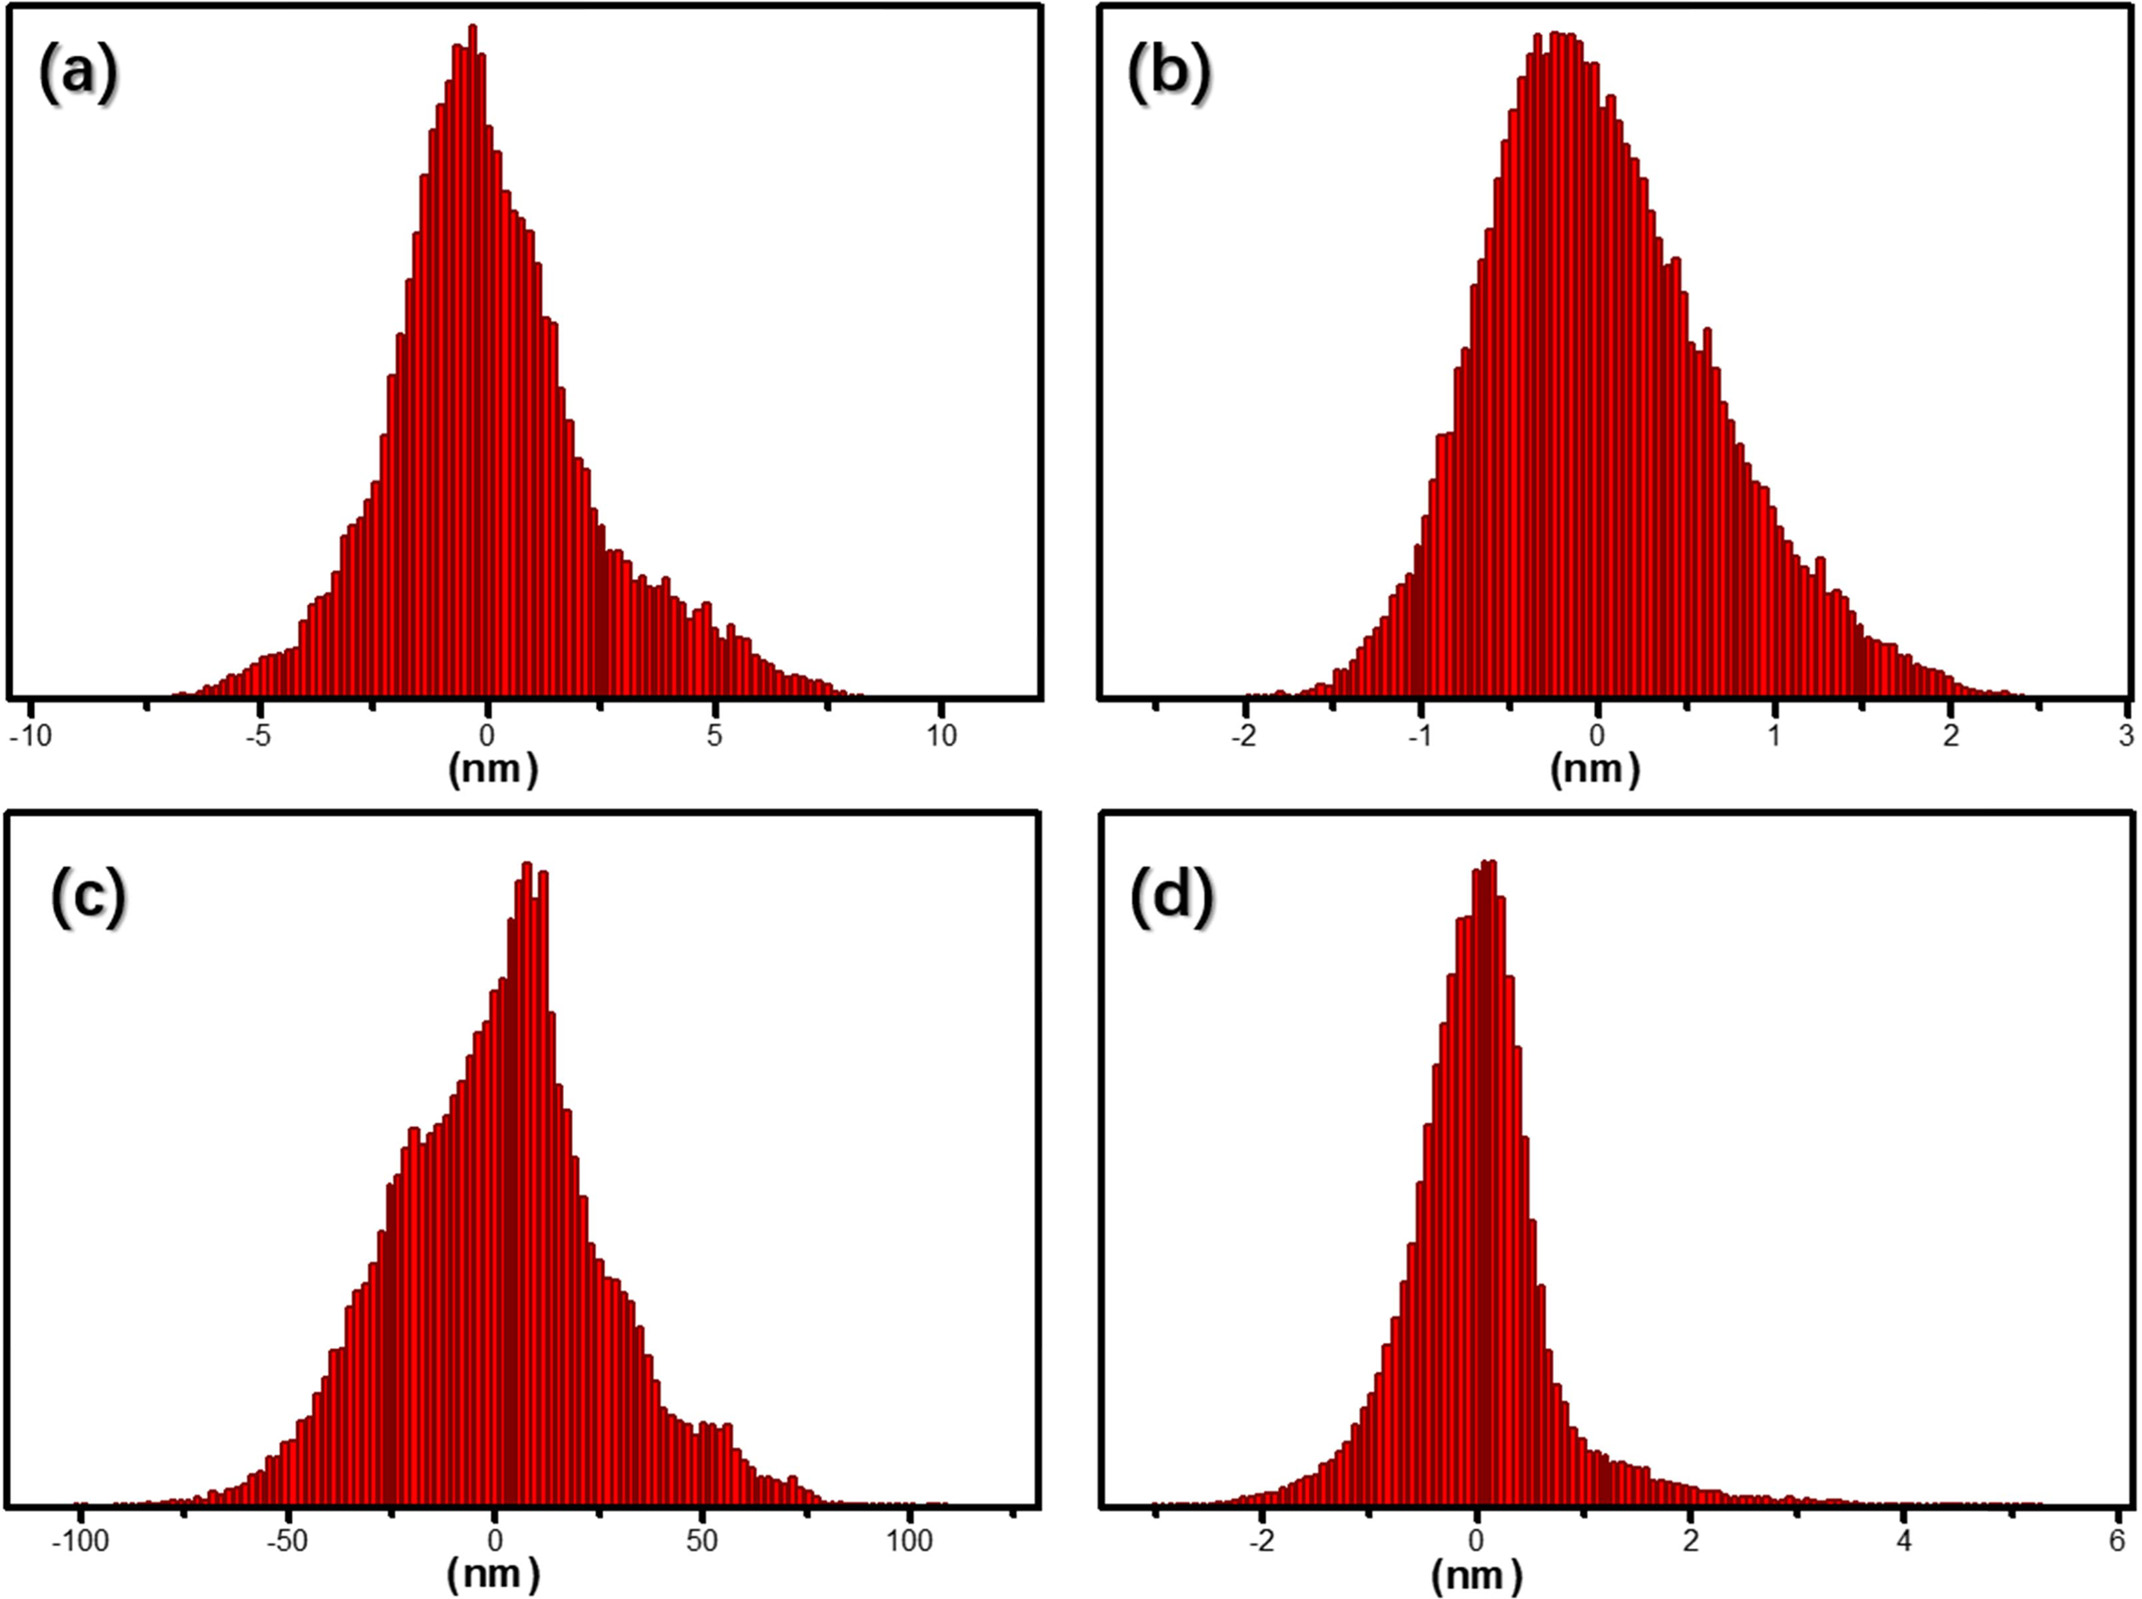
N2 plasma treatment. Fig. 5 shows a region histogram plotted based
on the AFM results. Figs. 5(a) and (b) show the particle size distributions (x
axis direction) of untreated CB and N2 plasma-treated CB pigments,
respectively. Figs. 5(c) and (d) show the particle size distribution (x axis
direction) of untreated P.R.48:2 and N2 plasma-treated P.R.48:2
pigments, respectively. The region histograms show that, after N2
plasma treatment, the particle distributions of both CB and P.R.48:2 pigments
become narrow, and the particle sizes decrease. This further proves that N2
plasma treatment is an effective method for improving the dispersion properties
of minute pigments in DI water.
Secondly,
for additional characterization of the dispersion properties of surface-modified pigments, a particle size
analyzer was used to analyze the size distribution and average particle sizes
of pigments in DI water. Before testing, the same
concentrations of CB ultrasonicated solution and N2 plasma-treated
CB ultrasonicated
solution were diluted 1,000 times. The same concentrations of P.R.48:2 and N2
plasma-treated P.R.48:2 ultrasonicated
solutions were also diluted 1,000 times. The diluted solutions were poured
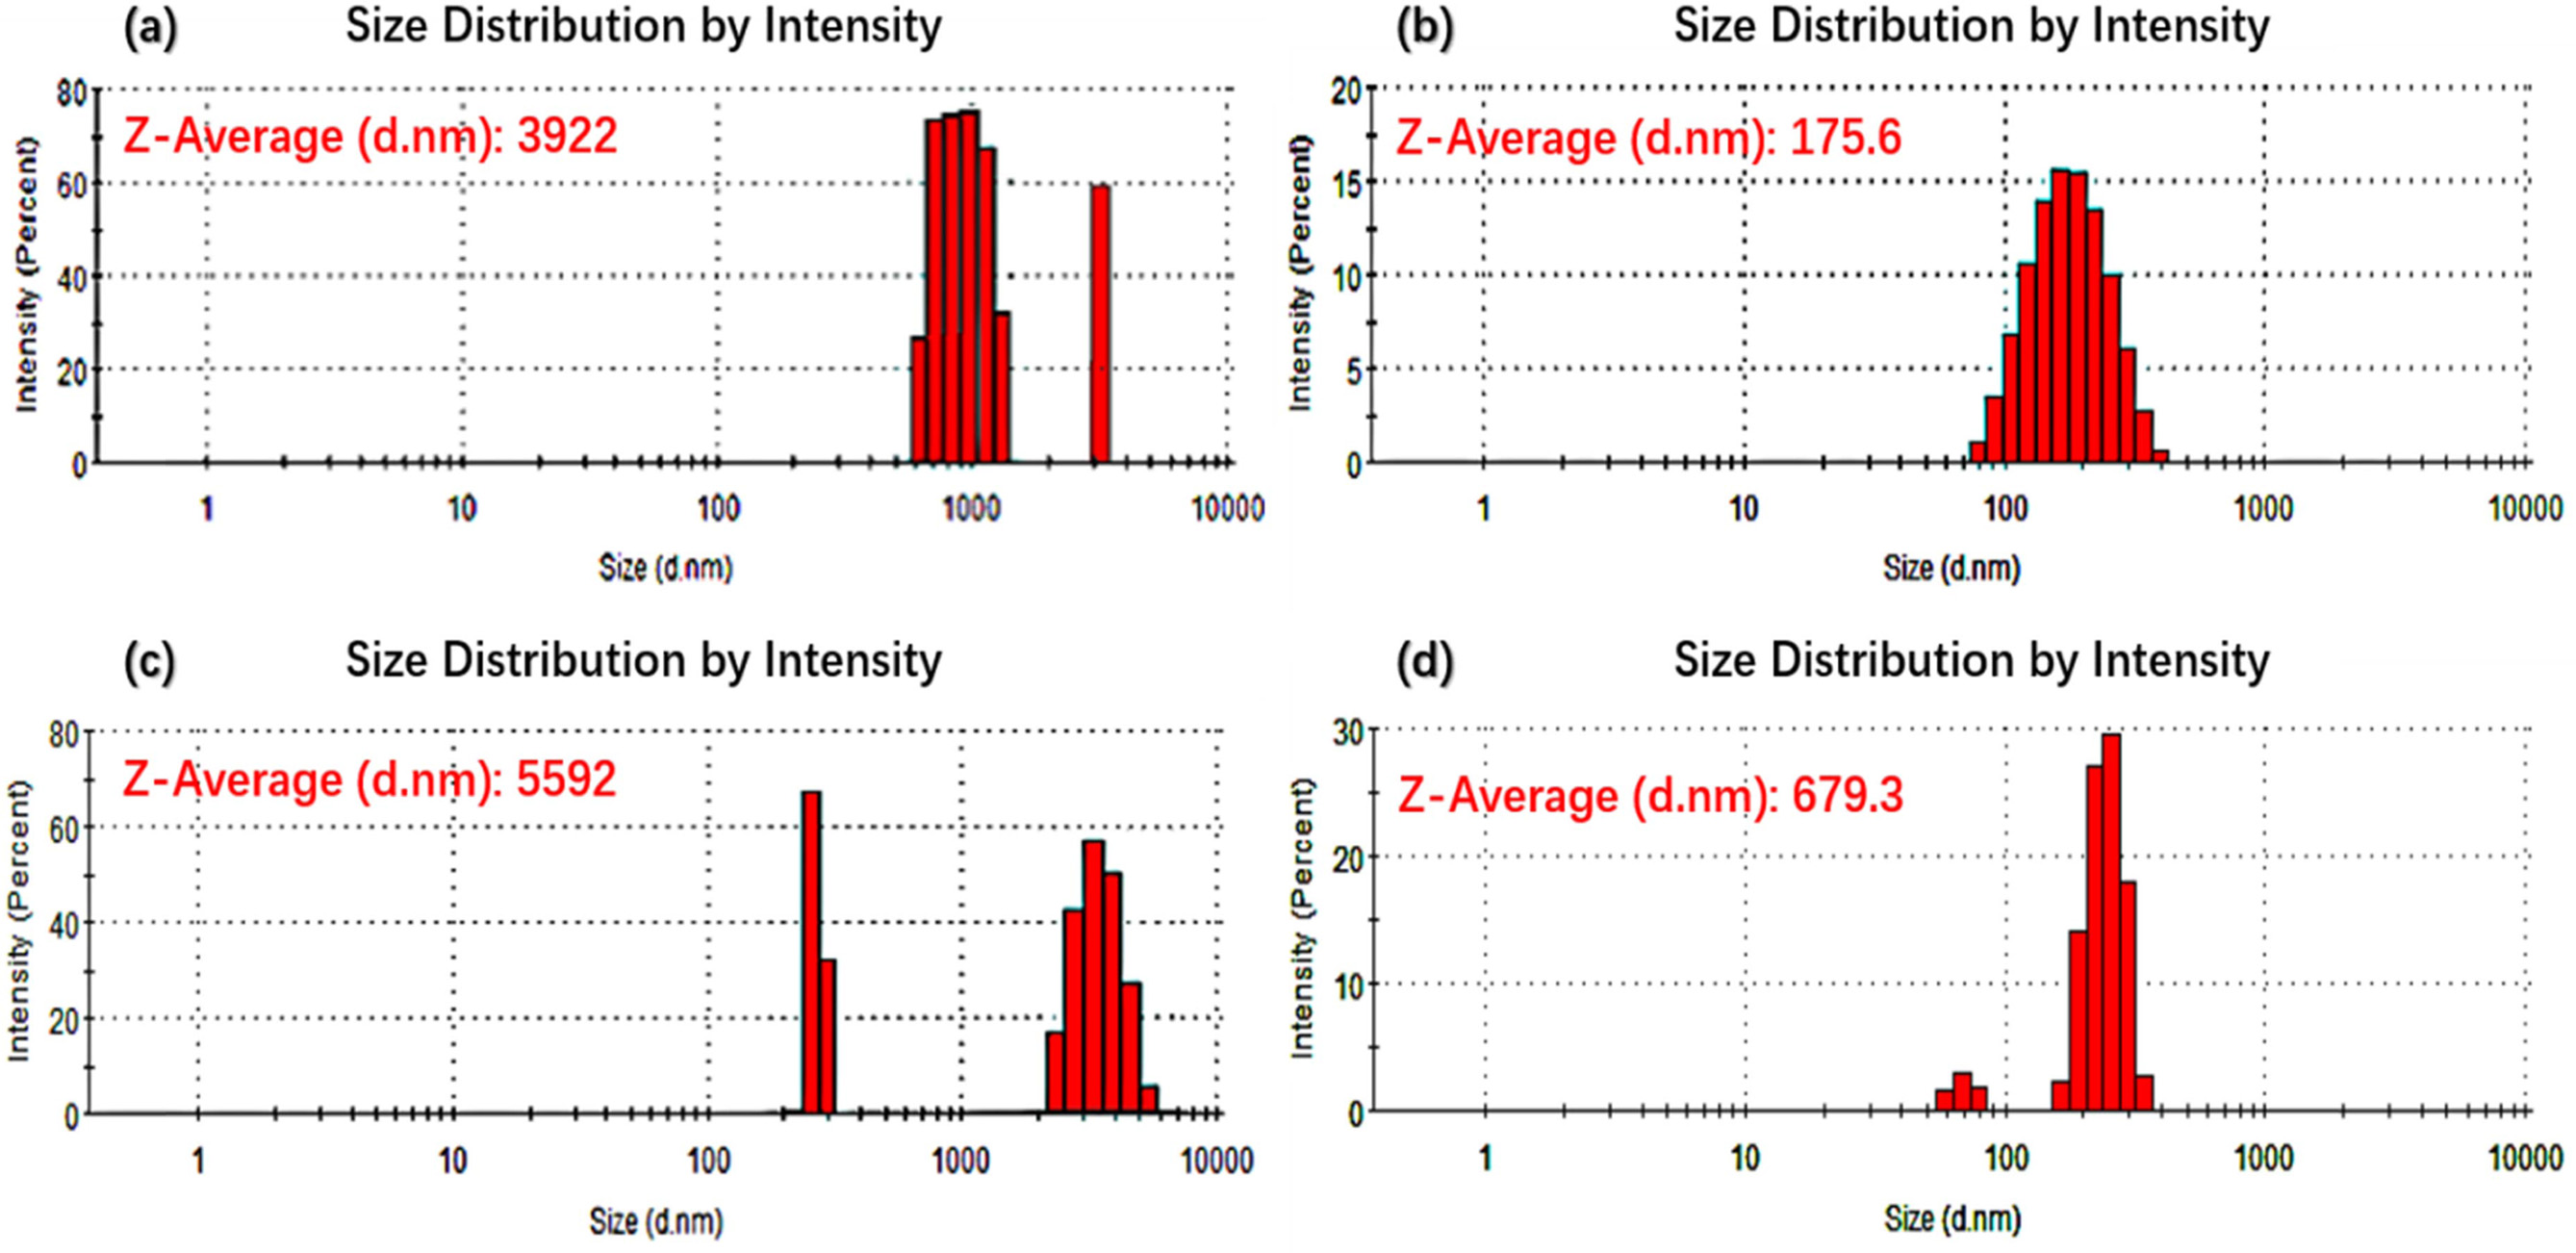
directly into quartz glassware for measurement. Fig. 6 shows the particle size histograms of the CB and P.R.48:2
pigments. The results indicate that, after
N2 plasma treatment, the particle distributions of both CB and
P.R.48:2 pigments narrowed. The average particle size of CB pigments decreased
from 3,922 to 175.6 nm, and that of P.R.48:2 pigments decreased from 5,592 to
679.3 nm. These results are consistent with the SEM and AFM
results. Explanation for particle size reduction for both CB
and P.R.48:2 pigments are different. For CB, improvement of London dispersive
component of the surface free energy and surface functional groups after
plasma treatment result in particle size is decreased and
dispersibility in DI water is increased, respectively [26]. For P.R.48:2,
polymer chain cleavage and/or cross-linking reactions are expected during
plasma treatment [27]. Although such reactions cannot be documented in
aforementioned analyses, data pointed out that exposure of plasma treatment of
all the samples yield cleavage reactions rather than cross-linking, which
result in smaller particle size.
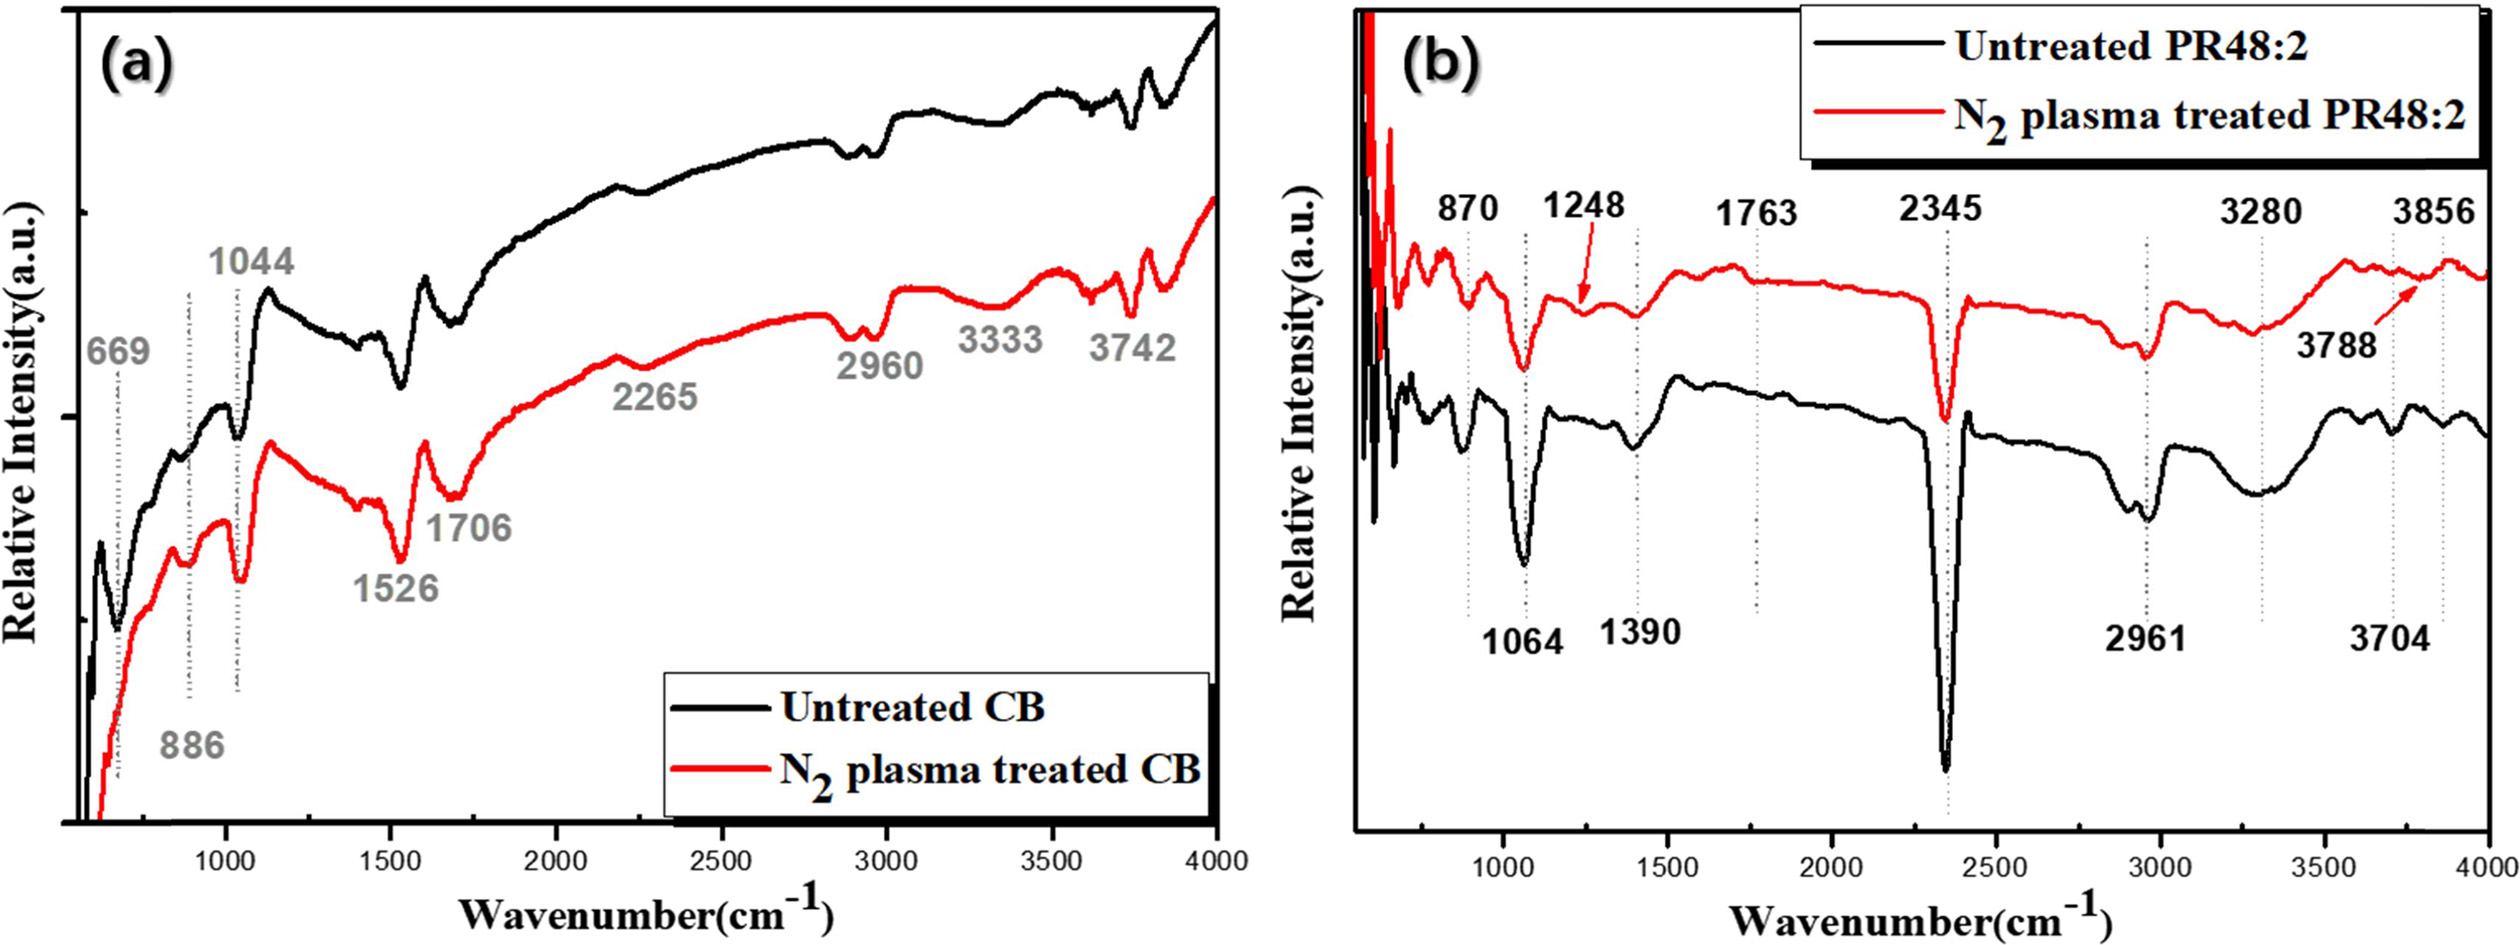
Thirdly, FT-IR characterization was performed to investigate
the types and extent of changes in functional groups on
the surfaces of the particles after N2 plasma treatment, and the
results are shown in Fig. 7. By comparing the changes in the peaks of the CB
particles after N2 plasma treatment (Fig. 7(a)), we investigated the
effect of N2 plasma treatment on CB pigments. We can
see from Fig. 7(a) that peaks at 1,526, 1,706, 2,890, 2,960, 3,333,
3,619, 3,742, and 3,835 cm-1 are
present in all samples, without obvious differences. These are assigned to
carboxyl C or aromatic C, ketone, C-H asymmetric stretch, methylene band,
hydroxyl group, non-bonded hydroxyl group, and broad water band, respectively
[28-30]. However, the peak of untreated CB pigments at 669 cm-1,
which can be linked to a specific vibration as the stretching between carbon
and hydrogen (out-of-plane C-H bend) [29], disappeared after N2
plasma treatment. Furthermore, the peaks at 886 cm-1
(hydrogen-bonded O-H out-of-plane bending) [29] and 1,044 cm-1
(C-O stretching) [31] increased after N2 plasma treatment. This
suggests that out-of-plane C-H bonds of CB were broken by the N2
plasma treatment, where these broken bonds would generate oxygen-containing
groups, such as O-H and C-O groups, in the atmosphere [32]. We also compared the FT-IR curves of untreated
P.R.48:2 and N2 plasma-treated P.R.48:2 particles. The FT-IR spectra of untreated P.R.48:2 pigments contained prominent peaks at 762, 870,
1,064, 1,390, 1,588, 2,345, 2,898, 2,961,
3,280, 3,613, 3,704, and 3,856 cm-1,
as shown in Fig. 7(b). The bands at 762 cm-1
and 870 cm-1
are due to aromatic C-H and epoxy ring vibration. The C-O stretching of
alkyl-substituted ether and C-N stretching appears at 1,064 cm-1.
The carboxylate stretching is situated at 1,390 cm-1. The bending at 1,588 cm-1
corresponds to open-chain azo vibration. The peak at 2,345 cm-1
corresponds to nitrile group stretching. The P.R.48:2 spectra also show absorption bands derived from the C-H stretching vibration in
CHx functional groups, at approximately
2,898 and 2,961 cm-1.
The peaks from 3,280 to 3,856 cm-1
correspond to hydroxyl stretching
[29, 33]. However, after N2 plasma treatment, all the
characteristic peaks of the original P.R.48:2
decreased and new peaks appeared at 1,248 cm-1
(aryl-O stretch) and 1,763 cm-1 (open-chain
acid anhydride). Furthermore, the hydroxyl bending at 3,613 and 3,704 cm-1
shifted to 3,788 cm-1
[29]. We believe that this is because the N2 plasma treatment
affected the bond vibrations of P.R.48:2,
and oxygen-containing groups (aryl-O stretching, open-chain
acid anhydride and hydroxyl)
were generated on the surfaces of the P.R.48:2 particles.
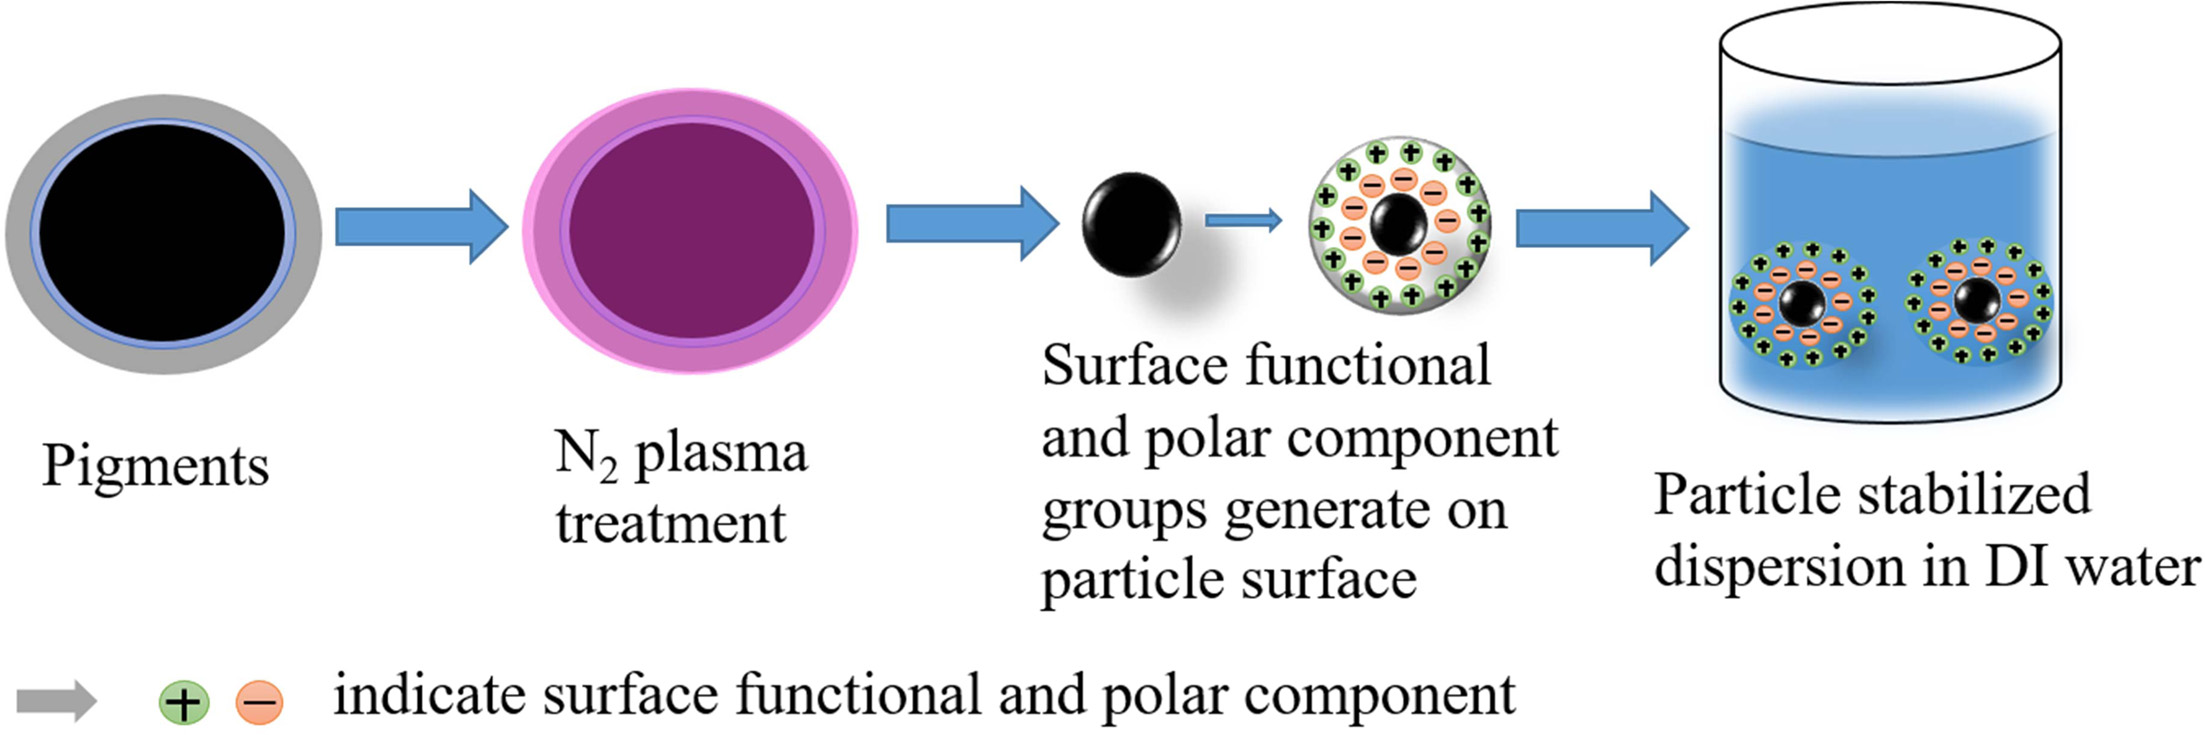
Lastly, based on the results of our FT-IR analysis and
other studies, we propose a mechanism as shown in Fig. 8, in which N2
plasma treatment may affect the dispersion of minute pigments in DI water. N2
plasma treatment is expected to improve both the stable micro- structure and surface
functional groups of nanostructured particle surfaces, which are
correlated with the London dispersive component and the specific (or polar)
component including electron acceptors and donors of the surface free energy,
respectively [26]. These will help to decrease the sizes of the particles and
increase their wettability [34, 35]. As a result, improve the particle
dispersion, prevent the particles agglomeration, and remain stabilized in DI
water [36].
|
Fig. 2 Solutions of (a) untreated CB, (b) N2 plasma-treated CB, (c) untreated P.R.48:2, and (c) N2 plasma-treated P.R.48:2 respectively. |
|
Fig. 3 Scanning electron microscopy (SEM) images of carbon black (CB) pigments (a) without and (b) with N2 plasma treatment, and P.R.48:2 pigments (c) without and (d) with N2 plasma treatment. |
|
Fig. 4 Atomic force microscopy (AFM) images of CB pigments (a) without and (b) with N2 plasma treatment, and P.R.48:2 pigments (c) without and (d) with N2 plasma treatment. |
|
Fig. 5 The AFM particle size distribution of CB pigments (a) without and (b) with N2 plasma treatment, and P.R.48:2 pigments (c) without and (d) with N2 plasma treatment. |
|
Fig. 6 Particle size histogram of CB pigments (a) without and (b) with N2 plasma treatment, and P.R.48:2 pigments (c) without and (d) with N2 plasma treatment. |
|
Fig. 7 Fourier transform-infrared (FT-IR) spectra of PVDF-HFP, CBs/PVDF-HFP, CBs-O2/PVDF-HFP, and CBs-N2/PVDF-HFP electrospun composite fiber films, and CBs, CBs- O2, and CBs- N2 powders. |
|
Fig. 8 The mechanism of the N2 plasma-assisted functionalized pigment dispersion process in deionized (DI) water. |
In summary, we investigated the effects of N2
plasma treatment on the dispersion properties of pigments with minute particle
sizes (CB and P.R.48:2) in DI water. To study the dispersion properties of CB
and P.R.48:2 pigments, we carried out many types of analysis, such as SEM, AFM, particle size tests, and FT-IR.
Based on all of our analytical results, we
reached the following conclusions: 1. The SEM, AFM, and particle
size test results showed that N2 plasma treatment effectively
reduces the particle sizes of the minute pigments, and narrows the particle
size distribution of both CB and P.R.48:2 pigments; 2. The FT-IR analysis
helped us to characterize the functional groups on the surfaces of pigment
particles after N2 plasma treatment, and the results suggest that
the number of functional groups on the surfaces of the pigment particles
increased; 3. Based on our analysis
results, and intensive research, we proposed a mechanism by which
the N2 plasma treatment may affect the dispersion of minute pigments
in DI water; namely, N2 plasma treatment may provide functional
groups, including a London dispersive component and a specific (or polar)
component, with electron acceptor and electron donors, respectively, of the surface
free energy. This helps to decrease the particle size and increases their
wettability. Therefore, after N2 plasma treatment, the particle
sizes of the pigments decreased and dispersed steadily in DI water.
This research was financially supported by the Ministry of
Small and Medium-sized Enterprises (SMEs) and Startups (MSS), Korea, under the
“Regional Enterprise Open-Innovative Voucher Program (R&D, P0010845)”
supervised by the Korea Institute for Advancement of Technology (KIAT). JJZ and
YMP are co-first authors and contributed equally.
- 1. W.B. Wiegand and J.W. Synder, Ind. Eng. Chem., 26[4] (1934) 413-419.
-

- 2. W. Herbst, K. Hunger, and G. Wilker, Industrial organic pigments : production, properties, applications. Wiley-VCH, 2004.
-

- 3. J.V. Koleske, Ed., Paint and Coating Testing Manual: 15th. Edition of the Gardner-Sward Handbook. 100 Barr Harbor Drive, PO Box C700, West Conshohocken, PA 19428-2959: ASTM International, 2012.
-

- 4. J. Bieleman, Ed., Additives for coatings. Wiley-VCH, 2000.
-

- 5. N. Steiert and K. Landfester, Macromol. Mater. Eng., 292 [10-11] (2007) 1111-1125.
-

- 6. Y. Zhang, S. Ge, B. Tang, T. Koga, M.H. Rafailovich, J.C. Sokolov, D.G. Peiffer, Z. Li, A.J. Dias, K.O. McElrath, M.Y. Lin, S.K. Satija, S.G. Urquhart, H. Ade, and D. Nguyen, Macromolecules, 34[20] (2001) 7056-7065.
-

- 7. T. Whelan, Polymer Technology Dictionary. Dordrecht: Springer Netherlands, 1994.
-

- 8. C. Sauter, M.A. Emin, H.P. Schuchmann, and S. Tavman, Ultrason. Sonochem. 15[4] (2008) 517-523.
-

- 9. H. Barthel, L. Rsch, and J. Weis, “Fumed Silica - Production, Properties, and Applications,” in Organosilicon Chemistry II, Weinheim, Germany: Wiley-VCH Verlag GmbH, 1995, pp. 761-778.
-

- 10. S. Tsantilis and S.E. Pratsinis, Langmuir 20[14] (2004) 5933-5939.
-

- 11. Wiley, Processing and Finishing of Polymeric Materials. John Wiley & Sons, 2012.
- 12. S.-H. Fu and K.-J. Fang, J. Dispers. Sci. Technol. 29[1] (2008) 115-119.
-

- 13. K. Oh-Ishi and T.R. McNelley, Metall. Mater. Trans. A 35[9] (2004) 2951-2961.
-

- 14. M. Yu et al., Electrochem. Commun. 34 (2013) 312-315.
- 15. Y. Lin, T.W. Smith, and P. Alexandridis, Langmuir 18[16] (2002) 6147-6158.
-

- 16. N. Tsubokawa, Prog. Polym. Sci. 17[3] (1992) 417-470.
-

- 17. P.E. Fanning and M.A. Vannice, Carbon N. Y. 31[5] (1993) 721-730.
-

- 18. M. Naitō, T. Yokoyama, K. Hosokawa, and K. Nogi, Nanoparticle Technology Handbook, 3rd ed. Elsevier, 2018.
- 19. A. Liang, X. Jiang, X. Hong, Y. Jiang, Z. Shao, and D. Zhu, Coatings 8[1] (2018) 33.
-

- 20. A.M. Wintermyer and E.B. Kinter, Public Roads 28[3] (1954) 55.
- 21. E.M. Liston, L. Martinu, and M.R. Wertheimer, J. Adhes. Sci. Technol. 7[10] (1993) 1091-1127.
-

- 22. S.-J. Park, K.-S. Cho, and S.-K. Ryu, Carbon N. Y. 41[7] (2003) 1437-1442.
-

- 23. I. Arčona, M. Mozetičb, and A. Kodreb, Vacuum 80[1-3] (2005) 178-183.
-

- 24. C.-W. Kan and W.-S. Man, Appl. Sci. 8[4] (2018) 552.
-

- 25. J. Williams, W. Broughton, T. Koukoulas, and S.S. Rahatekar, J. Mater. Sci. 48[3] (2013) 1005-1013.
-

- 26. S.-J. Park and J.-S. Kim, J. Colloid Interface Sci. 244[2] (2001) 336-341.
-

- 27. R.C. Chatelier, X. Xie, T.R. Gengenbach, and H.J. Griesser, Langmuir 11[7] (1995) 2585-2591.
-

- 28. R. Asmatulu and A. Jabbarnia, J. Mater. Sci. Technol. Res. 2[2] (2016) 43-51.
-

- 29. J. Coates, “Interpretation of Infrared Spectra, A Practical Approach,” in Encyclopedia of Analytical Chemistry, Chichester, UK: John Wiley & Sons, Ltd, 2006.
-

- 30. I. Shimada, T. Takahagi, M. Fukuhara, K. Morita, and A. Ishitani, J. Polym. Sci. Part A Polym. Chem. 24[8] (1986) 1989-1995.
-

- 31. J.M. O’Reilly and R.A. Mosher, Carbon N. Y. 21[1] (1983) 47-51.
-

- 32. K. Fatyeyeva, A. Dahi, C. Chappey, D. Langevin, J.-M. Valleton, F. Poncin-Epaillard, and S. Marais, RSC Adv. 4[59] (2014) 31036-31046.
-

- 33. R. Newman, J. Am. Inst. Conserv. 19[1] (1979) 42-62.
-

- 34. F.L. Leite, C.C. Bueno, A.L. Da Róz, E.C. Ziemath, and O.N. Oliveira, Int. J. Mol. Sci. 13[12] (2012) 12773-12856.
-

- 35. I. Yildirim, “Surface Free Energy Characterization of Powders.” Virginia Tech, 04-May-2001.
- 36. Y. Lu, N. Tang, R. Lian, J. Qi, and W. Wu, Int. J. Pharm. 465[1-2] (2014) 25-31.
-

 This Article
-
2019; 20(6): 589-596
Published on Dec 31, 2019
- 10.36410/jcpr.2019.20.6.589
- Received on Jun 13, 2019
- Revised on Sep 5, 2019
- Accepted on Sep 26, 2019
 Services
- Abstract
introduction
experimental method
results and discussion
conclusion
- Acknowledgements
- References
- Full Text PDF
Shared
 Correspondence to
- Tae Gyu Kim
-
Department of Nanomechatronics Engineering, Pusan National University, Busan, Korea
Tel : +82-55-350-5648 Fax: +82-55-350-6547 - E-mail: tgkim@pusan.ac.kr


 Copyright 2019 International Orgranization for Ceramic Processing. All rights reserved.